
Abstract
11C-labeled 3,4-Dihydroxy-phenyl-
Positron emission tomography (PET) and radiolabeled 3,4-Dihydroxy-phenyl-
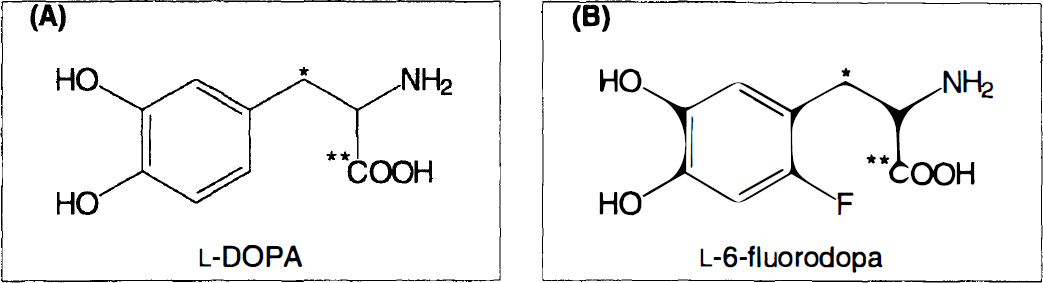
11C-labeled tracer used in the study.
Some earlier comparisons of the two tracers imply a similar distribution and metabolism (Firnau et al., 1986; Firnau et al., 1987). Other studies indicate differences with respect to the affinity for the metabolic enzymes, especially the peripheral formation rate of the major metabolite the corresponding 3-O-methyldopa and the blood-brain clearance of the tracers (Cumming et al., 1995; Cumming et al., 1987; Melega et al., 1990).
The comparisons compose not only possible differences due to the effects of introduction of fluorine into the aromatic ring but methodologic differences as well. The use of different radionuclides, such as 3H compared to 14C, may yield large differences in specific radioactivity, and tritium exchange during the radioanalysis procedure could influence the outcome of the measurements. To evaluate differences and similarities of the
MATERIALS AND METHODS
Animals and drugs
Female rhesus monkeys (Macaca mulatta) 20 to 30 years of age weighing 5 to 11 kg from the Primate Research Laboratory of Uppsala University PET Centre were used after an overnight fast. The monkeys were housed in groups of four to eight animals for at least 4 months before the study. The studies were approved by the Animal Ethics Committee of Uppsala University (permission C03/92, C289/94, and C338/97). Anesthesia was induced with 100 mg intramuscular ketamine (Ketalar, Parke Davis, Morris Plains, NJ, U.S.A.). After transport of the anesthetized monkey to the investigation area of the Uppsala University PET Centre, a venous catheter was inserted into each hind leg of the monkey, one for administration of anesthetic drugs and blood sampling, and the other for administration of the radioactive tracer.
Tracheal intubation was followed by muscle relaxation with 5 mg/kg/h intravenous atracurium (Tracrium, Wellcome, London) and mechanical ventilation with 30% oxygen in air. Anesthesia was maintained with a dose of 8 to 12 mg/kg/h intravenous propofol (Diprivan, ICI). Vital signs including blood pressure, heart and respiratory rate, and body temperature were monitored throughout the investigation. In all studies, recovery from anesthesia was unremarkable.
6R-
The peripherally and centrally active catechol-O-methyl trans ferase inhibitor 3,4-di hydro-4-methyl-5-ni trobenzophenone (tolcapone, Ro 40-7592, Roche, Basel) (Zurcher et al., 1990) was dissolved in equal parts of polyethyleneglycol (Macrogolum 400, Apoteket AB, Gothenburg) and sterile water and given as a bolus dose of 10 mg/kg 15 minutes before injection of the radiotracer.
Radiochemical synthesis
The 11C radionuclide was produced by a 14N (p,α) 11C reaction using the MC17 cyclotron (Scanditronix, Uppsala) at the Uppsala University PET Centre and obtained as [11C]carbon dioxide. The synthesis of
After purification by semipreparative liquid chromatography, the fraction containing 11C-labeled tracer was collected and adjusted to pH 4.5. The final solution was filtered through a 0.22-μm filter. The identity and radiochemical purity of 11C-labeled tracer were confirmed by liquid chromatography and by comparison with authentic reference compounds. The radiochemical purity was always higher than 98%. The specific radioactivity was at least 2 GBq/μmol at the time of injection and the radioactive dose of the tracer injected intravenously to the monkey was in the 90 to 200 MBq range corresponding to 9- to 20-μg tracer.
Positron emission tomography
Studies of brain radioactivity distribution were performed with the monkey positioned with the head in an eight-ring PET (GE 2048-15B Plus, GE 4096-15WB General Electric Medical Systems, Uppsala). Radioactivity concentrations were recorded in 15 transaxial slices 6.8 mm apart and with an inplane resolution of 5 mm (Holte et al., 1989) and 6 mm (Rota Kops et al., 1990), respectively. Fixation was achieved by using plugs attached to the auditory passage of the monkey. The head was adjusted to the detectors of the tomograph with the middle slice parallel to the orbitomeatal line.
In all studies, a series of sequential 11C-labeled tracer injections were made, always separated by at least 120 minutes. The first scan served as the baseline condition for the following scans, in which additional pharmacologic treatments were made. The monkeys remained in the scanner between sequential scans. Scanning began at the start of tracer injection and continued for 60 minutes with time frames of 15×60 seconds and 15×180 seconds. PET images were reconstructed from data collected from each time-frame, corrected for tissue attenuation of 511-Ke V gamma radiation measured with an external 68Ge ring (Ostertag et al., 1989), and filtered with a 4.2-mm Hanning filter.
Realignment of PET scans and definition of region of interests
Summation images were constructed for each scan using data collected 20 to 60 minutes after tracer injection by the use of computer software supplied with the tomograph. A realignment method was used when necessary (>0.5 mm head movement) to prevent movements between scans from causing artifactual increases or decreases in the calculated Ki of the tracer (Anderson, 1995). Briefly, the method is based on using a mask of one reference data set (e.g., baseline) made from voxels with high signal-to-noise ratio in comparison to a sample data set (e.g., perturbation). The result of the comparison is a matrix against which both data sets are resliced. After this procedure, an average image was formed using the summation images from the two realigned data sets. All regions of interest (ROI) were drawn in this averaged summation image. ROI were drawn on visual inspection of the images, and the position of the ROI was compared to a brain atlas made from cryosectioning of a rhesus monkey brain. A circular ROI with diameter of 0.8 cm was used to delineate each striate. Left and right striate values were averaged. The whole set of ROI was then transferred to the two realigned data sets and used in the calculations.
Calculations of PET data
Time-activity curves were generated and used to reconstruct images according to the mathematical background as described previously (Patlak and Blasberg, 1985; Tedroff et al., 1992b). A large region of nondopaminergic brain tissue situated posterior to the corpus striatum (about 8 cm2) was delineated as reference tissue and input function for the reconstruction. This method generates a linear description of the striatal radioactive uptake and the slope, denoted influx rate constant or Ki, was determined by linear regression analysis using weighted least-square analysis from data collected 5 to 60 minutes of normalized time after tracer injection. Each data point was used after correction by a weight factor by the empirical formula for calculation of the standard deviation for a given pixel (Carson et al., 1986). The calculated
Plasma sample preparation and high-performance liquid chromatographic analysis
Venous blood samples were collected at 5, 25, 45, and 50 minutes after tracer injection, and centrifuged at 4000 rpm for 2 minutes. Proteins were precipitated with 45 μl of 5 mol/L perchloric acid in 0.8 mL of plasma. After centrifugation for 3 minutes at 15,000 rpm, the supernatant was filtered through an acetate filter (0.22 μm, Dynagard®, Microgon Inc, U.S.A.) yielding ≈0.5 mL of sample. High performance liquid chromatography analysis of the composition of the 11C-derived radioactivity was performed as described previously with minor modifications (Lindner et al., 1995). Before injection into the chromatographic system a 15 μL standard solution yielding 0.1−0.2 mmol/L of reference compounds was added to the sample. Separation of 11C-labeled tracer and derived labeled metabolites was performed on a C-18 column (Ultracarb ODS20, 3 μm 100×4.6 mm i.d., Phenomex, Scanditec). The composition of the mobile phase was 0.1 mol/L acetate-citrate, 1 mmol/L edetic acid, 5 mmol/L sodium heptanesulphonate, and 12.5% methanol. The pH was 3.7 in the final buffer. The recovery of radioactivity from plasma after protein precipitation was 82 ± 7% and in the chromatographic step 101 ± 8%, n = 26.
Statistical analysis
The paired t-test was used to evaluate induced changes from pharmacologic challenge in comparison to baseline conditions. A one-way analysis of variance with repeated measure was performed to evaluate the striatal Ki value increase after adding the 6R-BH4 infusion to the tolcapone-treated monkeys. Regression-analysis was performed for analysis of significant slope-values of the carboxy-labeled tracer. STATISTIC A for Windows (StatSoft) version 5.0 was used and the level of significance was set to P < .05. All values are represented as mean ± SD.
RESULTS
Baseline studies of l -[β-11C]DOPA and l -6-[β-11C]fluorodopa striatal Ki
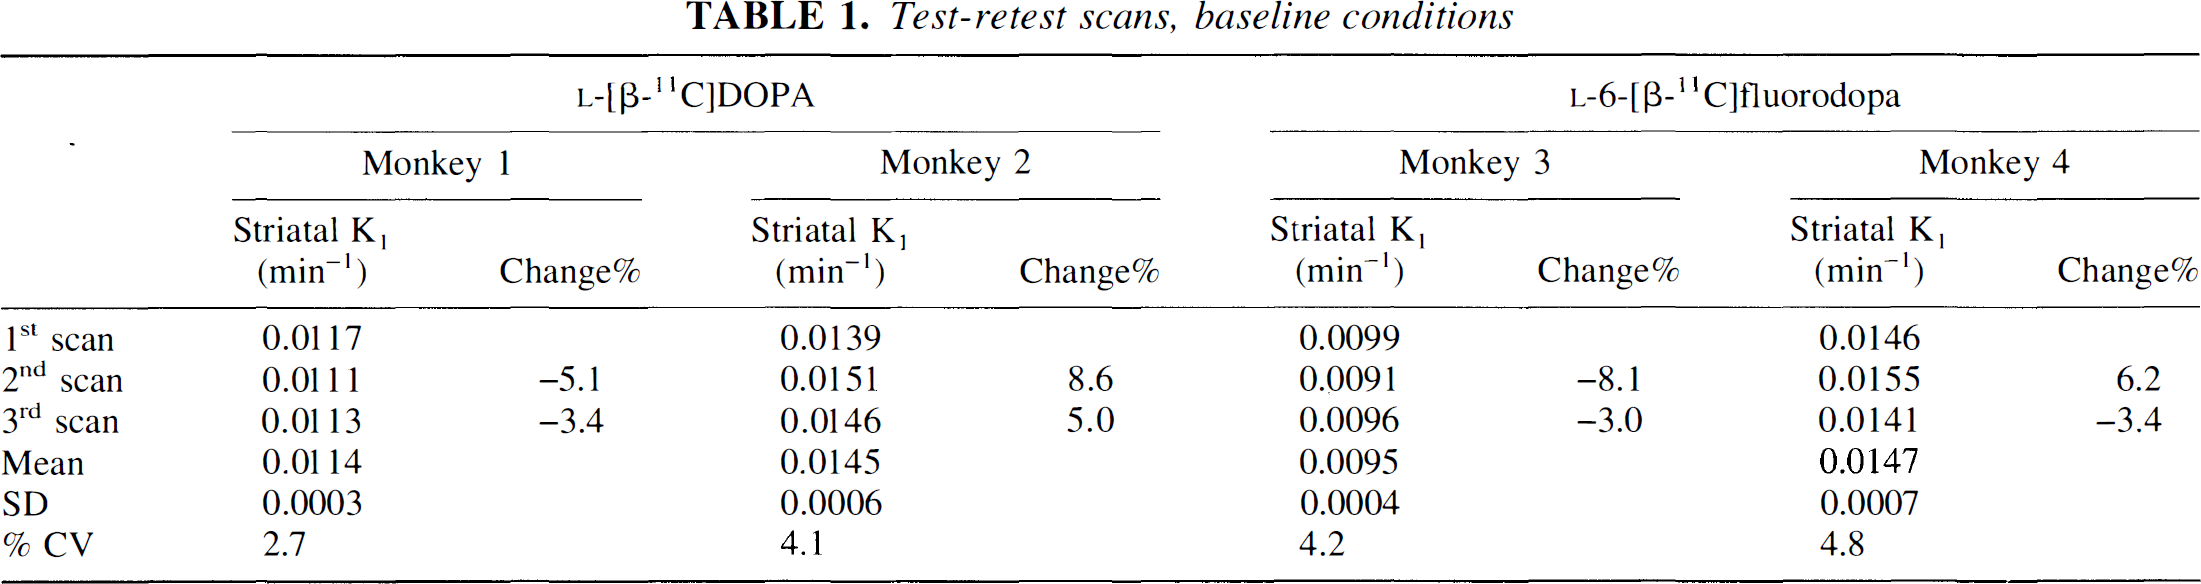
Sequential PET scans without any challenge, i.e. test-retest values, revealed data shown in Table 1. The coefficient of variation obtained were similar for the two tracers, 3% to 4% for
Test-retest scans, baseline conditions
The striatal Ki-value measured with
Baseline striatal K1 values of
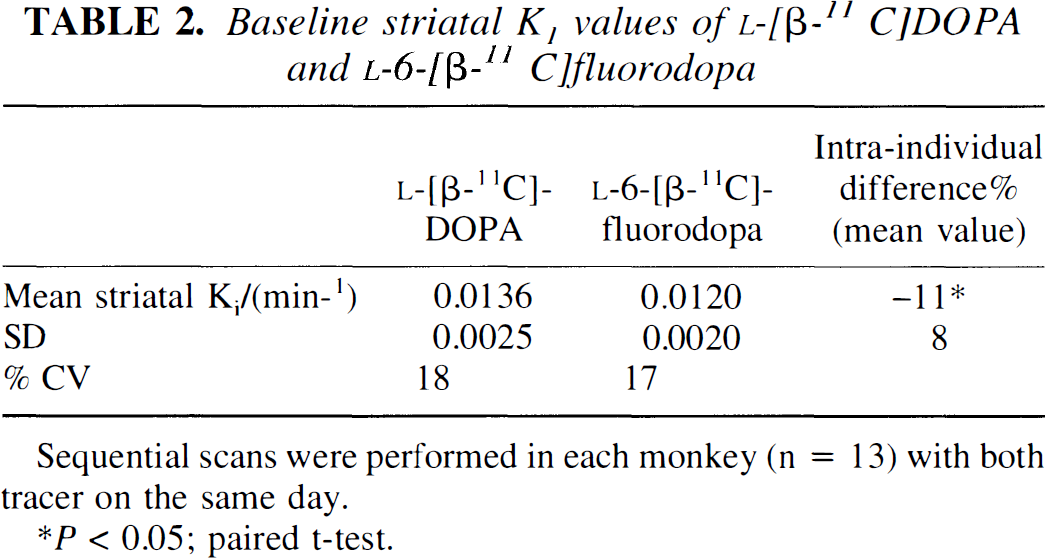
Sequential scans were performed in each monkey (n = 13) with both tracer on the same day.
P < 0.05; paired t-test.
Effect of 11C-labeling in carboxylic position on the striatal Ki
The calculated Ki value was lower for both tracers when labeled in the carboxylic position, Table 3. The Ki value of carboxy-labeled tracer decreased as compared to β-labeling with 77% on average for the fluorinated analog and 101% with the
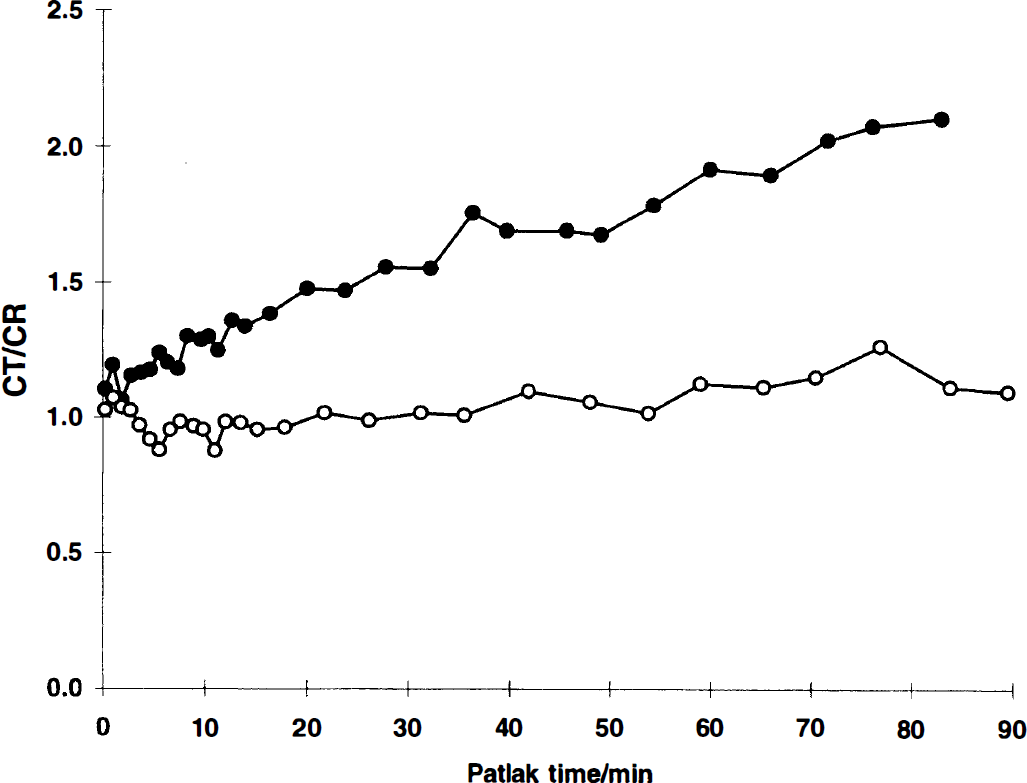
Typical Patlak curves from 11C-labeled
Effect of 11C site-labeling on the measured K1 value
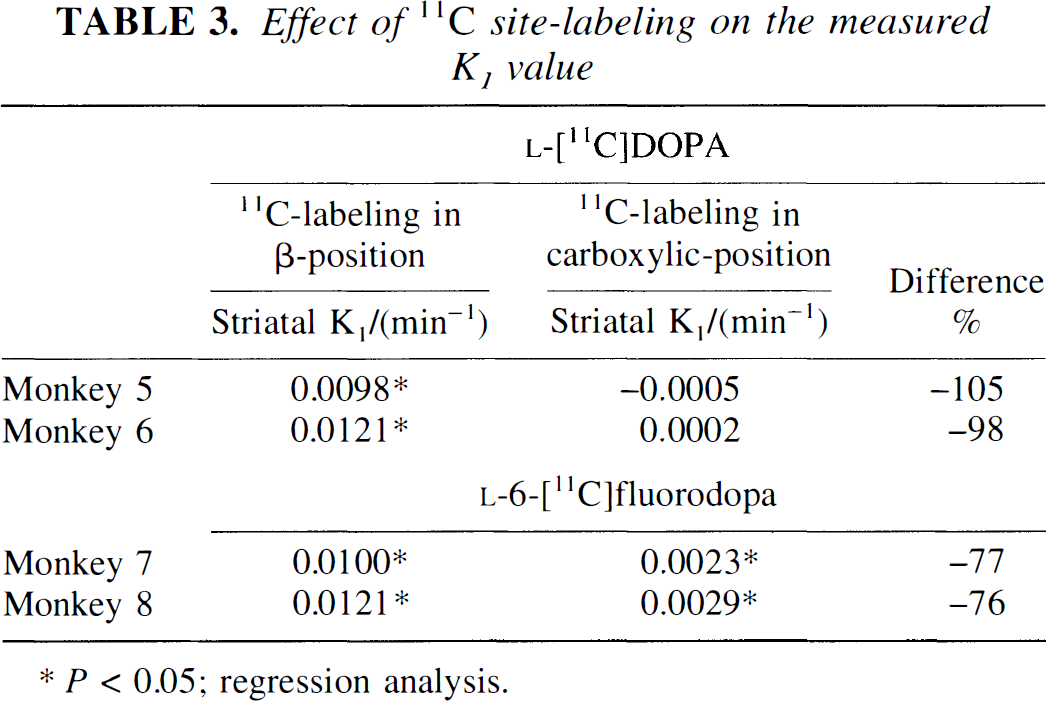
P < 0.05; regression analysis.
Effects of 6R-BH4 on l -[β-11C]DOPA and l -6-[β-11C]fluorodopa striatal Ki
6R-BH4 (5 mg/kg/h) increased the striatal
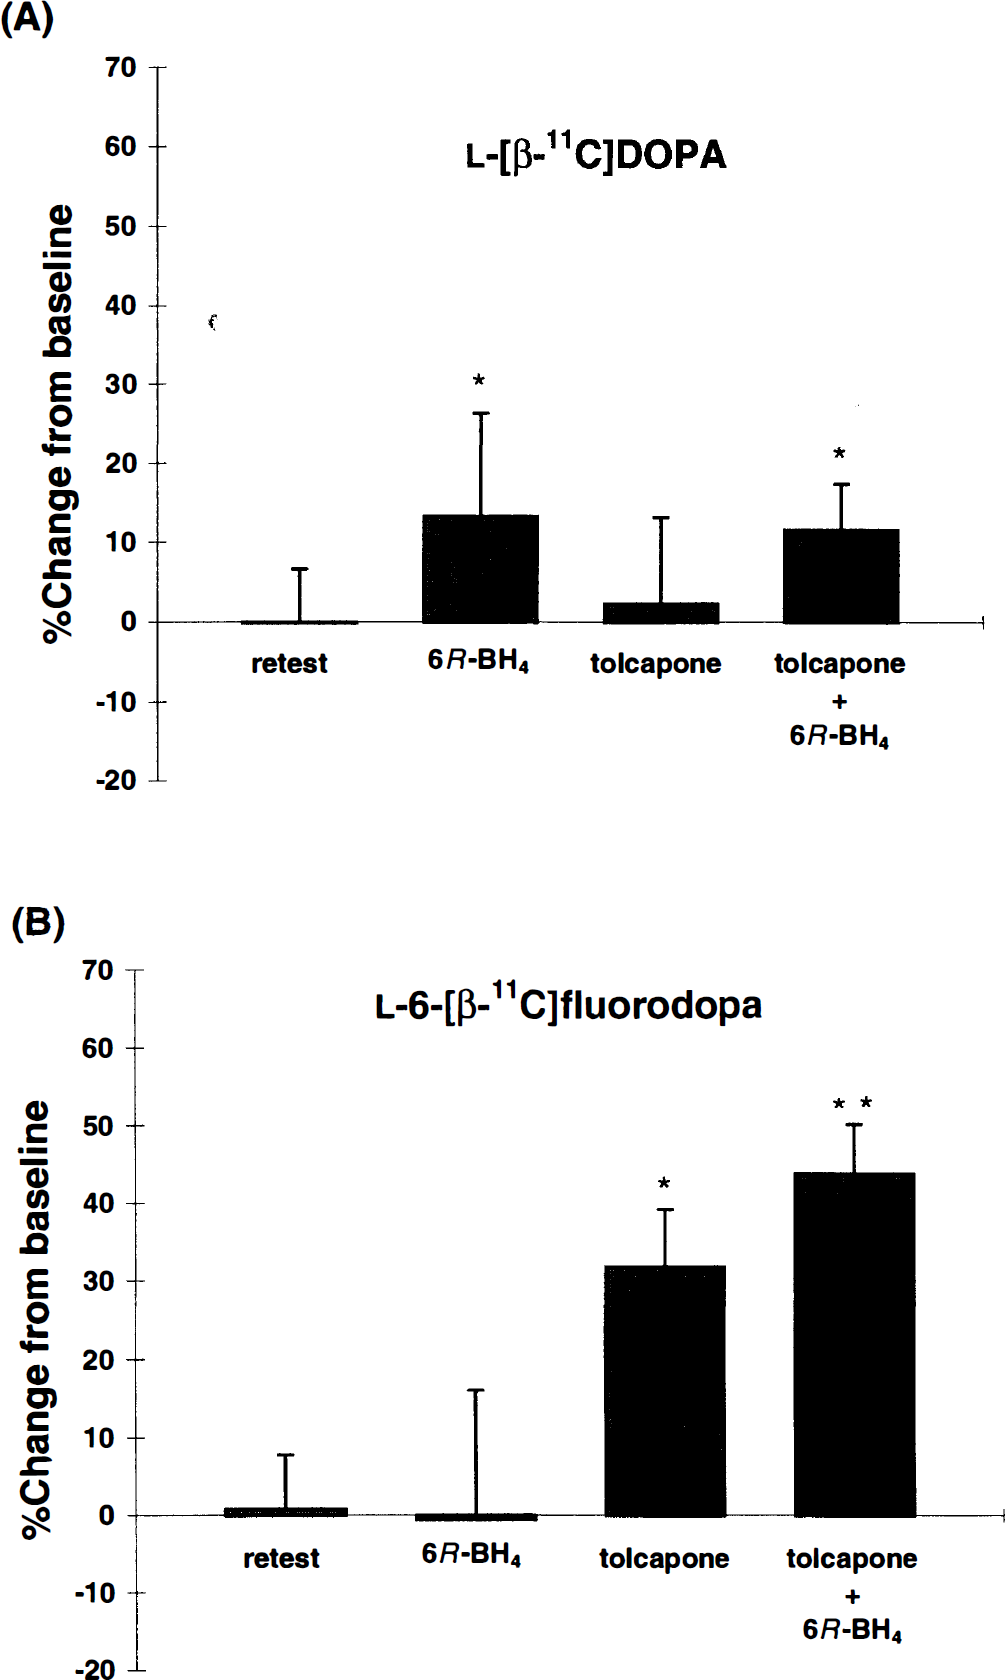
Percent change of striatal K1 value after pharmacological challenges compared with baseline scan in the same monkey. The bars indicated mean values ± SD. *P < .05 from from baseline.
Effect of pharmacologic challenges on the measured K1 value
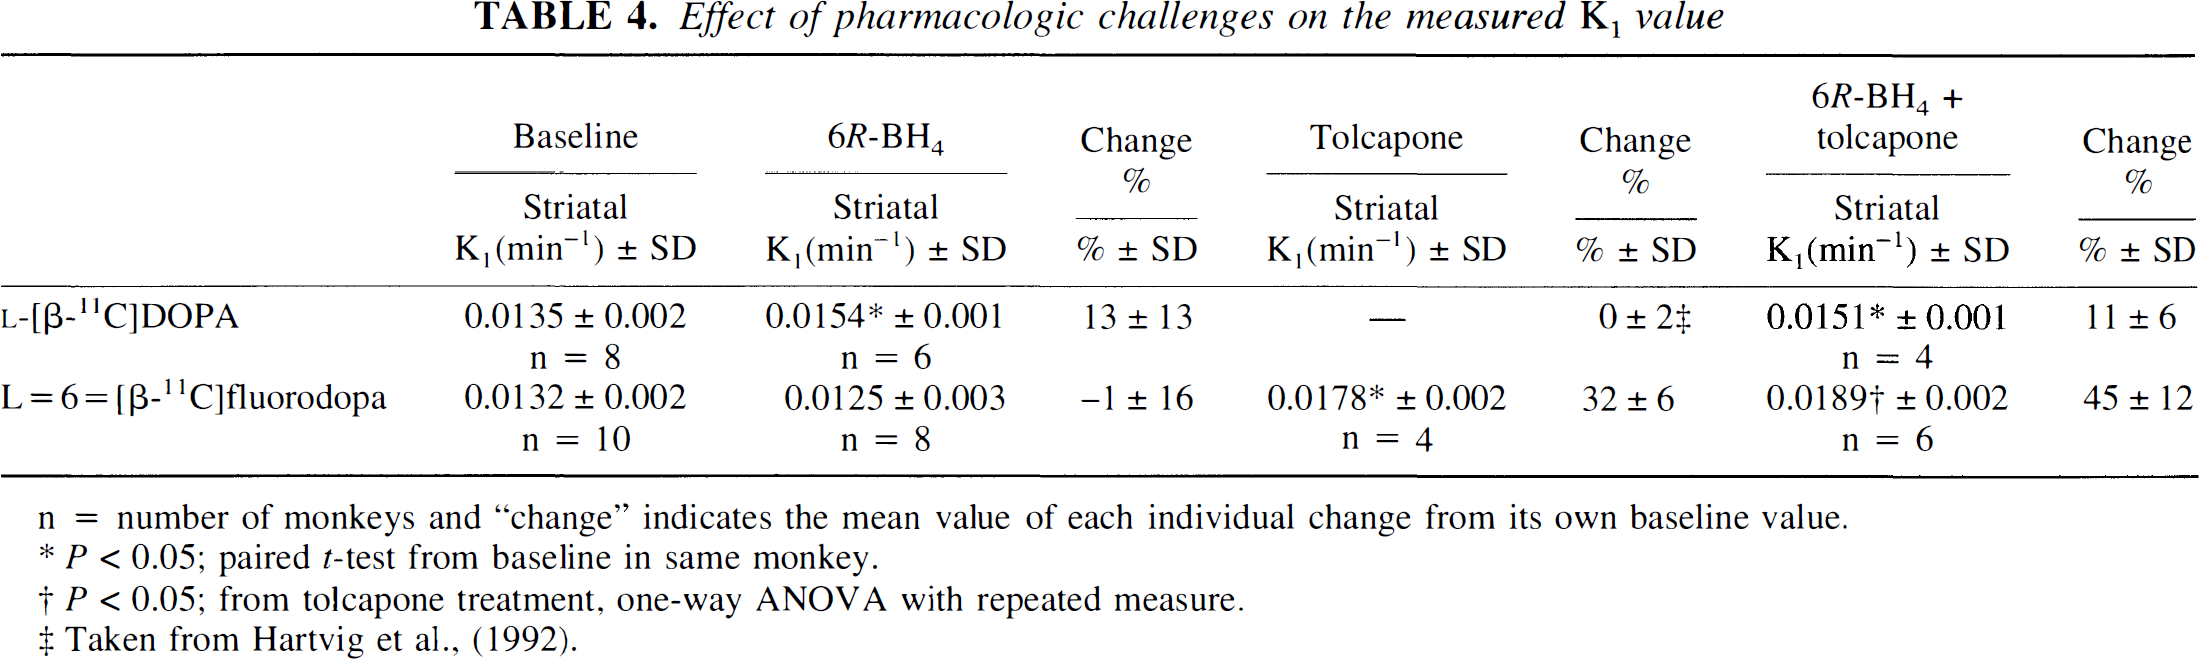
n = number of monkeys and “change” indicates the mean value of each individual change from its own baseline value.
P < 0.05; paired t-test from baseline in same monkey.
P < 0.05; from tolcapone treatment, one-way ANOVA with repeated measure.
Taken from Hartvig et al., (1992).
Effects of tolcapone on the striatal Ki before and after 6R-BH4 infusion
Tolcapone (10 mg/kg/h) increased the striatal Ki of
In a previous study with identical experimental conditions as in the present study, tolcapone treatment did not change the measured striatal Ki compared to baseline values with
Measurement of radioactive metabolites in plasma samples
A difference between metabolite formation rates of the two tracers
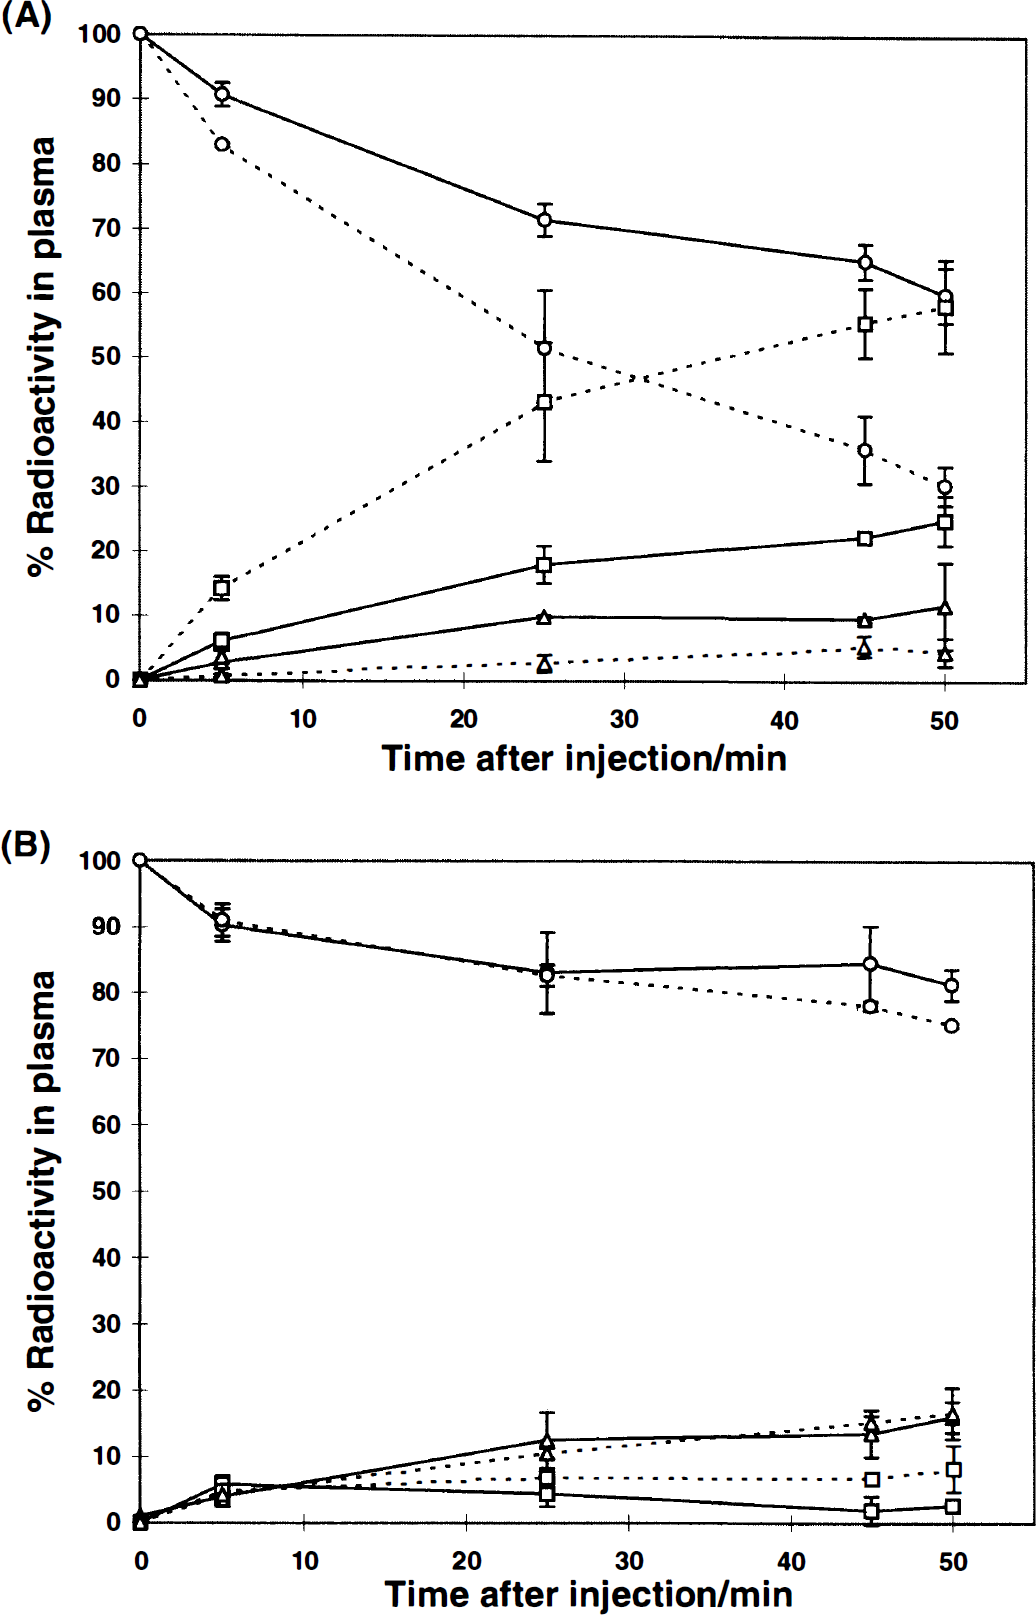
Fractions of unmetabolized tracers (circles) and radiolabeled metabolites in plasma; 3-0-methyl-DOPA fractions (squares) and sum of other metabolites, 3,4-dihydroxy-phenylacetic acid, dopamine, and homovanillic acid fraction (triangles) Filled lines represents studies with
6R-BH4 did not induce any discerible effect on the rate of metabolism in plasma of any of the tracers studied (data not shown). Tolcapone changed the relative radioactive fraction of the tracer and its metabolites in plasma as expected and the 3-O-methyl metabolite fraction was reduced to between 0 to 5% of total radioactivity (Fig. 4B). The homovanillic acid fraction also decreased to zero values whereas the 3,4-dihydroxy-phenylacetic acid fraction increased.
DISCUSSION
6R-BH4, a cofactor for tyrosine hydroxylase, was used as a tool to enhance the dopamine synthesis rate. The constant rate infusion of 6R-BH4 (5 mg/kg) induced a significant increase of the striatal
The dopamine releasing effect induced by 6R-BH4 (Koshimura et al., 1990) could theoretically decrease the apparent influx rate constant due to a release of the trapped radioactivity in the striatum. This influence on the calculated value is less likely because PET studies with a potent dopamine releasing agent, e.g., amphetamine, did not decrease the measured striatal Ki for
In contrast to the increase striatal Ki value measured with
18F-Iabeled
Estimation of the striatal Ki for
The 3-O-methyl metabolite enters the brain in substantial amounts (Doudet et al., 1991; Reith et al., 1990) and hence will interfere in the calculation of the striatal Ki value using a brain reference area (Sawle et al., 1994). A significant contribution of radioactivity from this metabolite in the brain would decrease the calculated specific use in the target tissue due to an increased background radioactivity in the tissue-reference model as predicted in the original method description by Patlak and Blasberg (1985). This influence of different peripheral metabolite formation rates is also found in the baseline striatal Ki value of the two tracers where the
The 3-O-methyl metabolite fraction was reduced to less than 5% of total plasma radioactivity, and the striatal Ki value of the 11C-labeled fluoroanalogue was increased with 32% after COMT inhibition with tolcapone. This corresponds well with previous results in monkeys and humans with
Pretreatment with COMT inhibition and 6R-BH4 infusion increased the Ki value of the fluoroanalogue by 45% on average compared with 32% without COMT inhibition. This 6R-BH4 induced increase was in parallel with the increase (+13%) measured with
11C-labeling of
Correction for the 3-O-methyl fraction influence in the calculation of the Ki value of the fluoroanalogue is cumbersome and is supported by the massive literature in the area (Cumming and Gjedde, 1998). Large differences in hepatic COMT activity exist within species (also sex differences) (Cumming et al., 1993; De Santi et al., 1998) and also between species (Guldberg and Marsden, 1975) which implies difficulties in introducing standard corrections in the calculations of PET data. COMT inhibition in connection with the PET study would be the only way to avoid a possible 3-O-methyl metabolite interaction in the brain with the AADC enzyme.
There may also be an affinity difference of the two radiotracers for the AADC enzyme in the brain. In vitro studies in rats have shown Km-values of 101 ± 22μmol/L for
In conclusion, the two studied β-11C-labeled molecules