
Abstract
This study evaluates the effect of orthostasis on the low frequency (LF, 0.04 to 0,15 Hz) fluctuations in the blood flow velocity of the middle cerebral artery (MCAFV) in relation to its arterial blood pressure (ABP) equivalent to further define and quantify this relationship in cerebrovascular regulation. Spectral analysis was performed on 22 healthy subjects during supine rest and head-up tilt. The power in the LF range can be used to quantify the LF fluctuations, and four types of LF power data could be obtained for each individual: LF power of supine MCAFV, LF power of supine ABP, LF power of tilt MCAFV, and LF power of tilt ABP. By comparing LF power of MCAFV with LF power of ABP, two power ratios could be generated to describe the flow-pressure relationship during supine rest and head-up tilt, respectively, supine power ratio (LF power of supine MCAFV/LF power of supine ABP) and tilt power ratio (LF power of tilt MCAFV/LF power of tilt ABP). In addition, an index for dynamic autoregulation in response to orthostasis can be calculated from these two power ratios (tilt power ratio/supine power ratio). The authors found that this index was dependent on the extent of orthostatic MCAFV changes, and the dependency could be mathematically expressed (r = 0.61, P = .0001), suggesting its involvement in cerebrovascular regulation. Moreover, these data further support the previous observation that the LF fluctuations of MCAFV might result from modulation of its ABP equivalent, and the modulation effect could be quantified as the power ratio (LF power of MCAFV/LF power of ABP). These observations could be an important step toward further insight into cerebrovascular regulation, which warrants more research in the future.
Keywords
Recent advancement in frequency domain analysis of the spontaneous fluctuations of arterial blood pressure (ABP) and middle cerebral artery flow velocity (MCAFV) has greatly expanded our insight into cerebrovascular regulation. Noninvasive technologies such as instantaneous ABP monitors and transcranial Doppler sonography have been successfully used to record ABP and MCAFV fluctuations, respectively, with high temporal resolution (Aaslid et al., 1989; Aaslid et al., 1991; Dahl et al., 1992; Lagi et al., 1994; Novak et al., 1998). In addition, transfer function analysis in the frequency domain offers the unique capacity to evaluate cerebral autoregulation because the relationship of ABP and MCAFV can be described in a dynamic fashion (Diehl et al., 1995; Blaber et al; 1997; Kuo et al., 1998). Our laboratory has successfully applied such techniques to study cardiovascular and cerebrovascular fluctuations (Kuo et al., 1997, 1998; Hu et al., 1999). We have reported that the fluctuations in MCAFV, similar to ABP, could be diffracted into three components at specific frequency ranges, designated as high-frequency (HF, 0.15 to 0.40 Hz), low-frequency (LF, 0.04 to 0.15 Hz), and very low-frequency (VLF, 0.016 to 0.04 Hz) components (Kuo et al., 1998). Analysis of these tiny oscillations in the circulation system has been proven useful in the diagnosis of various diseases or prediction of patient outcomes (Yien et al., 1997; Kuo et al., 1997; Hu et al., 1999).
In our previous study (Kuo et al., 1998), the LF component of MCAFV fluctuations is characterized by high coherence (> 0.5) to its ABP component. The transfer phase is linear with a negative slope to the oscillating frequency in the LF range, in which phase angle increased with decreased frequency. The magnitude (transfer gain) is also linear but with a positive slope to the oscillating frequency in the LF range. This suggests that the MCAFY response to LF fluctuations of ABP is not passive, and it seems to play a major role in pressure-modulation, serving to modulate the ABP variations (Kuo et al., 1998). Zhang et al. (1998) made a similar observation, although they defined the frequency components slightly differently. Therefore, the relationship of the LF component of MCAFY fluctuations and its ABP equivalent deserves further evaluation for this observation to be of clinical use.
Magnitude (gain) has been used to describe the MCAFY-ABP relationship with transfer function analysis (Blaber et al., 1997; Kuo et al., 1998; Zhang et al., 1998; Hu et al., 1999). However, opinions regarding the clinical significance of LF magnitude (transfer gain) in relation to cerebral autoregulation remain divided (Blaber et al., 1997; Zhang et al., 1998; Hu et al., 1999). Therefore, we would like to use the fundamental data from spectral analysis to resolve this controversy. The LF fluctuations can be quantified as the power of the LF range of the MCAFY and ABP, respectively (Kuo et al., 1998; Hu et al., 1999), which are readily available with spectral analysis. Thus, we could compare the LF power of MCAFY with its ABP equivalent, intending to quantify the MCAFY-ABP relationship in the LF range. More specifically, this explores the physiologic significance of these power data in terms of cerebrovascular regulation. Since head-up tilt is considered a reliable method to study cerebral autoregulation by inducing defined perturbations to cardiovascular and cerebrovascular systems (Daffertshofer et al., 1991; Daffertshofer and Hennerici, 1995; Novak et al., 1998), we hoped that our goal could be achieved by relating these LF power data during supine rest and head-up tilt to the orthostatic cardiovascular and cerebrovascular changes.
SUBJECTS AND METHODS
Twenty-two nonnal volunteers (10 men and 12 women) with a mean age of 37.6 ± 8.4 years (range, 22 to 55 years) were recruited for this study. All were healthy and without history of diabetes mellitus, alcoholism, neuropathies, and cerebrovascular or cardiovascular diseases. They were free of malnutrition, obesity, or medications known to affect the autonomic nervous system. No food, coffee, or nicotine was permitted for 3 hours before the study. Complete physical and neurological examinations were performed for each subject. Carotid stenosis and stenosis in the major arteries in the brain base were excluded in extracranial and intracranial Doppler test, respectively. A written informed consent was obtained from each participant. Measurements were performed throughout all the supine and head-up tilt positions.
Each patient remained in a supine position on a motorized tilt table with foot board support. Instantaneous ABP was recorded noninvasively by servocontrolled infrared finger plethysmography (Finapress, Model 2300, Ohmeda Monitoring Systems, Englewood, CT, U.S.A.) fixed to the index finger of the right hand. The right upper limb was placed on a side arm support such that ABP measurement was conducted uninterrupted at the heart level throughout supine rest and head-up tilt. The MCAFV of left and right sides were recorded by a bilateral transcranial Doppler sonography monitor (Multi-Dop-X/TCD7, DWL, Sipplingen, Germany). The transducers were fixed in place, and MCAFV was continuously monitored at the depth of the best signal (44 to 55 mm). Both ABP and MCAFV signals were acquired, displayed, and stored to floppy disk by Multi-Dop-X. Each participant remained supine in the horizontal position for 5 minutes before the table was tilted head-up to 70 degrees. After an additional 20 minutes, the table was tilted back to a horizontal position, and 5 minutes later the investigation was finished. Data during the basal supine rest position and during the first 5 minutes of head-up tilt were used for analysis.
The analysis technique for ABP and MCAFV variability has been documented previously (Kuo and Chan, 1993; Kuo et al., 1998). MCAFV signals were first normalized by mean MCAFV and were expressed by percentage variation from the mean MCAFV. This normalization procedure could exclude the recording bias induced by the angle of the ultrasound transducer, and makes the consequent spectral and transfer function analysis independent of absolute value of mean MCAFV. Original ABP and nonnalized MCAFV signals were subject to off-line spectral analysis by the construction of average periodogram (Kuo et al., 1998). For this purpose, a 288-second segment of stationary ABP and MCAFV signals was divided into eight sets of 64-second windows. Each set overlapped by 50%. Computation of the spectrum was performed using a fast Fourier transform. The ABP and MCAFV spectra obtained for the eight data sets were subsequently averaged to minimize contributions from variable noise and to sharpen reproducible spectral components. The computer program subsequently quantified each spectral component by the method of integration, i.e., calculation of power spectral density between two specified frequencies. We were particularly interested in the lower end of the frequency spectrum of ABP or MCAFV signals. These included VLF (0.016 to 0.04 Hz), LF (0.04 to 0.15 Hz), and HF (0.15 to 0.4 Hz). These frequency ranges were determined by those previously defined for heart rate variability (Anonymous, 1996).
Low frequency power data from the left and the right middle cerebral artery (MCA) (LF power of MCAFV) could be obtained for each individual during supine rest and head-up tilt: LF power of supine left MCAFV, LF power of supine right MCAFV, LF power of tilt left MCAFV, and LF power of tilt right MCAFV. Two sets of ABP LF power could be obtained during supine rest and head-up tilt, respectively, LF power of supine ABP and LF power of tilt ABP. Moreover, two power ratios for either side of MCA could be generated to evaluate the flow-pressure relationship by comparing the LF power of MCAFV with its ABP equivalent during supine rest and head-up tilt, respectively. The supine power ratio was defined as LF power of supine MCAFV/LF power of supine ABP, and the tilt power ratio, as LF power of tilt MCAFVI LF power of tilt ABP. In addition, a ratio index, tilt power ratio/supine power ratio, was used to explore the effect of orthostasis on the flow-pressure relationship.
Mean ABP (MABP) during supine rest and head-up tilt were expressed as the averaged value during the 5 minutes of supine rest and the first 5 minutes of head-up tilt, respectively. Mean MCAFV during supine rest and head-up tilt were also similarly expressed as the averaged value, which were separately obtained on the left and right side. We calculated the difference of MABP between supine rest and head-up tilt, and the difference was expressed as percentage of the supine MABP to represent the extent of orthostatic ABP change (ΔMABP), with the positive value indicating a decrease during orthostasis. The difference of mean MCAFV between supine rest and head-up tilt was also calculated for each individual, and expressed as percentage of the supine mean MCAFV (ΔMCAFV) on the left and right side, respectively, with the positive value indicating a decrease of mean MCAFV during orthostasis.
All the measurement values are expressed as mean ±SD. The paired t-test was performed to test side to side as well as supine versus tilt difference. The statistical significance was defined as p < .05. Pearson correlation coefficient was used to correlate these power data, power ratios, and the ratio index with the cardiovascular and cerebrovascular parameters, especially ΔMABP, and ΔMCAFV, and a P value of .05 or less is considered statistically significant.
RESULTS
The mean ±SD of the MABP, left and right mean MCAFV were 91.8 ± 13.9 mm Hg, 62.0 ± 15.3 cm/s, and 63.1 ± 14.9 cm/s, respectively, during supine rest, and 94.8 ± 12.3 mm Hg, 57.8 ± 13.6 cm/s, and 58.3 ± 14.9 cm/s, respectively, during head-up tilt. The mean ± SD of ΔMABP, left and right ΔMCAFV were 3.8 ± 6.5%, 7.0 ± 5.6%, and 7.6 ± 5.8%, respectively. The mean ± SD of the LF power of ABP, the left and right MCAFV were 6.0 ± 3.4 mm Hg2, 14.4 ± 6.9 unit2, and 12.9 ± 6.8 unit2, respectively during supine rest and 9.0 ± 3.9 mm Hg2, 20.6 ± 10.7 unit2, and 19.8 ± 10.4 unit2, respectively, during head-up tilt. The difference of LF power of ABP between supine rest and head-up tilt was statistically significant (P = .013), and so was the difference of LF power of MCAFV between supine rest and head-up tilt on the left side (P = .04) and right side (P = .025) (Fig. 1). The mean ± SD of supine power ratio, tilt power ratio, and the ratio index were 2.74 ± 1.36 unit2/mm Hg2, 2.48 ± 1.29 unit2/mm Hg2, and 0.95 ± 0.40, respectively, on the left side, and 2.46 ± 1.26 unit2/mm Hg2, 2.42 ± 1.17 unit2/mm Hg2, and 1.04 ± 0.40, respectively, on the right side (Fig. 2). These data showed no side to side differences, and they were pooled together such that power, power ratio, and the ratio index were correlated with the orthostatic cardiovascular and cerebrovascular changes.
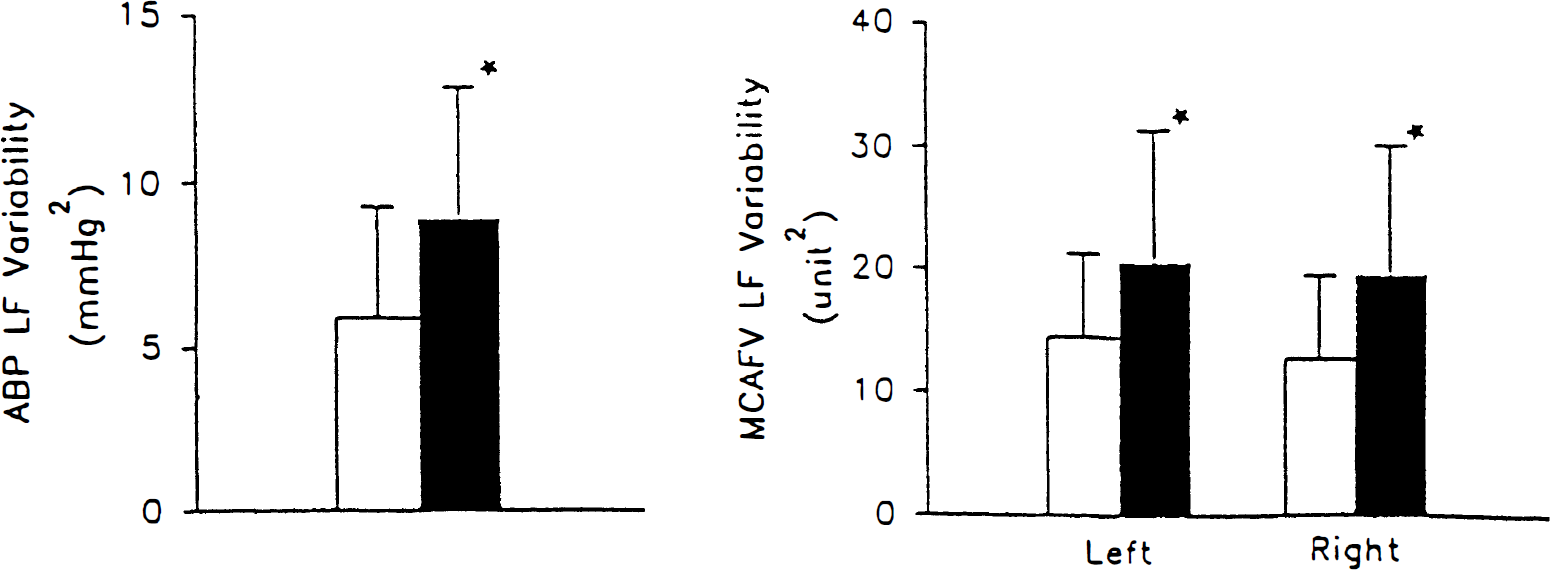
Bar chart showing mean and SD of the low frequency (IF) power of arterial blood pressure (ABP) and left and right middle cerebral artery flow velocity (MCAFV) during supine rest and head-up tilting. (□) Supine, (■) head-up tilt. *Significant supine-tilt difference, P < .05.
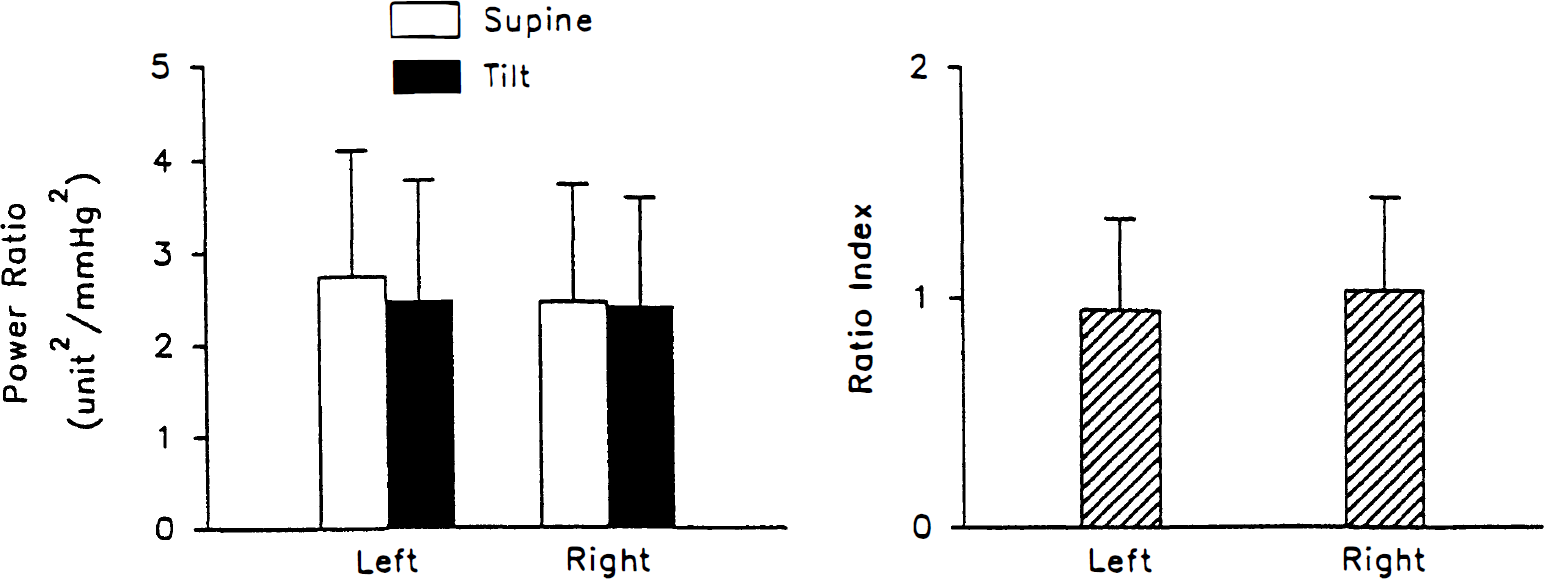
Bar chart showing mean and SD of the power ratio of flow to pressure during supine rest (supine power ratio) and head-up tilt (tilt power ratio) and the ratio index on the left and right sides.
Poor correlation was found between ΔMABP and ΔMCAFV (r = − 0.047, P = .764). None of the LF power alone is significantly correlated with ΔMABP or ΔMCAFV. Good linear correlation was found between ΔMCAFV and the ratio index (r = 0.54, P = .0002), suggesting flow dependency of this index. We found that a second-order model further improved the correlation of the index and ΔMCAFV (r = 0.61, P = .0001), and the regression line was expressed in equation 1 (Fig. 3). On the other hand, the correlation of this index with ΔMABP was not significant (r = −0.057, P = .713), suggesting lack of pressure dependency.
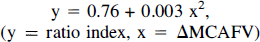
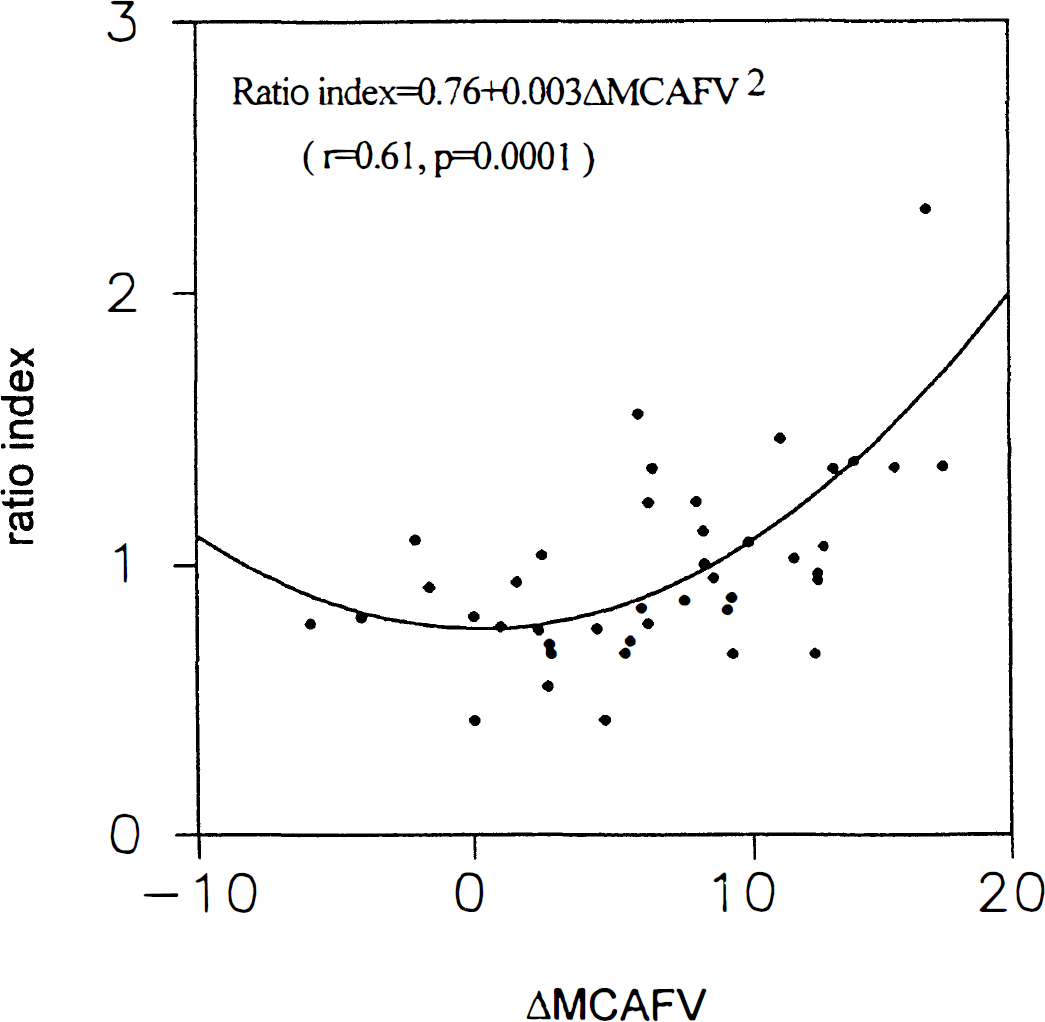
Two-dimensional scattergram showing the correlation between the ratio index and the corresponding orthostatic change in middle cerebral artery blood flow velocity (ΔMCAFV).
DISCUSSION
There are two primary findings in this study. (1) The relationship of LF components between MCAFV and ABP fluctuations could be described quantitatively as power ratio, and we further revealed that the regulatory mechanism of this relationship was flow dependent. (2) Calculation of the ratio index and derivation of equation 1 helped express the flow-dependent nature in a mathematical way. Our findings suggest that spectral analysis in the frequency domain could be a powerful tool in approaching cerebrovascular regulation for clinical and research purposes.
However, some assumptions must be made for this study to evaluate cerebrovascular regulation with transcranial Doppler sonography. The validity of using transcranial Doppler sonography to estimate MCA flow has been previously studied, and a good correlation between MCAFV and MCA flow was reported (Lindegaard et al., 1987; Aaslid et al., 1991; Newell et al., 1994). In addition, it has been verified that there was little or no change of MCA stem diameter (the insonated segment in transcranial Doppler sonography) during different autoregulatory tests such that MCAFV changes can be related to CBF changes (Giller et al., 1993; Tiecks et al., 1995). Therefore, relative change in MCAFV should represent relative change in CBF during rest and autoregulation tests. In this study, we managed our MCAFV data as a percentage variation from the mean to represent relative change in CBF.
The supine power ratio and tilt power ratio were used to describe the relationship of LF fluctuations of MCAFV with its ABP equivalent during supine rest and head-up tilt, respectively. Moreover, the ratio index, tilt power ratio/ supine power ratio, was used to explore the effect of orthostasis on this relationship. The flow dependent nature of this index strongly suggests that the LF components may be involved in regulation of CBF. Moreover, this index might serve as an indicator for cerebrovascular regulation. The parabolic regressive curve revealed in Fig. 3 suggested that the ratio index would increase on orthostatic flow change, be it increase or decrease. Therefore, a second-order model improved the prediction of this index over ΔMCAFV (Kleinbaum et al., 1988).
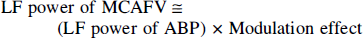
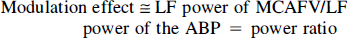
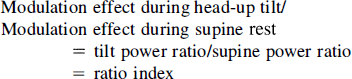
This is in agreement with our previous report in which we hypothesized that the LF fluctuations of the MCAFV might result from modulation of its ABP equivalent (Kuo et al., 1998). This hypothesis could be expressed as equation 2. Therefore, the power ratio might represent the modulation effect based on this hypothesis (equation 3). In addition, the ratio index could be obtained by comparing the modulation effect during head-up tilt with that during supine rest (equation 4). Because this index was found to correlate well with orthostatic CBF changes, it was suggested that changing this modulation effect was associated with changing CBF. This further supports our hypothesis that the power ratio may be related to this modulation effect, which is considered to be associated with cerebral autoregulation (Kuo et al., 1998).
The clinical significance of spontaneous CBF fluctuations in cerebrovascular regulation was not appreciated until the application of frequency domain analysis (Diehl et al., 1991; Newell et al,. 1992). We and other investigators have reported the clinical correlation of magnitude (transfer gain) and impaired cerebral autoregulation in a variety of disease states (Giller 1990; Blaber et al., 1997; Hu et al., 1999). However, opinions regarding the clinical significance of LF magnitude (transfer gain) remained divided. In our study on patients with carotid disease, the LF magnitude was significantly reduced on the side ipsilateral to carotid stenosis as compared with that of the normal controls (Hu et al., 1999). On the contrary, Zhang et al. (1998) reported an increased magnitude in the frequency range of 0.07 to 0.20 Hz in three normal subjects on CO2 inhalation, and they suggested that an increase in LF magnitude was associated with impaired cerebral autoregulation. Blaber et al. (1997) applied graded tilts to study eight patients with autonomic failure and their controls. They found the averaged LF magnitude (gain) to be significantly higher in patients than in controls in the supine state, and they suggested that an increased averaged LF magnitude (gain) might represent impaired cerebral autoregulation.
Therefore, this study might be well suited to address this controversy because LF magnitude and the power ratio are related in a particular way. In case of perfect coherence (r = 1) between two oscillations, the power ratio between them (such as that in this study) will be the square of the magnitude (Cerutti et al., 1994; Linden and Diehl, 1996). However, such relation may no longer exist with poor coherence. Since the coherence between MCAFY and ABP oscillations in the LF range is good in healthy individuals, the square root of the power ratio should be reasonable approximation of the averaged LF magnitude, and the square root of the ratio index, the LF magnitude ratio (averaged LF magnitude during head-up tilt/averaged LF magnitude during supine rest) (Linden and Diehl, 1996). In fact, flow dependency still exists for the square root of the ratio index in this study (r = 0.55, P = .0001), indicating that alteration of LF magnitude on orthostasis may be flow dependent. More research is necessary for application of this observation to conditions with flow changes other than orthostasis, such as CO2 inhalation. However, our data suggested the possibility that increased LF magnitude might be related to flow changes (for instance, CO2 inhalation) rather than an impairment of cerebral autoregulation in healthy individuals. In addition, the decreased LF magnitude in patients with severe carotid stenosis could be related to severely impaired cerebral autoregulation such that CBF could no longer increase to meet physiologic need. Moreover, LF power of ABP, which is the denominator of the power ratio, has been proved to be correlated to sympathetic vasomotor activity (Kuo et al., 1997). LF power of ABP may be reduced in patients with sympathetic insufficiency (Linden and Diehl, 1996; Omboni et al., 1996), which could result in increased power ratio and LF magnitude. Therefore, the increased LF magnitude might be a reflection of autonomic failure rather than impaired cerebral autoregulation.
Cerebral perfusion on orthostatic challenges can not be predicted from the ABP changes alone (Novak et al., 1998), and a measurable indicator that can reasonably represent CBF changes is sorely needed. The flow dependent characteristic of the ratio index shown in equation 1 would make it an appealing indicator to serve this purpose. However, since the maximal orthostatic flow decrease in this study was 17%, there might be some modification to equation 1 on greater extents of orthostatic flow changes, Moreover, clinical application of this equation awaits further study.
In conclusion, with spectral analysis it was suggested that a pressure-modulation effect might exist in the LF component of the MCAFY fluctuations, which could be expressed as power ratio (LF power of MCAFV/LF power of ABP). Alteration of the power ratio on orthostatic challenge was shown to be dependent on the orthostatic flow changes, and this strongly implied its involvement in regulation of CBF. Derivation of equation 1 further described this flow-dependent nature in a mathematical way. Results from this study also suggest that the numerical value of the LF magnitude per se might not be used to judge the integrity of cerebral autoregulation unless the associated clinical condition is also taken into consideration, Our observation could be an important step toward further insight into cerebrovascular regulation approached through the frequency domain analysis, which deserves scrutiny and more research for its applications in the future.
Footnotes
Acknowledgment
The authors thank Ms. Chin-Fei Chang, for her assistance in preparing this manuscript.