
Abstract
We applied frequency domain analysis to detect and quantify spontaneous fluctuations in the blood flow velocity of the middle cerebral artery (MCAFV). Instantaneous MCAFV of normal volunteers was detected using transcranial Doppler sonography. Spectral and transfer function analyses of MCAFV and arterial blood pressure (ABP) were performed by fast Fourier transform. We found the fluctuations in MCAFV, like ABP, could be diffracted into three components at specific frequency ranges, designated as high-frequency (HF, 0.15 to 0.4 Hz), low-frequency (LF, 0.04 to 0.15 Hz), and very low-frequency (VLF, 0.016 to 0.04 Hz) components. The HF and LF components of MCAFV exhibited high coherence with those of ABP, indicating great similarity of MCAFV and ABP fluctuations within the two frequency ranges. However, it was not the case for the VLF component. Transfer function analysis revealed that the ABP-MCAFV phase angle was frequency-dependent in the LF range (r = −0.79, P < 0.001) but not in the HF range. The time delay between LF fluctuations of ABP and those of MCAFV was evaluated as 2.1 seconds. We conclude that in addition to traditional B-wave equivalents, there are at least two different mechanisms for MCAFV fluctuations: the HF and LF fluctuations of MCAFV are basically secondary to those of ABP, and cerebral autoregulation may operate efficiently in LF rather than HF range. Frequency domain analysis offers an opportunity to explore the nature and underlying mechanism of dynamic regulation in cerebral circulation.
Keywords
Noninvasive diagnostic technique has been widely appreciated recently. Among the various applications, frequency domain analysis of heart rate and blood pressure fluctuations has expanded our insight into the human body. Spontaneous fluctuations in heart rate signals have been reported to originate from neuronal modulation of sinus node by sympathetic and parasympathetic nerves (DeBoer et al., 1987; Pagani et al., 1986). Fluctuations in arterial pressure also have been correlated to the autonomic nervous system (Kuo et al., 1996, 1997). Analysis of these tiny perturbations in the circulation system has been proved to be useful in the diagnosis of various diseases or prediction of patient outcomes (Malliani et al., 1991; Hu et al., 1996; Yien et al., 1997).
Current tests for assessment of cerebral autoregulation (CA) have been beneficial for the management of patients with cerebrovascular disease. The classic method of evaluating CA requires the pharmacologic manipulations of arterial blood pressure (ABP) to decide whether cerebral blood flow remains constant in response to a change in cerebral perfusion pressure (Kety and Schmidt, 1948). Many noninvasive techniques have been developed for safety and accessibility. However, most tests require the application of special maneuvers, such as carbon dioxide inhalation (Widder et al., 1986), carotid compression (Giller, 1991), deep breathing (Diehl et al., 1995), or artificial perturbation of ABP (Tiecks et al., 1995). Such maneuvers require cooperation of patients and may produce discomfort or even risk for cerebrovascular disease. A less-invasive technique for CA still is needed. Thus, the question of whether it is possible to categorize, quantify, and use spontaneous fluctuations in cerebral blood flow velocity detected by the transcranial Doppler (TCD) ultrasonography arises. We also wonder if such fluctuations in blood flow velocity are secondary to spontaneous fluctuations in ABP. If it is the case, then we can use spontaneous fluctuations in ABP as input signals to test CA.
Cerebral blood flow has long been noted to fluctuate during long-term monitoring (Lindegaard et al., 1987). Large fluctuations of up to ± 30% from the mean value have been reported in normal subjects (Diehl et al., 1991). Fluctuations of CBF tend to occur in three frequency ranges: one between 0.5 and 2 cycles/min (Mauntner-Huppert et al., 1989; Diehl et al., 1991; Newell et al., 1992), one around 6 cycles/min (Diehl et al., 1991), and the other around 15 cycles/min and synchronous with respiration (Newell et al., 1992). However, a complete categorization of these fluctuations needs to be investigated.
Of these three different range CBF fluctuations, the fluctuations reported most frequently are the slow fluctuations between 0.5 and 2 cycles/min. Since these fluctuations are synchronous with B-waves of intracranial pressure (Lundar et al., 1990; Newell et al., 1992), they also are known as B-wave equivalents (BWE) (Droste et al., 1994). Although highly correlated with intracranial pressure, poor correlation is found between these fluctuations and ABP (Diehl et al., 1991; Newell et al., 1992). Droste and others (1994) report that BWE are more dominant and frequent during REM sleep and sleep stage 1 than during other sleep stages. They also found that peripheral resistance was lower and heart rate was higher at the peak of these oscillations. It has been proposed that such fluctuations in the CBF is caused by a phasic dilatation and contraction of the small regulating arteries, and these vasomotor waves produce fluctuations in cerebral blood volume, which are eventually reflected in the intracranial pressure (Auer and Gallhofer, 1981; Auer and Sayama, 1983; Mautner-Huppert et al., 1989; Diehl et al., 1991; Newell et al., 1992).
Slow fluctuations of CBF around 6 cycles/min have been reported by Diehl et al. (1991). These fluctuations can be detected by sophisticated power spectral analysis of the middle cerebral artery flow velocity (MCAFV), and were found to be distinguished from B-waves and not correlated with respiration. However, the property of these slow fluctuations of CBF was not understood. Fluctuations in the higher frequency range (around 15 cycles/min) also have been detected by power spectral analysis and have been noted to correlated with respiration (Newell et al., 1992). The respiration-related fluctuations in CBF were found to be prominent when respiratory movements were deep and slow (Diehl et al., 1995). Furthermore, it has been observed that the phase angle between such fluctuations and their ABP equivalent is correlated with CA (Diehl et al., 1995). The underlying mechanisms and potential clinical applications of these fluctuations in CBF remain to be explored.
Recent advances in TCD sonography and computer technique permit simultaneous recording and analysis of velocity signals from the intracranial arteries with other physiologic parameters. In addition, transfer function analysis in the frequency domain offers the capacity to describe the temporal and spatial relation between two physiologic signals. Our laboratory has successfully applied such techniques to study the underlying mechanisms of cardiovascular fluctuations (Yang et al., 1996; Kuo et al., 1996, 1997). This study categorizes the MCAFV fluctuations and explores the underlying mechanisms. We hypothesize that fluctuations in MCAFV can be classified into three components in the frequency domain. Such categorization is justified by transfer function analysis between MCAFV and ABP.
SUBJECTS AND METHODS
Thirty-three normal volunteers (14 men and 19 women) with a mean age of 36.7 ± 9.7 years (range, 22 to 59 years) were recruited for this study. All were healthy without history of diabetes mellitus or cardiovascular disease, which affects cardiovascular fluctuations (Malliani et al., 1991), and did not use drugs such as hypnotics or autonomic blockers, which have been reported to influence cardiovascular fluctuations. Complete physical and neurologic examinations were done for each subject. Color-coded duplex scan with 7.5-MHz probe (Acuson 128XP, Acuson, CA, U.S.A.) was performed to exclude carotid stenosis, and color-coded TCD imaging with 2 MHz was used to exclude the stenosis in the major arteries in the brain base. A written informed consent was obtained from each participant. All measurements were performed in supine position for 15 minutes.
Instantaneous ABP was recorded noninvasively by servo-controlled infrared finger plethysmography (Finapres, Model 2300, Ohmeda Monitoring Systems, Englewood, CT, U.S.A.). The MCAFV of left and right sides were recorded by a bilateral TCD monitor (Multi-Dop X/TCD 7, DWL, Sipplingen, Germany). The transducers were fixed in place, and MCAFV was continuously monitored at the depth of the best signal (44 to 55 mm). Both ABP and MCAFV signals were acquired, displayed, and stored to floppy disk by Multi-Dop X.
The analysis technique for ABP fluctuations has been documented previously (Kuo and Chan, 1993; Yang et al., 1995). The MCAFV signals were first normalized by mean MCAFV and were expressed by percentage variation from the mean MCAFV. This normalization procedure could exclude the recording bias induced by the angle of the ultrasound transducer, and makes the consequent spectral and transfer function analysis independent of absolute value of mean MCAFV. Original ABP and normalized MCAFV signals were subject to off-line spectral analysis by the construction of average periodogram (Yang et al., 1995; Yang et al., 1996). For this purpose, a 288-second segment of stable ABP and MCAFV signals was divided into eight sets of 64-second windows. Each set overlapped by 50%. Computation of the spectrum was performed using a fast Fourier transform. The ABP and MCAFV spectra obtained for the eight data sets were subsequently averaged to minimize contributions from variable noise and to sharpen reproducible spectral components. The computer program subsequently quantified each spectral component by the method of integration (i.e., calculation of power spectral density between two specified frequencies). We were particularly interested in the lower end of the frequency spectrum of ABP or MCAFV signals. These included very low-frequency (VLF, 0.016 to 0.04 Hz), low-frequency (LF, 0.04 to 0.15 Hz), and high-frequency (HF, 0.15 to 0.4 Hz). These frequency ranges were determined by those previously defined for heart rate variability (Anonymous, 1996).
Cross-spectral analysis was generated from the same eight data sets of ABP and MCAFV signals used in average periodogram analysis, which led to the estimation of two functions (Kuo et al., 1997; Stearn and David 1988). First, a magnitude-squared coherence function [k2(f) = ǀSVB(f)2/((SBB(f) × SVV(f))], where SBB(f) and SVV(f) are the respective power spectrum of ABP and MCAFV signals, and SVB(f) is their cross-spectrum. The value of coherence function ranges from 0 to 1 and provides an assessment of the linear relation at each frequency and of the statistical reliability of transfer function. For this purpose, a coherence ≧ 0.5 was considered to be statistically significant (Yang et al., 1996; DeBoer et al., 1987; Pagani et al., 1986). Since SNR(f) = k2(f)/(1 – k2(f)), where SNR(f) is the signal-to-noise ratio of signals, 0.5 ≦ k2(f) ≦ 1 represented 1 ≦ SNR(f) ≦ ∞ (Stearns and David, 1988). Second, the transfer function H(f) = SVB/SBB(f) with a magnitude defined as {[HR(f)]2 + [H1(f)]2}1/2 where HR(f) and HI(f) are the real and imaginary parts of the complex transfer function, and is expressed as U/mm Hg. The phase of transfer function is defined as φ(f) = tan−1 [H1(f)/HR(f)] with the unit of degree.
Coherence, transfer phase, and magnitude were quantified in individual HF, LF, and VLF ranges. For each frequency range, an oscillating frequency was first defined at which the coherence function exhibit the largest value. Then coherence, transfer phase, and magnitude of the oscillating frequency were selected. This algorithm ensured the highest reliability for quantifying the transfer function. Furthermore, linear regression analysis between oscillating frequency and phase, magnitude, or coherence was performed to detect their frequency dependence. If the phase function is linear to the oscillating frequency, indicating a pure time delay between ABP and MCAFV fluctuations, the time delay can be estimated by dividing the slope by 360° (Kuo et al., 1997).
All of the measurement values are expressed as mean ± SD. The paired t-test was performed. The statistical significance was defined as P < 0.05.
RESULTS
The mean and SD of static ABP, LMCAFV, and RMCAFV were 95.3 ± 13.1 mm Hg, 57.9 ± 12.9 cm/second and 60.0 ± 13.3 cm/second, respectively. Poor correlation was observed between mean ABP and mean MCAFV (r = 0.0003). Fluctuations in ABP and MCAFV were demonstrated in both time (Fig. 1A) and frequency domains (Fig. 1B). Most significant fluctuation in the ABP and MCAFV was contributed by heart beat, which was represented by a dominant power located at about 1.3 Hz in frequency domain, corresponding to 78 beats per minute, with several harmonic peaks in the higher frequency ranges (2.6, 3.9, 5,2, 6.5 Hz). However, some concentrated power in the lower frequency ranges (0.03, 0.09, 0.3 Hz) also could be identified, indicating fluctuations under different mechanism. The power in the frequency ranges lower then 0.4 Hz could be identified by HF, LF, and VLF components. Figure 2 gives a detailed picture of the three components where only frequencies up to 0.5 Hz are shown. Notice the similarity between ABP and MCAFV autospectrograms.
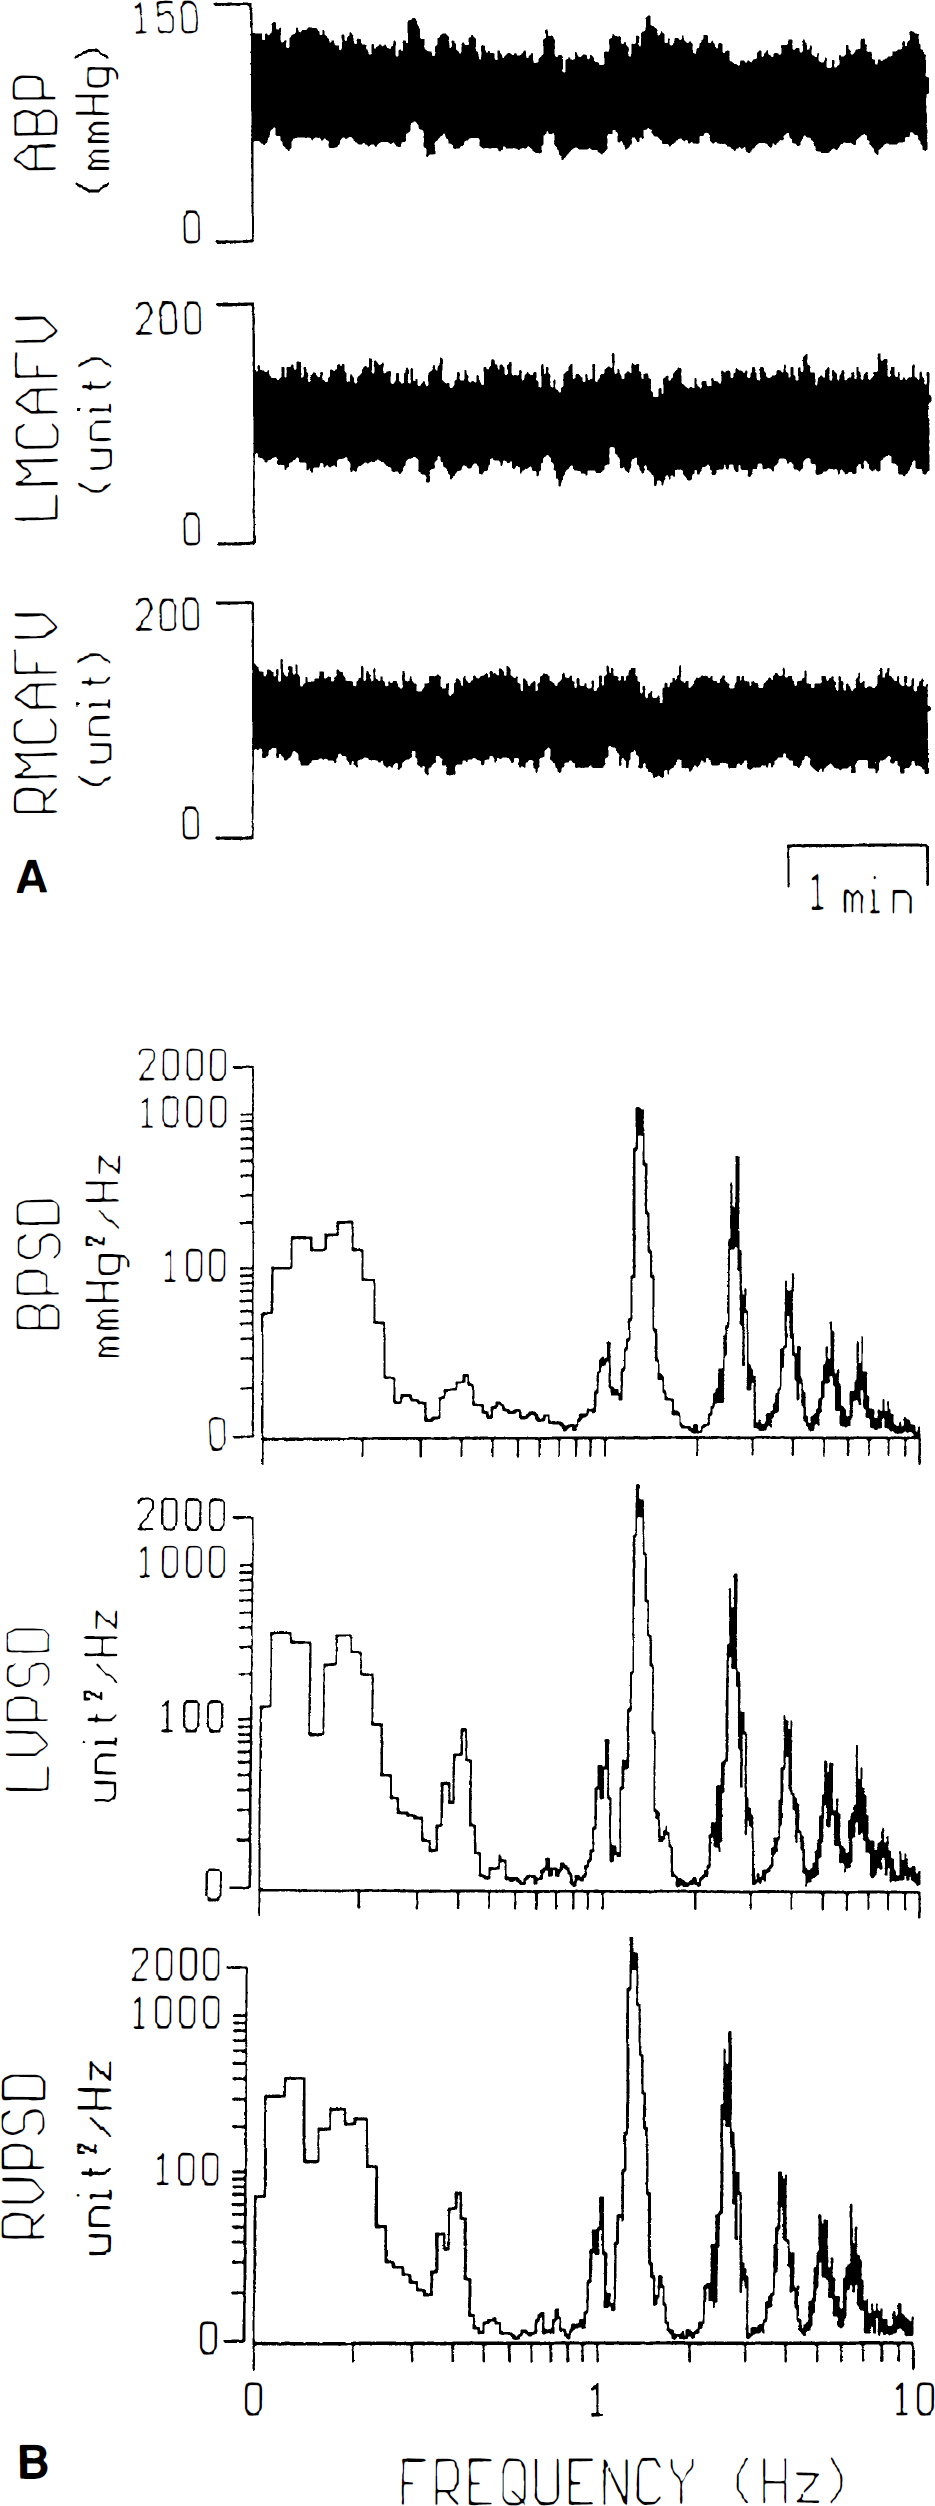
Representative figures in time (
Figure 3 offers comparisons of each component of left and right MCAFV, and the quantification of each component in ABP spectrum. The LF component is the most dominant among the three components, both for ABP and MCAFV spectra. No significant difference was found between fluctuations of left and right MCAFV.
Cross-spectral analysis (Fig. 2) makes a good description of the relation between ABP and MCAFV fluctuations along various frequency ranges. High coherence (r ≧ 0.5) usually was noted in the HF and LF ranges but seldom in the VLF range, indicating colinearity between ABP and MCAFV fluctuations in the HF and LF ranges. The transfer phase and magnitude of these three frequency components are statistically described in Fig. 4, along with their oscillating frequency and coherence. The mean of coherence in the VLF range is less than 0.5, and the transfer phase in the HF range is significantly less than that in the LF (P < 0.001) range. There are also no significant difference between parameters of left and right MCAFV.
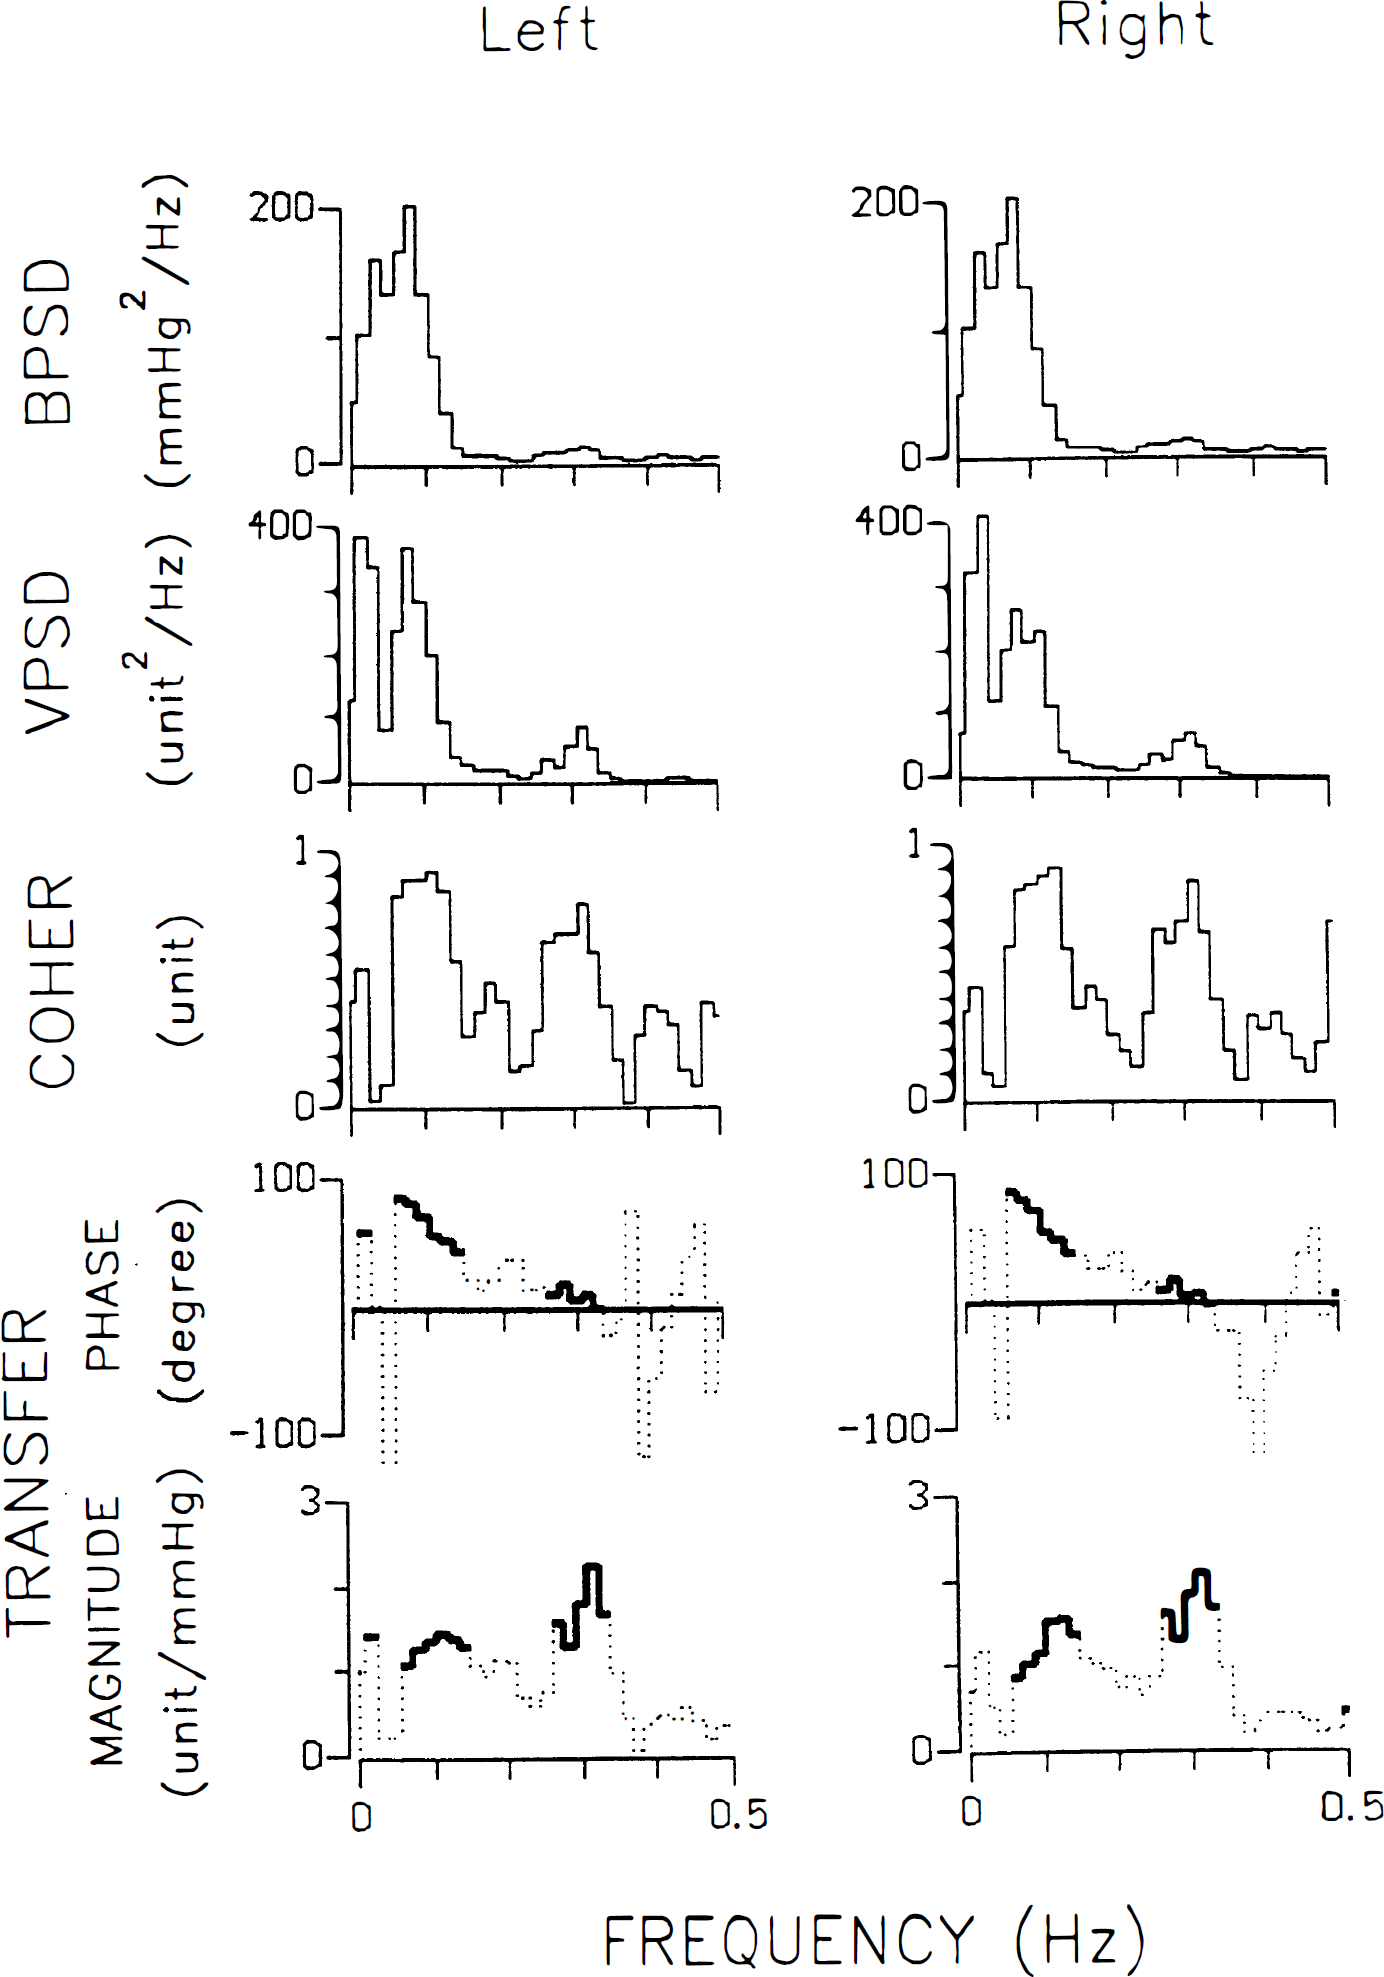
Representative figures of average periodograms of arterial blood pressure (BPSD) and blood flow velocity of middle cerebral artery (VPSD), and cross-spectral analysis showing coherence (COHER), transfer phase, and magnitude in the left and right sides.
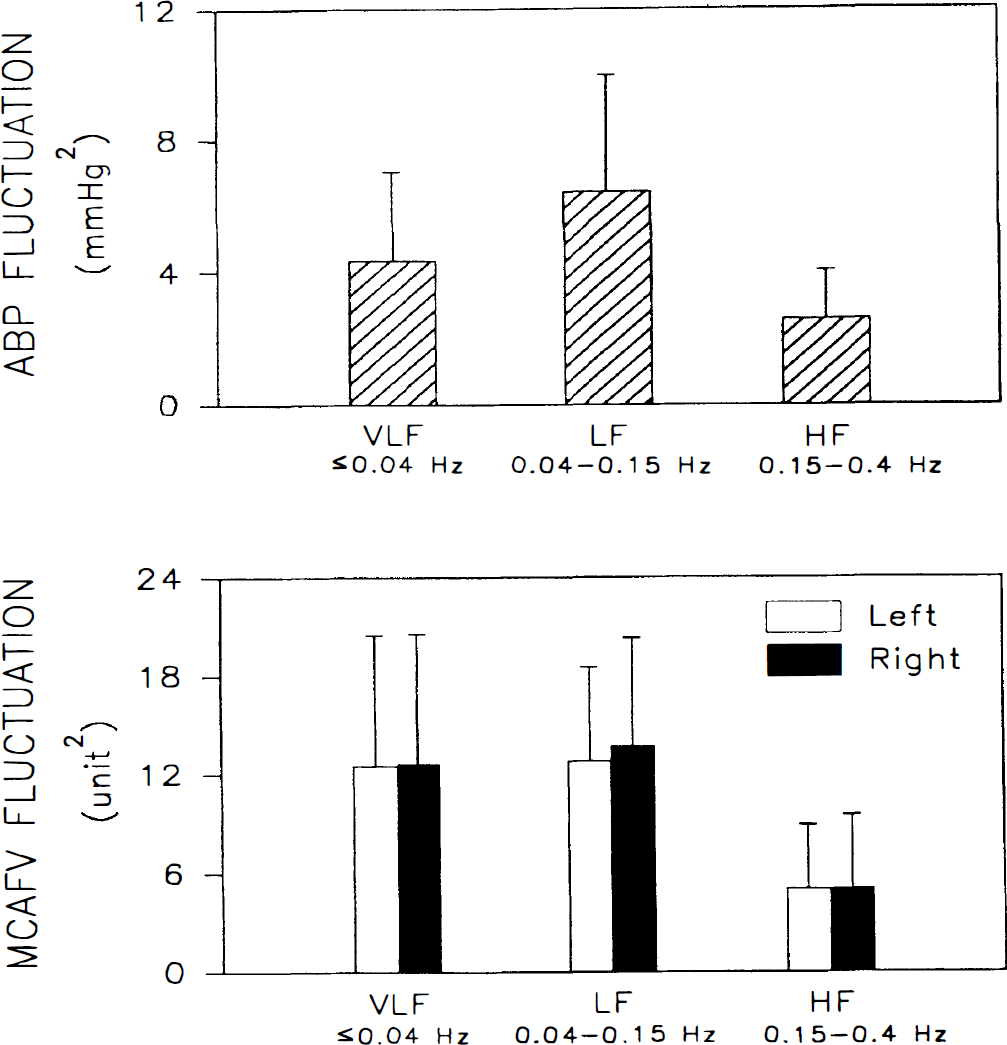
Bar chart showing mean and SD of powers of the very low-frequency (VLF), low-frequency (LF), and high-frequency (HF) fluctuations in arterial blood pressure and blood flow velocity of left and right middle cerebral arteries.
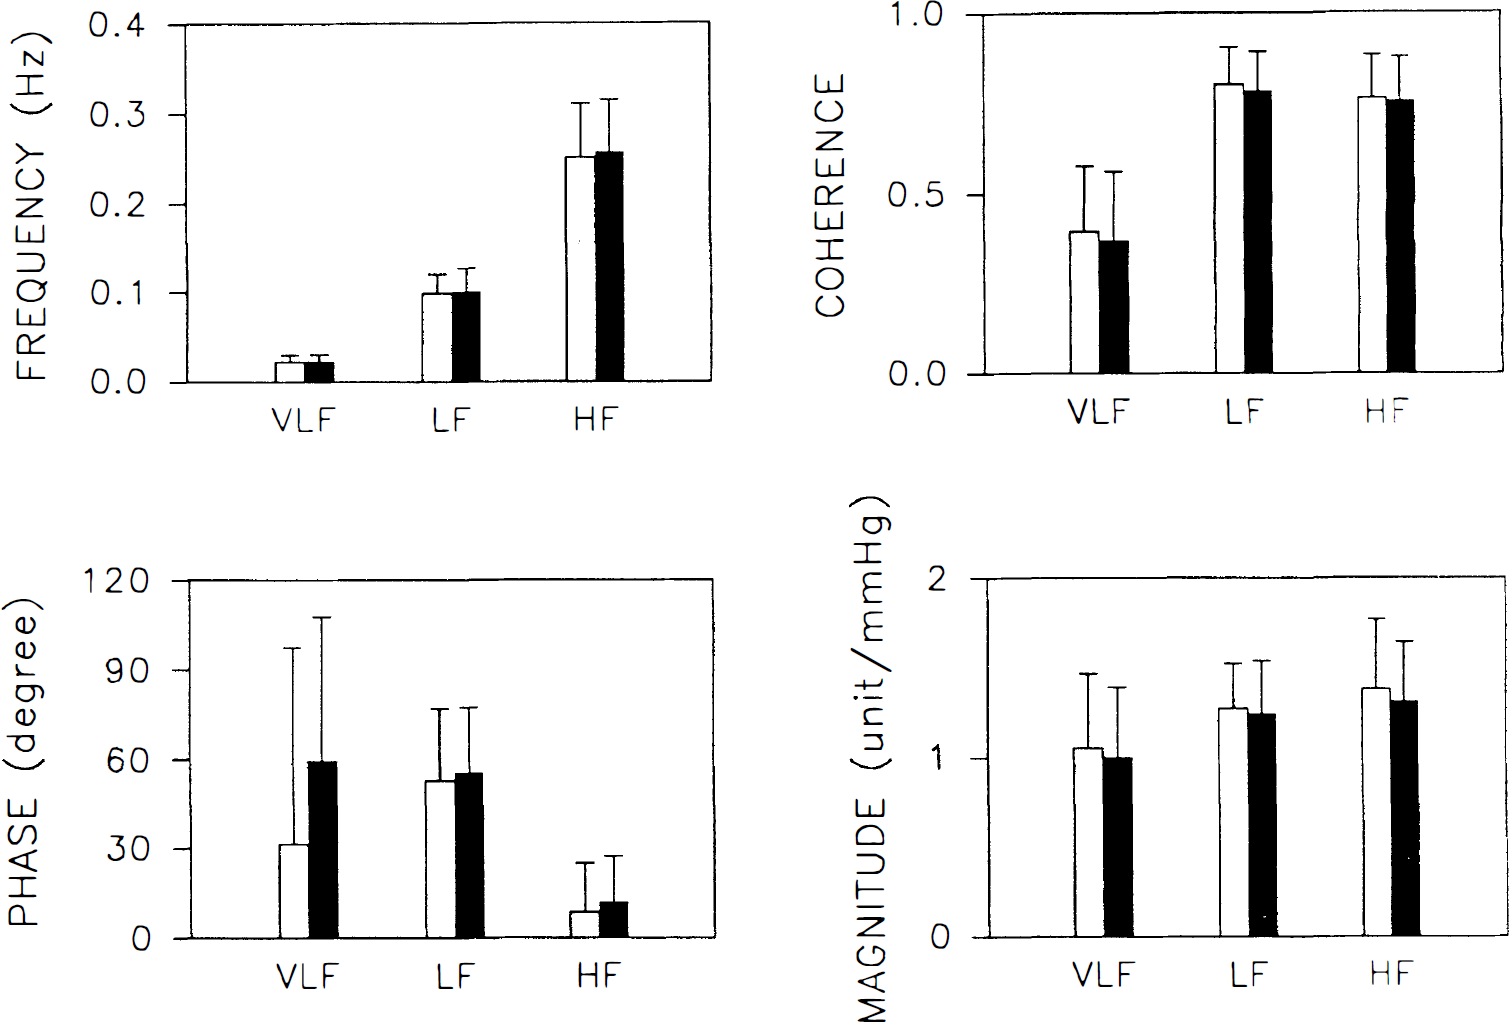
Bar chart showing mean and SD of oscillating frequency (FREQUENCY) and corresponding coherence, transfer phase, and magnitude between arterial blood pressure and middle cerebral artery flow velocity in the left and right sides. (□) ABP versus left MCAFV. (▪) ABP versus right MCAFV.
The frequency dependence of ABP-MCAFV coherence, transfer phase, and magnitude was further evaluated by linear regression analysis (Fig. 5). We found that the transfer phase exhibited high r value with oscillating frequency in the LF range (y = 129 − 757x, r = −0.79, P < 0.001), indicating good frequency dependence. The time delay for LF fluctuations in MCAFV compared with those in ABP was evaluated as 2.1 seconds (757/360). The frequency dependence of the transfer phase in HF range was fair (y = 48 − 147x, r = −0.54, P < 0.001), with a time delay of 0.41 seconds (147/360). The transfer phase in VLF range, and magnitude and coherence in all frequency ranges, failed to exhibit high r value with oscillating frequency (all < 0.5).
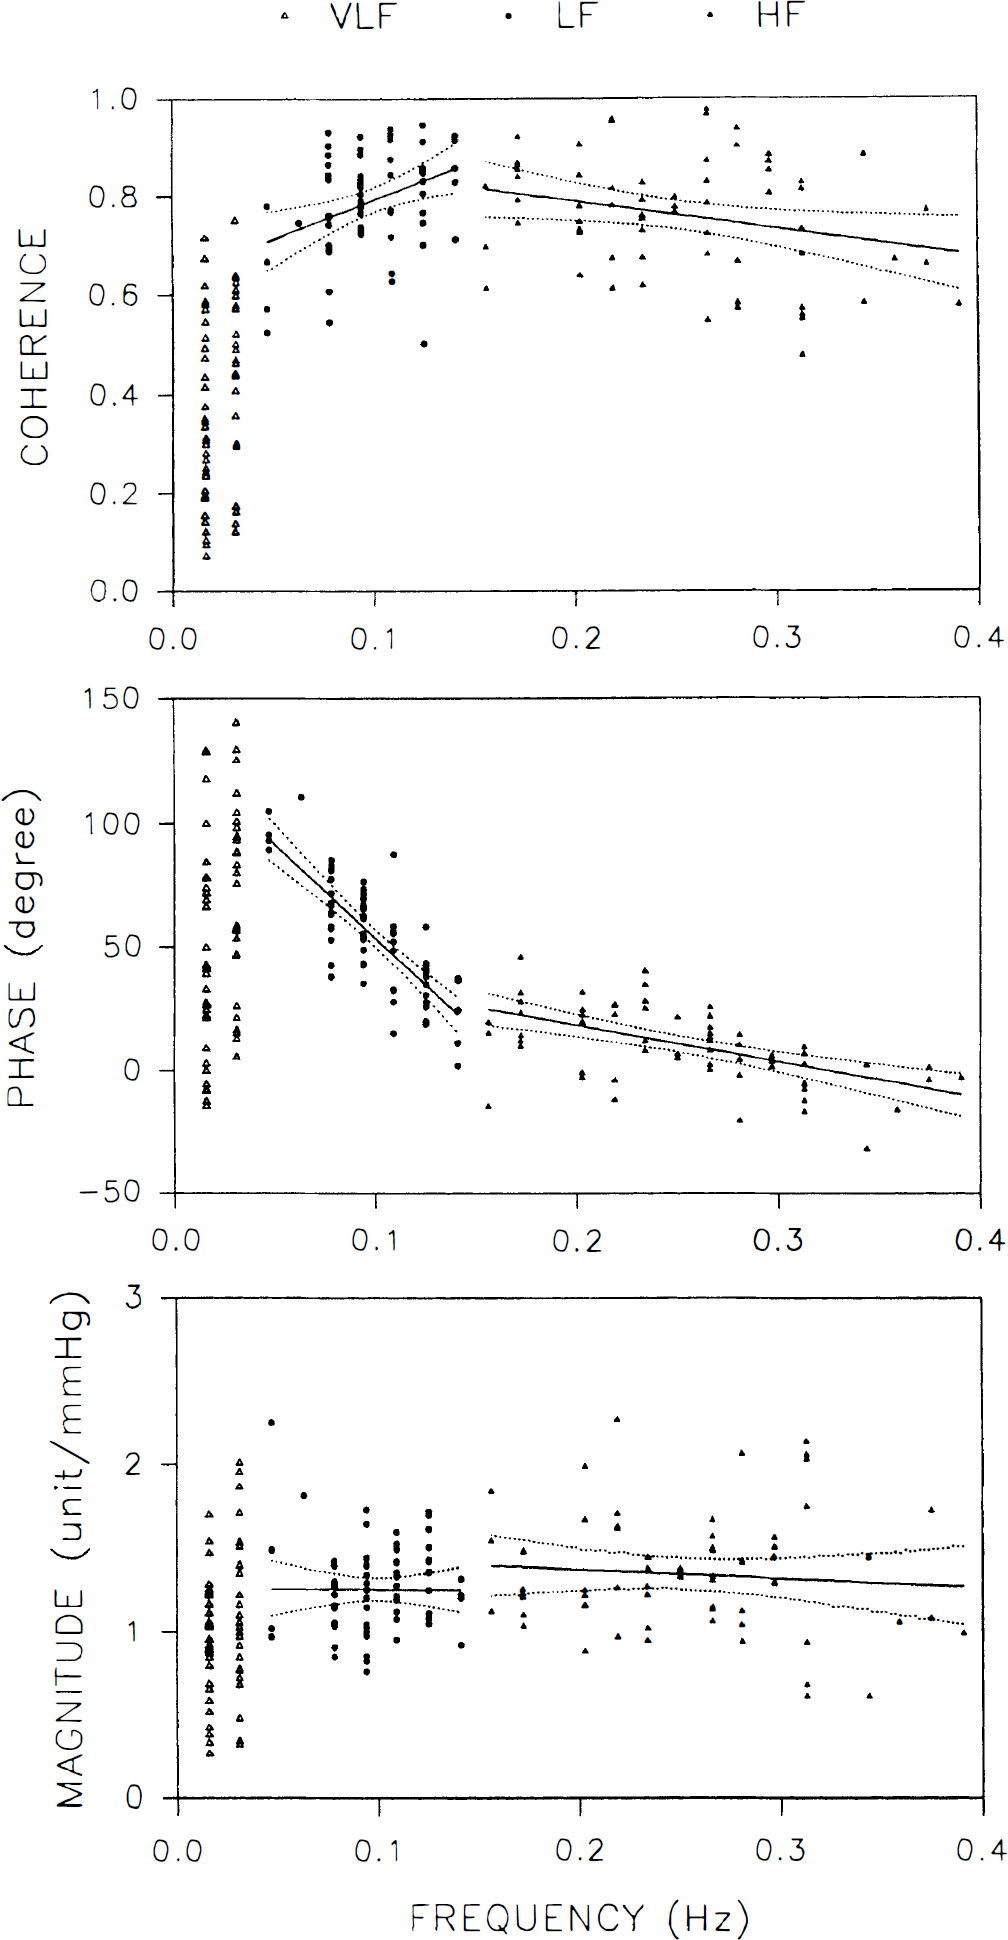
Two-dimensional scattergram showing the relation between oscillating frequency and corresponding coherence, transfer phase, and magnitude between arterial blood pressure middle cerebral artery flow velocity in the very low-frequency (VLF), low-frequency (LF) and high-frequency (HF) frequency ranges. Also shown are the regression line and 95% confidence intervals.
DISCUSSION
The middle cerebral artery (MCA) carries approximately 80% of the flow volume received by the cerebral hemisphere (Toole, 1984), therefore MCA flow is a good representative of CBF. However, the current technique of TCD only can directly detect MCAFV, not MCA flow. The validity of using TCD to estimate MCA flow has been previously studied, and a good correlation between MCAFV and MCA flow was reported (Lindegaard et al., 1987; Aaslid et al., 1991; Newell et al., 1994). Relative changes in MCAFV spectral outline accurately reflect relative changes in internal carotid flow during dynamic autoregulation testing in humans (Newell et al., 1994). A constant diameter of insonated vessel (i.e., the MCA) is required during the autoregulation test to interpret relative changes in MCAFV as relative CBF changes (Kontos, 1989). There is, however, considerable evidence that MCA diameter remains practically constant during different autoregulation tests (Tiecks et al., 1995). Therefore, relative changes in MCAFV should represent relative change in CBF. In this study, we managed our MCAFV data as a percentage variation from the mean to represent relative change in CBF.
Frequency domain analysis of cardiovascular parameters, mainly ABP and heart rate signals, recently has gained popularity with broad clinical applications (Akselrod, 1988; Malliani et al., 1991). Spontaneous fluctuations in ABP had been long noted by physiologists (Guyton and Harris, 1951) but was difficult to study until the recent introduction of frequency domain analysis. It is now generally accepted that ABP fluctuations can be classified into various frequency components with different underlying mechanisms. The HF component originates from fluctuations in cardiac output induced by respiratory movement (Kuo et al., 1996). The LF component originates from fluctuations in sympathetic vasomotor control by the central nervous system (Kuo et al., 1997). The mechanism of VLF is more ambiguous and was thought to be generated by thermoregulation or the hormonal system (Malliani et al., 1991). These mechanisms, as a whole, generate various spontaneous fluctuations in ABP below 0.4 Hz.
The application of frequency domain analysis applied to CBF (Diehl et al., 1991; Newell et al., 1992) was not used until the discovery of CBF fluctuations (Lindegaard et al., 1987), which was relatively late compared with its use for cardiovascular parameters. Most of the previous studies dealt with fluctuations within the frequency range of 0.5 to 2 cycles/min (0.008 to 0.033 Hz), which was also known as BWE (Droste et al., 1994). Reports concerning fluctuations at higher frequency ranges were sporadic (Diehl et al., 1991; Newell et al., 1992; Diehl et al., 1995), with few discussing their underlying mechanism. In this study, using autospectral and cross-spectral analysis technique, we found that all of the study participants in supine position exhibited HF, LF, and VLF fluctuations in MCAFV. The fluctuations under various frequency ranges may have different underlying mechanisms. The VLF component is equivalent to so-called BWE and exhibited 41% of total power of MCAFV fluctuations between 0.016 and 0.4 Hz. Cross-spectral analysis revealed low coherence between the VLF component of MCAFV and that of ABP, indicating poor relation between BWE and ABP, which is consistent with previous findings (Diehl et al., 1991; Newell et al., 1992). It has been reported that such fluctuations in CBF are caused by a phasic dilation and contraction of the small regulating arteries (Newell et al., 1992; Droste et al., 1994). A mechanism intrinsic to the arterial smooth-muscle cells in the regulating arteries may be responsible (Auer and Sayama et al., 1983). Other intrinsic brain stem pacemakers that alter other physiologic parameter as well as CBF at a regular frequency also were proposed (Higashi et al., 1989; Maeda et al., 1986; Newell et al., 1992). The underlying mechanism remains to be verified.
The LF fluctuations usually are noted in ABP or heart rate signals and have been proved to be correlated to sympathetic vasomotor activity (Malliani et al., 1991; Kuo et al., 1997). However, such fluctuations were rarely reported in CBF (Diehl et al., 1991). In this study, autospectral analysis revealed that LF fluctuations exhibited 43% of total power of slow MCAFV fluctuations in our health volunteers. In contrast to the VLF component, coherence analysis revealed great similarity between the LF component of MCAFV and that of ABP. The transfer phase within LF range has a steeper slope, indicating that the MCAFV response to LF fluctuations of ABP is not passive. Such characteristics may result from the special mechanism in cerebrovascular regulation, that is, CA. We believe that LF fluctuations of MCAFV are passively responsive to LF fluctuations of ABP with the additional involvement of CA. The possible participation of baroreflex, however, cannot be completely ruled out (DeBoer et al., 1987).
Respiration-related fluctuations in cardiovascular parameters are designated by HF component in terms of frequency domain analysis (Malliani et al., 1991). The HF component is important in the analysis of heart rate variability, which generally is known as respiratory sinus arrhythmia (Akselrod et al., 1981). The importance of HF component of ABP also was under investigation (Kuo et al., 1996). However, such component was found to be ambiguous in blood flow signal both in peripheral (Cevese et al., 1995) and central (Diehl et al., 1991; Newell et al., 1992) circulation. In this study, we clearly demonstrated the existence of HF component in MCAFV, although its power is relatively small (about 16% of total power). Coherence analysis revealed great similarity between HF component of MCAFV and that of ABP. In contrast to the LF component, the transfer phase within HF range is near the zero degree, indicating that the MCAFV response to HF fluctuations of ABP is almost synchronous. Such synchronization in the phase implied the absence of CA in the HF range. Therefore, we believe that HF fluctuations of MCAFV is simply passive to HF fluctuations of ABP without efficient involvement of CA.
The term CA refers to the ability in the brain to maintain CBF constant during changes in ABP (Lassen, 1959; Strandgaard and Paulson, 1984; Paulson et al., 1990; Tiecks et al., 1995). According to our data, spontaneous fluctuations in ABP, either in LF or HF ranges, can induce parallel fluctuations in MCAFV. However, we believed that CA may operate efficiently in LF rather than HF range, as evidenced by the differential phase shift between the two frequency ranges. Diehl and others (1995) demonstrated that CA may cause a phase shift between fluctuations of ABP and MCAFV induced by deep breathing. In our study, a comparable finding was observed in the spontaneous fluctuations of ABP and MCAFV within the LF range. Furthermore, within the LF range, we found that the transfer phase is linear to oscillating frequency, indicating a constant time delay (2.1 seconds) between LF fluctuations of ABP and their MCAFV response. The time delay may result from the response latency of CA. Previously reported CA time latency varied from tenths of seconds (Gurdjian et al., 1958; Rapela and Green, 1964), to less than 1 second (Symon et al., 1973), to about 2 seconds (Aaslid et al., 1989, 1991) to 5 seconds (Kontos et al., 1978). Our data are more compatible with those reported by Aaslid and associates (1989, 1991). The absence of active regulation within HF range may be caused by the limitation from frequency response of the CA mechanism. In other words, CA failed to regulate CBF fluctuations faster than 0.15 Hz. Our study also indicates that it is possible to use spontaneous fluctuations in ABP as an input signal to evoke and test CA without the introduction of variations in ABP by traditional physiologic or pharmacologic manipulation (Tiecks et al., 1995).
With the application of spectral and transfer function analyses in frequency domain, we found that slow fluctuations of MCAFV can be classified into three different groups. Autospectrogram of MCAFV exhibited several components in HF, LF, and VLF ranges, implying different mechanisms. Coherence analysis between ABP and MCAFV spectrogram revealed a colinearity (similarity) of these two signals in HF and LF ranges. The LF fluctuations in MCAFV exhibited a frequency-dependent phase shift from ABP. Based on current knowledge of ABP and CBF regulation, we concluded that there are at least three mechanisms underlying CBF fluctuations. The HF fluctuations of CBF are secondary to HF fluctuations of ABP induced by respiration; LF fluctuations of CBF are secondary to LF fluctuations of ABP, which originate from peripheral vasomotor activity and are additionally modified by CA with a time delay; and VLF fluctuations of CBF, which are not correlated to ABP and respiration, however, are parallel to traditional BWE. The ABP-CBF frequency response and the involvement of CA in the regulation of CBF fluctuations are being explored under various physiologic and pathologic states in our laboratory. We believe that the detection of CBF velocity by TCD coupling with frequency domain analysis of multiple physiologic signals including ABP may provide a powerful yet noninvasive technique for accessing cerebrovascular regulation that could, consequently, benefit clinical practice.