
Abstract
The coupling of oxidative metabolism to the blood flow of the sensory motor hand area is uncertain. The authors tested the hypothesis that continued vibrotactile stimulation ultimately must lead to increased oxygen consumption consumption. Twenty-two healthy right-handed young volunteers underwent positron emission tomography (PET) with the [15O]water bolus injection method to measure water clearance (K H 2 O 1 an index of blood flow (CBF), and with the [15O]oxygen bolus inhalation method to measure CMR O 2 . The CMR O 2 was measured 30 seconds and 20 minutes after onset of intermittent (1 second on, 1 second off) vibrotactile stimulation (110 Hz) and compared with baseline measurements without stimulation. The K H 2 O 1 and CMR O 2 changes (ΔK H 2 O 1 and ΔCMR O 2 ) were determined using intersubject averaging, together with magnetic resonance imaging based stereotaxic registration technique. The K H 2 O 1 increase was 21 ± 4% and 12 ± 4% at 30 seconds and 20 minutes after onset of stimulation, respectively. No significant increase of CMR O 2 was found until 30 minutes after the onset of stimulation. The authors conclude that blood flow and oxidative metabolism undergo uncoupling during sustained phasic stimulation of the sensory hand area. Therefore, neuronal activity stimulated in this manner does not rely on significantly increased oxidative phosphorylation.
Keywords
It is generally contended that increased CBF delivers proportionate quantities of oxygen and glucose to cover the energy metabolism assumed to be elevated in active neurons (Roy and Sherrington, 1890). The degree to which the contention applies to unsteady states is controversial. Fox and colleagues (1986) observed that regional cerebral blood flow (rCBF) and oxygen metabolism in the sensory hand area did not rise in proportion during vibrotactile stimulation; no more than a 5% increase of CMR O 2 accompanied a 29% elevation of rCBF in the primary sensory hand area during vibrotactile stimulation. The same authors demonstrated proportional increases of CBF and glucose phosphorylation during visual stimulation but could demonstrate no increase of CMR O 2 (Fox et al., 1988a). In contrast, Roland et al. (1986), Marrett et al. (1997), and Vafaee et al. (1998a,b) report increases of both rCBF and regional CMR O 2 for different kinds of stimuli, although oxidative metabolism rarely rose in proportion to blood flow.
These observations raise the question of which mechanism couples oxidative metabolism to neuronal work, specifically with respect to the extent to which the mechanism is activated during vibrotactile stimulation of neurons in somatosensory cortex of mammalian brain. Although the concept of oxygen “debt” is obsolete (Gjedde, 1997), it is unknown how long nonoxidative glucose metabolism can supply sufficient energy to sustain continuously increased neuronal activity.
If the rise in blood flow reflects a substantial increase of energy demand, oxygen consumption must eventually rise to maintain steady-state metabolite levels. On the other hand, if a significant increase of oxygen consumption never accompanies a blood flow increase, energy demands cannot rise much during the type of neuronal activation under study.
To test the hypothesis that increased energy metabolism ultimately must lead to increased oxygen consumption, we measured the relation between CBF and CMR O 2 during continued neuronal excitation by a vibrotactile stimulus to 1) reveal the degree of coupling between the variables, and 2) answer the question whether the regional CMR O 2 increases after extended activation, or whether the cortex, excited by a vibrotactile stimulus, needs no additional oxidative metabolism to satisfy the energy demands.
METHODS
Subjects
Twenty-two healthy, right-handed volunteers were screened for apparent neurologic deficits. Informed consent to the protocol approved by the Research and Ethics Committee of the Montreal Neurological Institute and Hospital (Montreal, Canada) was obtained from each participant. We measured the regional water clearance (K H 2 O 1) by the intravenous H215O bolus method (Ohta et al., 1996; Fujita et al., 1997) and the regional CMR O 2 by the one-step [15O]O2 bolus inhalation technique (Ohta et al., 1992).
Radioisotope preparation and tomograph operation
The tracers H215O and [O15]O2 were prepared with the aid of a Japanese Steel Works Medical Cyclotron (BC-107). The tomography used the Scanditronix (Uppsala, Sweden) PC-2048 15B, an eight-ring, 15-section BGO head tomograph with a transverse resolution of 5.8 to 6.4 mm and an axial resolution of 6.1 to 7.1 mm full width half maximum (FWHM). Its count rate efficiency is 9.7 kcps/(μCi·ml−1) for the direct and 13.7 kcps/(μCi·ml−1) for the cross-slices. Reconstruction software included corrections for random and scattered events, detector efficiency variations, and dead time. An orbiting rod transmission source containing 5 mCi of 68Ge was used for attenuation correction (Evans et al., 1991). For image averaging, a 20-mm FWHM Hanning filter was used during image reconstruction.
Subject preparation
The subjects were positioned in the tomograph with their heads immobilized in a headrest of self-inflating foam. A short catheter was placed in the left radial artery for blood sampling.
H215O study
A bolus of approximately 40 mCi H215O was injected into the brachial vein of the right arm. Arterial blood sampling and dynamic imaging began at injection time. Dynamic scans with frame durations of 12 × 5 seconds, 6 × 10 seconds, and 3 × 20 seconds were obtained over a period of 3 minutes and corrected for decay according to the method of Raichle et al. (1983). Arterial blood samples were collected manually at approximately 5-second intervals and assayed in a well-counter calibrated to the tomograph. The delay in tracer arrival between the brain and the peripheral sampling site was corrected according to the global fitting method of Iida et al. (1988). For dispersion correction, a time constant of 4 seconds was used (Iida et al., 1986; Meyer, 1989). Regional K H 2 O 1 maps were generated according to the two-compartment model of Ohta et al. (1996). This approach allowed us to measure the water clearance of cerebral tissue without interference from intravascular radioactivity (Fujita et al., 1993, 1997).
[15O]O2 study
To measure CMR O 2 , we used the one-step method of Ohta et al. (1992), which requires only 3 minutes of data acquisition during a single bolus inhalation of [15O]O2. Tracer [15O]O2 was supplied from the cyclotron to a lead-shielded rubber bag of medical air at the subject's side where it was mixed. After sufficient activity had accumulated, the subject, wearing a nose clamp, inhaled the gas (60 to 80 mCi) through a mouthpiece and a short connecting ventilator hose by taking a single deep breath and holding it for about 10 seconds. Arterial blood sampling and dynamic scanning began at the time of inhalation. Scanning data collection and arterial blood sampling were performed as for the H215O studies. The CMR O 2 maps were generated using the weighted integration method with tracer delay and dispersion corrections as described earlier.
Positron emission tomography-magnetic resonance imaging correlation
All subjects also underwent a magnetic resonance (MR) imaging examination on a Philips Gyroscan, 1.5-T superconducting magnet system (Amsterdam, The Netherlands). The MR imaging data, with a volume consisting of 64 contiguous planes of 2-mm thickness, was coregistered with the positron emission tomography (PET) data by the procedure developed by Evans et al. (1992).
Vibrotactile stimulation
Vibrotactile stimulation was performed with a mechanical vibrator (Model 91, Daito, Osaka, Japan) fixed to the five finger tips of the right hand and held in place with tape to maintain a uniform pressure throughout the stimulation period. A vibration frequency of 110 Hz was chosen, and the vibrator was turned on and off at 1-second intervals (1 second on, 1 second off) to minimize adaptation (Applegate et al., 1988). The nominal vibration amplitude was 2 mm. The subjects were asked to focus their attention on the vibrotactile stimulus to achieve a maximum change in cerebral activity (Meyer et al., 1991). Two durations of continuous vibrotactile stimulation were selected: 30 seconds and 20 minutes. Thus, in the 20-minute measurement, for instance, vibrotactile stimulation was initiated 20 minutes before PET scanning and blood sampling were started. Stimulation was continued throughout the 3-minute scanning period both in the water (K H 2 O 1) and oxygen (CMR O 2 ) studies.
Experimental plan
All subjects underwent four or five tomography sessions, including two water studies and two or three oxygen studies. All studies were counterbalanced to avoid an effect of order. The original plan called for the same number of sessions in all subjects, but technical problems required the cancellation of occasional runs. In total, the 22 subjects underwent 44 water studies and 51 rather than 66 matched oxygen studies.
All 22 subjects underwent a baseline measurement of CBF. In 17 of the 22 subjects, CBF also was measured during neuronal excitation 30 seconds after the onset of vibrotactile stimulation, which continued throughout the 3-minute measurement. In the remaining five subjects, CBF was measured 20 minutes after the onset of stimulation.
Each subject had a baseline CMR O 2 study. In seven subjects, CMR O 2 measurements were made 30 seconds and 5 minutes after the onset of stimulation in six subjects, and 30 seconds and 30 minutes after the onset of stimulation in one subject. The remaining 15 subjects had CMR O 2 measurements after 10, 20, or 30 minutes of stimulation. Two of the seven CMR O 2 measurements at the 30-second stimulation were discarded for technical reasons. The waiting period between successive experiments (stimulus onset) was 15 minutes.
Data analysis
Each PET image data set was first correlated with its corresponding MR imaging volume using a three-dimensional landmark-matching algorithm (Evans et al., 1989, 1991). After calculation from the raw PET activity images, parametric images were transformed to Talairach's stereotaxic space (Talairach and Tournoux, 1988) using the MR imaging volume for identification of the bicommissural plane (Evans et al., 1992). For each subject, subtraction images were made by subtracting baseline PET images from activation PET images for both K H 2 O 1 and CMR O 2 studies after normalization of each scan with respect to its mean whole-brain value.
Individual subtractions were analyzed according to the method of Worsley and associates (1992), which yields a mean percentage change image of the parameter under investigation and a t statistic image, calculated by dividing the average change image by the average (pooled) SD across voxels, to allow the identification of significant peaks in the subtraction image. Merging of the t statistic image with the mean stereotaxic MR image yielded the activation peaks superimposed on the anatomical regions. Use of the mean MR imaging, which is blurred by residual anatomical variability among subjects after stereotaxic transformation, provides a truer measure of the equivalence of the individual subjects' neuroanatomy than simple use of the idealized Talairach template.
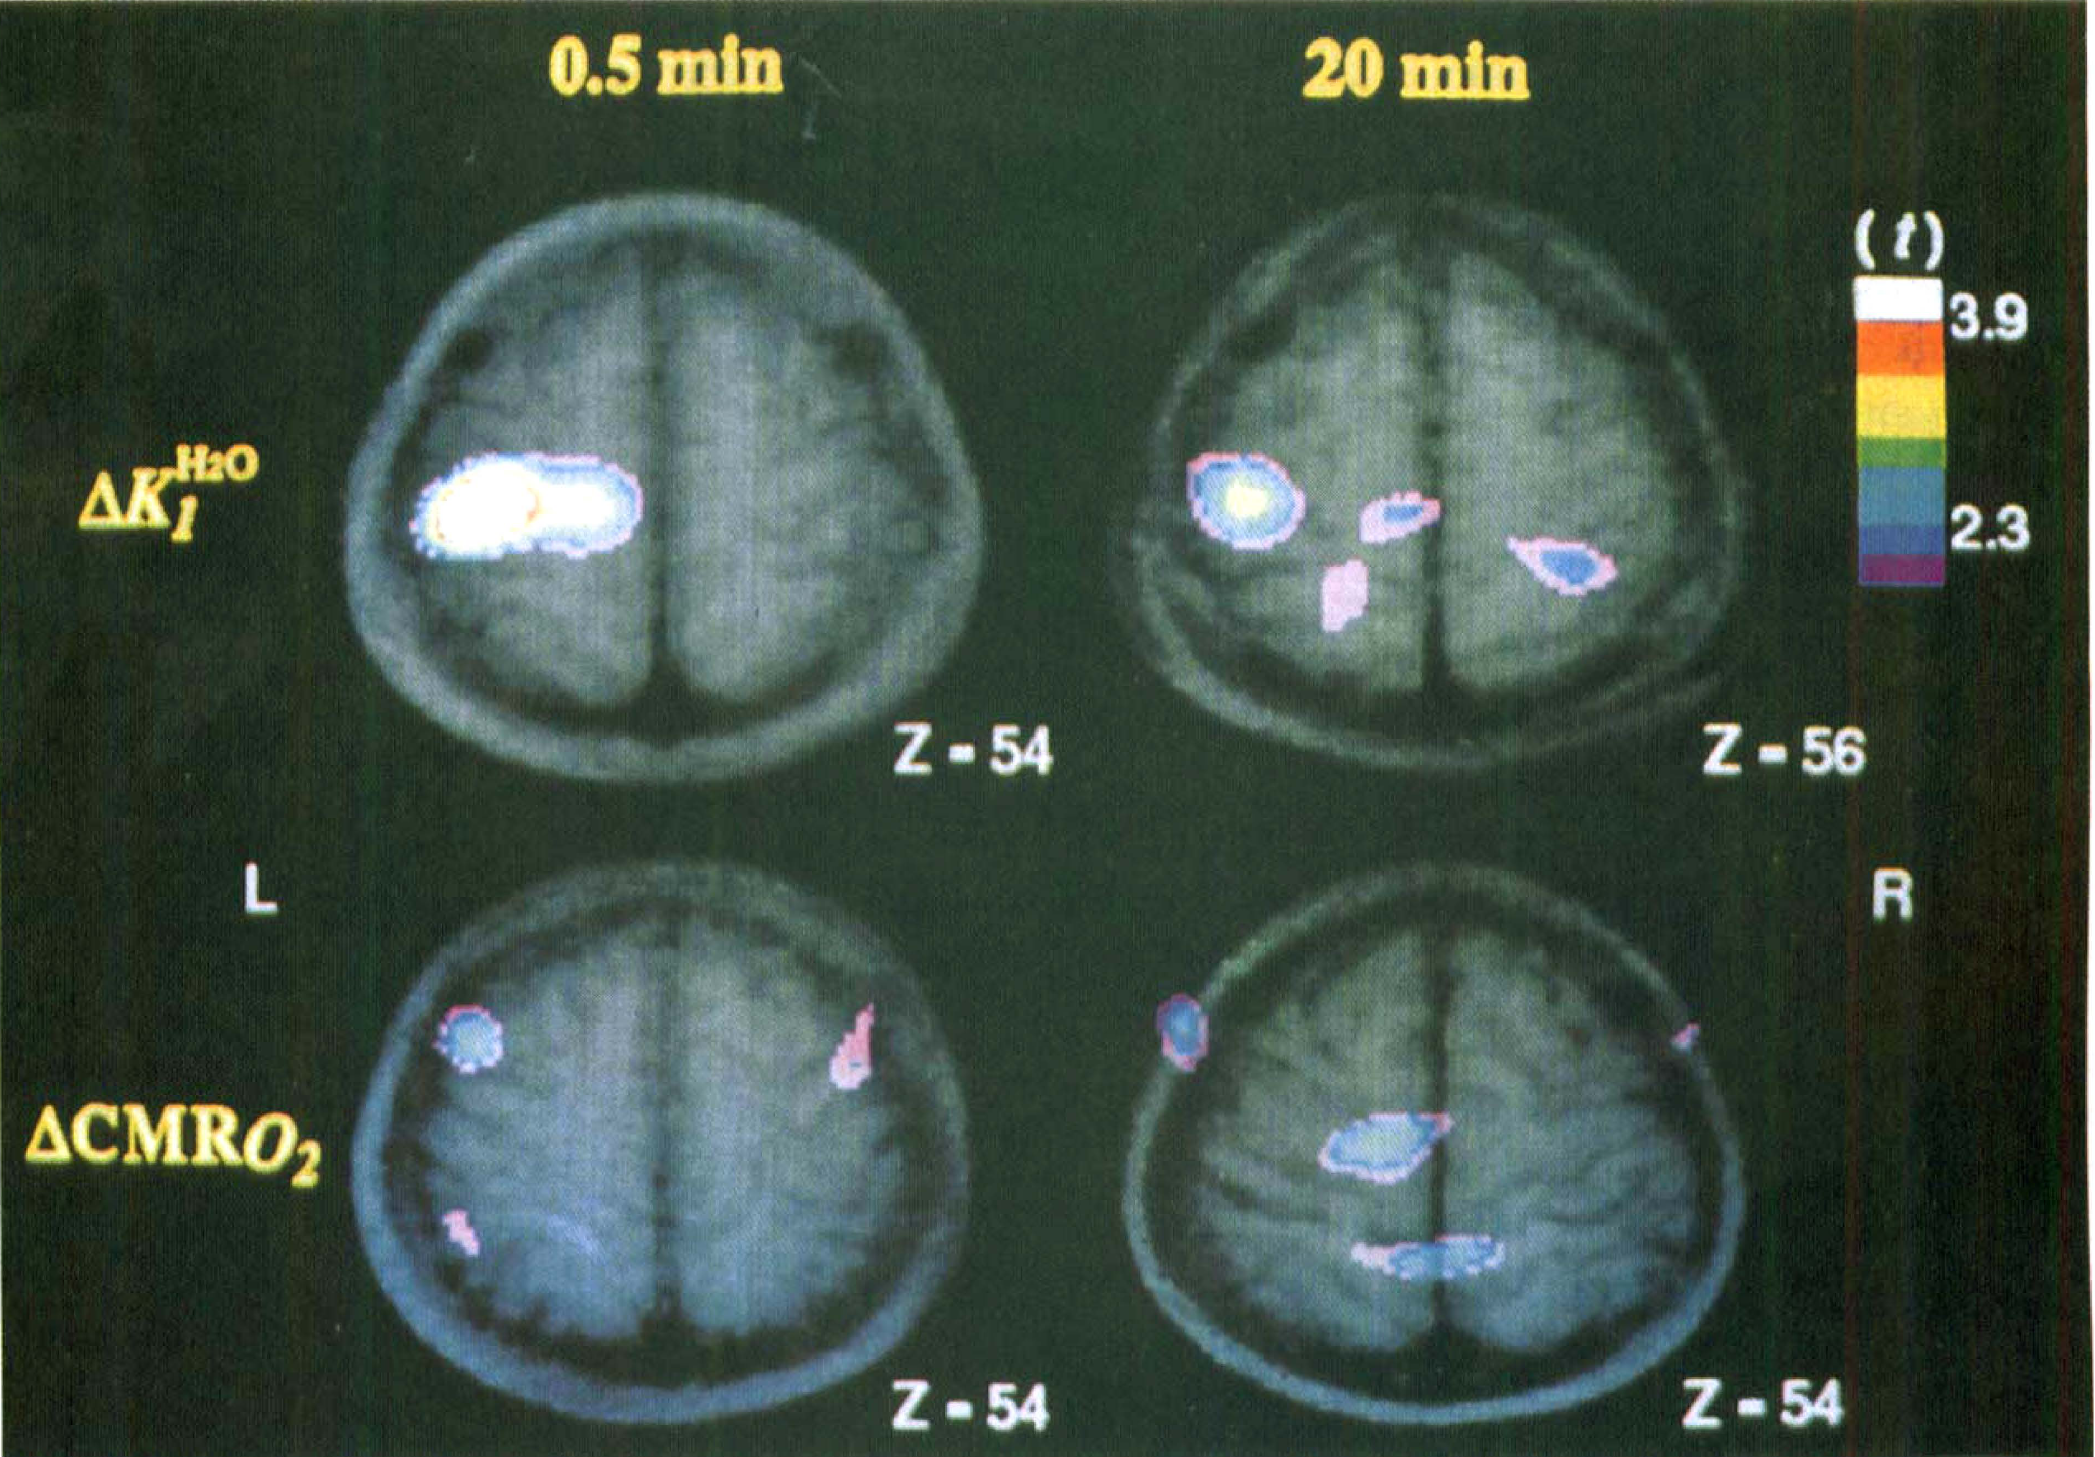
The relation between the percent changes for each activation peak relative to mean brain values of K H 2 O 1 and CMR O 2 was given by the equation
where t is the t statistic value of the peak found in the t statistic image, SD the pooled standard deviation, and n the number of subjects studied. The SEM for the percent change (% change) observed in each peak location was calculated by dividing the pooled standard deviation by √n.
RESULTS
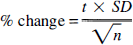
A directed search for activation regions (peaks) in the volume of the postcentral gyrus was performed for all averaged subtraction images (the volume of the cortex of the postcentral gyrus in Talairach's space was calculated to be 24 cm3). In the K H 2 O 1 subtraction t statistic images, we found statistically significant peaks both in the 30-second and 20-minute measurements. Table 1 shows the percent increases (ΔK H 2 O 1), the t values, and Talairach's stereotaxic coordinates corresponding to these two peaks. Both changes differ significantly from zero (P < 0.00005 and P < 0.05), and the difference in the change for the two stimulus durations also is significant (P < 0.05). The SEM is based on the image-wide average. Also shown in Table 1 are the nonsignificant CMR O 2 changes at the same two peak coordinates.
Peaks of ΔK H 2 O 1 and corresponding ΔCMR O 2 at 30 seconds and 20 minutes of stimulation
Talairach and Tournoux (1998), X left-right, Y anterior-posterior, Z rost.-caud. (mm)
P < 0.00005
P < 0.05
non-sign.
No statistically significant peaks were found in the entire CMR O 2 change image volume. Although some adaptation to the vibrotactile stimulation may have occurred, the increase in K H 2 O 1 persisted during the entire stimulation period. This change, however, was not accompanied by a similar response in oxygen metabolism.
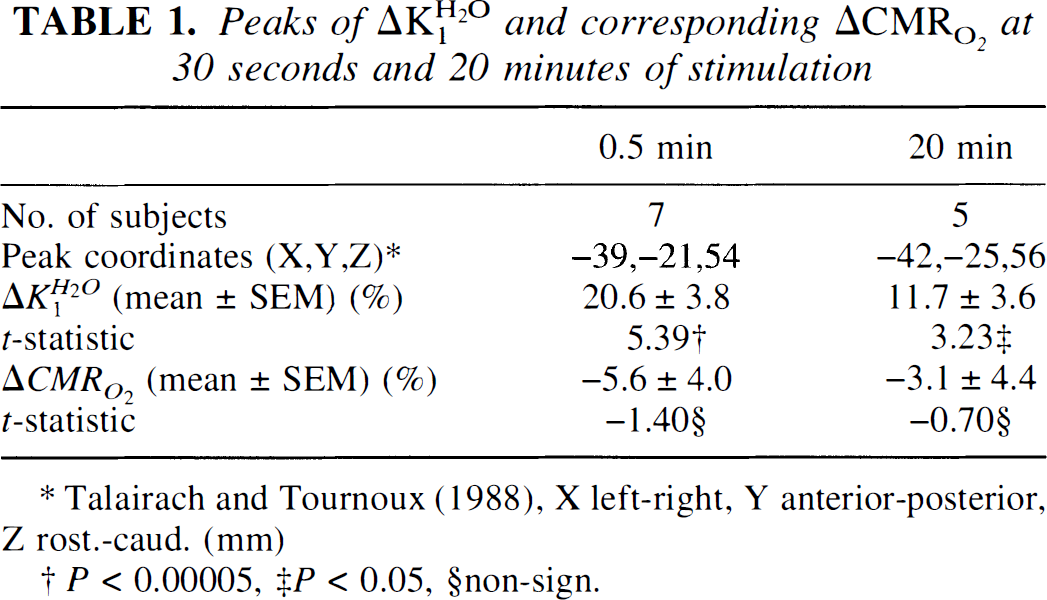
We searched for oxygen consumption changes at 5, 10, and 30 minutes of stimulation but found no significant increase in the search volume of the postcentral gyrus. We determined the average change at the location defined by the peak blood flow change measured at 30-second stimulation for the same subjects, as shown in Table 2.
Sites of ΔCMR O 2 at 5, 10, and 30 minutes of stimulation
Talairach and Tournoux (1988),X left-right, Y anterior-posterior, Z rost.-caud. (mm).
non-sign.
The SD, pooled across all intracerebral voxels, was approximately three times larger for an [15O]oxygen study (12.5%) than for a [15O]water study (4%), partly because of the more involved random and scatter corrections required in the case of [15O]oxygen, which is inhaled rather than injected like [15O]water. A power analysis indicated that an average increase of 25% would be required to be significant at the 5% level or less in five subjects. However, the complete absence of increases of oxygen consumption in Tables 1 and 2 ruled out expanding the group sizes to 25.
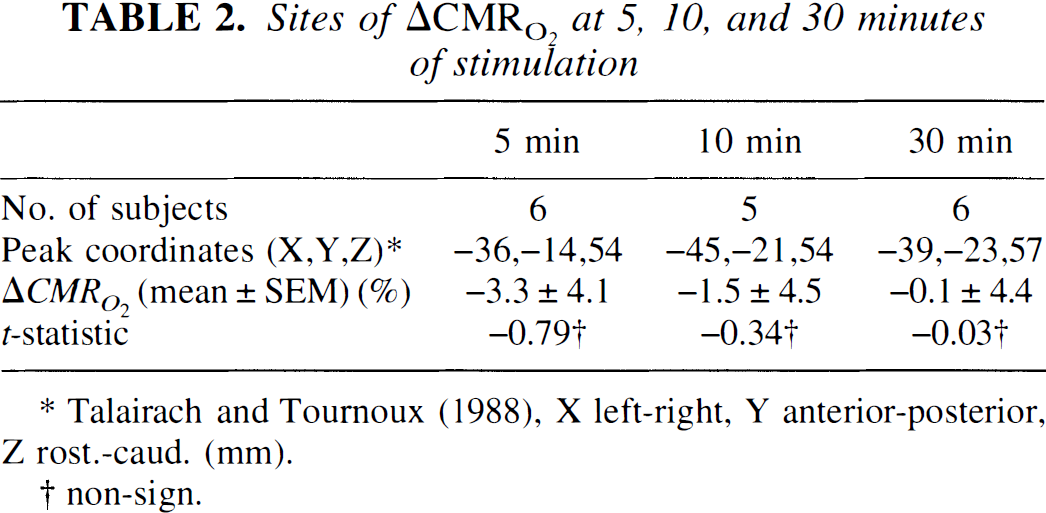
Fig. 1 shows merged PET-MR images of ΔK H 2 O 1 and ΔCMR O 2 for the same brain section. The statistically significant activation peaks in the sensory hand area are clearly visible on the ΔK H 2 O 1 images for the 0.5- and 20-minute measurement. In contrast, no significant activation peaks were observed in the ΔCMR O 2 images.
Sequence of t statistic images superimposed on corresponding magnetic resonance images. All images have the same t statistic scale. Upper row shows ΔK H 2 O 1 at 30 seconds and 20 minutes; lower row, ΔCMR O 2 at the same times. The section level of the images is given as z coordinates in Talairach's space. Both of the ΔK H 2 O 1 images show a significant peak in the postcentral gyrus, with lower t statistic at 20 minutes. No significant peaks of ΔCMR O 2 are located in the search volume of the postcentral gyrus of the ΔCMR O 2 images.
DISCUSSION
The observation that CBF and CMR O 2 appear to be coupled in the resting, or steady, state (Roy and Sherrington 1890; Raichle et al., 1976; Lebrun-Grandie et al., 1983; Baron et al., 1984) led to the claim that a similar synergism must exist during acute excitation of specific groups of neurons. The failure to confirm this prediction by Fox and Raichle (1986, 1988a) initiated attempts to explain this finding. One possibility is that the brain may be limited to the energetically less efficient glycolysis to phosphorylate ADP during acute excitation (Ackerman and Lear 1989, Gjedde 1993, 1997). The failure was replicated by other investigators and extended to other physiologic stimuli (Prichard et al., 1991; Kwong et al., 1992; Kuwabara et al., 1992), with the exception of Seitz and Roland (1992), who reported parallel changes of CBF and CMR O 2 in response to vibrotactile stimulation, although the CMR O 2 changes failed to reach statistical significance.
Marrett et al. (1993; see also Marrett and Gjedde, 1997) and Vafaee et al. (1998; 1999) observed increases of CBF and CMR O 2 for a visual stimulus thought to activate primarily neurons rich in the enzyme cytochrome oxidase, raising the possibility that the strength of the stimulus and the responding neurons select a metabolic pathway on the basis of specific stimulus parameters.
To test this possibility, it is necessary to know the magnitude of the energy metabolic needs incurred by the excitation and hence to which extent a stimulation eventually leads to increased oxidative phosphorylation of ATP. The current experiment was designed to test the hypothesis that a 10% to 20% increase of ATP turnover, proportional to the rise of blood flow, must deplete ATP in 5 to 10 minutes in the absence of oxidative phosphorylation (Gjedde, 1997). We used the one-step method of Ohta et al. (1992), an improved PET technique, which allowed us to carry out repeated “point” measurements (3-minute duration) of CMR O 2 from a single [15O]O2 inhalation approximately every 15 minutes in the same subject during extended intermittent vibrotactile stimulation. These short CMR O 2 measurements are ideally suited for a comparison with our [15O]water clearance (K H 2 O 1) measurements (3-minute duration) obtained on the same subject during identical stimulation.
In previous PET studies, short (1-minute) CBF determinations had to be compared with CMR O 2 measurements derived from three separate PET determinations, which took at least 30 minutes (Mintun et al., 1984).
In the current study, we used a two-compartment model to measure cerebral water clearance (K H 2 O 1), an index of CBF. This model accounts for residual vascular radioactivity (Ohta et al., 1996; Fujita et al., 1993), and the derived K H 2 O 1 values, therefore, more accurately reflect the transit of water through cerebral tissue.
In the acute stimulation condition (initiated 0.5 minutes before tracer injection and continued throughout the 3-minute data collection period), averaged K H 2 O 1 subtraction images consistently revealed a statistically significant peak in the sensory hand area corresponding to an increase in K H 2 O 1 of 21%. Fox and colleagues (1986) report a 29% increase of CBF for the same condition. Considering that the calculation of K H 2 O 1 requires a correction for vascular radioactivity (“CBF” estimates without such a correction are erroneously high), and further assuming similar reconstructed image resolutions (Fox et al., 1988b), our results are consistent with those of Fox and coworkers (1986). The K H 2 O 1 data also showed a statistically significant peak in the hand area for the 20-minute measurement (12% increase). These results demonstrate that K H 2 O 1 remains elevated for intermittent vibrotactile stimulation periods as long as 20 minutes, although there appears to be a significant decline in K H 2 O 1 over time, most likely because of some degree of habituation (Applegate et al., 1988).
In contrast, we did not find any significant increase in CMR O 2 in the postcentral gyrus for stimulation periods for as long as 30 minutes. Fox and Raichle (1986) observed a slight but statistically insignificant increase of CMR O 2 for a stimulation period of 5 minutes.
Two methodologic questions may be asked in this context. First, does the one-step CMR O 2 method properly identify potentially activated areas? Second, did individual differences in sensitivity to vibrotactile stimulation affect our results, since different subjects were studied for the two time points (0.5 minutes and 20 minutes)? The power analysis revealed that oxygen consumption increases of the same magnitude as the blood flow increases would be required to reach significance. The point appears to be moot, however, since no average increases of oxygen consumption were recorded at any time.
The question of how the activated brain tissue meets its energy demands during neuronal activation deserves consideration. Therefore, it is worthwhile to compare results from different stimuli. For vibrotactile stimulation, the results indicate that tissue perfusion (K H 2 O 1) and CMRglc increase in the sensory motor hand area (Kuwabara et al., 1992). No significant increase of CMR O 2 occurs (Fox et al., 1986; current study). For simple photic stimulation, there is an increase of CBF and CMRglc in the visual cortex, especially in area V1, but no increase in CMR O 2 (Fox et al., 1988a; Kwong et al., 1992; Ribeiro et al., 1993). Using magnetic resonance spectroscopy, Prichard and colleagues (1991) demonstrated a temporary increase of lactate content in the visual cortex from the onset of stimulation. Using a tile sorting task, CBF and CMRglc also were found to be correlated by Ginsberg and associates (1988).
Considering this information, we formulate the hypothesis that the neurons of the sensory cortex are minimally active on average, as reflected in a low content of cytochrome oxidase. When stimulated, the increased generation of pyruvate in these neurons leads to increased generation of lactate that is removed by the increased blood flow. Hence, lactate need not accumulate to levels that require switching to oxidative phosphorylation. Once the sensory neurons have recorded a signal, it is rapidly transferred to other regions where little or no energy is required to process the signal.
We conclude that human cerebral oxidative metabolism fails to increase during continued vibrotactile stimulation of the hand, as demonstrated by the absent CMR O 2 increase in the sensory motor hand area. Cerebral water clearance, K H 2 O 1, an index of CBF, increases during the same stimulation, suggesting that the increase of energy metabolic need is limited over the entire period of activation.
Although the mechanisms of energy production during acute and chronic neuronal activation are not clear, the finding suggests that oxidative phosphorylation may not be the preferred path of neuronal energy metabolism under all circumstances.
Footnotes
Acknowledgements
The authors thank the technical staff of the McConnell Brain Imaging Centre for their assistance. Special thanks are due to Leonardo Ribeiro, Yosifumi Yasuhara, Sean Marrett, and Manouchehr Vafaee for their help with the PET studies, and to Paule-Joanne Toussaint, Peter Neelin, and Sylvain Milot for providing expert computer analysis support.