
Abstract
The correlation between seizure-induced hypermetabolism and subsequent neuronal damage was studied in 10-day-old (P10), 21-day-old (P21), and adult rats subjected to lithium-pilocarpine status epilepticus (SE). Local CMRglc (LCMRglc) values were measured by the [14C]2-deoxyglucose method for a duration of 45 minutes starting at 60 minutes after the onset of SE, and neuronal damage was assessed by cresyl violet staining at 6 days after SE. In P21 and adult rats, LCMRglc values were increased by 275 to 875% in all thalamic, cortical, forebrain, and hypothalamic regions plus the substantia nigra. In addition, at P21 there were also large increases in LCMRglc in brainstem regions. In P10 rats, metabolic increases were mostly located in cortical and forebrain regions plus the substantia nigra but did not affect hypothalamic, thalamic, or brainstem areas. In adult rats, there was an anatomical correlation between hypermetabolism and neuronal damage. At P21, although hypermetabolism occurred in regions with damage, the extent of damage varied considerably with the animals and ranged from an almost negligible to a very extended degree. Finally, in P10 rats, although quite pronounced hypermetabolism occurred, there was no neuronal damage induced by the seizures. Thus, in the present model of epilepsy, the correlation between marked hypermetabolism and neuronal damage can be shown in adult rats. Conversely, immature rats can sustain major metabolic activations that lead either to a variable extent of damage, as seen at P21, or no damage, as recorded at P10.
The local CMRglc (LCMRglc) changes dramatically during status epilepticus (SE) (Meldrum, 1983; Ingvar, 1986), and marked regional hypermetabolism has been shown to correlate with the development of neuronal damage in various models of seizures in adult rodents and primates (Meldrum, 1983; Ingvar, 1986).
Status epilepticus induced by a high dose of pilocarpine is of special interest because it seems to reproduce the main clinical and neuropathological features of human temporal lobe epilepsy. In adult rats, SE starts 1 hour after the administration of pilocarpine and lasts for 10 to 12 hours. This acute period of SE is followed by a seizure-free phase lasting ~14 days, after which all adult animals become epileptic and exhibit spontaneous recurrent seizures, about two to five per week, This epilepsy lasts for the whole life of the animals (Cavalheiro, 1995), Neuronal damage occurs mainly in the hippocampus, dentate gyrus, piriform and entorhinal cortices, septum, thalamus, amygdala, and neocortex (Turski et al., 1983; Cavalheiro, 1995). Pretreatment with lithium chloride has been used to potentiate the pilocarpine effect. This combination leads to the same behavioral, EEG, and morphological alterations as with pilocarpine alone, In a recent study employing a semiquantitative analysis with 2-deoxyglucose (2DG) to map cellular activation at various times after the onset of SE induced by lithium-pilocarpine in adult rats, (Handforth and Treiman 1995a,b) confirmed that in this model, as in the other models of SE, hypermetabolism is maximal in the regions that undergo neuronal damage later.
The consequences of pilocarpine-induced SE are age dependent. When SE is induced in 7- to 11-day-old rats, neither neuronal damage nor spontaneous recurrent seizures develop (Priel et al., 1996). When SE is induced between 18 and 24 days, the occurrence of the epilepsy-related damage in the brain is less extensive than in adult rats and spontaneous recurrent seizures appear in only 22% of the animals after a silent seizure-free period of a mean duration of 37 days. The frequency of the seizures in that age group is about two to four per month (Priel et al., 1996).
Therefore, the purpose of the present study was to measure LCMRglc during SE induced by lithium-pilocarpine by means of the quantitative 2DG method in 10- and 21-day-old and adult rats and try to correlate acute changes in LCMRglc with neuronal damage assessed by classic cresyl violet and silver staining methods (Gallyas et al., 1993). Indeed, we wondered whether the correlation between the hypermetabolic response and neuronal damage is specific to the adult brain or if it can also be found in the 21-day-old rat brain that will develop cellular damage after lithium-pilocarpine-induced SE. We also wished to characterize the acute metabolic response to pilocarpine of the 10-day-old rat brain in which no damage is recorded.
MATERIALS AND METHODS
Animals and pilocarpine protocol
For breeding purposes, adult Sprague-Dawley rats (Janvier Breeding Center, Le Genest-St-Isle, France), one male and two females by cage, were housed together in mating groups for 5 days. After delivery, litters were reduced to 10 pups for homogeneity (day of birth was considered as day 0). Adult male Sprague-Dawley rats were provided by the same breeder. All animals were maintained under standard laboratory conditions on a 12/12-hour light/dark cycle (lights on at 6:00 hours). The autoradiographic experiments were performed on a total number of 61 rats, 22 at postnatal day 10 (P10), 21 at P21, and 18 at the adult stage (300 to 340 g). The experiments for the enzymatic determination of cerebral glucose and lactate and for the calculation of the lumped constant of the 2DG method were performed on another group of 58 rats, 18 at P10, 20 at P21, and 20 at the adult stage. All animal experimentation was performed in accordance with the rules of the European Committee Council Direction of November 24, 1986 (86/69/EEC), and the French Department of Agriculture (license no. 00733).
Lithium chloride (3 mEq/kg) was administered intraperitoneally 18 to 24 hours before the subcutaneous injection of pilocarpine (60 mg/kg in P10 rats and 30 mg/kg in P21 and adult rats). P21 and adult rats received 1 mg/kg methylscopolamine 30 minutes before the convulsant to reduce the peripheral consequences of pilocarpine administration. Control P21 and adult animals received also methylscopolamine and control animals of all ages received an equivalent volume of saline instead of pilocarpine. To assess the possible effects of lithium on cerebral metabolic activity, additional groups of P10, P21, and adult rats (four at each age) received saline injections instead of lithium and pilocarpine.
Measurement of lactate and glucose and calculation of lumped constant
For the measurement of whole-brain glucose and lactate, animals were subjected to lithium-pilocarpine-induced SE, as described above. Control animals received lithium and saline. In adult rats, brains were frozen in situ (Ponten et al., 1973). Adult animals were equipped with a plastic cylinder secured over the skull under light halothane anesthesia and received pilocarpine or saline after a 3-hour recovery. After 60 or 105 minutes of SE or after an equivalent time in control animals, rats were anesthetized with a Nembutal (0.044 g/kg) injection through the tail vein and connected to an oxygen mask, and liquid nitrogen was poured into the cylinder over the skull. At the end of the procedure, when the brain was totally frozen, the animals were decapitated, the heads were put at −80°C, and blood freely running from the body was collected for the measurement of plasma glucose and lactate concentrations. In P10 and P21 rats subjected to 60 or 105 minutes of SE, brains were immediately deeply frozen in liquid nitrogen after decapitation while the blood running from the body was collected for the measurement of plasma glucose and lactate.
For the measurement of whole-brain glucose and lactate, the brains were dissected from the heads at 4°C on a metal plate kept frozen with dry ice. Brains were then rapidly weighed and homogenized in ice-cold 6% perchloric acid (5 mL/g tissue). Glucose and lactate contents of plasma and brain were measured by enzymatic methods using test combination kits. The procedure for glucose measurement involved glucose oxidase and peroxidase (Sigma, St. Louis, MO, U.S.A.). The measurement of lactate was performed using lactate dehydrogenase in the presence of glutamate-pyruvate transaminase and NAD+ (Boehringer, Mannheim, Germany).
At both 60 and 105 minutes after the onset of SE, corresponding to the beginning and the end of the 2DG experiment, respectively, the lumped constant of the 2DG method was calculated from the plasma and brain glucose concentrations, using the equation and nomogram constructed by Pardridge et al. (1982), as previously described in detail (El Hamdi et al., 1992). The lumped constant is a function of the transfer and rate constants for 2DG and glucose and can be expressed as follows: LC = (k1*/k1)(k3*/k3)[(k2 + k3)(k2* + k3*)], where k1 and k1*, k2 and k2*, and k3 and k3* are the rate constants for the influx into brain tissue, efflux from brain, and phosphorylation of glucose and 2DG, respectively (Pardridge et al., 1982). The final value for the lumped constant represented the mean of the two values obtained at 60 and 105 minutes in each age group for a value representative of the period of measurement of LCMRglc that was conducted for 45 minutes starting at 60 minutes after the onset of SE.
Measurement of LCMRglc and physiologic variables
A femoral artery and vein were catheterized with polyethylene catheters (Clay Adams PE 10 or 50) under light halothane anesthesia. Both catheters were threaded under the skin up to the back of the hind paw to allow free access to the catheters without disturbing rat movements. The animals were allowed to recover from surgery in their home cages, back to the dams for suckling rats, for 17 to 24 hours before the onset of the experiment.
LCMRglc values were measured by the [14C]2DG technique (Sokoloff et al., 1977) adapted to the immature rat (Nehlig et al., 1988). The [14C]2DG (4.625 MBq/kg, specific activity 1.65 to 2.04 GBq/mmol; Isotopchim, Ganagobie-Perhuis, France) was injected as an intravenous pulse to freely moving rats at 60 minutes after the onset of lithium-pilocarpine-induced SE. The onset of SE was assessed according to the behavioral criteria previously described at the different ages studied (Priel et al., 1996). Timed arterial blood samples were drawn over the following 45 minutes for the measurement of plasma glucose and 2DG concentrations. At ~45 minutes after the injection of the tracer, the animals were killed by decapitation. Brains were rapidly removed, frozen, and cut into 20-µm coronal sections. Sections were autoradiographed on Amersham Biomax MR film along with [14C]methylmethacrylate standards calibrated for their 14C concentration in brain tissue. The autoradiographs were then digitized and analyzed by densitometry with an image-processing system (Biocom 500, Les Ulis, France). The localization of specific nuclei was assessed on adjacent sections stained with cresyl violet. LCMRglc values were calculated according to the operational equation of the 2DG method using the integrated specific activity of the ratio between the plasma [14C]2DG and glucose concentrations measured for each animal, the usual rate constants (Sokoloff et al., 1977), as well as the lumped constant determined for each age group and condition, control or seizing animals, as explained above.
Mean arterial blood pressure was regularly recorded during the experimental procedure with an air-damped mercury manometer. Just prior to the 2DG injection and to the death of the animals, samples of arterial blood were taken for the measurement of hematocrit and of blood pH, P
Neuropathological studies
Neuropathological changes were assessed by classic cresyl violet staining and by the silver staining method for the labeling of degenerating neurons (Gallyas et al., 1993). For the study of neuropathological changes induced by lithium pilocarpine SE, a group of animals (five at each age) underwent an acute episode of SE as described above. Lithium-pilocarpine-induced SE was not stopped by any medication; the animals received only diazepam (1 mg/kg) at 2 hours after the onset of SE, which did not stop electrical seizure signs but induced muscle relaxation and improved the rate of survival. The animals were killed 6 days after the induction of SE, and the brains were removed and frozen. Sections 20 µm in thickness were cut in a cryostat and underwent classic cresyl violet staining. The assessment of neuronal damage was performed under light microscopy.
Silver staining for neurons undergoing degeneration (Gallyas et al., 1993) was performed in three control P10, P21, and adult animals receiving lithium-saline and in six to seven rats exposed to lithium-pilocarpine-induced SE. At 6 hours after the onset of SE, the animals were deeply anesthetized and transcardially perfused. The whole heads were then kept for 24 hours in the perfusion fixative. Thereafter, the brains were removed from the skull and allowed to stay in the perfusion fixative for at least 1 week. On the day prior to sectioning, the brains were cryoprotected by immersion in 30% sucrose dissolved in the perfusion fixative solution, and 60-µm coronal sections were obtained in a cryostat. The sections were rinsed in 1% acetic acid to remove the fixative, dehydrated in 1-propanol solutions, and esterified at 56°C for 16 hours in a mixture of 0.8 mL water, 1.2 mL H2SO4, and 98 mL 1-propanol. The sections were rehydrated and placed in the physical developer containing silver nitrate until the color of the sections became lightly brown (~10 minutes). Finally, the sections were washed in 1% acetic acid to stop the silver reaction, dehydrated, and embedded in Canada balsam. The sections were examined by light microscopy, and the density of silver-stained cells was determined.
Statistical analysis
LCMRglc values were determined in 58 structures of two groups of seven to nine animals at each age, i.e., one group of lithium-saline- and one group of lithium-pilocarpine-treated rats. The values of LCMRglc, physiologic variables, and plasma and cerebral lactate and glucose levels recorded in the lithium-pilocarpine groups were compared with those in the age-matched lithium-saline group by means of a Dunnett's t test for multiple comparisons. The temporal evolution of physiologic variables and cerebral and plasma lactate and glucose between the injection of pilocarpine and the end of the 2DG procedure was assessed by Bonferroni's t test for multiple comparisons.
RESULTS
Behavior
Behavioral alterations induced by the administration of lithium and pilocarpine were time and age dependent. Within 5 minutes after pilocarpine injection, P21 and adult rats developed diarrhea, piloerection, and other signs of cholinergic stimulation. During the following 15 to 20 minutes, rats exhibited head bobbing, scratching, chewing, and exploratory behavior. Recurrent seizures started ~20 to 25 minutes after pilocarpine administration. These seizures that associated episodes of head and bilateral forelimb myoclonus with rearing and falling progressed to SE at ~50 minutes after pilocarpine, as previously described (Turski et al., 1983).
In P10 rats, behavioral ictal signs were less manifest, appearing after 15 to 20 minutes, and were mainly characterized by hyperactivity, continuous scratching, and masticatory automatisms. Status epilepticus was reached after a delay of 35 to 40 minutes and characterized by intense body tremor without falling or rearing (as seen in older animals) and tonic extension of the tail. These behavioral signs were in accordance with those previously described after the injection of a high dose of pilocarpine (Priel et al., 1996).
During SE, the clonic seizures occurred continuously for 4 to 5 hours in P10 rats and 8 to 10 hours in P21 and adult rats. They were accompanied by episodes of rearing and falling in P21 and adult rats that reached Stage 5 on Racine's scale for seizure severity (Racine, 1972). In P10 rats, the animals exhibited no rearing or falling and stayed always on their four paws, but their body was continuously trembling. The clonic seizures were accompanied by continuous trains of high-voltage spikes on the EEG recordings, as previously shown and described in detail (Motte et al., 1998). The seizures were not accompanied by episodes of apnea, which occurred much later, i.e., 10 to 18 hours after the onset of SE, but never during the second hour of SE, during which we performed our experiments.
Physiologic variables, cerebral glucose and lactate contents, and lumped constant
Arterial blood glucose concentration remained stable over the 2DG experimental period, except in adult rats in which pilocarpine induced a 40% increase. In P10 and P21 seizing rats, arterial blood pressure decreased by 34 to 40% at the end of the 2DG experiment, whereas in adult animals subjected to SE, arterial blood pressure was increased by 12 to 23% during the whole 2DG procedure. These values remained in the physiologic range and autoregulation plateau. Blood gases were similar in control and seizing animals of all ages at the initiation of the 2DG procedure. Arterial P
Basal arterial levels of lactate were 63 to 70% higher in P21 or adult rats than in P10 rats. After 1 hour of SE, the circulating levels of lactate increased by 2.8-fold at P10 and 3.4-fold in P21 and adult rats and were 2- to 2.8-fold higher in P21 and adult compared with P10 rats (Table 1). During the following 45 minutes, the concentration of arterial plasma lactate decreased by 36 to 39% in P10 and P21 rats and by 14% in adults compared with basal control levels. Basal cerebral lactate concentrations were similar at the three ages studied. They increased 3-fold after 1 hour of SE at P10 and 4.5-fold in P21 and adult rats. They stayed stable for the following 45 minutes at P21, decreased at P10, and increased in adult rats. Lithium-pilocarpine-induced SE did not lead to any change in plasma glucose levels in P10 and P21 rats (Table 1). Cerebral glucose concentration was not significantly changed by SE at P10 and decreased by 30 to 43% with SE in P21 and adult rats. The lumped constant for the calculation of glucose utilization by the equation of the 2DG method was slightly increased by lithium-pilocarpine-induced SE at all ages, but this increase was not significant (Table 1).
Effects of lithium-pilocarpine seizures on plasma and cerebral concentrations of lactate, glucose, and lumped constant in immature and adult rats
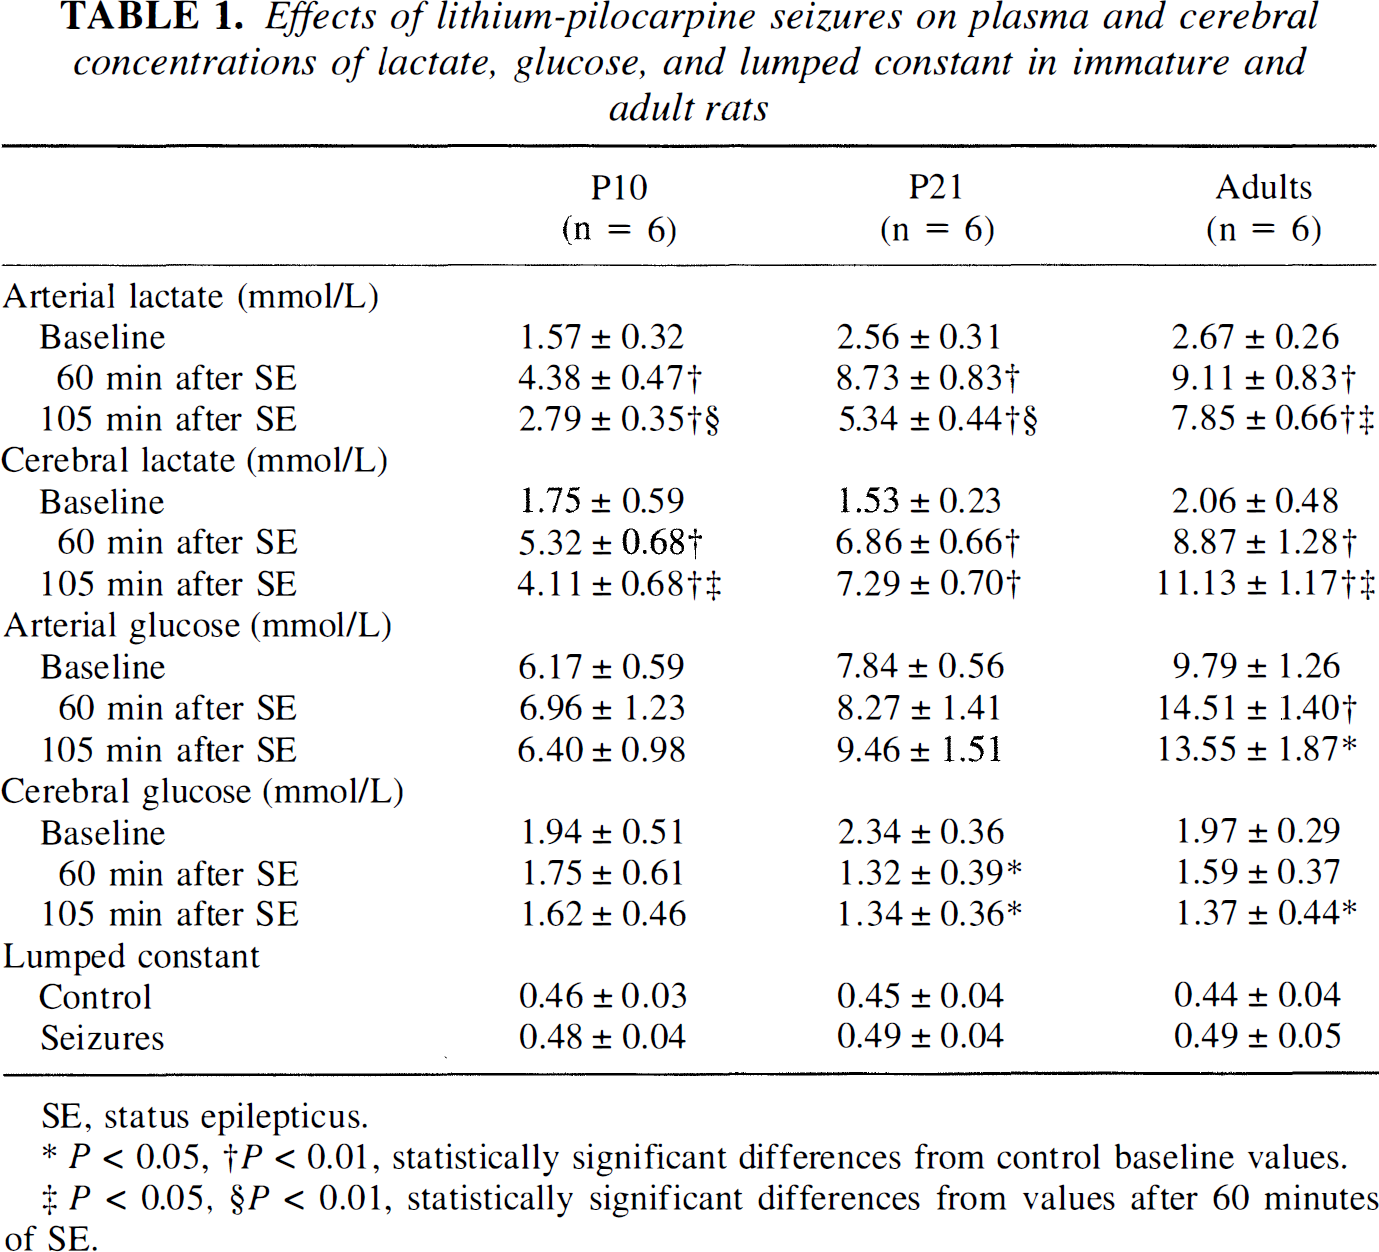
SE, status epilepticus.
P < 0.05, †P < 0.01, statistically significant differences from control baseline values.
P < 0.05, §P < 0,01, statistically significant differences from values after 60 minutes of SE.
Effects of lithium-pilocarpine SE on LCMRglc
In control P10, P21, and adult rats, LCMRglc values measured in the present study were in the same range as those previously reported by our group (Nehlig et al., 1988).
In P10 rats, LCMRglc values were significantly increased in lithium-pilocarpine-compared with lithium-saline-treated rats in 25 brain structures (Tables 2 and 3). These increases ranged from 63 to 625% and were located in all cortices except the anterior cingulate and the auditory cortex and in all forebrain areas except the zona incerta and the interpeduncular nucleus (Figs. 1 to 4). The largest increases (>450%) were recorded in piriform cortex, lateral septum, all parts of the amygdala, hippocampal CA1 area, and hilus of the dentate gyrus (Figs. 1 and 2). Significant increases were also recorded in the mamillary body, the ventral thalamus, the two parts of the substantia nigra, and the ventral tegmental area. Although LCMRglc values underwent large increases during SE in P10 rats, the grain density on the autoradiograms shown in Figs. 1 to 4 remained quite moderate compared with the very dark areas recorded in P21 and adult rats subjected to seizures.
Effects of lithium-pilocarpine SE on LCMRglcs in the cerebral cortex and forebrain of immature and adult rats
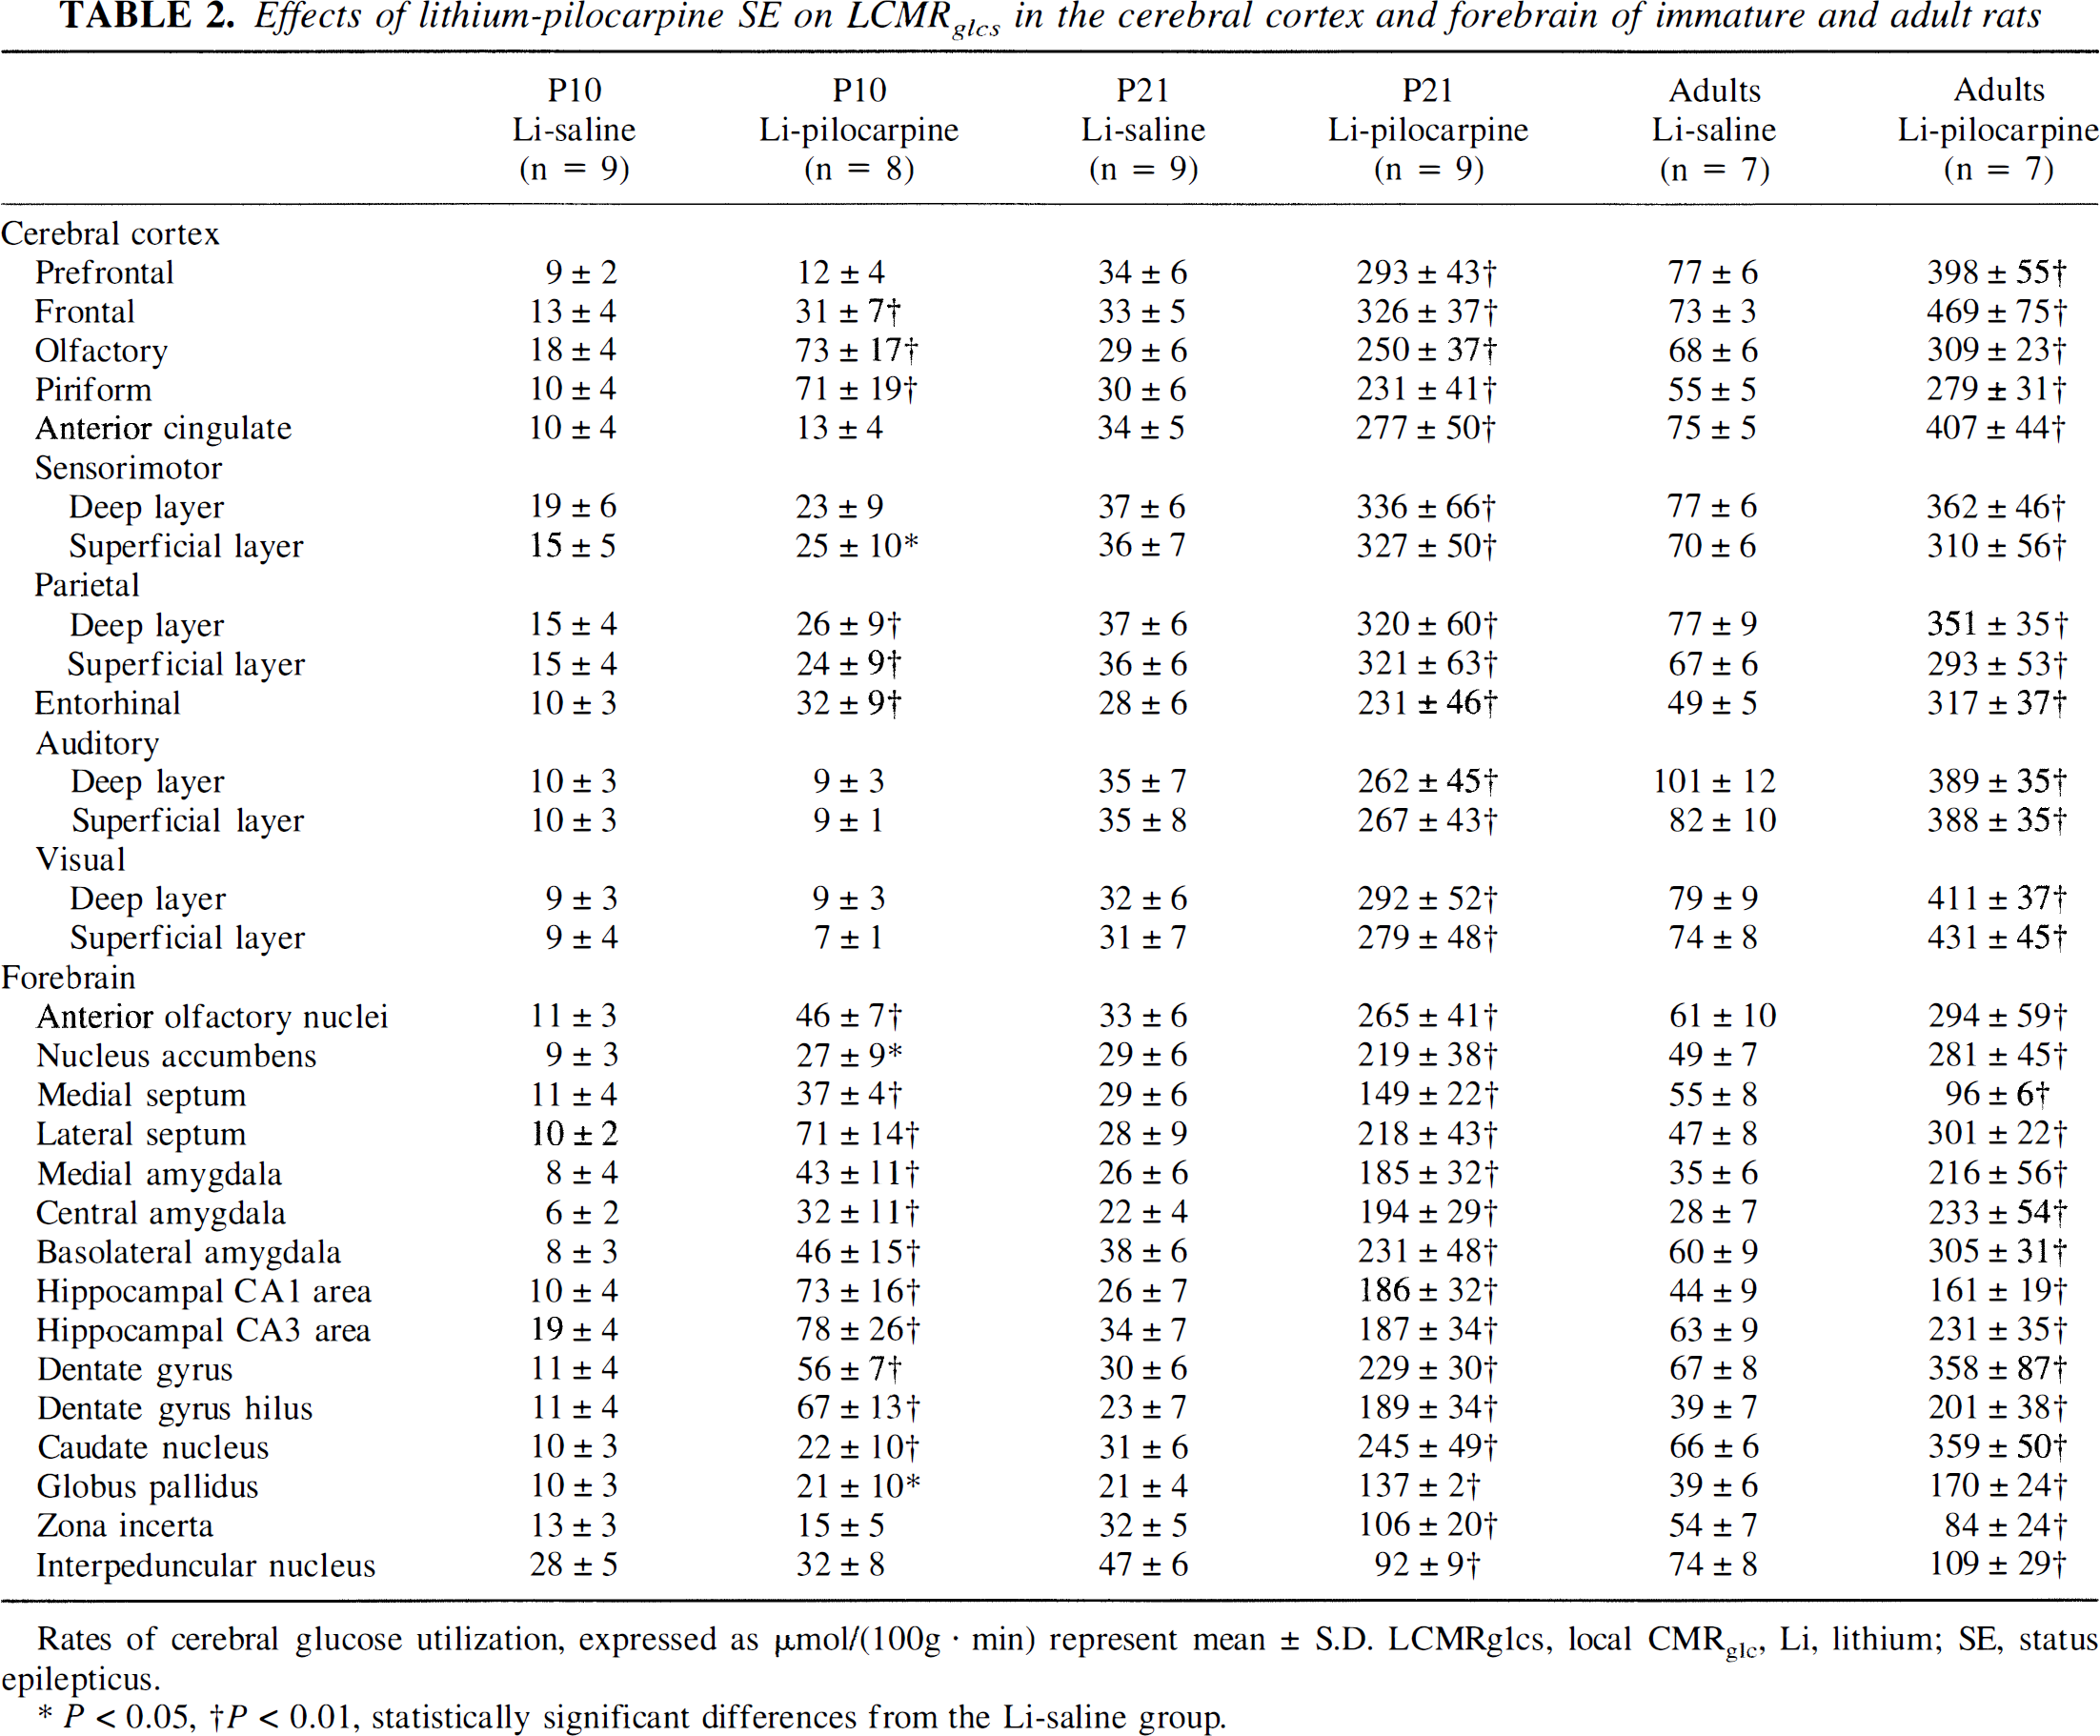
Rates of cerebral glucose utilization, expressed as μmol/(100g · min) represent mean ± S.D. LCMRglcs, local CMRglc, Li, lithium; SE, status epilepticus.
P < 0.05, †P < 0.01, statistically significant differences from the Li-saline group.
Effects of lithium-pilocarpine SE on LCMRglcs in the hypothalamus, thalamus, midbrain, and brainstem of immature and adult rats
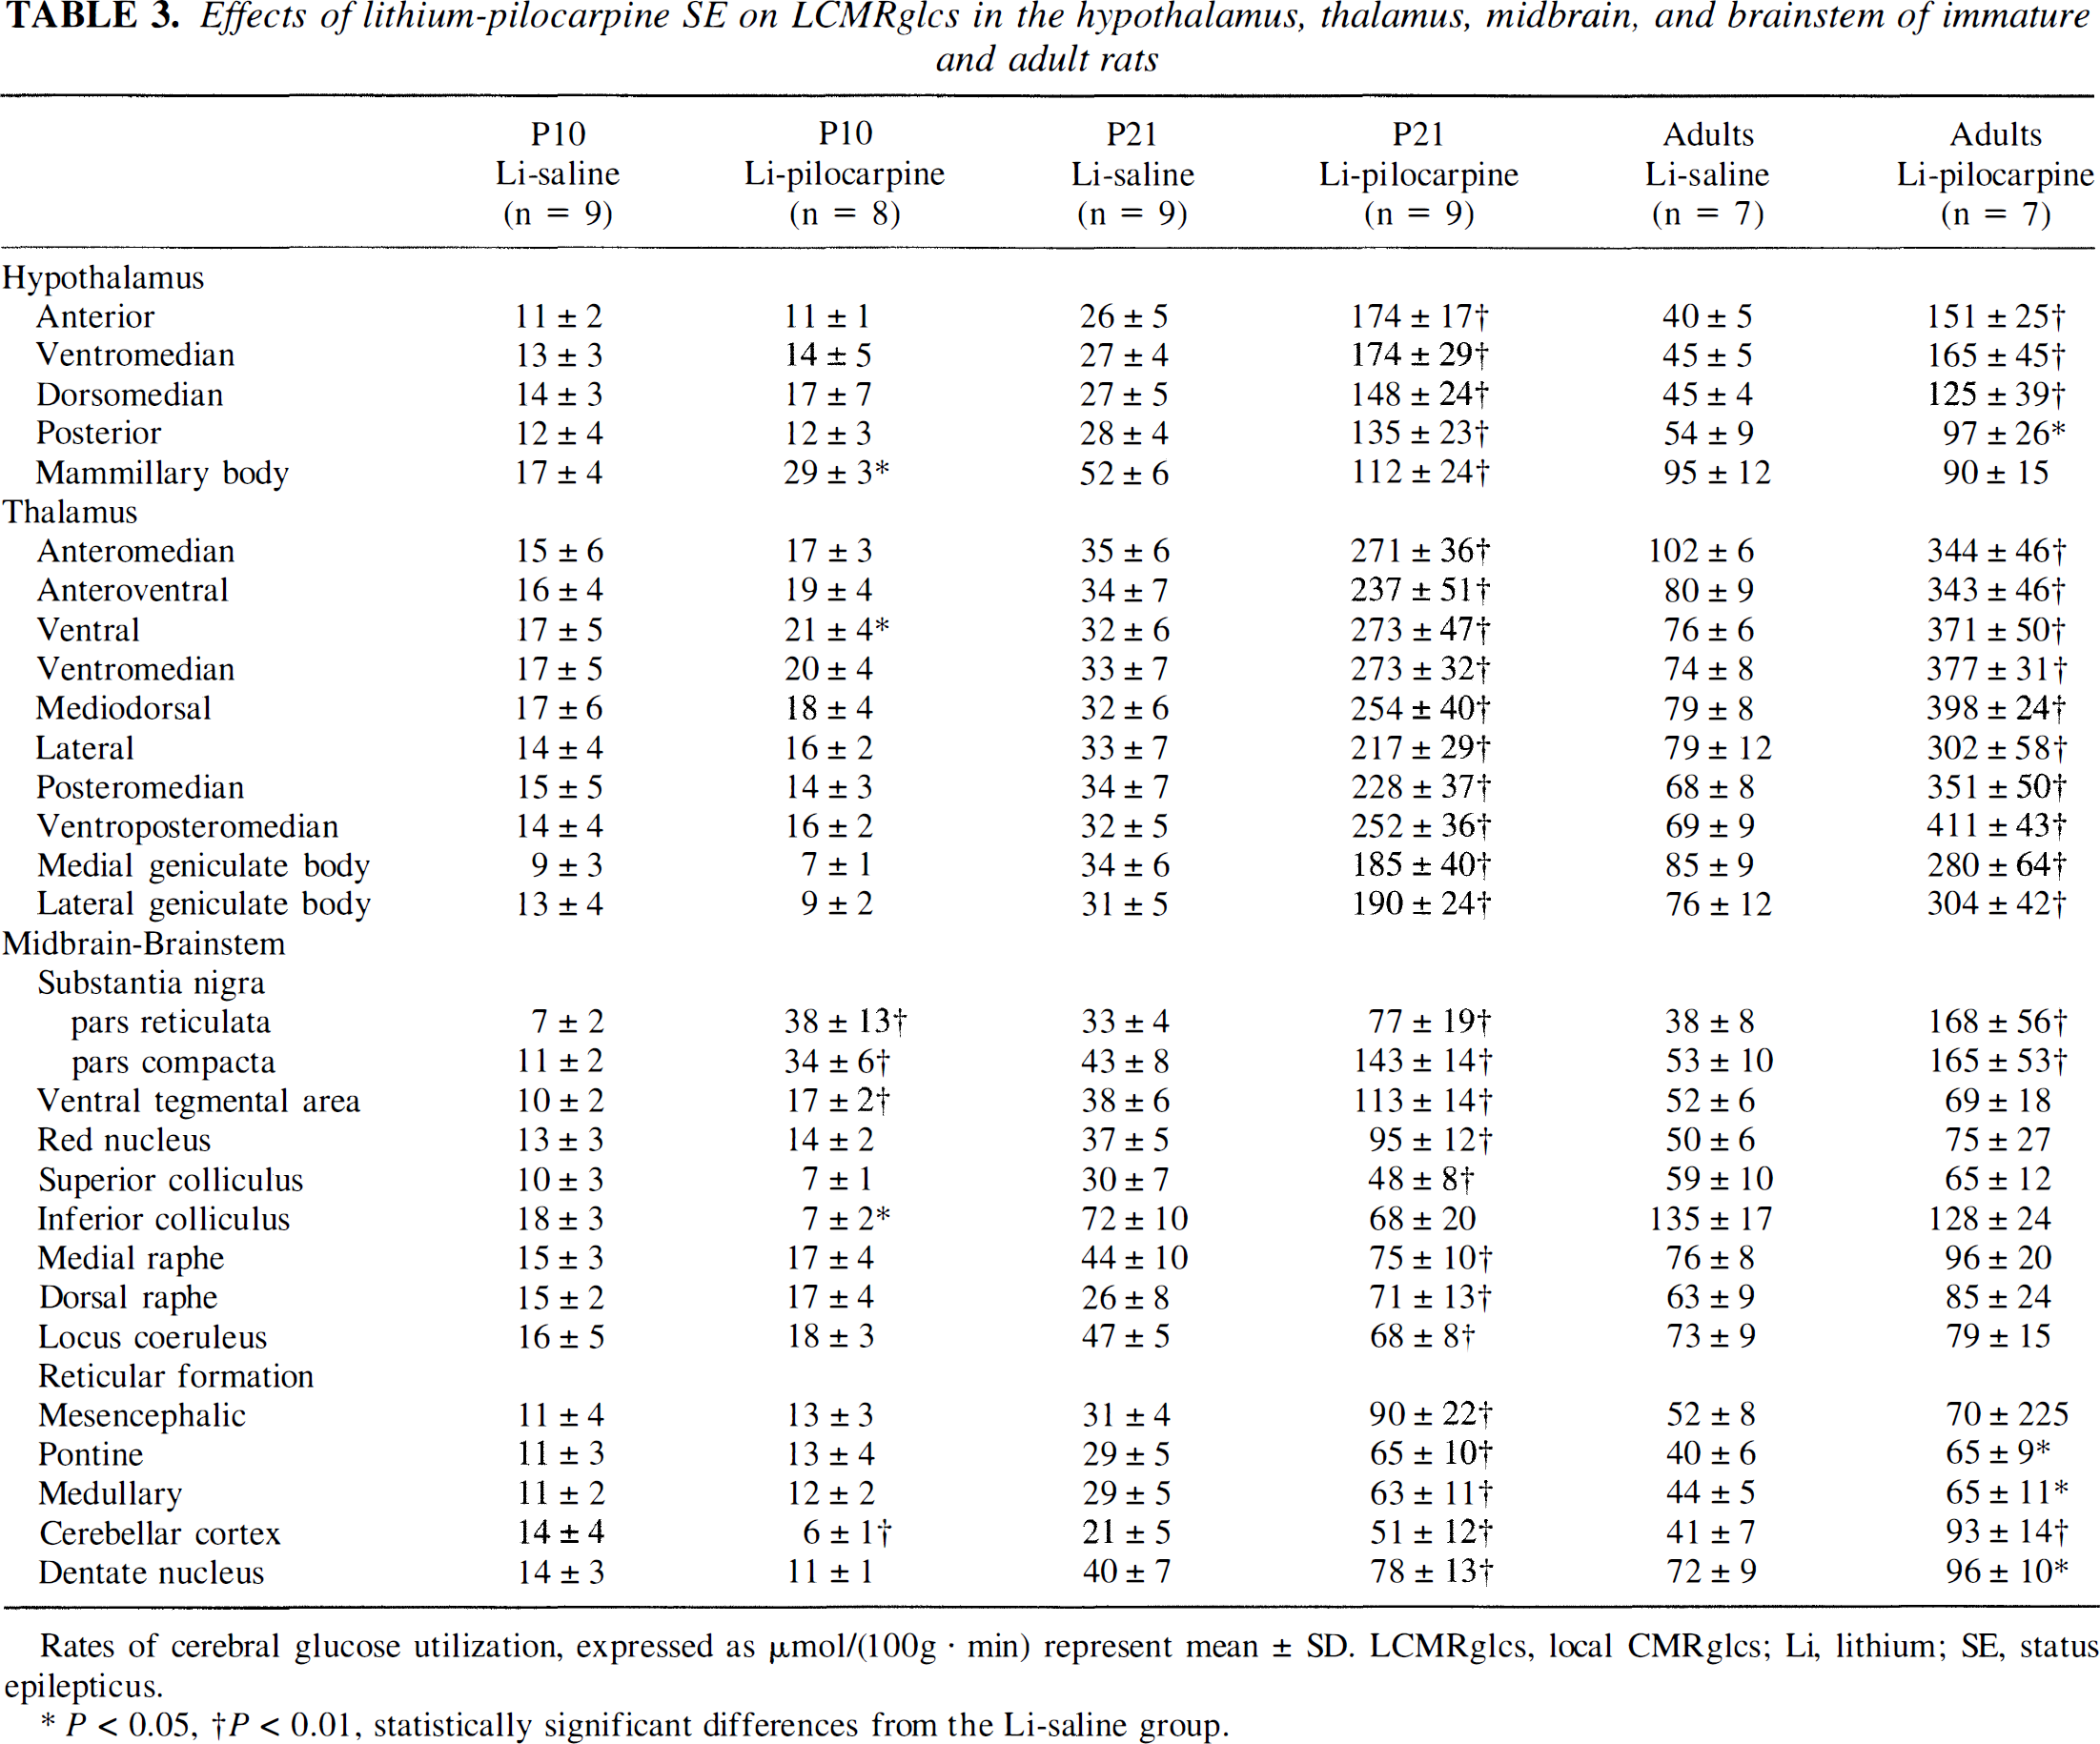
Rates of cerebral glucose utilization, expressed as µmol/(100g · min) represent mean ± SD. LCMRglcs, local CMRglcs; Li, lithium; SE, status epilepticus.
P < 0.05, †P < 0.01, statistically significant differences from the Li-saline group.
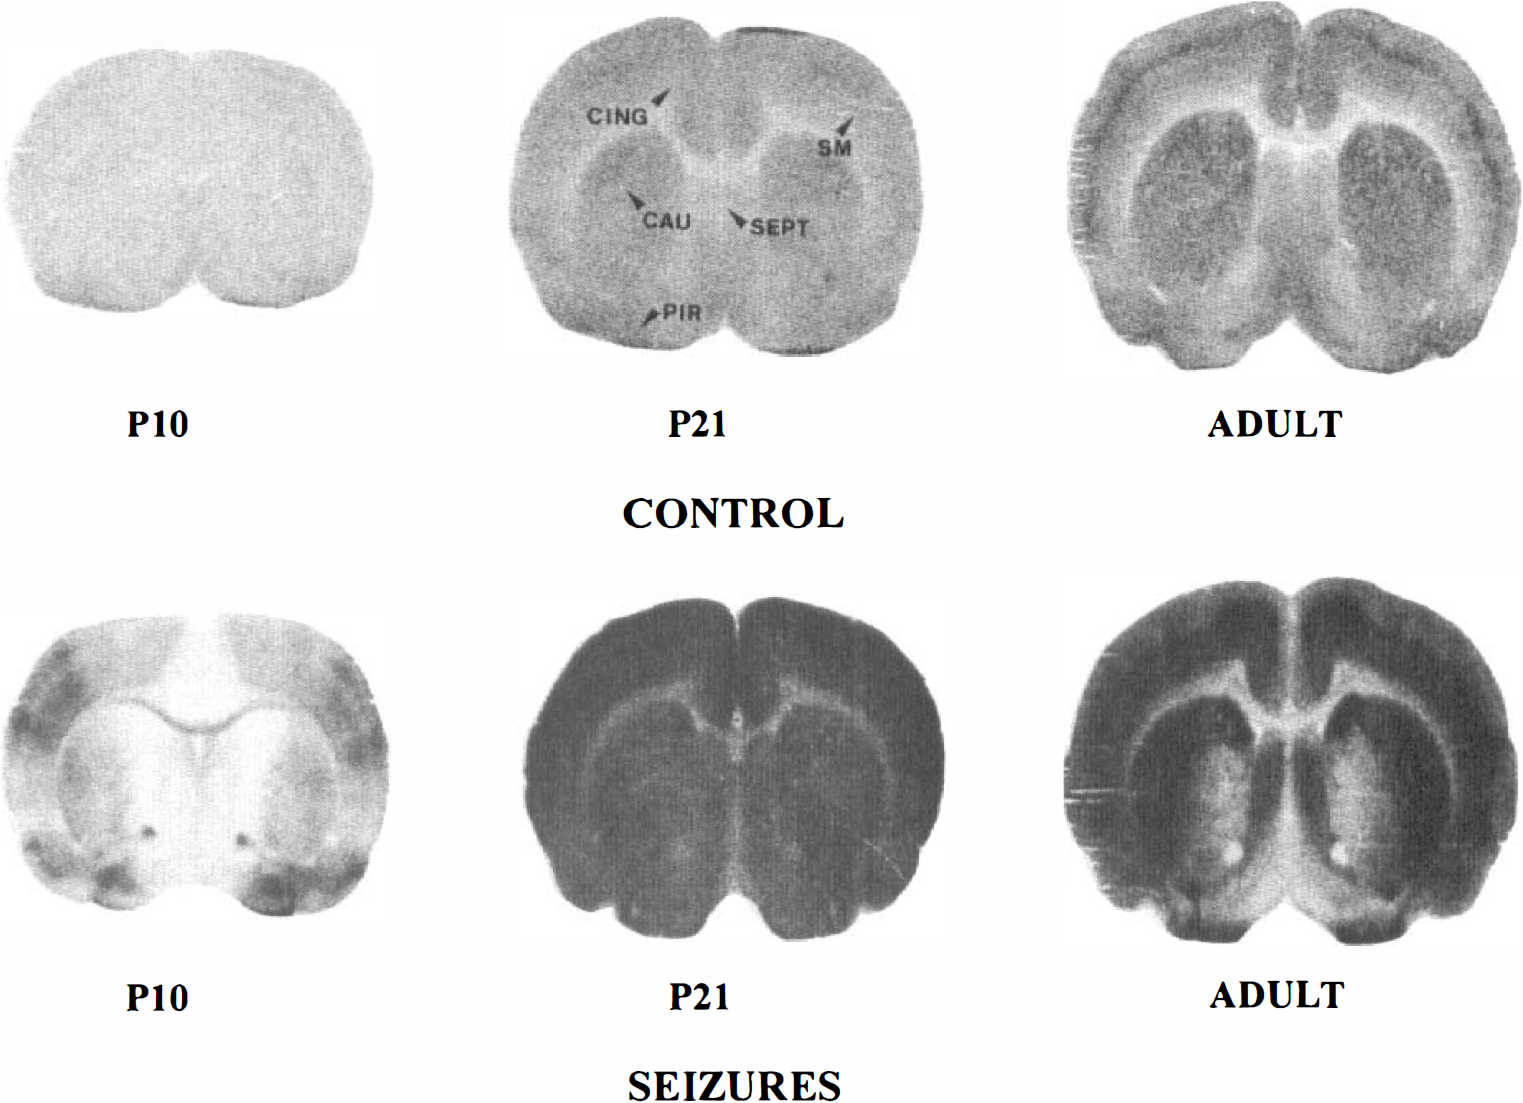
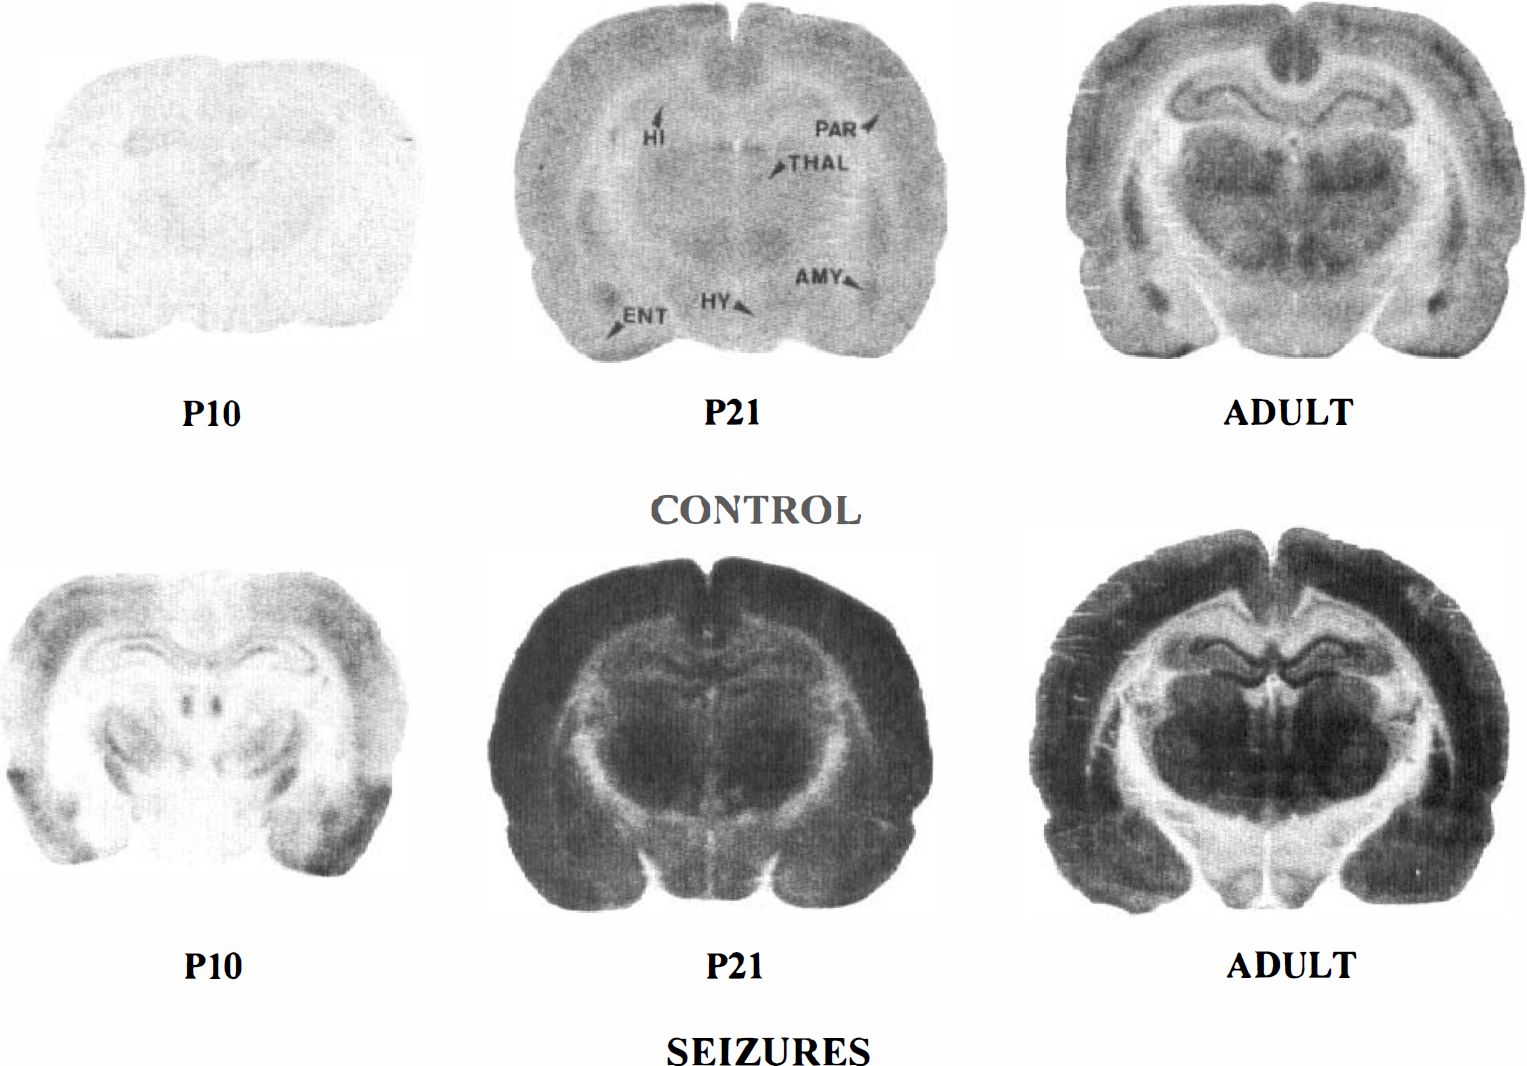
[14C]2DG autoradiographs of rat brain sections taken at the level of the caudate nucleus (CAU) in P10, P21, and adult control and lithium-pilocarpine-treated rats. Note the low and homogeneous level of grain density in control P10 rats. In P21 control rats, the optical density is increased in all brain areas compared with P10 control rats and becomes more heterogeneous in adult control animals. During lithium-pilocarpine-induced SE, grain density is largely increased over control levels in all brain regions in P21 and adult animals. In P10 rats, there is a moderate increase in grain density in sensorimotor (SM) and piriform (PIR) cortices, an increase in optical density in the lateral part of the caudate nucleus (CAU), and no change in the septum (SEPT) and anterior cingulate cortex (CING).
[14C)2DG autoradiographs of rat brain sections taken at the level of the dorsal hippocampus (HI) and thalamus (THAL) in P10, P21, and adult control and lithium-pilocarpine-treated rats. Note the low and homogeneous level of grain density in control P10 rats. In P21 control rats, the optical density is increased in all brain areas compared with P10 control rats and becomes more differentiated especially in the cortex, hippocampus, and thalamus of adult control animals. During lithium-pilocarpine-induced. SE, grain density is largely increased over control levels in all brain regions in P21 and adult animals. The increase in optical density is very marked in P21 rats, but it appears more moderate in the hypothalamus (HY) and hippocampus compared with the other regions of adult rats. In P10 rats, there is a moderate increase in grain density in parietal (PAR) and entorhinal (ENT) cortices and in the amygdala (AMY) and ventrolateral thalamic nuclei.
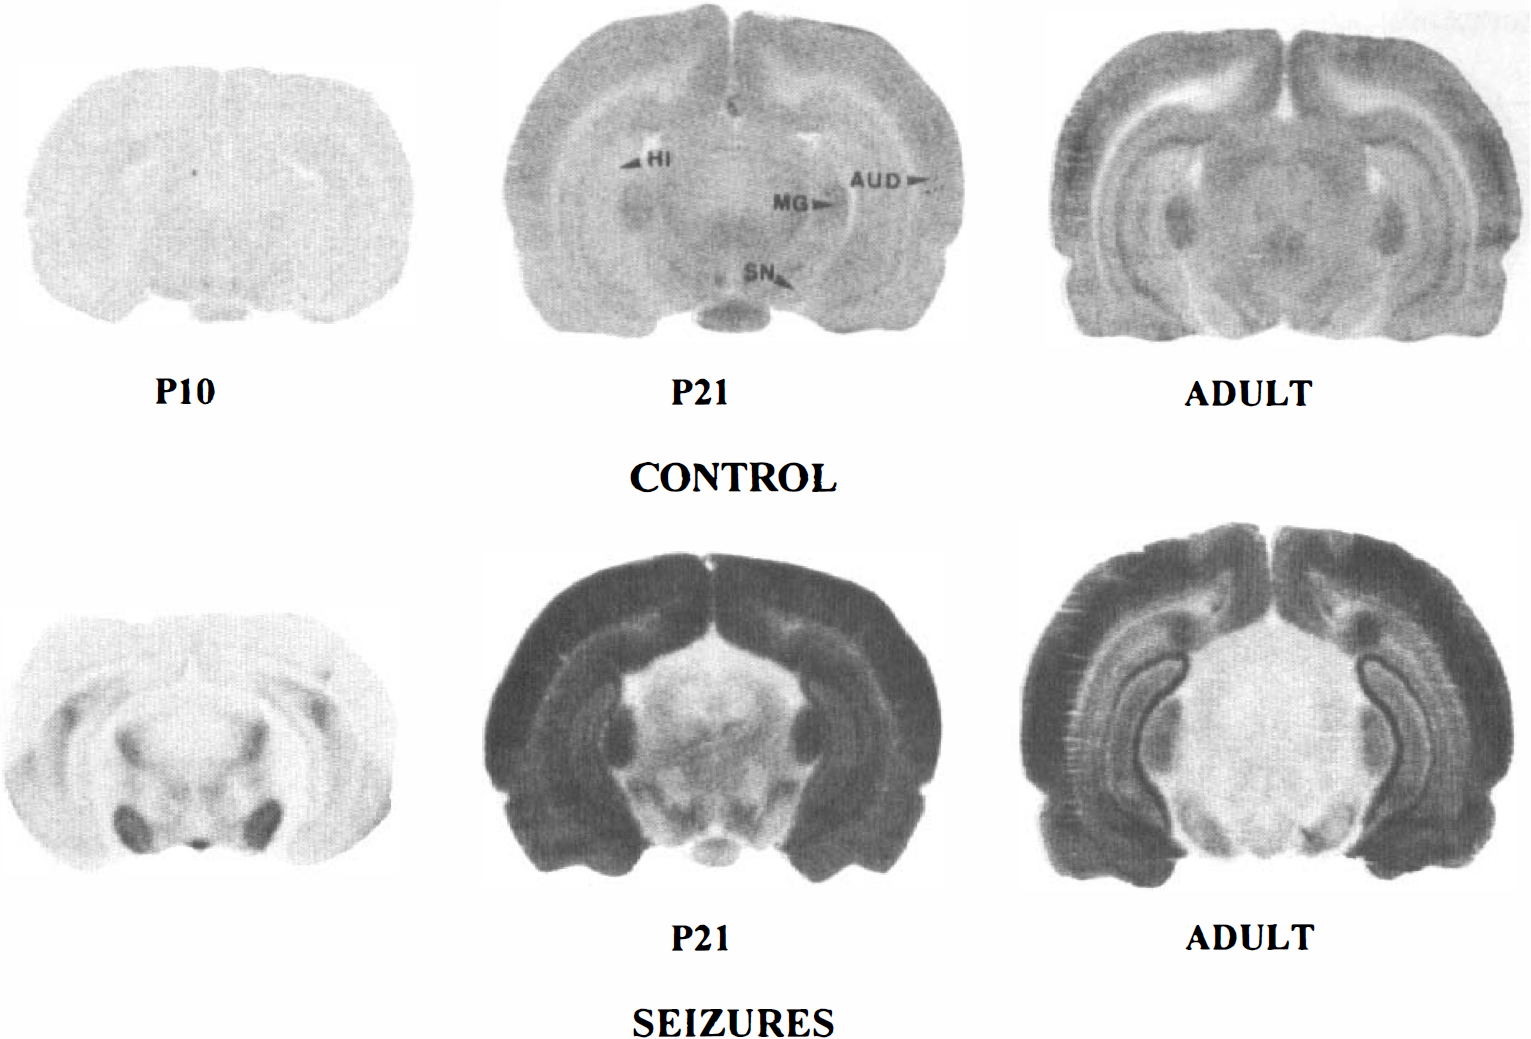
[14C]2DG autoradiographs of rat brain sections taken at the level of the substantia nigra (SN) in P10, P21, and adult control and lithium-pilocarpine-treated rats. Note the low and homogeneous level of grain density in P10 control rats. In P21 control rats, the optical density is increased in all brain areas compared with P10 control rats. It becomes more differentiated especially in the cortex, hippocampus, and medial geniculate body (MG) of adult control animals. During lithium-pilocarpine-induced SE, grain density is largely increased over control levels in cortical regions, including the auditory cortex (AUD) and hippocampus (HI) of P21 and adult animals. The increase in optical density is more marked in P21 rats than in adult rats, especially in the subcortical regions. In P10 rats, there is a moderate increase in grain density in the hippocampus and a marked increase in the substantia nigra.
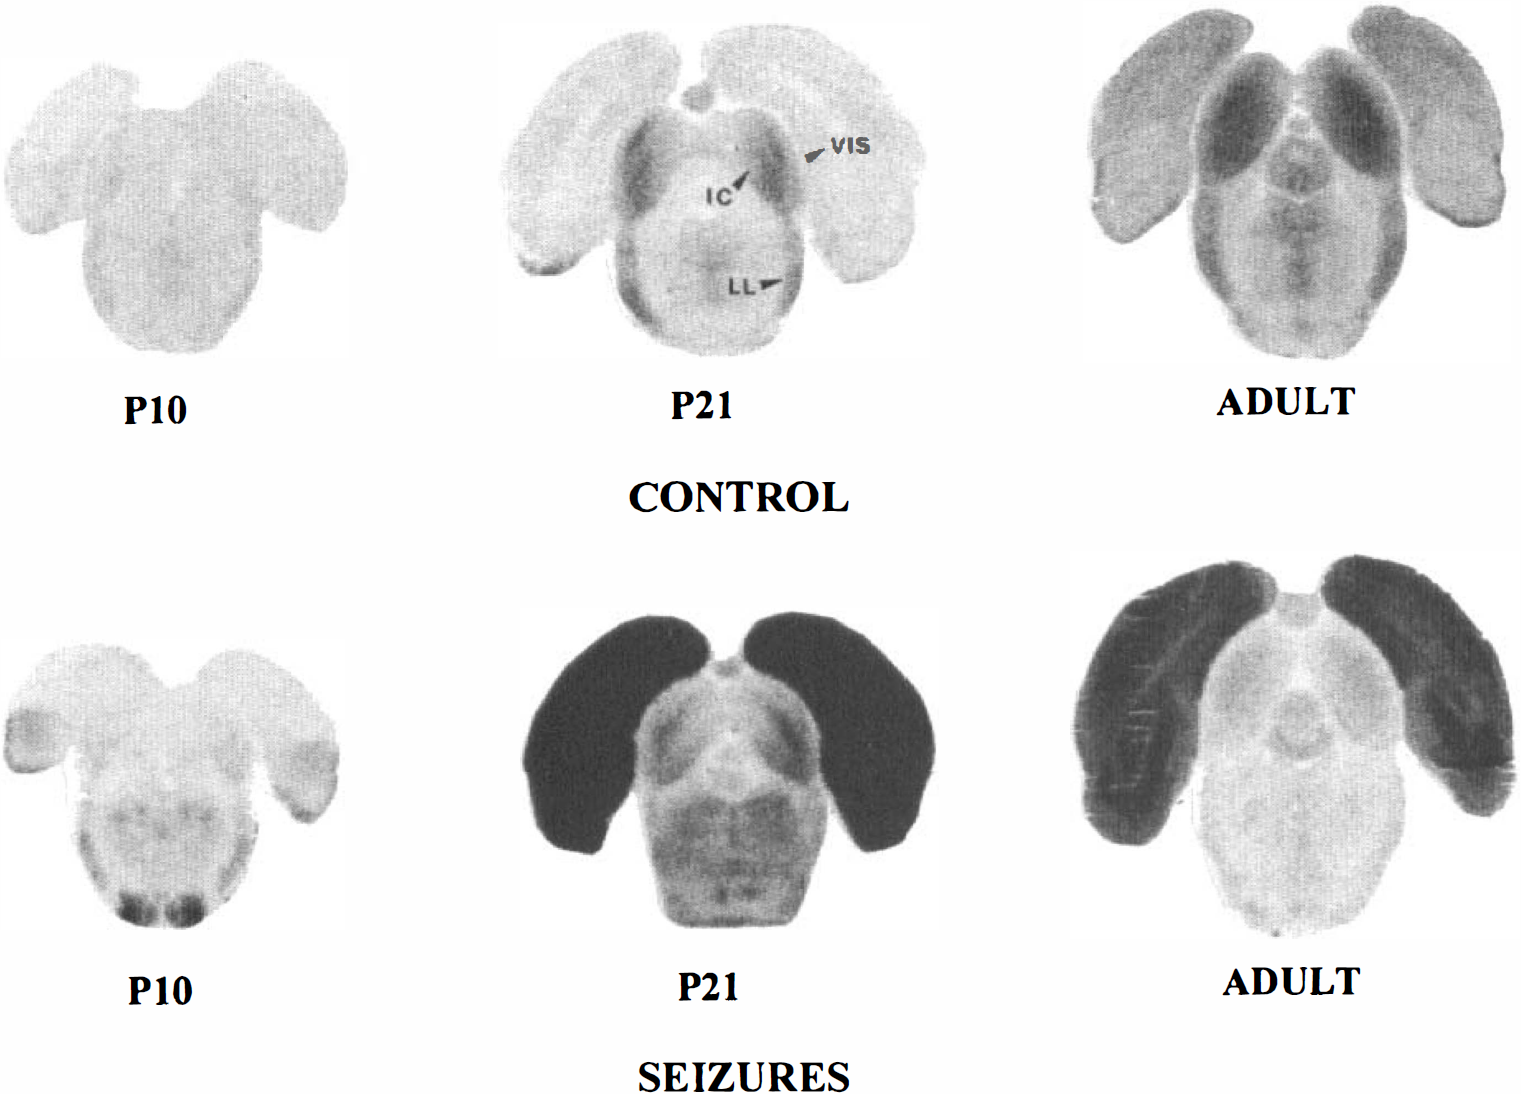
[14C]2DG autoradiographs of rat brain sections taken at the level of the inferior colliculus (IC) in P10, P21, and adult control and lithium-pilocarpine-treated rats. Note the low and homogeneous level of grain density in control P10 rats. In P21 control rats, the optical density is increased in all brain areas compared with P10 control rats, especially in the inferior colliculus and lateral lemniscus. This differentiation increases in adult compared with P21 control rats. In adult rats subjected to lithium-pilocarpine-induced SE, grain density is largely increased over control levels in the visual cortex (VIS), but the optical density is unchanged in the brainstem regions and appears decreased in the inferior colliculus compared with control levels. In P21 rats subjected to seizures, the increase in optical density is more marked than in adult rats, especially in the visual cortex and also in brainstem regions that show some metabolic activation compared with control levels. In P10 rats, there is a low increase in grain density in the basal visual cortex and a marked increase in the superior olive.
At P21, LCMRglc values significantly increased in the lithium-pilocarpine-compared with the lithium-saline-exposed exposed rats in all structures, except in the inferior colliculus (Tables 2 and 3). Increases were very prominent in all cerebral cortices, forebrain regions, and hypothalamic and thalamic nuclei, reaching values ranging from 378 to 874% over control levels, except in the zona incerta, interpeduncular nucleus, and mamillary body where they were more moderate (95 to 234%). In all midbrain and brainstem regions, metabolic increases induced by SE were also rather moderate and ranged from 56 to 232%. The very large metabolic increases recorded during lithium-pilocarpine-induced SE in P21 rats appeared on the autoradiograms shown in Figs. 1 to 4 as almost black grain densities, especially in all cortical areas, caudate nucleus, hippocampus, hypothalamus, and thalamus.
In adult rats subjected to SE, LCMRglc values were increased over control values in all cortical and thalamic regions as well as in most forebrain and hypothalamic nuclei (Tables 2 and 3). These increases ranged from 275 to 720% over control levels. Conversely, in midbrain and brainstem, LCMRglc values were increased by pilocarpine only in the two parts of the substantia nigra, pontine and medullary reticular formation, cerebellar cortex, nuclei, and white matter. On the autoradiograms shown in Figs. 1 to 4, the cerebral regions activated by the seizures appeared as very dark areas. They included all parts of the cerebral cortex, the caudate nucleus, septum, hippocampus, and thalamus. However, the activated areas were less dark in adult than in P21 animals subjected to seizures, reflecting the more moderate increase of metabolic activity in adult than P21 rats.
At P10, LCMRglc values were significantly (P < 0.05) lower in the lithium-saline than in the saline-saline group in all nuclei of the amygdala. In P21 rats, the pretreatment with lithium induced metabolic decreases mainly in cortical and thalamic regions as well as in scattered structures from forebrain and brainstem. In adult rats, the lithium pretreatment decreased LCMRglc values compared with saline-saline-treated rats in six cortical areas and the hippocampal CA1 area (data not shown).
Neuronal degeneration
Control animals of all ages were devoid of any silver staining, confirming the lack of effect of the lithium treatment on cell integrity (Fig. 5a and 6a). In P10 rats, scattered degenerating neurons were detected only in the dentate gyrus hilus and piriform and entorhinal cortices. This pattern was present in only three of the six animals studied (Fig. 5b and 6b).
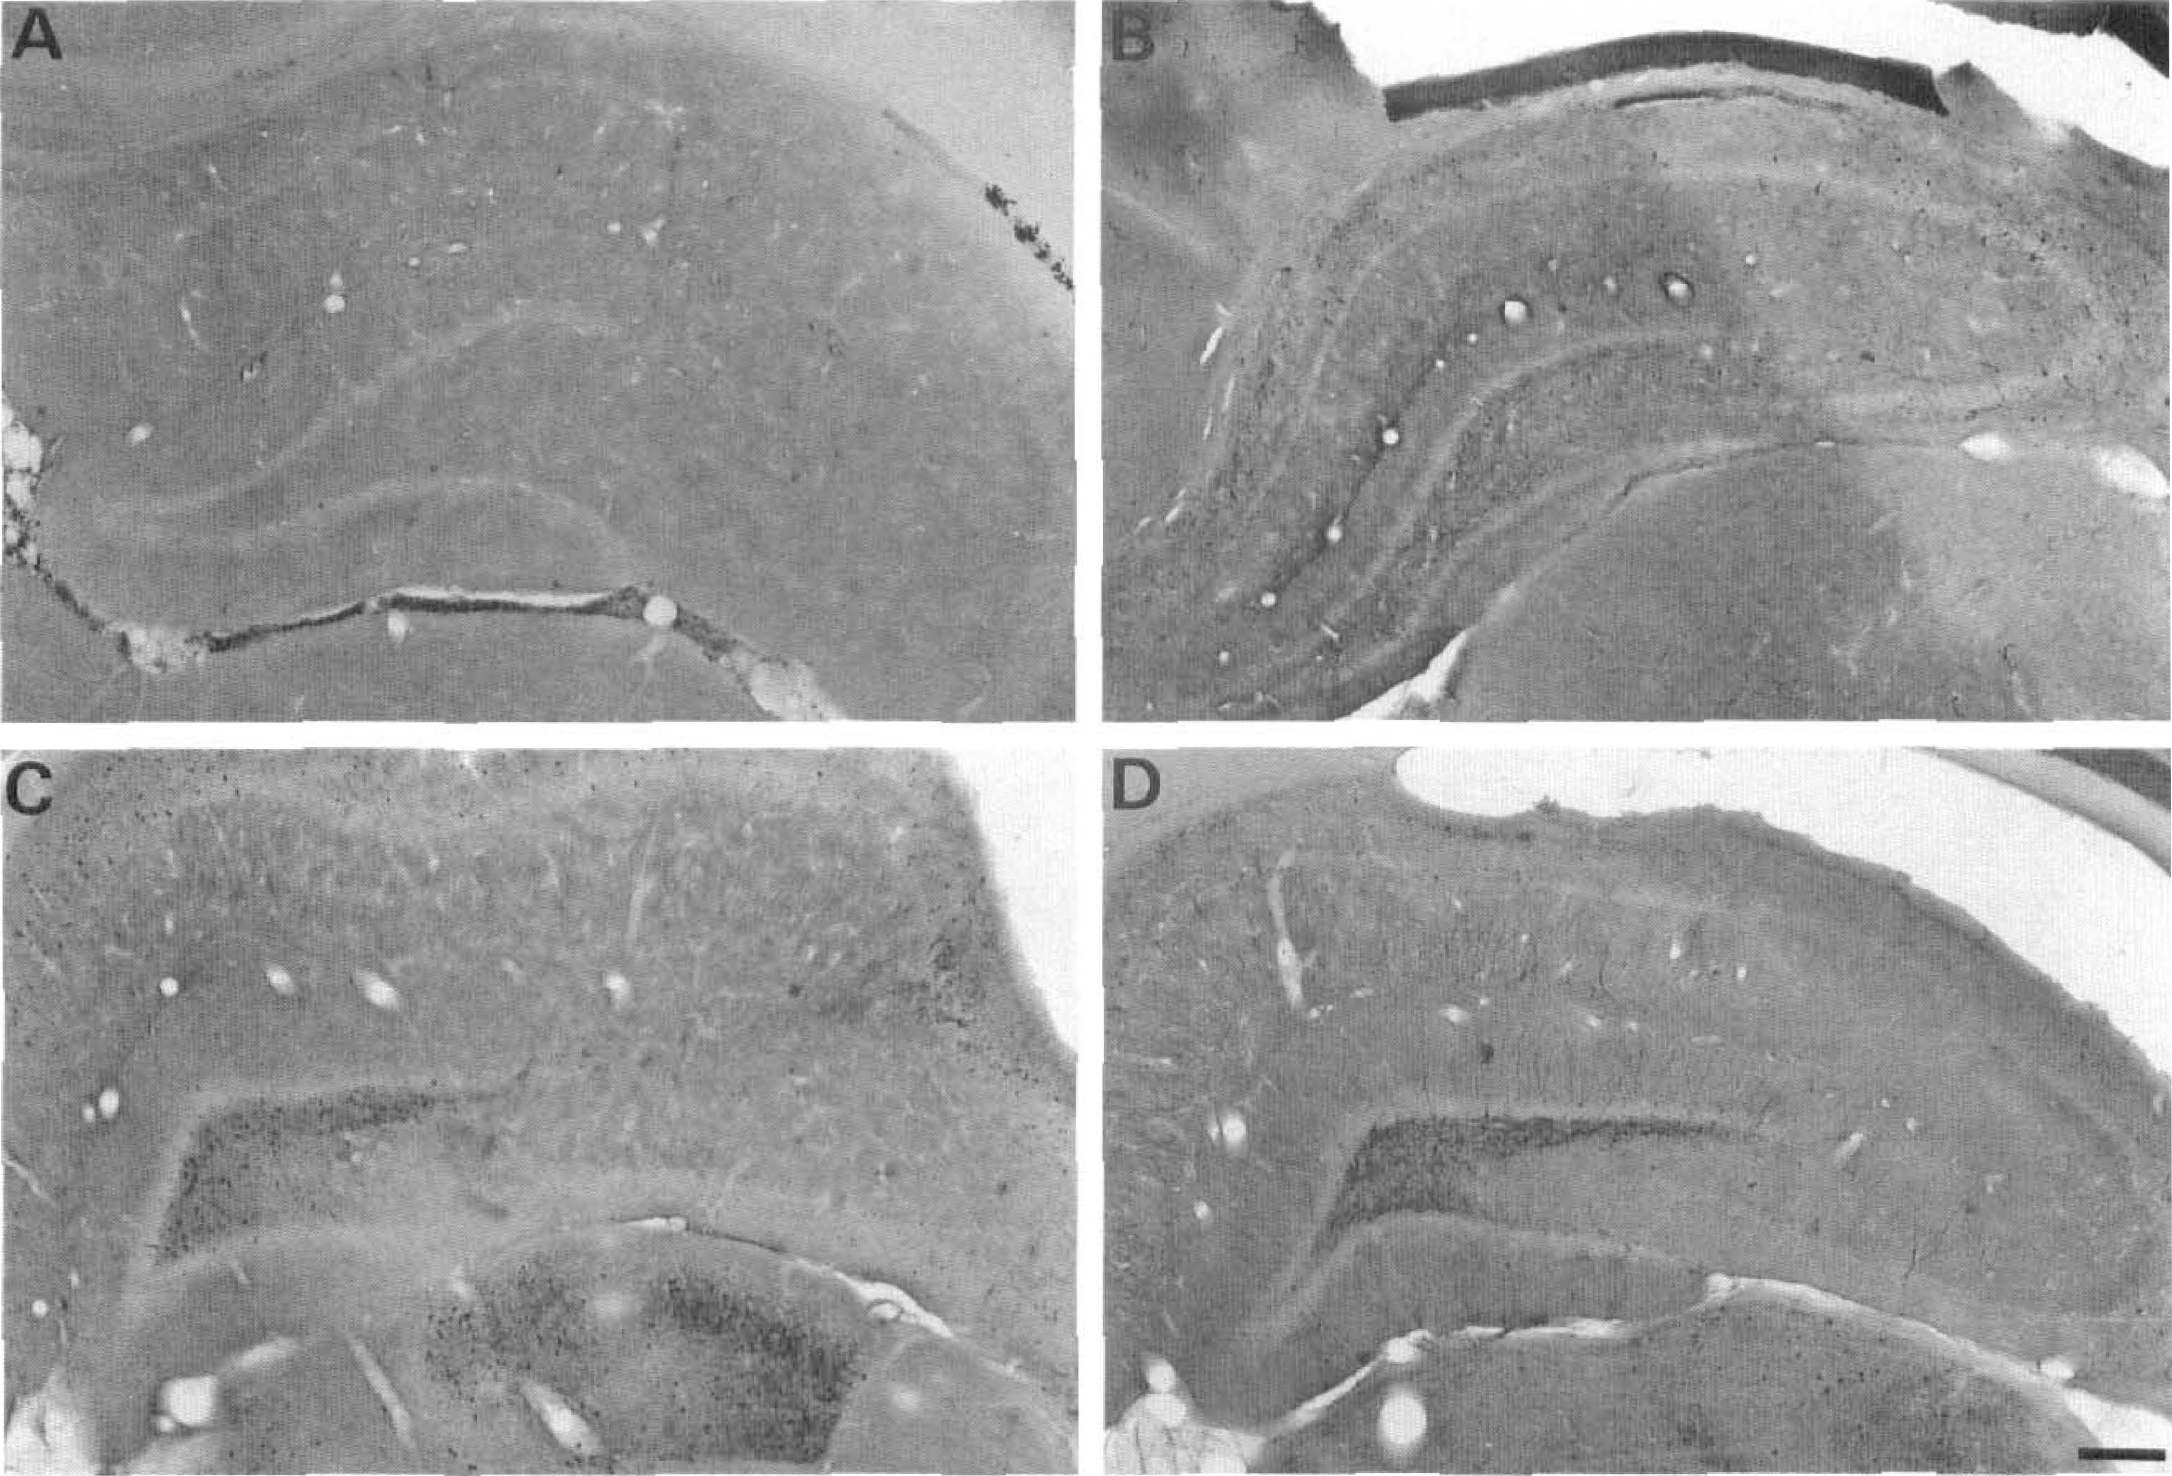
Photomicrographs of silver-stained sections from P10, P21, and adult rats taken at the level of the hippocampus and the dorsal thalamus. Animals were killed 6 hours after the onset of lithium-pilocarpine-induced SE or at an equivalent time for controls. The control adult rats were devoid of any dark cells, at the level of both the hippocampus and dorsal thalamus
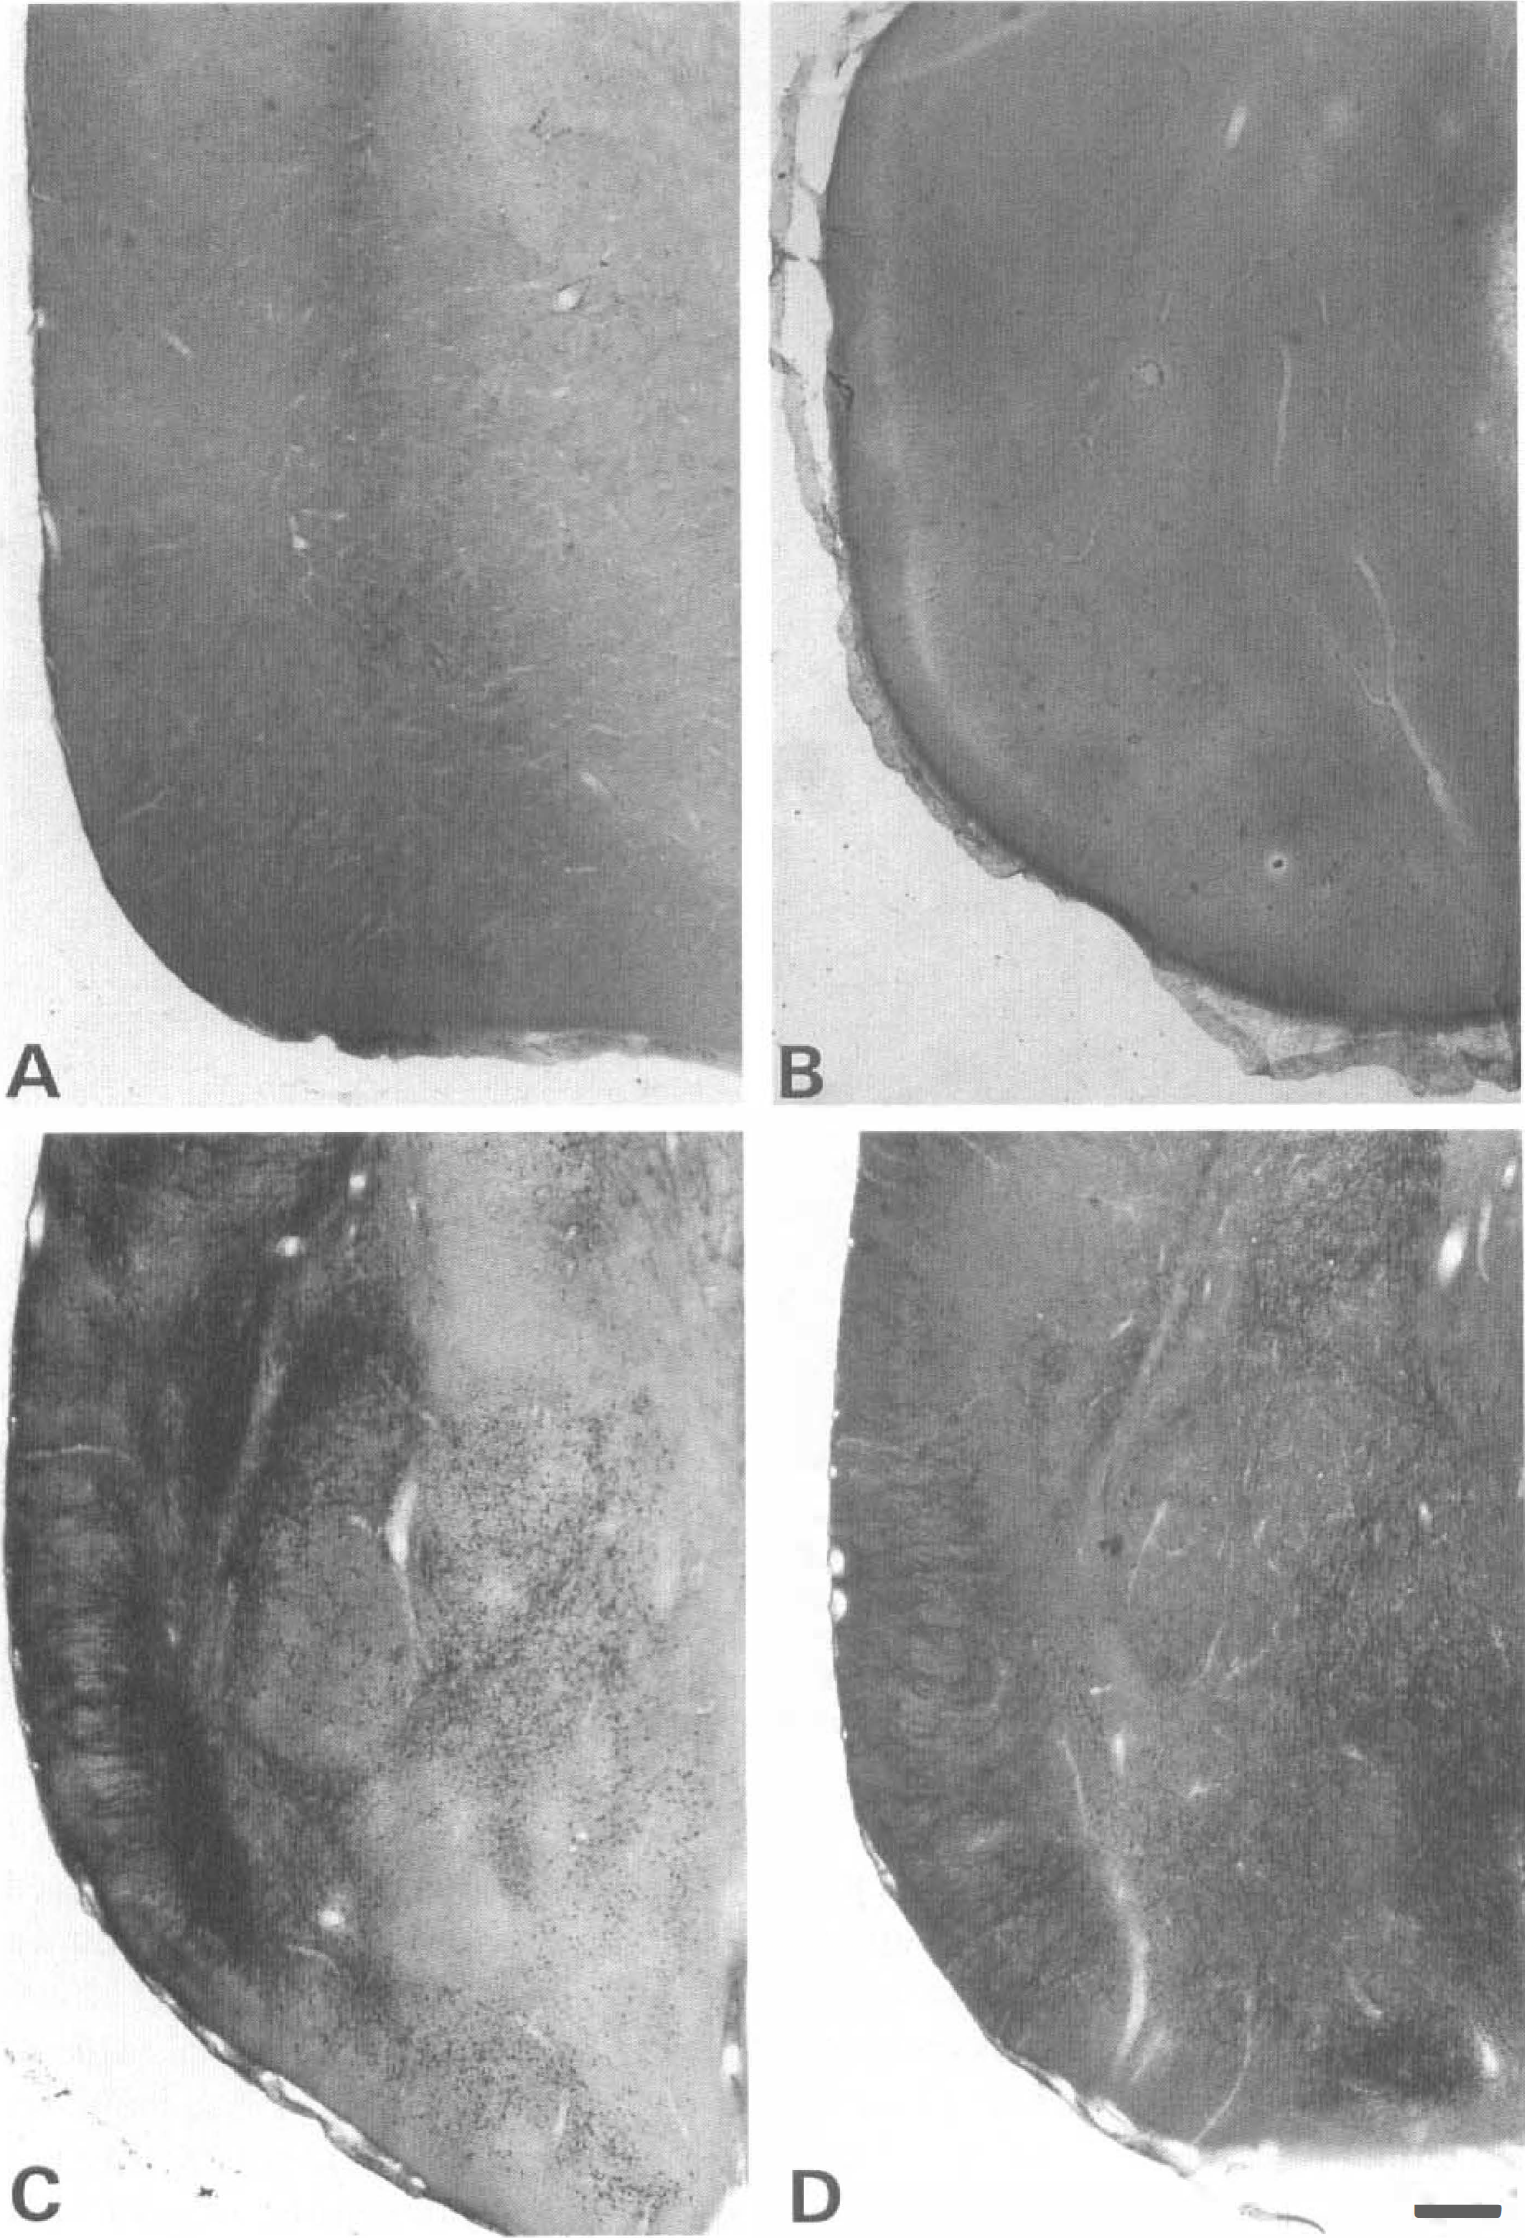
Photomicrographs of silver-stained sections from P10, P21, and adult rats taken at the level of the piriform cortex. Animals were killed 6 hours after the onset of lithium-pilocarpine-induced SE or at an equivalent time for controls. The control adult rats were devoid of any dark cells in the piriform cortex
In P21 rats, the density of degenerating neurons was high in the cerebral cortex and the amygdala and low to moderate in all other regions, the lateral septum, the primary olfactory cortex, the dentate gyrus hilus, and the thalamus (Fig. 5c and 6c). The midbrain-brainstem was devoid of injured neurons except the substantia nigra where their density was low.
In adult rats, the density of degenerating neurons was high in all parts of the cerebral cortex, as illustrated in the piriform cortex in Fig. 6d, and in the amygdala and low to moderate in all other regions, i.e., the lateral septum, the dentate gyrus hilus, and the thalamus, as shown in Fig. 5d.
Neuropathological changes
In adult rats, neuronal damage observed on cresyl violet-stained sections obtained at 6 days after the induction of SE and reported in Table 4 was similar to previous reports (Turski et al., 1983; Motte et al., 1998). There was almost a complete neuronal loss in the piriform and entorhinal cortices, hippocampal CA3 area and polymorphic layer of the dentate gyrus, basolateral and medial amygdala, mediodorsal thalamus, and anterior olfactory nuclei. In all other neocortical areas, the ventrolateral thalamus, nucleus accumbens, lateral septum, and substantia nigra pars reticulata, there was marked neuronal loss with shrunken and pyknotic neurons. Neuronal loss was quite moderate in the hypothalamus (Table 4). In the remaining regions, only isolated degenerating neurons could be seen (data not shown).
Effects of lithium-pilocarpine seizures on neuropathologic damage assessed on cresyl violet-stained sections from immature and adult rats
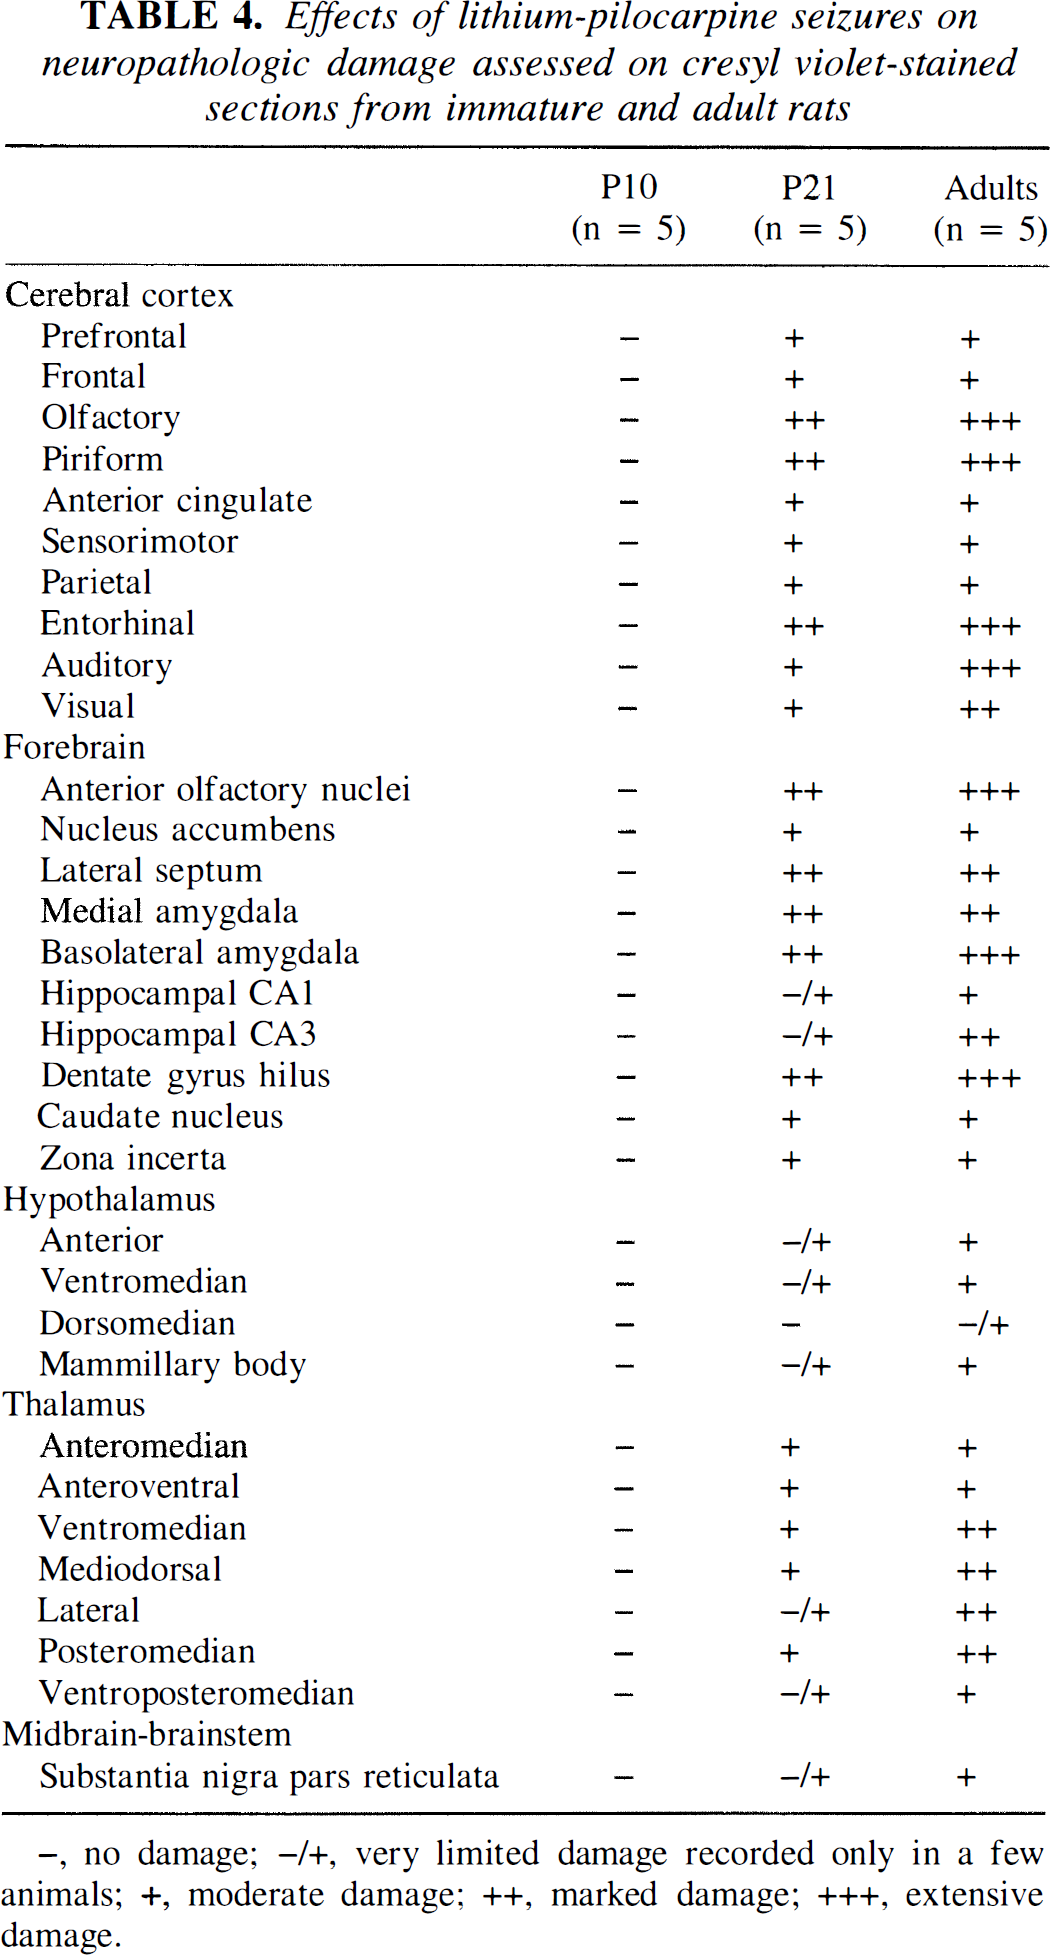
−, no damage; −/+, very limited damage recorded only in a few animals; +, moderate damage; ++, marked damage; +++, extensive damage.
In rats undergoing SE at P21, neuronal damage was located in the same areas as in adult rats; however, the extent of damage was more variable. Indeed, in some animals there was only very limited damage, whereas in others, the damage was almost as extensive as in adult rats. In the thalamus, there was less neuronal damage in P21 than in adult rats, and there was very limited damage in the substantia nigra at P21. In rats subjected to lithium-pilocarpine-induced SE at P10, no apparent neuronal loss could be seen at 6 days after SE in any brain region (Table 4).
DISCUSSION
The results of the present study show that during the second hour of lithium-pilocarpine-induced SE, the increases in LCMRglc recorded in adult rats were widespread, except in the brainstem. They were very prominent in vulnerable regions where the marked hypermetabolism occurred in regions that later developed neuronal damage. In the P21 rat, widespread and large metabolic increases occurred in almost every brain region. The correlation between marked hypermetabolism and neuronal damage was not as clear as in adult rats, especially given the variability of neuronal damage in this age group. Finally, in the P10 rat, LCMRglc values were mainly increased in the regions where these limbic seizures originate. However, in these regions, the metabolic increases were quite pronounced and occurred in the absence of damage.
Blood and brain glucose and lactate concentrations
In the present model of limbic seizures, SE did not induce any depletion in blood glucose concentration and even had a tendency to render the adult rats slightly hyperglycemic. The cerebral glucose concentration decreased after 60 minutes of seizures in P21 and adult rats and remained stable in PIO rats. This situation is quite similar to that recorded during the course of prolonged seizures induced by bicuculline in the adult rat brain (Chapman et al., 1977; Folbergrova et al., 1981). Conversely, in immature rats or monkeys subjected to prolonged seizures, usually cerebral glucose concentration is depleted (Fujikawa et al., 1988; El Hamdi et al., 1992), which did not occur in P10 rats in the present study. This may relate to the maintenance of a normal blood glucose concentration during lithium-pilocarpine-induced SE in P10 rats (Tables 1 and 2), which was not the case in the other models of seizures in immature animals (Fujikawa et al., 1988; El Hamdi et al., 1992). In P21 and adult rats, cerebral glucose concentration was moderately decreased, probably for the same reasons as in PI 0 rats, and these moderate changes had only limited consequences on the value of the lumped constant used for the calculation of LCMRglc.
Lithium-pilocarpine seizures induced an increase in circulating and whole-brain lactate concentration as previously shown in various models of sustained seizures in immature and adult animals (Chapman et al., 1977; Folbergrova et al., 1981; Fujikawa et al., 1988; El Hamdi et al., 1992). As in previous studies, whole-brain lactate concentrations recorded in P10 and P21 rats, although increasing by 3- to 4.5-fold during the first hour of SE, never reached values as high as in adult rats. In the adults, they increased during the whole duration of the seizures, which was not the case in immature animals, where they were stable at P21 or even slightly decreased at P10 during the second hour of SE. It has been shown that in neonates, even with prolonged seizures, lactate concentration in the brain plateaus at a maximal value of 8 to 12 µmol/g (Dwyer and Wasterlain, 1985; Fujikawa et al., 1988; El Hamdi et al., 1992), which was not reached in the present study. Conversely, in adult animals, brain lactate concentrations may increase up to 15 to 20 µmol/g if blood pressure or arterial PO2 is lowered (Blennow et al., 1978). Given the low level of monocarboxylic acid transporter present in the blood-brain barrier of adult animals, the increase in cerebral lactate concentrations is independent of the very high arterial lactate levels induced by excessive seizure activity. Conversely, in immature rats, the high density of monocarboxylic acid carrier present in the blood-brain barrier (Cremer et al., 1979) allows the equilibration between the arterial and cerebral lactate compartments. This maturation-related difference explains why in immature animals, lactate never accumulates in the brain to the same extent as in adult animals subjected to seizures or ischemia (Dwyer and Wasterlain, 1985; Fujikawa et al., 1988). An alternative explanation is that the very immature animals do not develop the same type of seizures as adult animals, especially because of the immaturity of the brain circuitry. Therefore, the maturation-related type of seizures expressed by the rats may also underlie the age-dependent rate of production of lactate.
The origin of the cerebral accumulation of lactate in face of the large increase in LCMRglc during seizures remains unclear. The 2DG method does not allow discrimination between the various possible fates of glucose metabolism as the 2DG metabolism is stopped after its first phosphorylation. Therefore, it is impossible to know whether the glucose taken up by the brain will be fully oxidized or only metabolized by the anaerobic glycolysis pathway. If the latter predominates during seizures, then it is clear that more glucose will be taken up by the brain because the energetic yield of the anaerobic glycolysis is 18 times lower than that of the oxidative breakdown. Several authors have shown the accumulation of lactate in the immature and adult brain during seizures (Chapman et al., 1977; Folbergrova et al., 1981; Fujikawa et al., 1988; El Hamdi et al., 1992). The rise in cerebral lactate concentration occurs as a result of seizure activity, even in well oxygenated animals (Ingvar et al., 1987; Ingvar and Siesjö, 1990). In the present study, lactate accumulation is not related to hypoxia as the animals do not experience any episode of apnea during the seizures and their PO2 remains elevated even after 105 minutes of SE. The cerebral lactic acidosis recorded in the present study may also relate to the high blood glucose concentration, which remains in the normal range in immature rats and is even significantly increased by lithium-pilocarpine-induced seizures in adult rats. Indeed, an increase in blood glucose concentration intensifies seizure activity and increases both the metabolic activity and the production of lactate, especially in mature animals (Ingvar and Siesjö, 1990). In immature rats, glucose is predominantly metabolized by the anaerobic glycolysis pathway as the enzymes responsible for the oxidative glucose breakdown start their rapid maturation phase after P21 (for review see Nehlig and Pereira de Vasconcelos, 1993). Therefore, it is not surprising that brain metabolism that is largely activated by seizures leads to an active production of lactate, especially in P10 rats. However, the immature rat uses, in addition to glucose, ketone bodies to support its metabolic and biosynthetic needs (for review see Nehlig and Pereira de Vasconcelos, 1993). These substrates enter directly the citric acid cycle as acetyl-CoA and therefore do not contribute to the production of lactate. Thus, the metabolic activation induced by SE in the very immature brain is likely even larger than the one reflected by the increase in LCMRglc. However, there is no quantitative regional approach to assess the contribution of ketone body use to the hypermetabolism linked to seizures. Finally, except in the very immature rat brain in which the production of lactate is mostly related to anaerobic glycolysis in the brain of the P21 and adult rat, it is impossible to discriminate what proportion of lactate production corresponds to aerobic and anaerobic glycolysis, respectively. It is clear that if anaerobic glycolysis is largely stimulated by seizures, then the increase in 2DG uptake recorded in the present study will represent hyperconsumption of glucose rather than true hypermetabolism. Other approaches will be necessary to solve this issue.
LCMRglc and the circuitry of seizures
The electrographic characterization of lithium-pilocarpine seizures shows that spiking activity appears concurrently in the amygdala, dorsal hippocampus, limbic cortex, and caudate-putamen and rapidly progresses to generalized SE (Morrisett et al., 1987). An early involvement of the ventral pallidum and/or the nucleus accumbens has also been suggested (Clifford et al., 1987). After the activation of the primary sites, the seizures spread to the whole neocortex, including all sensory areas, and linked thalamic and striatal structures are recruited (Handforth and Treiman, 1995a). The localization of the regions of origin of lithium-pilocarpine seizures coincides with the structures where the density of muscarinic receptors is also highest (Nonaka and Moroji, 1984). The cholinergic system plays a role in triggering and maintaining sustained seizure activity but is not neurotoxic per se. Conversely, the excessive cholinergic activation leading to the spread of seizure activity beyond the initial focus drives glutamatergic mechanisms responsible for the occurrence of SE and brain damage. Indeed, the distribution of neuronal damage induced by high-dose pilocarpine or lithium-pilocarpine SE correlates quite well with the distribution of glutamatergic receptors and the nature of the damage induced by excitotoxic mechanisms (Olney et al., 1986).
In the P10 rat, the metabolic activation induced by lithium-pilocarpine SE is restricted to some parts of the cerebral cortex (frontal, olfactory, piriform, and entorhinal), the whole forebrain including the nucleus accumbens, the anterior olfactory nuclei, septum, amygdala, hippocampus, the caudate nucleus, and the globus pallidus. The only structures activated in the midbrain are the two parts of the substantia nigra. The early activation of the substantia nigra likely reflects the gating function of that structure in controlling the spread of seizure activity, as previously shown in various models of seizures (Depaulis et al., 1994). Thus, in the very immature rat, with the exception of the substantia nigra, the metabolic activation seems to remain more or less restricted to the brain regions in which the seizure activity has been shown to originate in adult rats (Clifford et al., 1987; Morrisett et al., 1987), and there is no spread to areas such as the sensory nuclei, the other parts of the cerebral cortex, as well as the thalamic nuclei. These data are in good accordance with a previous report showing the lack of spread of kainate-induced seizure activity in P11 rats due to the incomplete maturation of the limbic circuitry, particularly in the amygdala (Tremblay et al., 1984). The lack of spread of the metabolic activation to other cerebral regions of P10 rats might also reflect the incomplete development of the cholinergic neurons and receptors that are only functionally mature around P18 to P20 (Staudacherova et al., 1978).
In P21 and adult rats, large metabolic increases occurred in the entire forebrain, the cerebral cortex, hypothalamus, and thalamus. In the midbrain and brainstem, metabolic increases were restricted to both parts of the substantia nigra, the reticular formation, and the cerebellum, especially in adult animals. In P21 rats, the brainstem seemed to be more intensely involved in the response to lithium-pilocarpine-induced SE than in adult rats. These data are in good accordance with previous quantitative or semiquantitative measurements of LCMR
The most striking difference between P21 and adult rats subjected to lithium-pilocarpine SE is the degree of metabolic activation over basal levels. Indeed, in P21 rats, the increases in LCMRglc induced by the sustained seizures were ~1.5- to 2-fold higher than those recorded in adult animals. This very large metabolic activation induced by lithium-pilocarpine in the P21 rat brain is paralleled by a stronger expression of the c-Fos protein in P21 compared with adult rats in the same model of seizures (unpublished data). Likewise, the induction of c-Fos expression is also more marked in P21 than in adult rats subjected to pentylenetetrazol seizures of increasing severity (André et al., 1998). This very large brain activation in response to seizure activity may reflect the increased sensitivity of rodents in the third week of life to seizures (Ben Ari et al., 1984). However, it must also be taken into account that although the percentages of change in metabolic activity were larger during lithium-pilocarpine seizures in P21 than in adult rats, the absolute change is much less marked at P21 because basal metabolic values at that age are 2- to 2.5-fold lower than those in adult rats (Tables 2 and 3; Figs. 1 to 4).
LCMRglc and neuropathological damage
In adult rats, the large increases in LCMR
Although the correlation between the regions with excessive hypermetabolism and the distribution of neuronal damage is quite good, some exceptions can be noticed in the present study. Indeed, the most striking examples are the hypothalamic nuclei plus the caudate nucleus and globus pallidus, which undergo excessive metabolic activation without any damage. This lack of correlation was already reported in a previous study with high dose of pilocarpine or lithium-pilocarpine-induced seizures (Clifford et al., 1987). The activation of hypothalamic nuclei likely reflects the activation of all systems involved in the maintenance of vital functions like thermoregulation, arterial blood pressure regulation, body fluid balance, and visceral functions that are all severely compromised during lithium-pilocarpine-induced SE. Moreover, it appears that the structures with large metabolic activation during SE but no neuronal damage do not undergo a late phase of metabolic depression, as characterized at 15 to 27 hours after the onset of lithium-pilocarpine-induced seizures (Handforth and Treiman, 1995b). This late metabolic depression has been shown in other models of seizures to coincide with the onset of neuronal damage (Ingvar and Sisejö, 1990). Furthermore, as shown in previous studies, there is no consistent correlation between the regional distribution of brain damage (Turski et al., 1983; Clifford et al., 1987; Cavalheiro, 1995; present study) and regions with high muscarinic cholinergic receptor density (Nonaka and Moroji, 1984), whereas the regional distribution of glutamatergic receptors and neuronal damage coincides rather well (Olney et al., 1986).
In immature rats, the correlation between metabolic activation and neuronal damage is less obvious than in adult animals. At P21, neuronal damage is located in the same regions as in adult rats, although being more variable in extent and usually less marked than in adult animals, especially in the cerebral cortex, the thalamus, and the substantia nigra. However, in P21 rats, the metabolic activation recorded during the second hour of lithium-pilocarpine-induced SE was as large as or even larger than in adult animals when expressed as the percentage of increase over control basal values. The striking feature of the P21 rat is the lack of correlation between the intensity of neuronal damage that varied considerably among animals and the prominent hypermetabolism that was uniform and present to about the same degree in all animals. Moreover, conversely to adult rats that develop spontaneous seizures after a silent seizure-free phase of a mean duration of 14 days (Cavalheiro, 1995), only 22% of the P21 rats will exhibit spontaneous recurrent seizures after a silent seizure-free period lasting for a mean duration of 37 days (Priel et al., 1996). Therefore, in the P21 age group, there is no evidence of a relationship between metabolic increases, neuronal damage, and epileptogenesis. Finally, some regions of the P10 rat brain were able to sustain large metabolic activations without developing cell damage. The lack of neuronal damage in the very young rat has been previously shown in many other models of seizures in rodents, including those induced by kainate, glutamate, and pilocarpine. The sensitivity to seizure-induced neuronal damage appears usually toward the end of the third postnatal week, as in the present study (Ben Ari et al., 1984; Sperber et al., 1991; Priel et al., 1996). The lack of neuronal damage in the very immature rat has been attributed to the incomplete circuitry, mainly in the limbic system, thus limiting the spread and consequences of seizures (Ben Ari et al., 1984; Sperber et al., 1991). An alternative explanation is that the immaturity of the P10 rat brain does not allow the development of seizures that resemble in expression and severity those expressed by older animals, thus limiting their possible neuropathological consequences.
In the present study, the lack of damage in the P10 rat following SE reflects partly the incomplete maturation of the limbic circuitry preventing the large spread of seizure activity to connected structures as well as the delayed development of the cholinergic neurons and receptors that are only functionally mature around P18 to P20 (Staudacherova et al., 1978). Moreover, the lack of damage in the very immature rat brain might relate to the very low basal metabolic level in the brain of the P10 rat (Nehlig et al., 1988), thus allowing quite large increases without deleterious consequences. At that age, brain energy metabolism is still dependent on anaerobic glycolysis. The latter pathway is always largely activated when the animal has to sustain enhanced energy needs because it is energetically much less productive than the oxidative glucose breakdown. At P21, brain oxidative energy metabolism is still not totally developed as the activity of enzymes of the tricarboxylic acid cycle or the cytochrome oxidase most steeply develops between P21 and P35 (for review see Nehlig and Pereira de Vasconcelos, 1993). Therefore, this delayed maturation of glucose oxidative breakdown might underlie the larger increases in LCMR
Effects of lithium pretreatment on LCMRglc
Lithium acts on the neurotransmitters dopamine and noradrenaline but particularly at the levels of the cholinergic system (Jope and Williams, 1994). Indeed, the cation increases the release of acetylcholine, the binding affinity of the agonist to the muscarinic receptor, and the transduction signal between the gene and the muscarinic receptor, probably by a mechanism involving the hydrolysis of phosphoinositides and the activation of protein kinase C (Jope and Williams, 1994). Lithium enhances also excitatory synaptic transmission in the hippocampus and cerebral cortex of immature and mature rats (Harvey et al., 1994). Thus, in control rats, the administration of lithium alone, which seems to act on the muscarinic cholinergic system, induces mainly changes in LCMR
CONCLUSION
The data of the present study show that the cerebral metabolic activation in response to lithium-pilocarpine-induced SE varies with postnatal age. The metabolic response is widespread and intense in P21 and adult rats at which ages the sustained seizure activity leads to an excessive increase in LCMRglc. In adult rats, the anatomical distribution of marked hypermetabolism correlates quite well with the distribution of neuronal damage. In P21 rats, although the metabolic activation is as large and as extended as in the adult rat brain, there is no clear correlation between hypermetabolism, the degree of neuronal damage, and the epileptogenesis. Finally, in the P10 rat, the metabolic activation is limited to the regions rich in muscarinic receptors in which the seizures originate, and there is no neuronal damage in spite of the large metabolic activation in these regions. The lack of damage at that age correlates both with the immaturity of the circuitry underlying the expression of lithium-pilocarpine SE and with the difference in the severity and expression of seizures in very immature compared with older animals.
Footnotes
Acknowledgment
The authors thank A. Ferrandon for excellent technical assistance.