
Abstract
We have developed a new method for estimation of regional CBF (rCBF) and cerebrovascular reserve capacity on a pixel-by-pixel basis by means of dynamic magnetic resonance imaging (MRI). Thirteen healthy volunteers, 8 patients with occlusion and/or high grade stenosis of the internal carotid artery (ICA), and 2 patients with acute stroke underwent dynamic susceptibility-weighted contrast enhanced MRI. Using principles of indicator dilution theory and deconvolution analysis, maps of rCBF, regional cerebral blood volume, and of the mean transit time (MTT) were calculated. In patients with ICA occlusion/stenosis, cerebrovascular reserve capacity was assessed by the rCBF increase after acetazolamide stimulation. Mean gray and white matter rCBF values in normals were 67.1 and 23.7 mL · 100 g−1 · min−1, respectively. Before acetazolamide stimulation, six of eight patients with ICA occlusions showed decreased rCBF values; and in seven patients increased MTT values were observed in tissue ipsilateral to the occlusion. After acetazolamide stimulation, decreased cerebrovascular reserve capacity was observed in five of eight patients with ICA occlusion. In acute stroke, rCBF in the central core of ischemia was less than 8 mL · 100 g−1 · min−1. In peri-infarct tissue, rCBF and MTT were higher than in unaffected tissue but rCBF was normal. Dynamic MRI provides important clinical information on the hemodynamic state of brain tissue in patients with occlusive cerebrovascular disease or acute stroke.
Keywords
Cerebrovascular diseases are among the leading causes of death in industrial nations. Therefore, estimation of hemodynamic parameters such as regional CBF (rCBF) and regional cerebral blood volume (rCBF) is of great clinical relevance. In the research environment, positron emission tomography (PET) has become the gold standard for the quantitative assessment of cerebrovascular disorders and of the pathophysiology of stroke (Gibbs et al., 1984; Itoh et al., 1987; Powers et al., 1987; Heiss et al., 1994; Nariai et al., 1995).
Dynamic susceptibility-contrast enhanced magnetic resonance imaging (MRI) is more widely available than PET. However, only relative (e.g., with respect to normal tissue) rather than absolute (i.e., in mL · 100 g−1) rCBV values were obtained in previous studies of brain tumors (Edelman et al., 1990; Aronen et al., 1994) or stroke (Edelman et al., 1990; Rosen et al., 1991; Warach et al., 1992; Sorensen et al., 1996; Warach et al., 1996).
Recently, it was shown that rCBV and rCBF (in mL · min−1 · 100 g−1 tissue) can be measured with dynamic MRI (Rempp et al., 1994). By using this method in combination with the well-established acetazolamide stimulation test, it was possible to assess cerebrovascular reserve capacity in patients with compromised cerebral perfusion (Gückel et al., 1995; Gückel et al., 1996). Because of the nontrivial mathematical deconvolution operation required for rCBF calculation (Zierler, 1962; Bassingthwaighte, 1967; Rempp et al., 1994; Rosen et al., 1994; Gückel et al., 1996), however, rCBF and cerebrovascular reserve capacity were measured only on a region-of-interest (ROI) basis in those studies. An alternative model for mapping of the regional distribution of rCBF which requires the knowledge of rCBF in a reference tissue has been presented by Ostergaard et al. (Ostergaard et al., 1996b). That approach, however, is limited by the fact that no reference tissue with known rCBF may exist in patients with cerebrovascular disease or after acetazolamide injection.
In this article, we present an important step for the improvement of the noninvasive magnetic resonance (MR)-based quantification of hemodynamic parameters. We have developed a method for high-resolution mapping of the regional distribution of rCBF without the need for a reference tissue, which allows visualization of cerebrovascular reserve capacity on a pixel-by-pixel basis. We show that hemodynamic parameters obtained with that method are consistent with those obtained with PET, and we show that it can be applied to the diagnostic assessment of patients suffering from acute stroke and cerebrovascular disease.
MATERIALS AND METHODS
Imaging protocol
MRI was performed on a clinical 1.5 Tesla whole-body MR system with conventional gradient system (MAGNETOM SP, Siemens, Erlangen, Germany). Before the dynamic MR examination, conventional T2-weighted MR images (repetition time, 2200 milliseconds; echo-time[TE], 80 milliseconds) were acquired using a spin-echo pulse sequence. For dynamic MRI, 32 sequential images from two slices were measured simultaneously before, during, and after antecubital vein bolus injection of 0.1 mmol/kg body-weight of the paramagnetic contrast medium (CM) Gd-DTPA (Magnevist, Schering, Berlin, Germany) using a susceptibility-weighted simultaneous dual fast low angle shot (SD-FLASH) pulse sequence (repetition time, 34 milliseconds; flip angle, 10°). (Perman et al., 1992; Rempp et al., 1994). One slice (TE, 28 milliseconds) was used to track the bolus passage of CM in brain parenchyma, the second slice (TE, 11 milliseconds) was positioned over the skull base to cut the brain feeding arteries perpendicularly to measure the arterial input function (AIP). Images were acquired with a 64 × 128 raw matrix and interpolated to 256 × 256 after data acquisition. A field-of-view of 220 mm and a slice thickness of 5 mm were used resulting in a spatial resolution of 1.9 × 3.9 × 5 mm3. Scan time was 2.2 seconds with no interscan delay.
Postprocessing
Images were transferred from the MR system to a workstation (3000 AXP, DEC, Maynard, MA) via DECNET (DEC) for data processing. Further image processing was performed using our own FORTRAN code and Interactive Data Language (IDL, Research Systems, Inc., Boulder, CO). A 3 × 3 uniform smoothing kernel was applied to the measured data. Signal-time curves S(t) were converted to concentration-time curves (C m (t)) on a pixel-by-pixel basis using the well established relation for purely susceptibility-weighted MR sequences (Rosen et al., 1991, Boxermann et al., 1995)
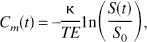
where TE denotes the echo-time, and S0 the baseline signal before CM administration. κ is an unknown proportionality constant that depends on the contrast agent, the pulse sequence, as well as on tissue and microvasculature properties (Kennan et al., 1994, Boxermann et al., 1995). In the process of further postprocessing, ratios of concentrations in brain tissue and of the AIP are used. Thus, rCBV and rCBF values are scaled directly by κbrain/κAIP, where κbrain and κAIP are the proportionality constants for brain tissue and for the AIP, respectively. Because a gradient-echo pulse sequence is used for measurement of the tissue and of the AIP signal, and because it was shown by numerical simulations that κ is largely independent of the vessel diameter for this type of pulse sequences (Boxermann et al., 1995), κbrain/κAIP = 1 is assumed. If other acquisition parameters or another type of pulse sequence are used, however, systematic errors arising from that assumption may be different from those in our study.
Principles of indicator-dilution theory were used to calculate hemodynamic parameters (Meier et al., 1954; Zierler, 1962; Bassingthwaighte, 1967). The AIP was derived from voxels in the middle cerebral artery (MCA) using a specially developed interactive computer program which has been previously described (Rempp et al., 1994). This computer program allows a standardized determination of the AIP. Pixels in the MCA (M1 segment) with characteristic attributes-a short transit time as well as a high and early concentration maximum-are identified. The AIP was determined as the mean Cm(t) for these pixels. Because of the limitation of the SD-FLASH sequence to a single AIP slice, typically only one MCA (left or right) was well visible within that slice. Therefore, the AIP obtained from that MCA was used for both hemispheres.
Regional CBV values, i.e., in mL 100 g−1 tissue, were obtained by (Axel, 1980; Rempp et al., 1994)
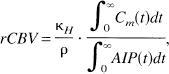
where C m (t) is the measured concentration-time-curve, ρ is the density of brain tissue (ρ = 1.04 g/mm3). Gd-DTPA is an extracellular tracer not entering erythrocytes (Koenig et al., 1986). Thus, the correction factor κH = (1 − H art )/(1 − H cap ) takes into account the different hematocrit in capillaries (H cap ) and the hematocrit in the large arterial vessel (H art = 0.45) used for AIP estimation (i.e., MCA). White matter capillary hematocrit (H cap = 0.25) was assumed for all calculations except for ROI evaluation of cortical gray matter, where H cap = 0.29 was used (Bereczki et al., 1993a; Bereczki et al., 1993b; Wei et al., 1993).
In contrast to Rempp et al. (Rempp et al., 1994), no gamma-variate function was fitted to C m (t) because in some patients C m (t) was not adequately described by that function, and because it would have dramatically increased the computation time for a good nonlinear fit in each pixel. To eliminate tracer recirculation, numerical integration of C m (t) in equation 2 was performed from the start of the bolus to the measurement where C m (t) had decreased to 30% of the peak bolus concentration in that pixel. This procedure results in an underestimation of rCBV and rCBF. On the other hand, in tissue with duration of bolus passage through the voxel comparable to or longer than the tracer recirculation time, an overestimation of rCBV and rCBF may occur. In case of the AIP, recirculation was eliminated by fitting a gamma-variate function to AIP(t). The integral over AIP(t) in equation 2 was calculated from the obtained fit-coefficients.
The mean transit time (MTT) is the mean time tracer particles require to pass through the capillary bed. If tracer arrives at the tissue as an infinitly short bolus, MTT can be calculated from the area-over-height relation (Meier et al., 1954; Zierler, 1962)
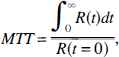
where R(t) is the residue, i.e., the amount of tracer remaining in the voxel at time t since bolus arrival. Blood flow was then calculated by using the Central Volume Principle (Steward, 1894)

Under in vivo conditions, however, an infinitely short bolus input into a voxel cannot be achieved because of limitations of the injection rate and because of dispersion of the bolus between the injection site and the respective voxel. Rather, the measured concentration-time curve in brain parenchyma C m (t) is related to the residue by
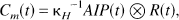
where ⊗ denotes the convolution operation. To calculate MTT and rCBF, R(t) has, therefore, to be calculated by deconvolution of equation 5 (Zierler, 1962; Bassingthwaighte, 1967; Weisskopf et al., 1993; Rempp et al., 1994; Ostergaard et al., 1996b) which, in terms of mathematical stability, represents a so-called ill-posed problem. As a consequence, deconvolution is very sensitive to noise in the measured data. It has been shown earlier that deconvolution using orthogonal polynomials (DOP) greatly decreases the sensitivity of the deconvolution procedure to noise when compared to other deconvolution techniques such as discrete deconvolution or Fourier transform deconvolution (Stritzke et al., 1990). In a first step, DOP consists of an approximation of AIP(t) by a sum of functions of a set of an orthogonal function system, e.g., Chebyshev polynomials of degree n. Using the obtained fit coefficients ακ and βκ (1 ⩽ κ ⩽ n, for definition of these coefficients confer to Stritzke et al., 1990), the convolution [equation 5] can then be solved analytically:
where t l denotes individual time points of the N equidistant MR data points with Δt = tl + 1 − t l . The fit coefficients ακ and βκ depend only on AIP(t) and on the type and degree n of the polynomials used. Therefore, they have to be calculated only once for each examination, and the deconvolution procedure is decreased to a simple calculation of the sums in equation 6. This can be performed within a few seconds even for a 256 × 256 image matrix. Applications of DOP to calculation of the linear response function from dynamic scintigraphy of the thyroid and in a flow phantom have been presented in previous studies (Stritzke et al., 1990; Kegeles et al., 1992). In our study, DOP was performed on a pixel-by-pixel basis with a function space of n = 3 Chebyshev polynomials. Higher degrees of n led to severe oscillations in the obtained residue functions in some patients. Before performing DOP, a delay correction was applied for each pixel by shifting C m (t) by integer multiples of Δt resulting in an apparently simultaneous onset of the bolus in the AIP and in the tissue. The number of multiples of Δt was determined from the onset of the bolus in the AIP and in C m (t), respectively. The criterion for the onset of bolus was that the next two data points of the smoothed concentration-time curve exceed 0.2*C peak , where C peak denotes the peak bolus concentration in that curve. In all cases, N = 15 MR measurement points were used for deconvolution. From the results of the deconvolution analysis, parametric images of MTT and rCBF were calculated using equation 3 and equation 4. Because of the limited signal-to-noise ratio (SNR), postprocessing failed in approximately 5% of the voxels within a slice. These voxels were often characterized by low peak bolus concentrations and/or long durations of bolus passage where noise severely degraded concentration-time curves. Hemodynamic parameters in these voxels were set to zero and excluded from further evaluation.
Volunteer study
Thirteen healthy volunteers (Table 1) were examined as controls. None had a history of neurologic illness. Before the MR examination, informed consent was obtained from the volunteers.
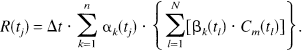
Hemodynamic parameters in normal volunteers
Mean value ± single SD from volunteers 1–11.
Volunteer was excluded from evaluation because of partial volume effects in AIP determination.
Patients
A total of 10 patients were examined (Table 2). Two patients were examined within 5 hours after acute onset of stroke symptoms due to an occlusion of one MCA. One of them (No. 10) had a history of transient ischemic attacks (TIA). In these patients, no acetazolamide stimulation test was performed. Eight patients suffered from a high grade stenosis or occlusion of the internal carotid artery (ICA). One of them (No. 8) presented with an additional 70% stenosis of the contralateral ICA. All patients with stenosis or occlusions suffered from TIA or prolonged reversible ischemic neurologic deficits. All diagnoses were based on conventional angiography and clinical examination. Before the MR examination, informed consent was obtained from the patients.
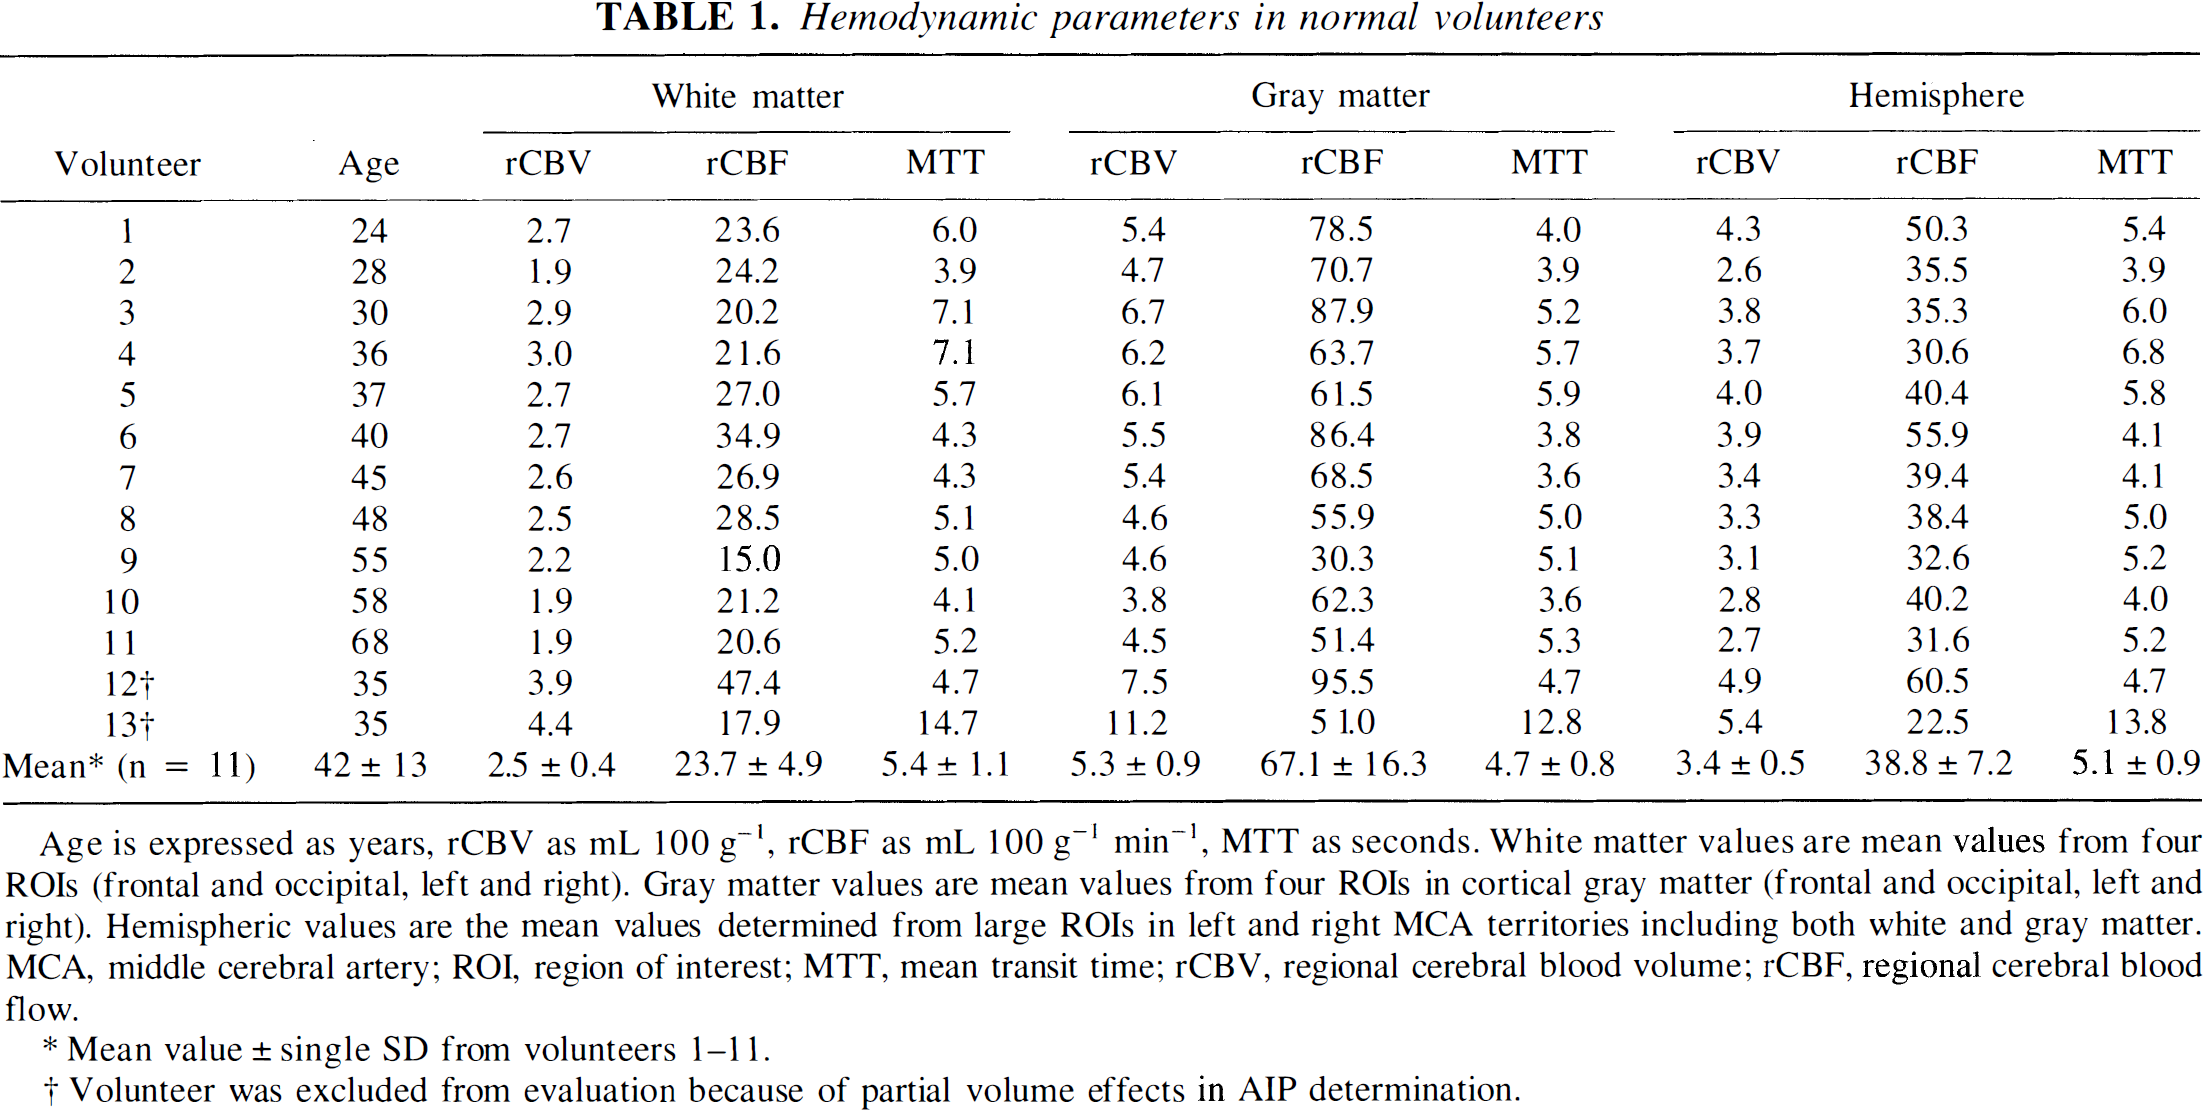
Hemodynamic parameters in patients before acetazolamide stimulation
Patient suffering from both, occlusion of one internal carotid artery and a 70% stenosis of contralateral internal carotid artery. The occluded side was considered ipsilateral.
Mean values ± single SD of parameters in patients 1–8.
Significant difference between ipsilateral and contralateral mean value in terms of paired, double (rCBV) or single-tailed (rCBF, MTT) Student t-test on a significance level of P = 0.05.
The acetazolamide test in patients with stenosis or occlusion of the ICA consisted of two examinations: A baseline examination with identical procedure as in volunteers and stroke patients was performed before acetazolamide stimulation. After this baseline examination, 1 g of acetazolamide (Diamox, Lederle Arzneimittel GmbH, Wolfratshausen, Germany) was injected intravenously, and 15 minutes later a second dynamic MR examination was performed. Identical slice positioning and measurement parameters were used for the pre-acetazolamide and post-acetazolamide MR measurements. The increase in rCBF after pharmacologic stimulation with acetazolamide was used to assess the cerebrovascular reserve capacity.
Data analysis
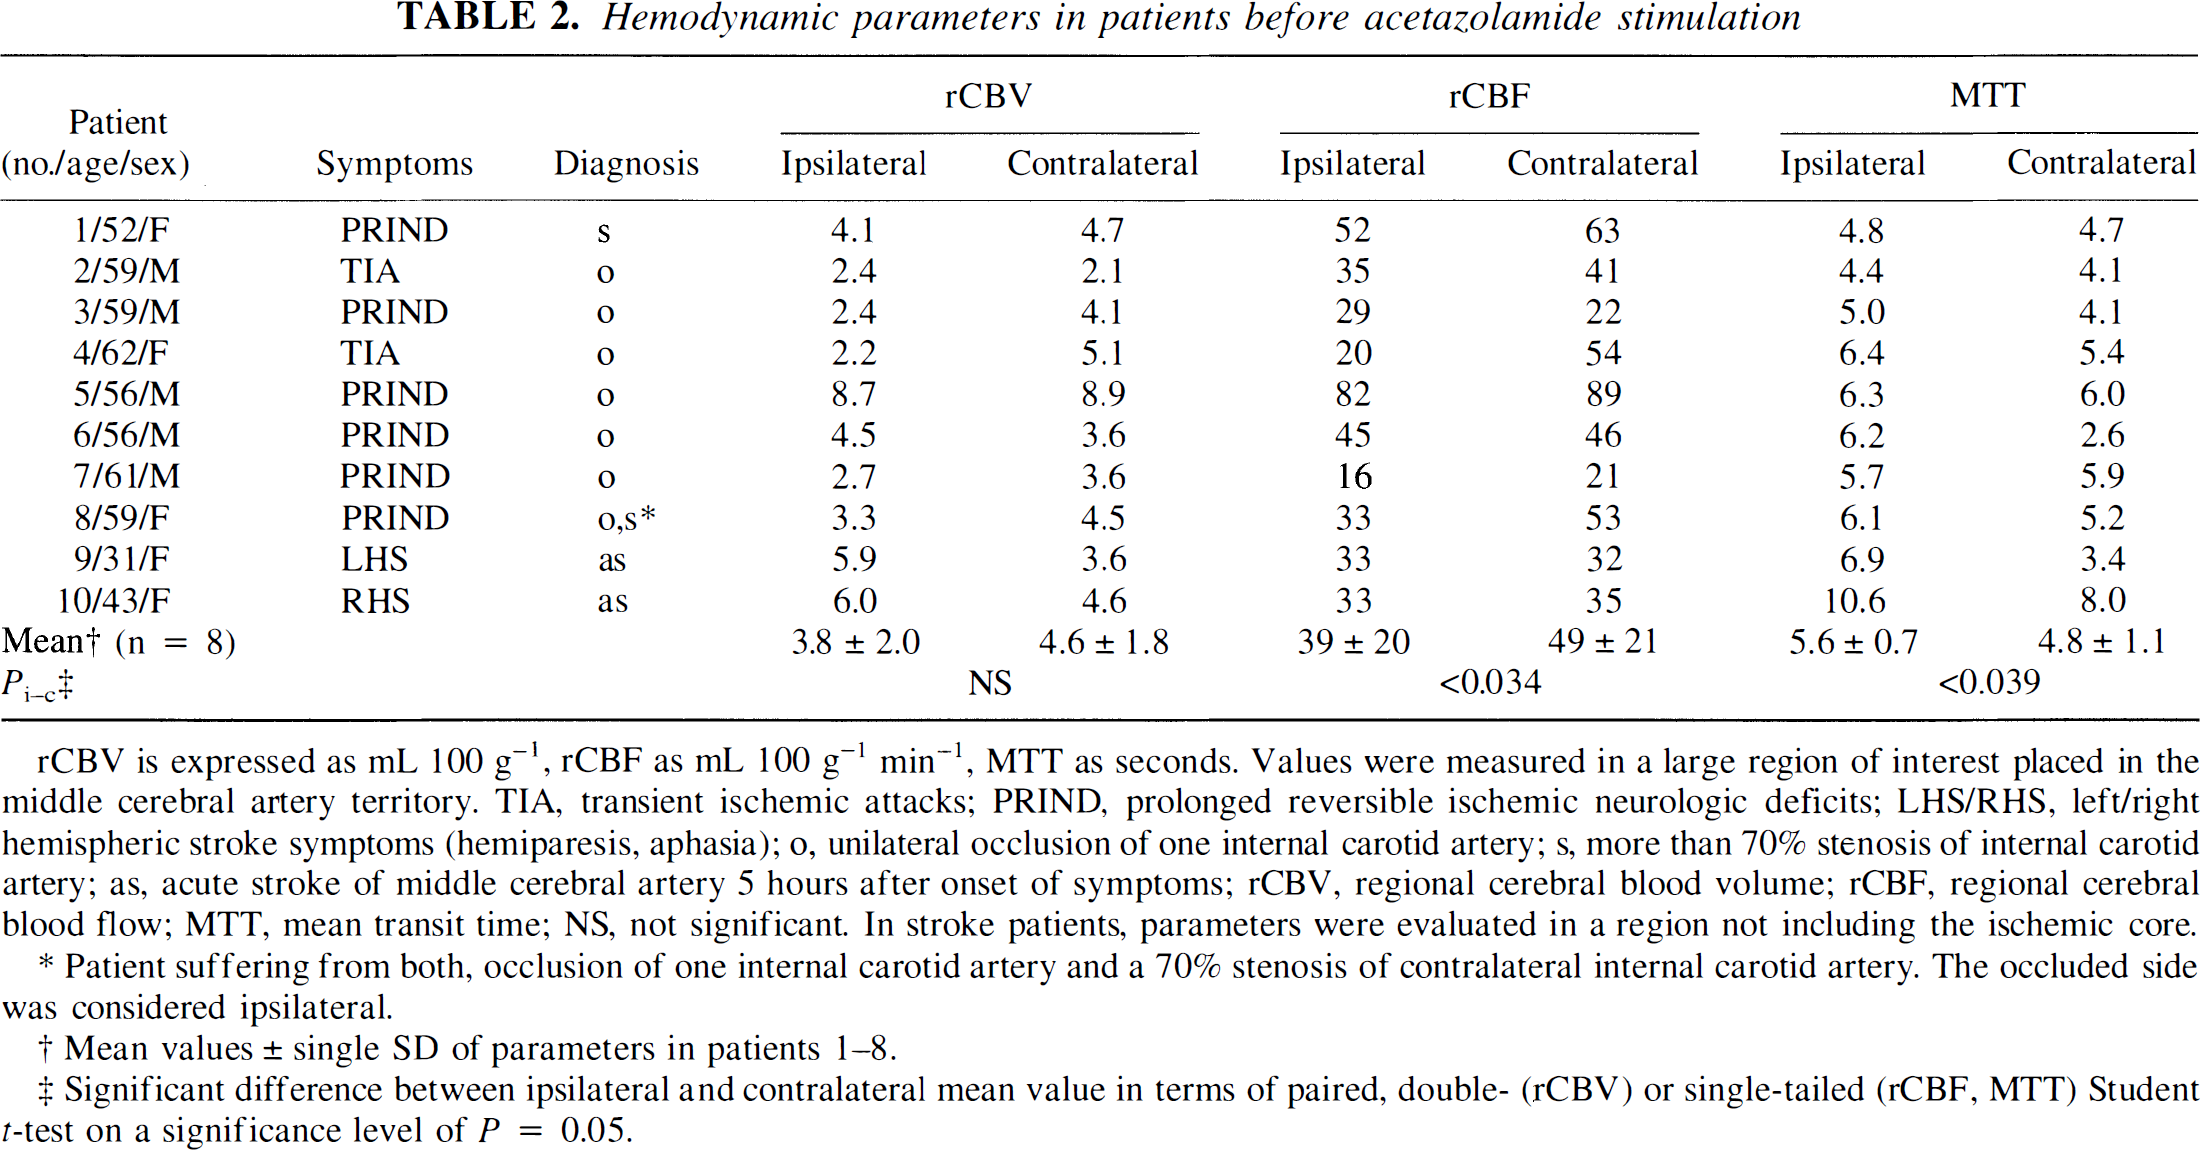
In volunteers, rCBV, rCBF, and MTT were evaluated in large ROIs in the left and right MCA territory (hemispheric ROI) including both gray matter and white matter regions (Fig. 1E). White matter alone was evaluated in frontal and occipital white matter regions (Fig. 1E), gray matter in frontal and occipital cortical gray matter. Susceptibility artifacts around major vessels (Fig. 2) do not represent tissue microcirculation and thus were excluded from ROI evaluation.
Functional magnetic resonance (MR) in a healthy volunteer (#4). The regional CBF (rCBF)
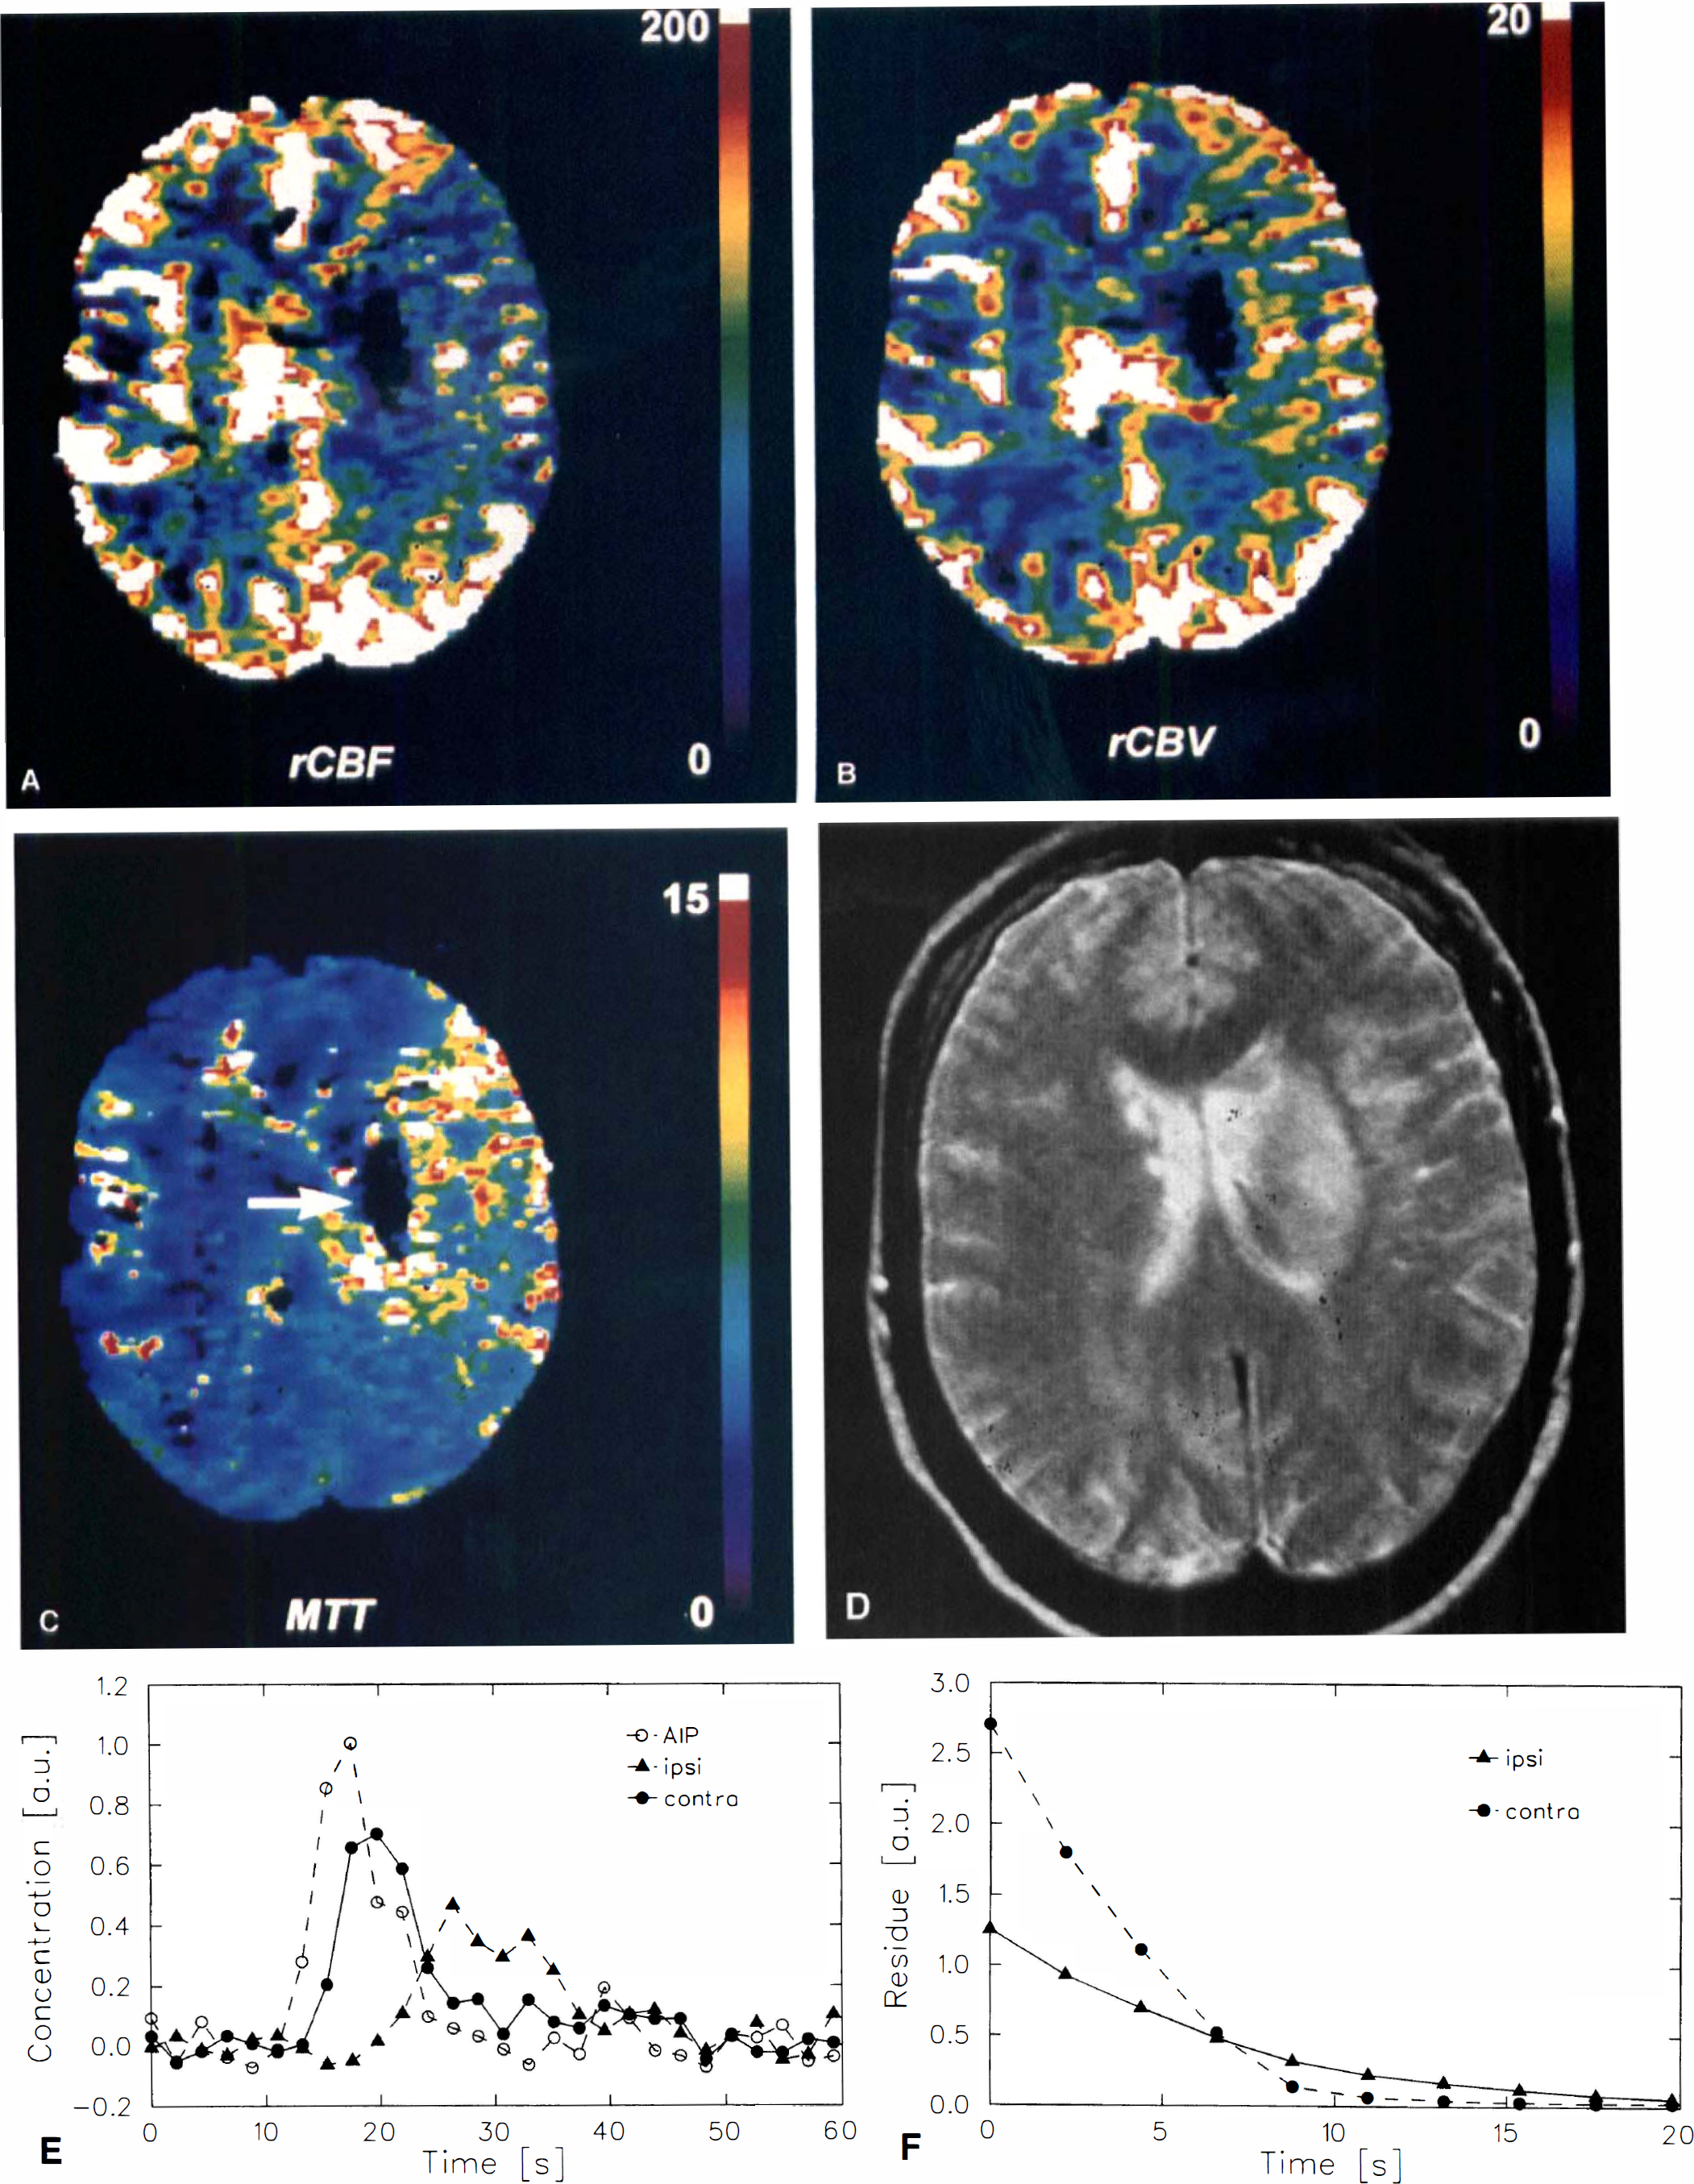
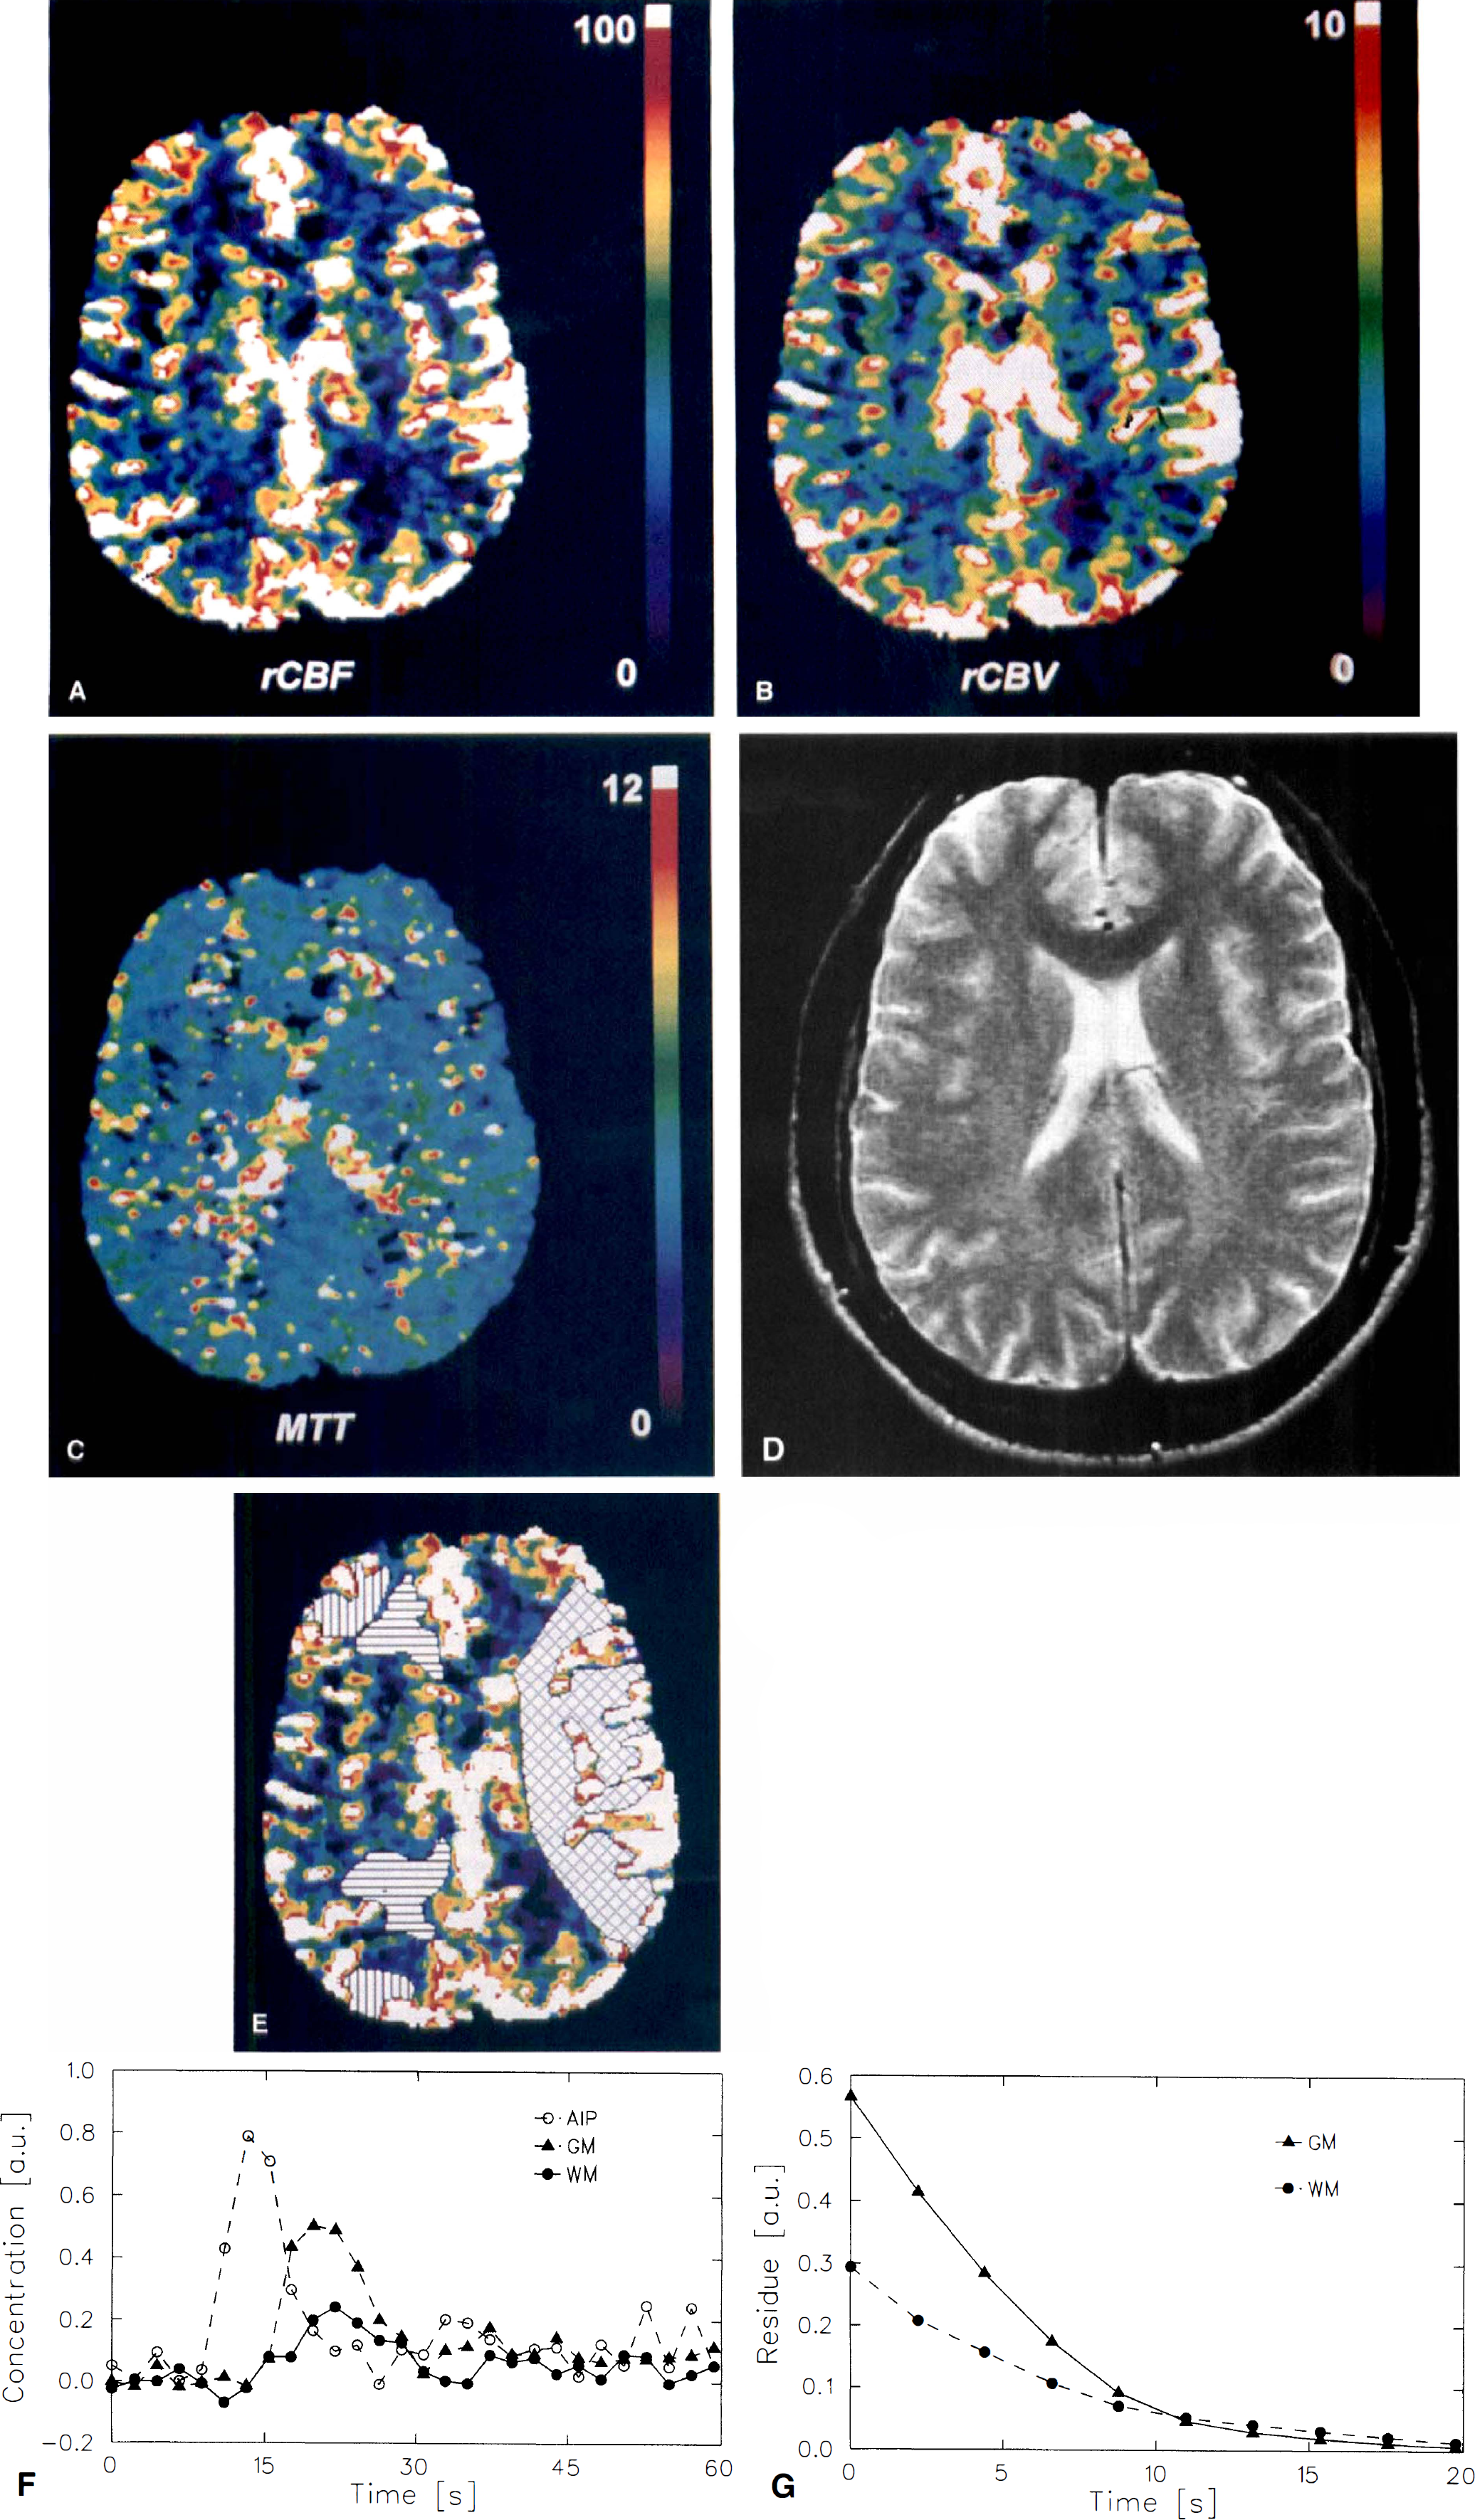
Patient #9 with acute occlusion of the left middle cerebral artery (MCA) 5 hours after onset of stroke symptoms. In a central core of ischemia, no blood flow
In patients, rCBV, rCBF, and MTT were evaluated in ROI taken from the left and right MCA territory including both gray matter and white matter. The central core of ischemia where postprocessing failed, other pixels where postprocessing failed, and major vessels showing susceptibility artifacts were excluded from ROI evaluation. In patients who underwent the acetazolamide stimulation test, the statistical significance of the rCBF and rCBV increase within an ROI was tested by the Wilcoxon rank sum test. Unless otherwise noted, the single-tailed Student's t-test on a significance level of P = .05 was used for further statistical evaluation of mean values.
RESULTS
Volunteer study
The typical precontrast SNR of signal-time curves of the MCA (AIP), and of single pixels in white matter and in gray matter was 40. The typical peak signal decrease with respect to the precontrast signal intensity in these curves was 55%, 11%, and 16%, respectively. After conversion of signal-time curves to concentration-time curves, the SNR of the AIP, and of signals in single white matter voxels and gray matter voxels were 30, 6, and 9, respectively.
On the parametric images, major vessels of the cortex, choroid plexus, and along the great longitudinal fissure showed rCBF and rCBV values which by far exceeded those observed in tissue (Fig. 1). The dimension of these vessels in the rCBV and rCBF images exceeds that on anatomical images due to the long-range susceptibility effect (Fig. 1D). These artifacts were excluded from further ROI evaluation. The MTT map presents a smooth distribution of transit times with no artifacts near major vessels. Deconvolution of the concentration-time curves from small ROI (Fig. 1F) results in smooth, monotonically decreasing residue functions (Fig. 1G). Because of the delay correction, all residue functions start at t = 0. The peak values of R(t) for gray and white matter are significantly different, reflecting different rCBF (60.1 versus 24.8 mL · 100 g−1 · min−1) and similar MTT (6.1 versus 5.2 seconds).
As estimated from rCBF maps, minimal measurable blood flow was 8 mL · 100 g−1 · min−1. Assessment of the AIP without partial volume effects was essential for the quantitative evaluation. Between two and five pixels were used for AIP determination. A visual inspection of MRI before and during the passage of the Gd-DTPA bolus indicated that slice positioning was suboptimal in two subjects (Table 1, #12, 13), thus, the AIP could not be determined without considerable partial volume effects. Hence, rCBV values were considerably overestimated in these volunteers, and these two volunteers were excluded from further evaluation.
When the average rCBV, rCBF, and MTT values in a volunteer were calculated from the values measured in white matter and gray matter regions within one hemisphere (assuming equal amounts of gray and white matter), this value was in reasonable agreement with the mean value obtained from the hemispheric ROI (Table 1). Therefore, in evaluation of patient data hemodynamic parameters were assessed only in ROI over the MCA territories.
Patients with acute stroke
In a patient with acute stroke after left MCA occlusion a central core was observed in which no perfusion was measured suggestive of rCBF less than 8 mL · 100 g−1 · min−1 (Fig. 2). The conventional T2-weighted spin-echo image acquired on the following day showed that the region of this core agrees well with the region that went on infarction (Fig. 2D). Outside of this core, increased rCBV values were observed in the whole ipsilateral MCA territory, while rCBF was not significantly changed. On the MTT map, the well-known mismatch of rCBF and rCBV is clearly visible because of the increased MTT. Hemodynamic parameters in tissue supplied by the anterior or posterior cerebral artery were normal. Blood flow in major cortical vessels was greatly decreased in the ipsilateral MCA territory.
The results obtained by the deconvolution of ipsilateral and contralateral concentration-time curves (Figs. 2E and 2F) show that an estimation of rCBF from the peak of R(t) alone as proposed by Ostergaard et al. (Ostergaard et al., 1996a) would indicate compromised ipsilateral blood flow in this patient because the area under R(t) is not taken into account. Correctly computing rCBF according to equation 3 and equation 4, however, shows that the regional vasodilation found on the MTT and on the rCBV map appears to be sufficient to keep rCBF at a normal value in this ROI (34.3 versus 35.0 mL · 100 g−1 · min−1). In the second acute stroke patient, similar observations were made (Table 2, #10).
Patients with cerebrovascular occlusive disease
Before acetazolamide stimulation, the rCBF distribution in a patient (#6) who presented with occlusion of the right internal carotid artery appeared to be slightly asymmetrical because of an oblique slice positioning (Fig. 3). Ipsilateral rCBV and MTT values were both statistically significantly higher than the contralateral values (P < .05) in this patient. After acetazolamide stimulation, rCBF and rCBV were significantly increased in the whole left hemisphere, while in the right hemisphere (with the exception of a small region; Fig. 3G, arrow) rCBF was not increased. This result was considered as an indicator of decreased cerebrovascular reserve capacity in the right hemisphere in this patient. The decrease in cerebrovascular reserve capacity is best visualized in the ΔrCBF image (Fig. 3G) which gives the percent change of rCBF after acetazolamide stimulation.
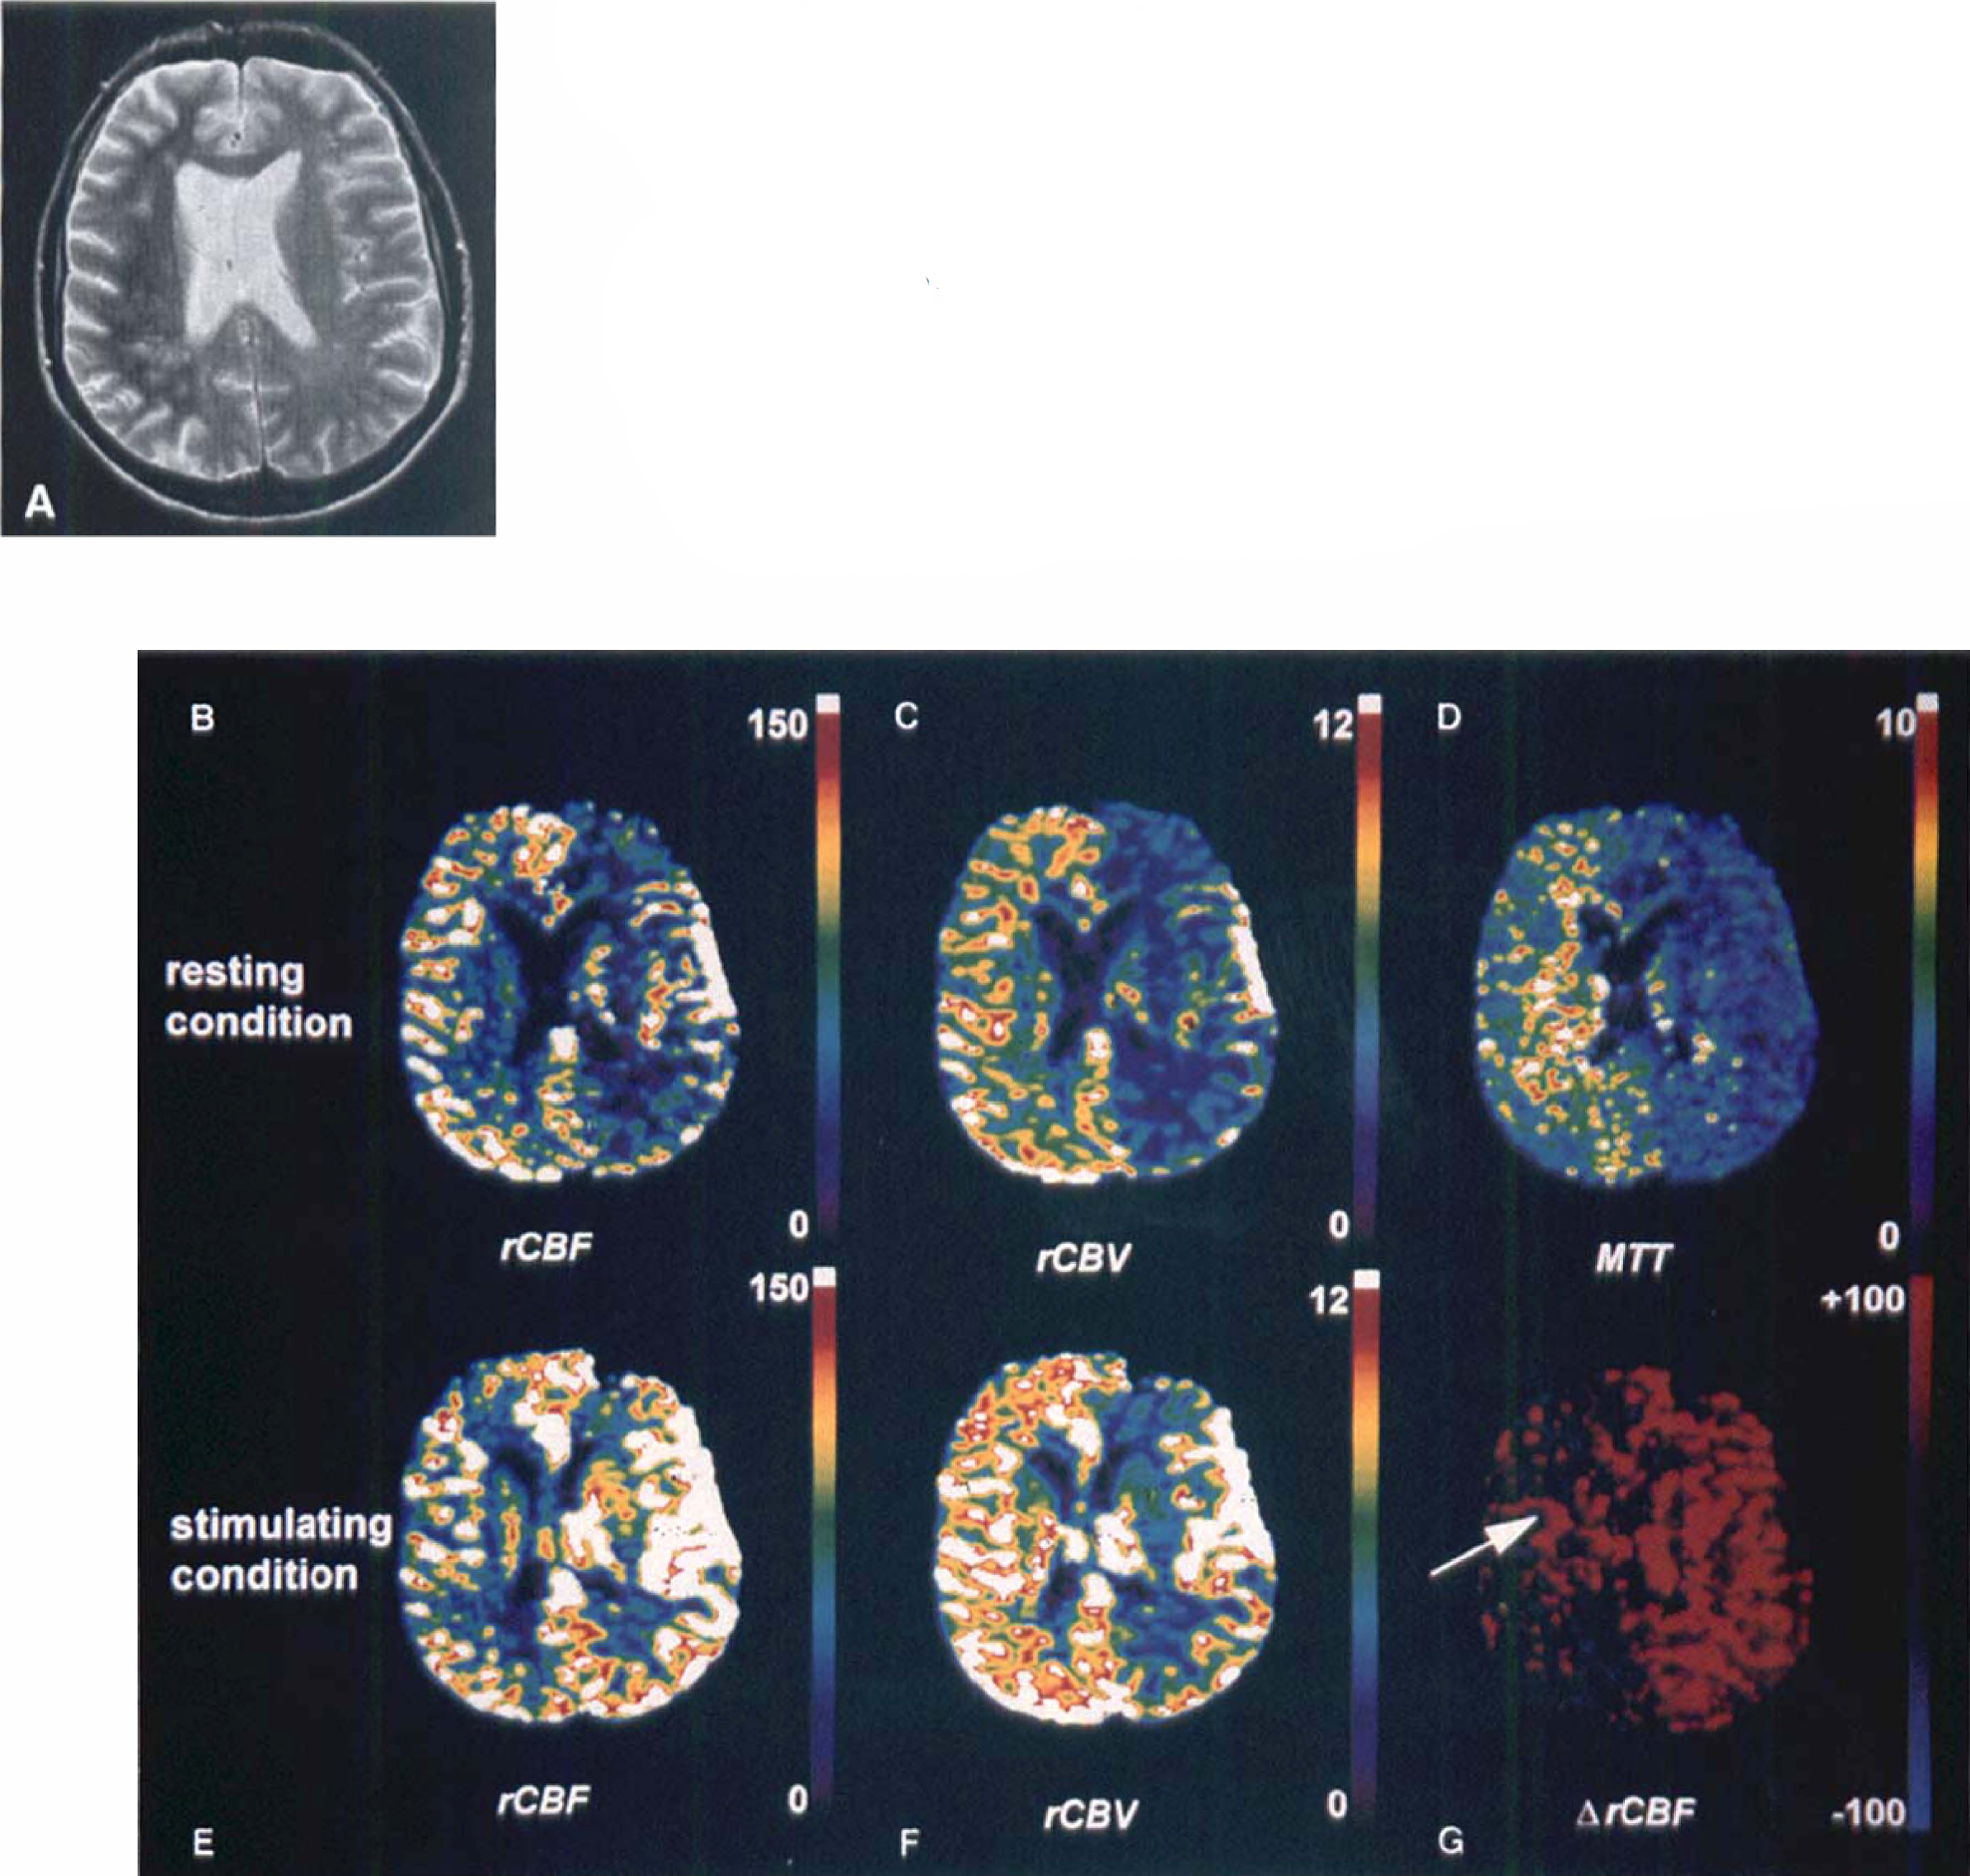
Patient #6 with occlusion of the right internal carotid artery suffering from transient ischemic attacks.
Before acetazolamide stimulation, six of eight patients showed lower rCBF values in the symptomatic hemisphere than in the hemisphere contralateral of ICA occlusion. In one patient (#6) ipsilateral and contralateral values were equal, and in another patient (#3) ipsilateral rCBF was slightly higher than the contralateral value (Table 2). The ipsilateral and contralateral mean rCBF values were significantly different. Ipsilateral rCBV values were decreased in six of eight patients and increased in the other two patients. The mean of ipsilateral rCBV values was decreased with respect to the contralateral value but no statistical significance was reached. Ipsilateral MTT was longer than the contralateral value in all but one patient (#7), in whom it was slightly shorter. As a result, the ipsilateral mean MTT was significantly higher than the contralateral mean MTT. Moreover, since artifacts observed around major vessels were not seen on MTT maps, alterations in tissue microcirculation usually were best visualized on MTT maps.
After acetazolamide stimulation, the mean ipsilateral rCBF increase was significantly smaller than the mean in the contralateral MCA territory (P < .037), while a comparison of the ipsilateral and contralateral mean rCBV increase did not give statistical significance (Table 3).
Change of hemodynamic parameters in patients with cerebrovascular occlusive disease 15 minutes after acetazolamide stimulation
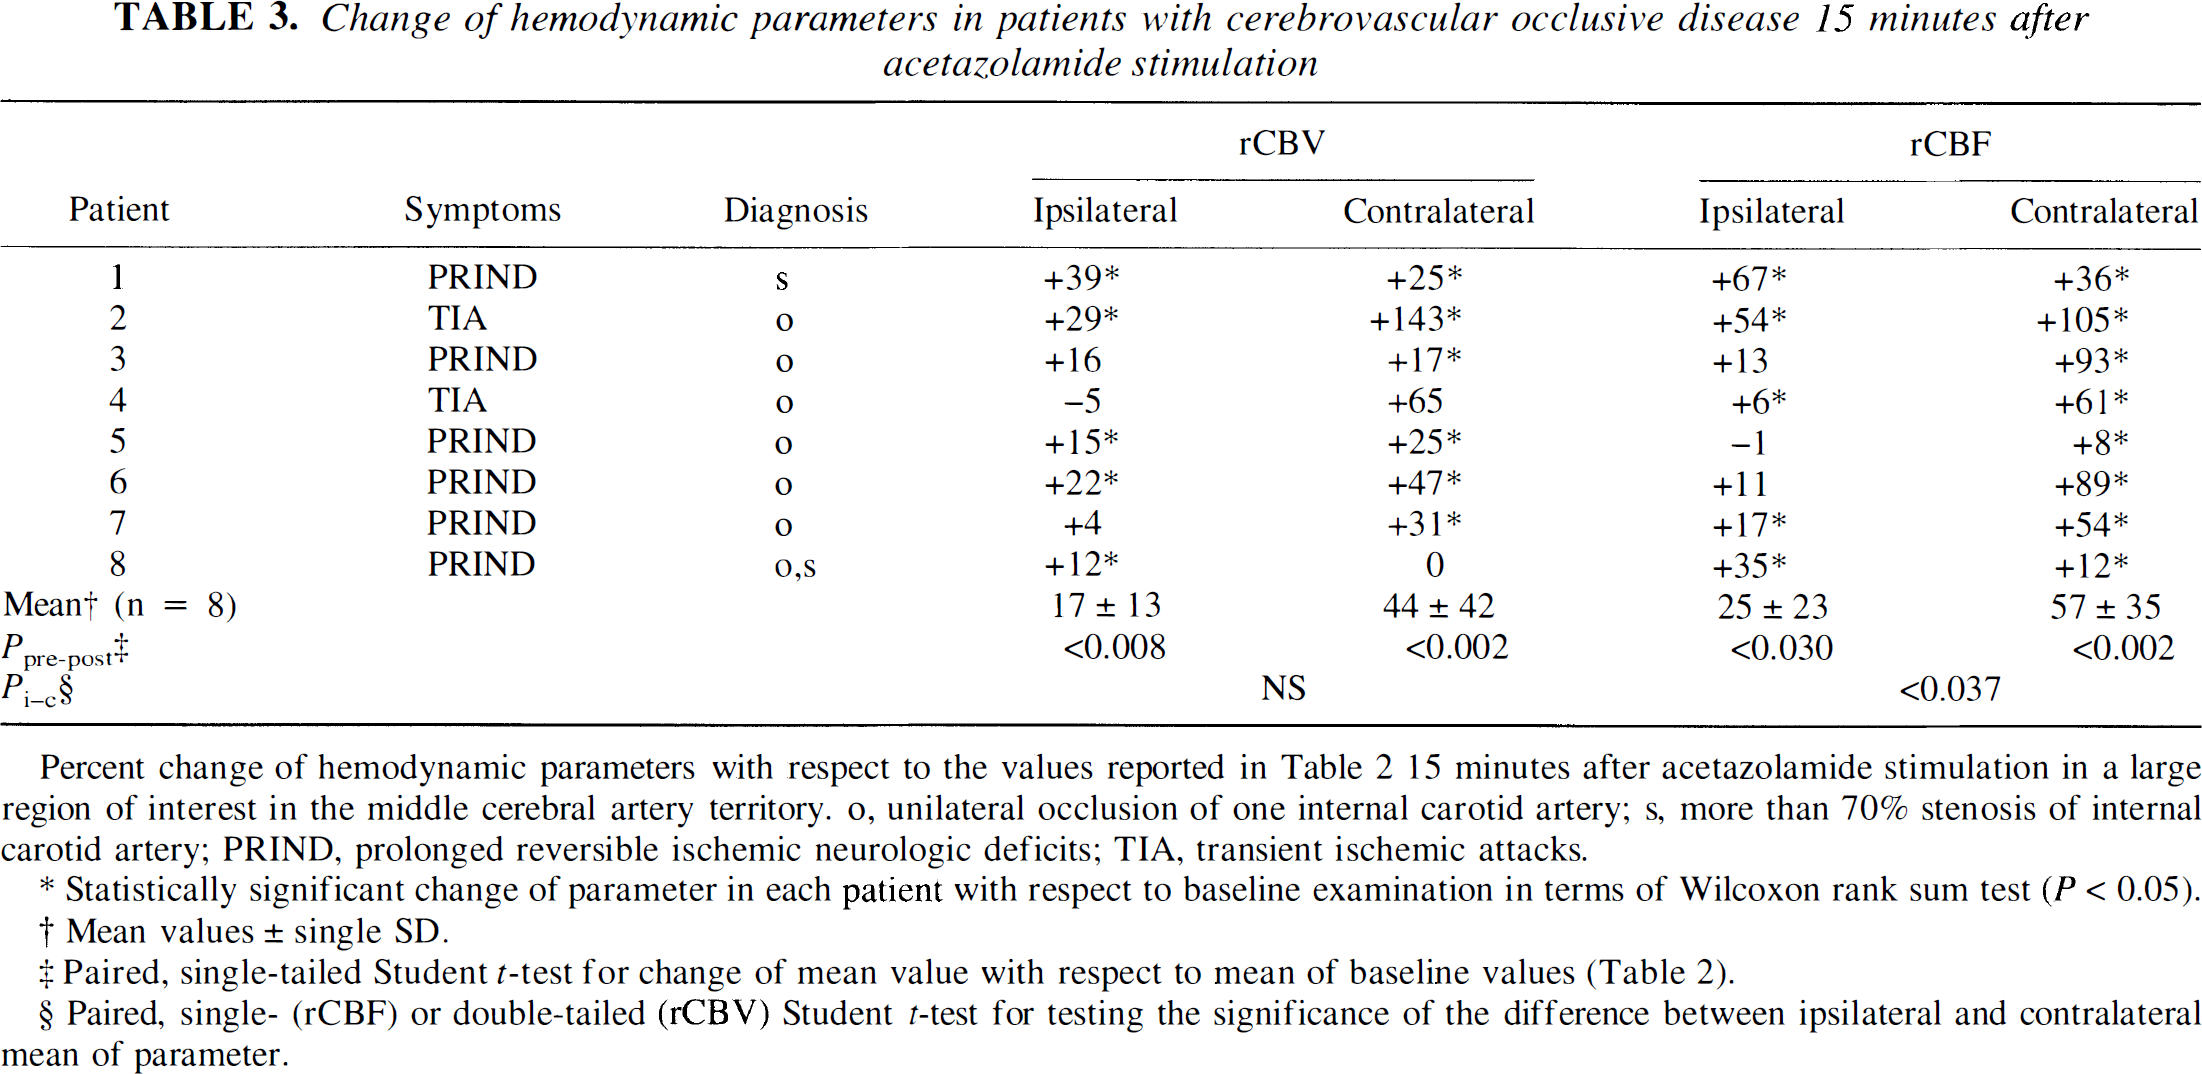
Statistically significant change of parameter in each patient with respect to baseline examination in terms of Wilcoxon rank sum test (P < 0.05).
Mean values ± single SD.
Paired, single-tailed Student t-test for change of mean value with respect to mean of baseline values (Table 2).
Paired, single- (rCBF) or double-tailed (rCBV) Student t-test for testing the significance of the difference between ipsilateral and contralateral mean of parameter.
In the subgroup of patients with unilateral ICA stenosis or occlusion (#1–7) the ipsilateral rCBF increase after acetazolamide was not significant (mean, 24 ± 24%), while the contralateral rCBF increase was highly significant (P < .001; mean, 64 ± 24%). The estimated reproducibility of the rCBF measurement is better than 20%, therefore the rCBF increase of less than 20% in patients 3–7 was considered as an indicator of compromised cerebrovascular reserve capacity.
Regression analysis revealed that increased MTT values correlated with the decreased rCBF increase after acetazolamide stimulation (r = −0.77) whereas MTT and the rCBV increase after acetazolamide stimulation were less correlated (r = −0.36) (Fig. 4).
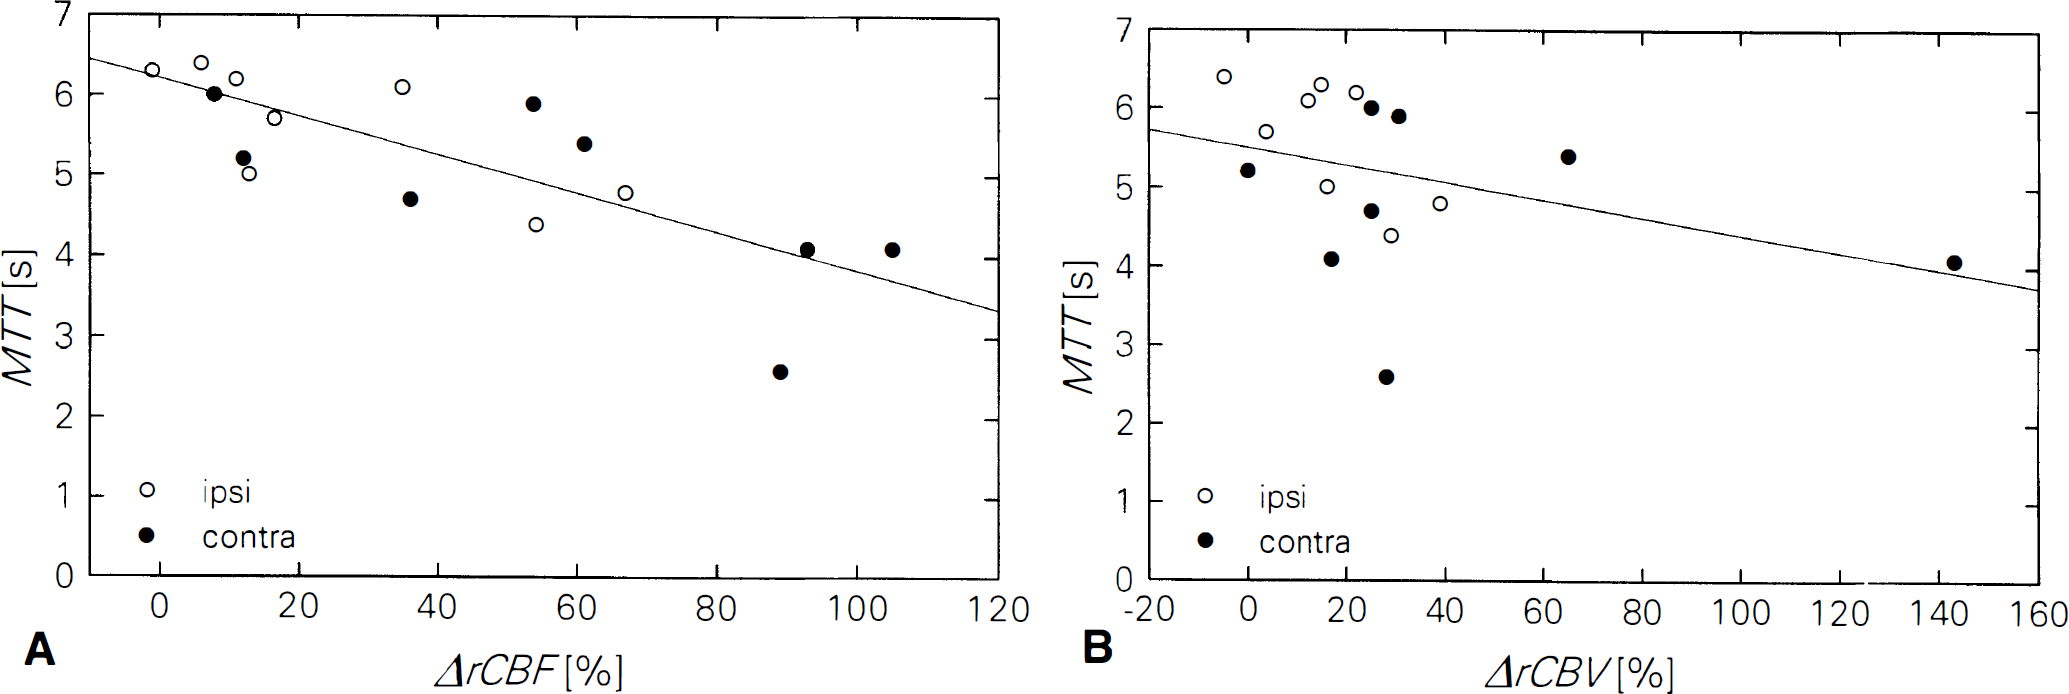
Correlation of mean transit time (MTT) and percent change of regional CBF (rCBF)
DISCUSSION
For the first time, maps of rCBF and of regional cerebrovascular reserve (ΔrCBF) were determined from dynamic MRI data sets in patients suffering from occlusive cerebrovascular disease (prolonged ischemic neurologic deficits, TIA, stroke). Until recently, this clinically highly important information was only available from Xenon-enhanced computed tomography (Nariai et al., 1995) and from radiotracer techniques such as semiquantitative single-photon emission tomography (Hirano et al., 1994; Lassen et al., 1994) or PET (Gibbs et al., 1984; Itoh et al., 1987; Powers et al., 1987; Heiss et al., 1994).
Postprocessing
The presented method is based on tracking the signal loss induced by the passage of a bolus of paramagnetic CM through tissue microvasculature using dynamic susceptibility-contrast-enhanced MRI. The measured signal-time curves are processed by means of deconvolution analysis and by principles of indicator dilution theory.
rCBF determination on the basis of Steward's Central Volume Principle [4] requires prior knowledge of the size of the intravascular space (i.e., rCBV). Therefore, an intravascular tracer is required restricting the application of this method to brain tissue with an intact blood-brain barrier if a diffusable CM such as Gd-DTPA is used. In all of our patients, the blood-brain barrier was intact and, hence, this requirement was fulfilled. Diffusion of CM into the extravascular space would result in a systematic overestimation of rCBV and hence rCBF. Moreover, Axel (Axel, 1980) has pointed out that equation 2 holds only if (1) capillary concentrations are proportional to venous concentrations, and (2) the volume of arterial vessels can be neglected with respect to capillary and venous volume. The first point is fulfilled with purely intravascular tracers, and the second also appears reasonable in the brain (Hilal, 1974).
Several assumptions were made regarding the conversion of signal-time curves to concentration-time curves. First, the validity of equation 1 was presumed for both arterial and tissue pixels. The validity of this approach which is based on the assumption of an monoexponential signal decay has been shown in several previous studies for brain tissue (Fisel et al., 1991; Weisskopf et al., 1994; Boxermann et al., 1995) and for AIP determination from the MCA using an echo-planar pulse sequence (Porkka et al., 1991). Second, identical κ values were assumed for tissue and AIP pixels. Although there is no a priori reason for this being correct, two observations support our assumption: (1) Simulations of Boxerman et al. have shown the insensitivity of κ for gradient-echo pulse sequences to vessel radii up to 100 μm (Boxermann et al., 1995). Our assumption is an extrapolation of that result to macroscopic vessels. (2) The consistency of the rCBV and rCBF values in healthy volunteers with literature values (see below) also supports its validity. However, as stated in the methods section, rCBV and rCBF values are scaled by κbrain/κAIP. A variation of that ratio due to other acquisition parameters or another type of pulse sequence may, therefore, introduce additional systematic errors.
Furthermore, in equation 2 capillary hematocrit (H cap ) was assumed to be constant across the brain. It has been shown that capillary hematocrit in rats is fairly constant in white matter (H cap = 0.25, k H = 0.73) while in normal gray matter H cap varies between 0.26 and 0.37 and is also flow dependent (Bereczki et al., 1993b). Assuming a constant average gray matter hematocrit of 0.31, the maximum systematic error in k H and, thus, in rCBV and in rCBF estimates would be 7.8% for normal gray matter. If disease leads to an increase of local capillary hematocrit, rCBV and rCBF values will also be underestimated (maximum error, 27%). While capillary hematocrit in rats is not affected by rCBF changes induced by hypoxia (Bereczki et al., 1993a) or hypercapnia (Bereczki et al., 1993b), high doses of pentobarbital induced a significant increase of H cap (i.e., k H ≈ 1) probably by an altered coupling between rCBF and local metabolism (Wei et al., 1993). It remains to further studies to investigate if capillary hematocrit is altered under pathologic conditions.
Prerequisite for a quantitative estimation of rCBF and rCBV from dynamic MRI is the assessment of the AIP. The true input function into each individual voxel cannot be measured for obvious reasons. An estimation of the AIP, however, can be obtained from a major brain feeding vessel such as the M1 segment of the MCA. Two drawbacks affect this estimation: partial volume effects and dispersion. Partial volume effects are critical because they may result in an overestimation of rCBV and rCBF. An interactive method was used for standardized measurement of the AIP (Rempp et al., 1994) which accepts as pixels used for AIP determination only those pixels with sufficiently short bolus duration and higher peak concentrations than curves obtained in brain parenchyma. Although partial volume averaging should be largely decreased using that approach, in two volunteers partial volume effects led to a systematic overestimation of rCBV and rCBF. Dispersion of the tracer bolus on its way from the region of AIP determination to the voxel, on the other hand, may result in an overestimation of the MTT and thus in an underestimation of rCBF because this dispersion is wrongly attributed to intravoxel dispersion by tissue microvasculature. Therefore, dispersion may affect rCBF measurement in patients with stenosis or occlusion between the region of AIP determination (i.e., M1 segment of the MCA) and the voxel considered. With the current technique, this problem cannot be overcome in patients with stenosis in distal segments of the MCA, e.g., in stroke patients. In patients with ICA disease, however, the AIP can in principle be measured after the tracer passed the stenosis, although this was not possible in all patients of our study because of the limitation of the current technique to a single AIP-determination slice. Echo-planar pulse sequences may be of advantage here with regard to the better spatial resolution and to the multislice capabilities.
With improved gradient hardware now available for clinical MR scanners, echo-planar imaging (EPI) is becoming the preferred method for semiquantitative brain perfusion studies. In comparison to SD-FLASH, EPI offers the advantage of better in-plane resolution and of multislice imaging with the same temporal resolution as SD-FLASH. This not only improves the clinical impact but may also enhance AIP determination because more slices are available for AIP measurement. Furthermore, in the SD-FLASH sequence the time interval between successive radio-frequency excitations is relatively short (repetition time, 34 milliseconds), in EPI sequences it is on the order of 2 seconds resulting in relatively high SNR. Therefore, long TE of up to 100 milliseconds can be used in dynamic perfusion-weighted EPI resulting in increased sensitivity to Gd-DTPA-induced susceptibility changes.
In terms of absolute quantification, however, EPI imposes several challenges. EPI is a single-shot technique, thus only an effective echo-time TE eff can be defined for those raw data lines where the phase-encoding gradient is zero. Other phase-encoding steps are weighted with different TE. Although the validity of equation 1 for conversion of signal-time curves to concentration-time curves has been shown with EPI with regard to AIP determination from the MCA (Porkka et al., 1991), it is unclear if the assumptions of a fixed TE eff and of κbrain = κAIP are still justified for EPI data sets. Moreover, because of the low bandwidth in phase-encoding direction, off-resonance effects (Vlaardingerbroek et al., 1996) near major vessels (i.e., MCA) induced by the intravascular susceptibility changes during the CM bolus may also influence the conversion from AIP signals to AIP concentrations if EPI is used.
Volunteer study
The rCBF values determined from our volunteer group (Table 1) are consistent with those of Leenders et al. (Leenders et al., 1990) from 34 subjects using PET. They report a mean white matter rCBF value of 22.2 ± 4.9 mL · 100 g−1 · min−1 and an age-dependent gray matter flow of rCBF = 66.5 − 0.26* (age/years). For the patients in our study, this would result in a mean rCBF of 56.5 ± 4.5 mL · 100 g−1 · min−1. The consistency of our results with this value supports the validity of our approach for rCBF measurements in normal subjects. In particular, it supports the assumption that κbrain = κAIP for the SD-FLASH sequence and for the acquisition parameters used in our study.
Because of the low grade of the Chebyshev polynomials used for deconvolution, the obtained residue functions may not reflect the shape of the residue functions in full detail. However, for MTT and rCBF calculation, not the shape but only the normalized integral of R(t) is required (Equation 3). For reconstruction of the true shape of R(t) improved SNR and contrast-to-noise ratio in combination with improved temporal resolution are necessary (Ostergaard et al., 1996a). It has been shown previously that with an SNR of 22 an exponential transfer function (MTT = 10 seconds) can be reconstructed in full detail with DOP if the temporal resolution is 1 s (Stritzke et al., 1990).
Ostergaard et al. have estimated blood flow from the maximum value of the deconvolved R(t) (Ostergaard et al., 1996a). In that approach, however, MTT differences between two types of tissue, e.g., between unaffected tissue and tissue under conditions of regional vasodilation in stroke patients, may lead to systematic errors in the resulting rCBF (Fig. 2). Furthermore, to obtain absolute rCBF values, blood flow in a reference tissue, e.g., in normal white matter, was required in that approach. However, in patients with cerebrovascular disease or after acetazolamide stimulation (where normal white matter rCBF may also be increased) this normalization may introduce large systematic errors. It remains to further studies to determine in which pathologies Ostergaard's approach is sufficient, and in which pathologies our method gives more reliable results. It is evident, however, that under pharmacologic stimulation, e.g., with acetazolamide, normalization to resting white matter rCBF is inadequate.
Patients with cerebrovascular occlusive disease
In patients with unilateral hemodynamic significant stenosis or occlusion (Nos. 1–7), the ipsilateral and contralateral mean of rCBF values (40 mL · 100 g−1 · min−1 and 47 mL · 100 g−1 · min−1, respectively) are consistent with those found by Powers with PET (Powers et al., 1987). In patients with decreased cerebral perfusion pressure and normal or decreased blood flow, rCBF values of 36 mL · 100 g−1 · min−1 and 44 mL · 100 g−1 · min−1 were observed in that study.
The observation that the increased MTT correlated well with decreased or no rCBF increase after acetazolamide stimulation (Fig. 4) is in good agreement with that of Gibbs et al. (Gibbs et al., 1984). They found an increase of both, rCBV and MTT (indicating compensatory vasodilation) as a response to a decrease in perfusion pressure. Moreover, using PET of oxygen-15 labeled tracer, Gibbs et al. found that 1/MTT is a more sensitive indicator of hemodynamic change than rCBF or rCBV alone, and they found a correlation between 1/MTT and the oxygen extraction fraction, but these observations could not be confirmed by others (Powers et al., 1987).
Assessment of vasodilative capacity with the acetazolamide stimulation test is more established than the MTT method (Vorstrup, 1988; Gückel et al., 1995; Nariai et al., 1995; Gückel et al., 1996). Acetazolamide induces a local extracellular acidosis in the brain that triggers an increase in rCBF (Wang et al., 1993). We found a mean rCBF increase on acetazolamide stimulation of 57% in the contralateral and 25% in the ipsilateral MCA territory. The difference between the two mean values was statistically significant. These results are in good agreement with those reported previously using an ROI-based MRI method (Gückel et al., 1996). They also agree with results of other studies using Xenon-enhanced computed tomography (Sabatini et al., 1991, Leinsinger et al., 1994) or single-photon emission tomography (Bonte et al., 1988) where an rCBF increase between 25% and 50% was observed in normals and decreased rCBF reactivity in patients with occlusive cerebrovascular disease.
Patients with acute stroke
In acute stroke, the region where rCBF was less than the detection limit (8 mL · 100 g−1 · min−1) later went on infarction as seen on the conventional T2-weighted spin-echo image acquired on the following day (Fig. 2). In addition, the rCBF maps reveal that blood flow in the ipsilateral MCA territory outside the central core of ischemia was almost equal to that in the unaffected contralateral MCA territory, where no infarction was observed on the following day. This information is not available from the rCBV maps that only show regional vasodilation.
In peri-infarct tissue, the duration of the bolus was increased (Fig. 2D). Therefore, it cannot be excluded that part of the increased rCBV observed in these tissue regions is due to overestimation by insufficient elimination of recirculation. However, MTT will be a reliable indicator of regional vasodilation even if recirculation is present because recirculation of the bolus is registered by measuring the AIP, and because it does not lead to errors in the deconvolution and in the obtained residue functions. Therefore, MTT appears to be a more reliable indicator for regional vasodilation than rCBV.
A quantitative determination of rCBF and MTT may further improve assessment of early stroke because these hemodynamic parameters are better markers for ischemia (Powers et al., 1984; Pappata et al., 1993) than relative rCBV. It remains to further studies to determine how much the previously discussed sources of systematic errors, in particular dispersion of the AIP and alterations of hematocrit, limit the application of the described MR method in the assessment of acute stroke. Although restrictions may exist in terms of a quantitative assessment of the severity and viability of ischemic tissue, it may have the potential to guide pharmacologic therapies by quantitative assessment of the blood flow penumbra (Kaplan et al., 1991; Hakim et al., 1992). However, further work is required to validate our results with those obtained with established PET techniques.
In conclusion, the MR method described in this article may offer an unique possibility for using MRI to assess the hemodynamic state of brain tissue with spatial resolution higher than that of established radioactive tracer techniques. Although our data are preliminary, they do suggest that tissue, which potentially is at risk of infarction, can be detected by the MR-based acetazolamide stimulation test. Furthermore, because of the quantitative nature of the obtained rCBF values, the described method may be a step towards quantitative assessment of the blood flow penumbra by means of dynamic MRI.
Footnotes
Acknowledgements
This work is dedicated to Professor Walter J. Lorenz on the occasion of his 65th birthday. The authors thank Drs. R. M. Weisskoff, B. R. Rosen, K. Kwong, and G. A. Sorensen of Massachusetts General Hospital, Charlestown for stimulating discussions. The authors also thank Drs. W. J. Lorenz, M. V. Knopp, and M. Essig of Tumorzentrum Heidelberg/Mannheim, as well as Drs. K. Rempp, F. Wenz, and R. Scholdei, of the University of Heidelberg Medical School, Heidelberg, Germany, for the support they gave to this work, and Dr. M. Deimling of Siemens Medical Systems, Erlangen for providing the pulse sequence.