
Abstract
T2*-weighted gradient echo magnetic resonance images of rat brain were obtained dynamically during acute hypoxemic hypoxia to investigate the relations between changes in cerebral blood oxygen saturation(ΔYb), blood hematocrit (Hct), and R2* (ΔR2*). Images from hypoxemic rats with normal Hct (42.8% ± 2.33%; n = 12) were compared with those from hypoxemic rats with mild (33.4% ± 1.88%; n = 8) or moderate (27.14% ± 2.7%; n = 10) reduction of Hct. A linear relation between ΔYb and ΔR2* was obtained for all three groups. However, the slopes of the linear regressions were statistically different from one another (P < 0.001), with the slopes of the regression lines increasing inversely with Hct; that is, the slope for normal Hct is less than the slope for mildly reduced Hct, which is less than the slope for moderately reduced Hct. These data suggest that for any given reduction in the oxygen saturation of cerebral blood, the ΔR2* will be of a lesser magnitude when the hemoglobin concentration is reduced; the data are consistent with existing theoretical models of deoxyhemoglobin content-dependent effects in T2*-weighted magnetic resonance imaging.
The paramagnetic nature of deoxyhemoglobin provides a unique opportunity to noninvasively monitor changes in its concentration within tissues using appropriate magnetic resonance imaging (MRI) techniques. Deoxygenated hemoglobin induces local magnetic field inhomogeneities within tissue and can therefore be used as an endogenous contrast agent. This property of deoxyhemoglobin was first recognized by Thulborn and others (Thulborn et al., 1982), who showed that the T2 of blood in vitro was dependent on oxygen saturation. Later, Ogawa and associates (Ogawa et al., 1990) demonstrated that changes in signal intensity on T2*-weighted images also could be obtained in vivo. The term blood oxygen level-dependent (BOLD) contrast was proposed by Ogawa and colleagues (1993) to describe this effect. Since then, new MRI applications based on the BOLD effect have been developed, such as functional MRI (Kwong et al., 1992), monitoring of brain perfusion status (de Crespigny et al., 1992), and quantitation of global oxygen saturation changes under experimental manipulations (Prielmeier et al., 1994; Hoppel et al., 1993).
Furthermore, it has been demonstrated that the change in R2* (ΔR2*) varies linearly with changes in cerebral blood oxygen saturation (Prielmeier et al., 1992; Lin et al., 1998). These studies open the possibility of obtaining quantitative measurements of oxygen saturation changes noninvasively. However, the effect of alterations in the concentration of deoxyhemoglobin-the ultimate source of magnetic susceptibility-on the patterns of signal intensity change caused by different experimental manipulations, including those described earlier, have not been investigated systematically. This issue is important because hematocrit (Hct) levels vary substantially from subject to subject, and dynamic changes in tissue-level Hct are common under a variety of physiologic and pathophysiologic conditions (Gaehtgens and Marx, 1987).
In this study, a two-dimensional T2*-weighted gradient echo sequence was used to monitor signal intensity change before, during, and after inducing graded hypoxemic hypoxia in rats with normal, mildly reduced, or moderately reduced Hct. The relation between changes in cerebral blood oxygen saturation and ΔR2* were investigated.
MATERIALS AND METHODS
All procedures described here were approved by the Animal Studies Committee of Washington University Medical Center and fall within the guidelines for animal care established by the National Institutes of Health.
General animal preparations
A total of 30 adult male Long-Evans rats, weighing 300 to 350 g, were used. The animals were divided into three subgroups: normal Hct (n = 12); mild hemodilution (HD) (n = 8), and moderate HD (n = 10). All procedures and preparations are performed routinely in rats in our laboratory. In short, general anesthesia was induced with a single intraperitoneal injection of pentobarbital (30 mg/kg). Both the right femoral artery and vein were cannulated with a PE-50 polyethylene catheter (Becton-Dickinson, Sparks, MD, U.S.A.) for obtaining arterial samples (Hct assays, blood gas analysis) and delivery of drugs, respectively. Tracheotomy and tracheal cannulation were performed, and tracheal tubing was attached to a small animal ventilator (Harvard Apparatus, Inc., South Natick, MA, U.S.A.) after the animal was transferred to the MR scanner. An intravenous neuromuscular blocking agent was administered (pancuronium hydrochloride, 0.1 mg/kg/h), and appropriate mechanical ventilation was provided.
The right jugular vein was exposed midway between the clavicle and the mandible. A venotomy was performed 2 mm rostral to the major cervical bifurcation, and a heparinized PE-50 catheter then was advanced 13 to 15 mm rostral so that it came to rest at the mouth of the transverse sinus as it exits the postglenoid foramen (Greene, 1935). All jugular venous samples were collected anaerobically through the combined effects of capillary action and gravity drainage into heparinized glass tubes (Chiron Diagnostics Co., Norwood, MA, U.S.A.). Similar volumes of arterial blood were collected concomitantly from the femoral artery. All blood samples were analyzed less than 3 minutes after collection with a blood gas analyzer (Ciba-Corning Diagnostics, Medfield, MA, U.S.A.) to maintain strict anaerobic conditions during the sampling process and minimize time-dependent alterations of pH and blood gas tensions. From each blood sample, parameters measured included pH, PCO2, and PO2. Both arterial and venous hemoglobin saturations were calculated using the general procedure described by Eklof and Siesjo (1972). Specifically, the pH-corrected values for PO2 obtained from arterial and venous samples were gauged to the oxygen dissociation curve of the rat (p50 of 37 to 38 mm Hg) (Hall, 1966).
Animal protocols
Ten minutes were allowed for stabilization of physiologic parameters after transfer to and completion of the HD protocols within the MR scanner. Normovolemic HD was achieved by withdrawing either 3 mL (mild group) or 6 mL (moderate group) of blood from the arterial catheter at a constant rate of 1.5 to 2.0 mL/min. Concurrently, a sterile 5% solution of serum albumin in isotonic sodium chloride was infused intravenously as surrogate plasma at 3 mL/min. The addition of albumin to the saline maintains the oncotic pressure of the hemodiluted blood and circulating volume and therefore prevents hypotension. Rats with normal Hct also were allowed to stabilize within the scanner before inducing hypoxemic hypoxia. Subsequently, one or two 5-minute episodes of hypoxemic hypoxia were induced. In the baseline state, inspired gas was either room air (normal Hct group) or room air with oxygen supplement (mild and moderate HD groups) so that arterial oxygen saturation was maintained at or above 90% in all cases. To induce hypoxemic hypoxia across a wide range, the inspired oxygen content was decreased between 4 to 11 vol% by increasing the ratio of nitrogen to oxygen in the inspired gas mixture. Both arterial and jugular venous blood samples were collected before and after each episode. When more than one episode of hypoxemic hypoxia was induced, a 10-minute interlude was allowed during which physiologic parameters returned to baseline values (Table 1). At the end of each experiment, the anesthetized rat was killed with an overdose of intravenously administered pentobarbital.
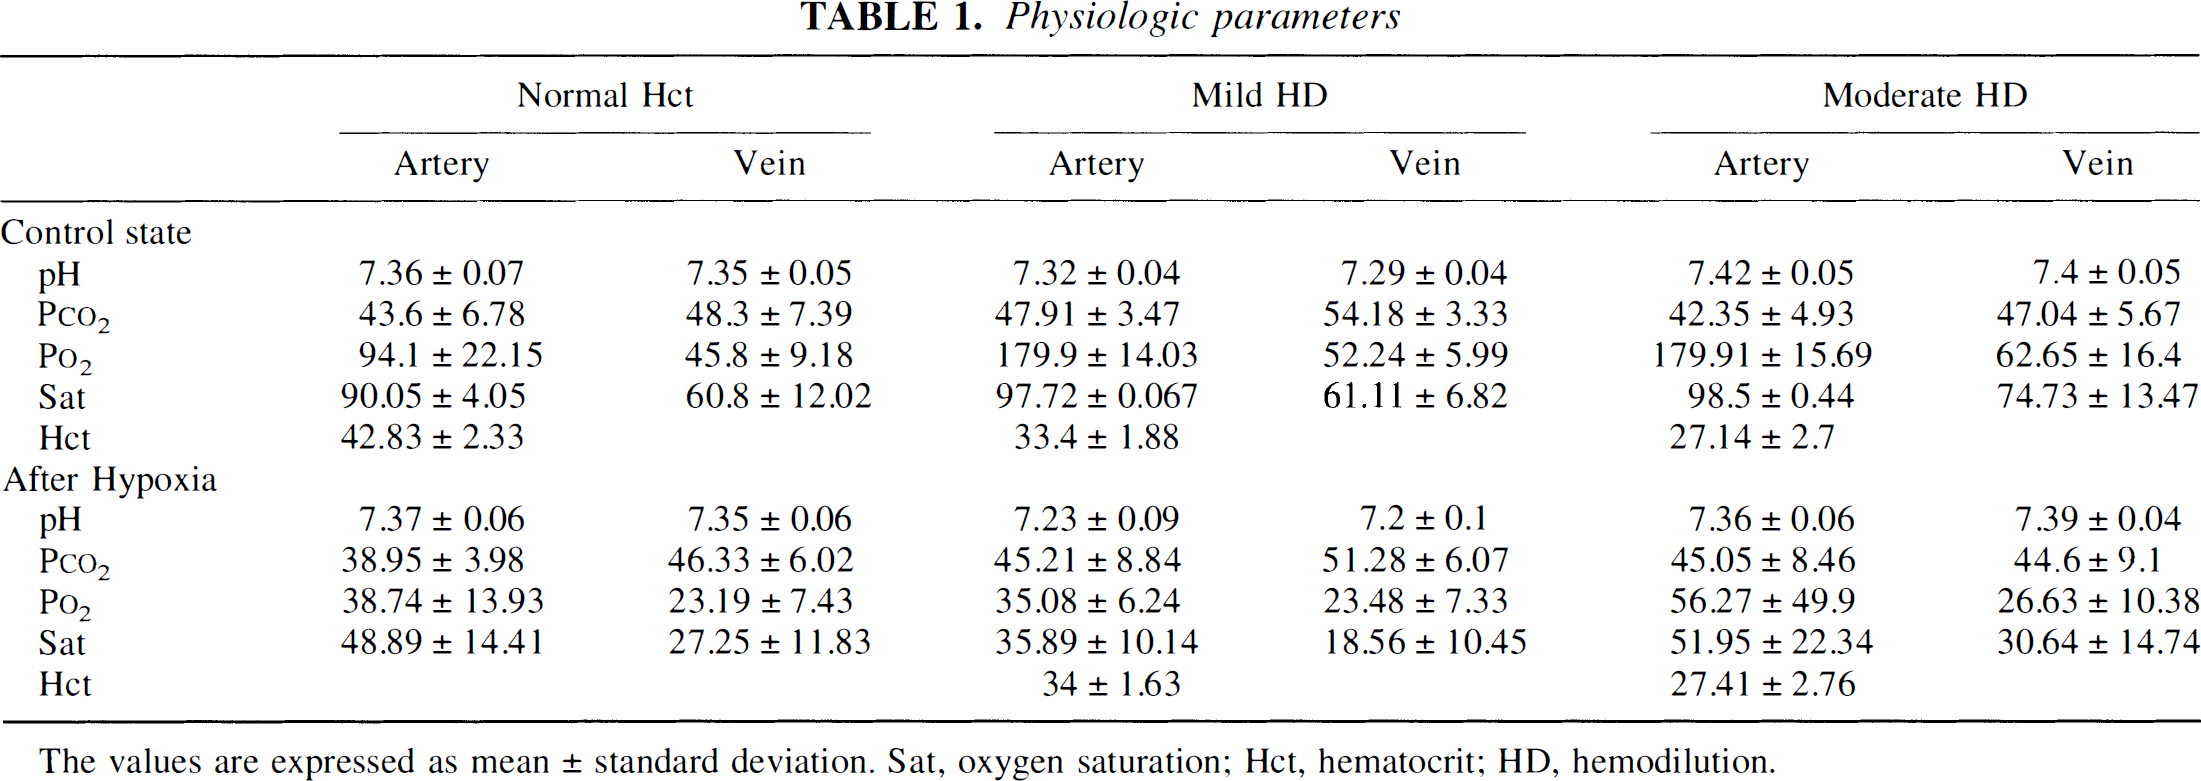
Physiologic parameters
Magnetic resonance imaging protocol
All images were acquired on a Siemens 1.5-T whole-body VISION system (Erlangen, Germany) with a gradient strength of 25 mT/m and a ramp time of 0.6 milliseconds to the maximum gradient. A small custom-made receive-only radiofrequency coil and a two-dimensional gradient echo fast low-angle shot sequence were used to acquire all images. First-order velocity compensation was used along both the slice select and frequency encoding directions. The imaging parameters were as follows: repetition time (TR) 83 milliseconds; echo time (TE) 40 milliseconds; slice thickness 2 mm; field of view 60 mm2; flip angle 40 degrees; and matrix size 80*128. Twenty scans (2 minutes) were acquired continuously with rats in the baseline state, and 50 scans then were acquired after inducing hypoxemia (5 minutes). The average differences in signal intensity of the brain parenchyma from these images were used to calculate ΔR2*.
Data analysis
To correlate the changes in R2* before and after hypoxemia with the changes of calculated oxygen saturation from blood samples, ΔR2* was calculated using ΔR2* = ln(S(t)/S0)/TE, where S(t) is the signal intensity at a given time and S0 is the mean signal intensity during the control state (the first 20 scans). A large region of interest encompassing the parenchyma of both hemispheres was used to obtain the mean ΔR2* of each rat. Spatial resolution was sufficient to clearly identify and exclude cerebral ventricles, large epicortical vessels, and venous sinuses. The calculated oxygen saturation values of arterial and venous blood samples were compared with the averaged value of ΔR2* from the last 20 MR brain scans during hypoxemic hypoxia. These scans were chosen because of their temporal proximity to blood sampling. To take into account the weighted contributions of changes in arterial (ΔYa) and venous(ΔYv) oxygen saturation within the brain parenchyma on ΔR2*, an “effective” cerebral blood oxygen saturation change (ΔYb) was calculated using ΔYb= (1 − α)*ΔYa + α*ΔYv, where α is the cerebral venous volume fraction. The α was set to be 0.75, based on our previous experience (Lin et al., 1998) and reported values in the literature (Pollard et al., 1996).
Statistical analysis
A correlation coefficient (R) was calculated using linear regression analysis to quantitate the linear relation between changes in the effective cerebral blood oxygen saturation and ΔR2*. Analysis of variance was used to compare physiologic parameters between groups. In addition, Dunnett's tests were used for multiple comparisons between the slopes of the linear regressions of the HD groups, including both mild and moderate groups against the normal Hct group. A P value less than 0.05 was considered a significant difference between groups at a 95% level of confidence.
RESULTS
The physiologic parameters of all three groups are shown in Table 1. Except for the expected reductions in Hct, HD procedures did not significantly change other physiologic parameters. The normal Hct group had a mean Hct of 42.8% ± 2.33%. Reductions of Hct from 44.5% ± 2.33% to 33.4% ± 1.88% and 43.9%± 2.7% to 27.14% ± 2.7% were achieved for the mild and moderate HD groups, respectively. No significant differences were observed in the Hct before and after inducing hypoxemic hypoxia in any group (data not shown), indicating that the effects of the HD procedures were sustained and stable.
The relations betweenΔYb and ΔR2* are shown in Fig. 1 for all three groups. A straight line was fitted to each group, and the slope, Y intercept, and correlation coefficient of each fitted line are shown in the Fig. 1. Regardless of the Hct value at the time that hypoxemic hypoxia was induced, a linear relation was obtained for all three groups. Correlation coefficients of 0.87, 0.81, and 0.75 were obtained for the normal Hct, mild HD, and moderate HD groups, respectively. However, the slopes of the linear regression lines increased dramatically from 15.0 in the normal Hct to 33.3 in the mild HD and 74.1 in the moderate HD groups, respectively. These differences in slope were statistically significant when compared both mild and moderate HD groups with the normal Hct group (P < 0.001).

Relationships between ΔR2* (x-axis) andΔYb (y-axis) for all three groups are shown. The slopes, y-intercepts, and correlation coefficients are shown for all three linear regression lines. (▴) normal hematocrit; () mild hemodilution; (•) moderate hemodilution.
DISCUSSION
Changes in the deoxyhemoglobin content of blood is the main source of signal intensity change in T2*-weighted MRI (Ogawa, et al., 1990; Weissokoff and Kiihane, 1992). When the amount of deoxyhemoglobin in blood vessels is increased (as with the hypoxemic hypoxia paradigms used in this study), a reduction in MRI signal intensity is expected corresponding to an increase in magnetic susceptibility-induced spin dephasing. In this study, we were able to isolate the effects of changes in Hct on hypoxia-induced changes in signal intensity because the oxygen saturation values of arterial and venous blood started from approximately the same baseline values, and the range of reduction in oxygen saturation brought about by hypoxia was closely similar in each group. Although there were statistically significant differences in the baseline arterial oxygen saturation between the normal Hct and moderate and mild HD groups (the latter two received an oxygen supplemented mixture of room air), the absolute differences in Ya were small and unlikely to have contributed significantly to the analysis of change in the effective cerebral blood oxygen saturation (ΔYb), as reflected in the observed changes in signal intensity that were used to calculate changes in the R2* relaxation constant, or ΔR2*. As shown in Fig. 1, a linear relation between ΔR2* and ΔYb was observed for all three groups of rats subjected to hypoxemic hypoxia, regardless of the Hct level. These observations are in close agreement with the already established relations betweenΔR2* and ΔYb, which were derived from experiments that did not take into account Hct as a potential variable (Prielmeier et al., 1994; Lin et al., 1998).
However, the slope of the linear regression lines increased dramatically as the Hct of rats was reduced (Fig. 1), such that the group with the lowest Hct (27.14% ± 2.7%) had a slope nearly fivefold greater than the group with normal Hct (42.83% ± 2.33%). This suggests that for the same or similar change in cerebral blood oxygen saturation, the change in R2* estimated from the MRI signal intensity depends critically on the concentration of deoxyhemoglobin within the blood. This conclusion is expected, given that the theory of BOLD contrast predicts that it is the absolute quantity of deoxyhemoglobin in a given voxel (as opposed to the oxygen saturation values of the arterial and venous blood pools) that determines the magnitude of the susceptibility effect available to influence MRI signal intensity.
On the other hand, notice that the increase in slope of the linear regression lines was disproportionately larger than expected from the corresponding changes in Hct alone. Reductions in Hct of 25% and 38% with respect to normal values corresponded to increases in slope of 121.6% and 393.1%, respectively. This clearly implies that the observed increases in the slope of the regression lines describing the relation between ΔYb and ΔR2* could not be explained completely by the measured changes in large-vessel Hct alone.
Other physiologic factors related to the acute HD protocol need to be taken into consideration. First, it is well established that the large-vessel Hct (as measured from arterial samples in this study) may substantially overestimate the microvascular or “tissue” Hct; the images of brain parenchyma used in this study to estimate ΔR2* should be more reflective of the latter. Todd and colleagues point out that-consistent with the observations of other investigators-as large-vessel Hct is reduced, it increasingly overestimates the microvascular or tissue Hct; that is, the ratio of cerebral Hct to large-vessel Hct may be reduced from roughly 0.75 to 0.55 under conditions typical of the moderate HD group in this study. Therefore, the 38% reduction in large-vessel Hct in the moderate HD group may have been accompanied by a larger reduction in tissue Hct. Second, Todd and colleagues (1992) also have shown that normovolemic HD in the rat is accompanied by large increases in cerebral plasma volume(although as red blood cell volume is reduced, total cerebral blood volume is increased). Since plasma is known to have a shorter R2* than erythrocytes (Barth and Moser, 1997), an increase in plasma volume in a given brain region also could decrease R2*. The calculated ΔR2* from MRI may therefore reflect a composite effect of reduced tissue Hct and an absolute increase in the plasma volume of tissue.
Certainly, other less well characterized factors also could contribute to the discrepancy between the changes in large-vessel Hct and the observed changes in the slopes of the aforementioned regression lines. Nevertheless, the data support the main conclusion of this study that the relation between ΔR2* and ΔYb is altered when Hct is modified.
CONCLUSION
In summary, we demonstrate that there is a reduction in magnetic susceptibility-induced signal intensity change in T2*-weighted MRI when Hct is reduced. This is in close agreement with theoretical predictions of the mechanisms of the BOLD effect. Our study underscores the importance of scaling MRI data to the actual hemoglobin concentration in a tissue of interest when quantitative estimates of blood oxygen saturation are desired.
Footnotes
Acknowledgements
The authors thank Professor E. Mark Haacke for his valuable suggestions and review of this manuscript.