
Abstract
Acute hypercapnia simultaneously induces increases in regional cerebral blood volume (rCBV) and the oxygen saturation of cerebral venous blood (Yv). Changes in both physiologic parameters may influence the changes in R2* (ΔR2*) that can be measured in the brain with gradient echo magnetic resonance imaging. The authors examined the effect of incorporating independent measurements of the change in rCBV (ΔrCBV) on the fidelity of the relation between ΔR2* and ΔYv in the setting of experimental hypercapnia. A two-dimensional T2*-weighted gradient echo sequence was used to measure ΔR2* in the brain parenchyma of anesthetized rats in response to hypercapnia with respect to the control state. In parallel, estimates of rCBV were obtained using a three-dimensional steady-state approach in conjunction with a paramagnetic contrast agent during both control and hypercapnic states so that a ΔrCBV could be calculated. Regional CBV values of 2.96 ± 0.82% and 5.74 ± 1.21% were obtained during the control and hypercapnic states, respectively, and linear relations between rCBV and CO2 tension in both arterial (r = 0.80) and jugular venous (r = 0.76) blood samples were obtained. When correlating ΔR2* directly with ΔYv, no clear relation was apparent, but a strong linear relation (r = 0.76) was observed when correction for ΔrCBV was incorporated into the data analysis. These results are consistent with the current understanding of the mechanisms of blood oxygen level–dependent (BOLD) contrast and underscore the potential importance of taking into account ΔrCBV when quantitative estimates of ΔYv from the “BOLD effect” are intended.
Keywords
The discovery of blood oxygen level–dependent (BOLD) contrast (Ogawa and Lee, 1990a, b , 1993) has opened a new avenue for noninvasive measurement of cerebral blood oxygen saturation (CBOS) in vivo. It is well established that deoxyhemoglobin molecules can act as paramagnetic particles (Ogawa et al., 1993; Thulborn et al., 1982) and that changes in their concentration within blood induce signal intensity (SI) changes in T2- and T2*-weighted magnetic resonance (MR) images. In the case of the CNS, these SI changes can be measured from intravascular voxels (within the larger blood vessels themselves) or from the brain parenchyma, which is permeated by many small, pseudorandomly distributed vessels (Ogawa and Lee, 1990a, 1993; Wright et al., 1991). An extensive literature has developed around the use of the “BOLD effect” to localize the physiologic changes in CBOS that accompany task-specific regional cerebral metabolic activation (i.e., functional brain imaging) (Kwong et al., 1992; Ogawa et al., 1993). In addition, it has been demonstrated that the BOLD effect can be used to map global or even regional changes in CBOS under a variety of experimental conditions that simulate clinical pathophysiologic states or therapeutic interventions. These include hypoxemic hypoxia (Turner et al., 1991; Prielmeier et al., 1994; Jezzard et al., 1994; Hoppel et al., 1993; Rostrup et al., 1995; Kennan et al., 1997; Lin et al., 1998a), hypercapnia and hypocapnia (Jezzard et al., 1994; Davis et al., 1998), acute hemodilution (Lin et al., 1998b), focal and global cerebral ischemia (De Crespigny et al., 1992; Ono et al., 1997), epileptic convulsions (Weiss et al., 1998), and the effects of drugs that induce cerebral hemodynamic changes (e.g., acetazolamide) (Hedera et al., 1996). In good agreement with the theoretical understanding of BOLD contrast mechanisms, an increase in SI (decreased R2*) occurs when interventions such as acute hypercarbia or pharmacologic cerebral vasodilation are made. These states often are associated with increases in CBOS (i.e., decreased deoxyhemoglobin content) (Jezzard et al., 1994; Kwong et al., 1995; Davis et al., 1998). Conversely, when reductions in CBOS are induced (e.g., in hypoxia, apnea, hypocapnia, and ischemia), a reduction in SI within the brain parenchyma frequently is seen on T2*-weighted images, most likely reflecting the influence of an increase in the parenchymal deoxyhemoglobin content (Turner et al., 1991; Prielmeier et al., 1994; Jezzard et al., 1994; Hoppel et al., 1993; Rostrup et al., 1995; Kennan et al., 1997; Lin et al., 1998a; De Crespigny et al., 1992; Ono et al., 1997).
The quantitative aspects of these observations have come under detailed scrutiny. Both Prielmeier and associates (1994) and our group (Lin et al., 1997, 1998a) report a linear relation between the experimentally measured ΔR2* in brain parenchyma and changes in CBOS in rat models of acute hypoxemic hypoxia. These findings suggest that quantitation of the BOLD effect from MR images can be used, in theory, to make noninvasive estimates CBOS. However, accurate quantitation of the BOLD effect with respect to CBOS is a complex and technically challenging task. In addition to the level of blood oxygen saturation, many other factors may influence SI behavior in T2*-weighted MR imaging (Kennan et al., 1994; Yablonskiy and Haacke, 1994; Haacke et al., 1995; Boxerman et al., 1995). These include the tissue-level hematocrit (Lin et al., 1998a,b), the absolute value of rCBV (a co-determinant of tissue deoxyhemoglobin content) (Jezzard et al., 1994; Kennan et al., 1997), and the anatomic partitioning of blood volume between arterial and venous elements (Lin et al., 1997). Details of rCBV are of particular interest because it has been suggested that changes in tissue blood volume alone can result in substantial changes in R2*, independent of any change in CBOS that may occur in a given experimental setting (Jezzard et al., 1994; Kennan et al., 1997). Furthermore, the changes in rCBV that are associated with the various pathophysiologic states discussed earlier are multifactorial and may vary considerably both between subjects and as a function of time within a given subject. Quantitation of ΔrCBV associated with the various pathophysiologic states in individual subjects is therefore essential. However, few of the previous studies that have examined the relation between R2* and CBOS have taken into account the ΔrCBV that may occur during experimental manipulations. Jezzard and coworkers (1994) demonstrated that dynamic changes in R2* (ΔR2*) measured from cat brain could be readily detected using an echo-planar gradient echo sequence under conditions of respiratory challenges including acute anoxia, apnea, and hypercapnia. Spectrophotometric measurements of CBOS from the surface of the brain were made concurrently through a cranial window. These investigators demonstrated that when the spectrophotometric data indicated little concomitant change in rCBV (e.g., anoxia, apnea, and hyperoxia), there was a good correlation between ΔR2* and ΔCBOS. In contrast, when large changes in rCBV were associated with the experimental manipulation (e.g., hypercapnia), MR imaging and spectrophotometric CBOS results diverged widely. To a large degree, these findings are not unexpected. As suggested by the authors, changes in rCBV that alter SI independent of changes in oxygen saturation should cause a discrepancy between the MR imaging data and CBOS measurements. Similar findings have been reported in humans by Rostrup and associates (1995). Taken together, these data suggest the importance of taking into account the changes in rCBV that may occur in association with experimental manipulations when quantitative estimates of CBOS from the BOLD effect are intended.
In this study, acute hypercapnia was induced in rats as a means to alter both rCBV and the oxygen saturation of cerebral venous blood (Yv). The oxygen saturation of arterial blood (Ya) entering the brain was maintained constantly and greater than 95% throughout each experiment. A two-dimensional (2D) gradient echo sequence was used to acquire images continuously before and during hypercapnia so that ΔR2* in the brain parenchyma could be calculated. In parallel, a three-dimensional (3D) steady-state approach was used to measure rCBV both before and after producing hypercapnia so that ΔrCBV could be obtained (Moseley et al., 1992; Schwarzbauer et al., 1993; Kuppusamy et al., 1996; Lin et al., 1997). The relation between ΔYv as measured by ex vivo blood gas analyses and ΔR2*, with and without the correction for ΔrCBV, then was investigated.
THEORY
It has been proposed (Yablonskiy and Haacke, 1994) that when a set of small cylindrical objects containing paramagnetic centers (e.g., venules) are randomly distributed in a voxel within the brain parenchyma, signal decay can be observed with sufficiently long echo times. For these long echo times, the relation between R2' (equals 1/T2') and the susceptibility for a set of randomly oriented cylinders is given by

where γ is the magnetogyric ratio = 2.67 × 10⁸ rad/s/T and λ is the rCBV, Y is the fractional oxygen saturation, B0 is the static magnetic field, Hct is the fractional hematocrit, and Δχ is the susceptibility difference between 100% oxygenated and deoxygenated blood, which has been measured to be 0.18 ppm (Weisskoff and Kiihne, 1992) in centimeter-gram-second units. Assuming that only rCBV and Y are changing during the experimental manipulation, and that the R2 of brain parenchyma remains invariant, the expected R2* changes can be rewritten as follows:

where C = 1.33πγΔχB0λHct, Δλ = λpost – λpre, and Δ(λY) = λpostYpost – λpreYpre. The “pre” and “post” here denote the control and hypercapnic states, respectively. Therefore, when either rCBV, Y, or both are altered, R2* should be modified accordingly. More importantly, a linear relation is predicted between ΔR2* and ΔY when they are normalized with respect to Δλ, as ΔR2*/Δλ and Δ(λY)/Δλ. In this study, because the Ya entering the brain remained constant throughout the experiments, only the induced changes in Yv should contribute to the observed effect on R2*. The animal preparations and imaging protocols are addressed later.
MATERIALS AND METHODS
All procedures described here were approved by the Animal Studies Committee of Washington University Medical Center (St. Louis, MO, U.S.A) and fall within the guidelines for animal care established by the National Institutes of Health (Bethesda, MD, U.S.A.).
Animal preparations
Twelve adult male Long-Evans rats weighing 300 to 400 g were used for these studies. The general surgical procedures are addressed later. Animals were maintained under ad libitum conditions for 24 hours before surgery, and general anesthesia was induced with a single intraperitoneal injection of pentobarbital (30 mg/kg). The descending aorta was cannulated through the left femoral artery with a PE-50 polyethylene catheter (Becton-Dickinson, Sparks, MD, U.S.A.) for obtaining samples for arterial blood gas analyses and the injection of a contrast agent. Subsequently, the right jugular vein was exposed and cannulated with a heparinized PE-50 catheter so that its tip would lie at the mouth of the transverse sinus as it exits the postglenoid foramen (Greene, 1935). This preparation for obtaining proximal jugular vein blood samples is done routinely in our laboratory; using this method, contamination of blood samples by the venous drainage of extracerebral structures is minimized (Lin et al., 1997). Tracheotomy and tracheal cannulation then were performed, tracheal tubing was attached to a small animal ventilator (Harvard Apparatus, South Natick, MA, U.S.A.), and an intravenous neuromuscular blocking agent was administered (pancuronium hydrochloride) at the rate of 0.1 mg/kg/h. At the end of each experiment, the anesthetized rat was killed humanely with an overdose of intravenously administered pentobarbital.
To maintain strict anaerobic conditions during the blood sampling process and to minimize time-dependent alterations of pH and blood gas tensions, all blood samples were analyzed for pH, P
Hypercapnia protocol
After the animals were transported to the MR imager, 15 minutes was allowed for stabilization of physiologic conditions. During this period, O2-supplemented room air was given to the animals to maintain Ya greater than 95%. Both arterial and jugular venous blood samples were taken immediately before the MR imaging session to obtain control-state blood gas parameters. After acquiring control-state images (described in the MR imaging protocols section later), hypercapnia was induced by changing the inspired gas to a mixture of 5% CO2 and 95% O2 while animals remained immobile within the MR imager and images were acquired continuously. Immediately after the completion of each MR imaging session, both arterial and jugular venous blood samples again were taken for blood gas analyses. One or two such manipulations to produce hypercapnia were carried out in each animal. When two manipulations were performed, hyperventilation (achieved by increasing the rate of minute ventilation while changing the inspired gas to O2-supplemented room air) was carried out over a 10-minute interval between the first and second episode. This was done to decrease the elevated Pa
Magnetic resonance imaging protocols
All images were acquired on a Siemens 1.5-T whole-body VISION system (Siemens, Erlangen, Germany) with a gradient strength of 25 mT/m and a ramp time of 0.6 milliseconds to the maximum gradient. A small, homemade, receive-only radiofrequency coil was used for data acquisition. Two sequences were used. To obtain rCBV estimates, a 3D gradient echo sequence was used, and the imaging parameters were as follows: repetition time (TR) 25 milliseconds; echo time (TE) 8.4 milliseconds; flip angle 50°; slice thickness 1 mm for a total of 32 partitions; field of view 45 × 60 mm2; and matrix size 96*128. In contrast, to obtain R2* changes in relation to the experimental manipulations, a 2D gradient echo FLASH sequence was used with the following imaging parameters: repetition time 97 milliseconds; TE 35 milliseconds; slice thickness 2 mm; field-of-view 45 × 60 mm2; matrix size 96*128; and flip angle 15°. First-order velocity compensation was used along both the slice select and frequency encoding directions for both sequences so that flow artifacts could be minimized.
Before and roughly 3 minutes after the injection of a bolus of gadopentetate dimeglumine (Gd-DTPA) (Magnevist, Berlex Laboratories, Wayne, NJ, U.S.A.) at a dose of 0.1 mmol/kg, the 3D sequence was used to obtain precontrast and postcontrast images for determination of baseline rCBV. Subsequently, the 2D gradient echo sequence, roughly 8 minutes after the injection of contrast agent, was used to acquire T2*-weighted images continuously. In total, 80 MR images were acquired at a rate of 10 seconds per scan. The first 10 scans were used as control-state studies; the inspired gas then was changed to 5% CO2 and 95% O2, and 70 additional scans were acquired during the induction and plateau phase of the hypercapnic state. Finally, immediately after completion of the 2D acquisition, the 3D gradient echo sequence was repeated so that the rCBV associated with the hypercapnic state could be obtained. When two hypercapnic manipulations were induced, the same imaging protocol as described earlier was repeated with a second injection of the contrast agent.
Data analysis
Regional cerebral blood volume measurements. The details of rCBV calculation have been described elsewhere (Kuppusamy et al., 1996; Lin et al., 1997). In short, absolute measurements of rCBV (expressed as percent tissue volume) can be obtained using
where Spre and Spost represent the SI before and after contrast injection in the brain parenchyma, respectively, and ̄Spre and ̄Spost represent the SI in voxels located entirely within a blood vessel before and after contrast injection, respectively. The voxels chosen for intravascular SI analysis were within the superior sagittal sinus, a readily identified structure, and were free from partial volume effects with the underlying brain parenchyma. In this way, a pixel-by-pixel rCBV map could be obtained. A 3 × 3 low-pass filter was applied to improve the signal-to-noise ratio in the rCBV maps.
To investigate the changes in rCBV from control to hypercapnic states, three slices centered at the same location as T2*-weighted images of the same brain were used for rCBV measurements. A region of interest (ROI) analysis, which encompassed both hemispheres, excluding any visible large vessels, was defined in the rCBV maps obtained during control state. The same ROI were subsequently used for rCBV measurements during the hypercapnic state.
ΔR2* measurements. Since only one echo was used, the changes in R2* induced by hypercapnia with respect to the control state was calculated using

where S(t) is the SI at a given time, and S0 is the mean SI during the control state (the first 10 scans). Similar ROI, as defined earlier for the rCBV measurements, were used to obtain ΔR2* measurements. To investigate the relation between ΔR2* and ΔYv (the latter determined by the difference in oxygen saturation of jugular venous blood before and after induction of hypercapnia), the ΔR2* from the last 20 scans (plateau phase of hypercapnia) were averaged. These last 20 scans were chosen because of their temporal proximity to venous blood sampling and rCBV measurements. The ΔYa was not taken into consideration here because little or no change occurred in Ya over the course of the experiments (Table 1) and the absolute values of Ya (more than 95%) were such that bulk susceptibility effects from arterial blood were unlikely to contribute to ΔR2*.
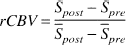
Physiologic parameters
Parameters obtained from arterial and venous blood samples for both the first and the second manipulations, respectively. Data are expressed as mean ± standard deviation. Sat., measured blood oxygen saturation.
Statistical analysis
Data are expressed as mean ± SD where SD represents the intersubject variability. A linear regression analysis was used, and a correlation coefficient (r) was calculated to indicate the correlation between two experimentally measured parameters.
RESULTS
Physiologic parameters from both arterial and jugular venous blood gas analyses obtained during the control and hypercapnic states for the first and the second manipulations, respectively, are shown in Table 1. Although hyperventilation was carried out over a 10-minute interval between the first and the second manipulations to bring Pa
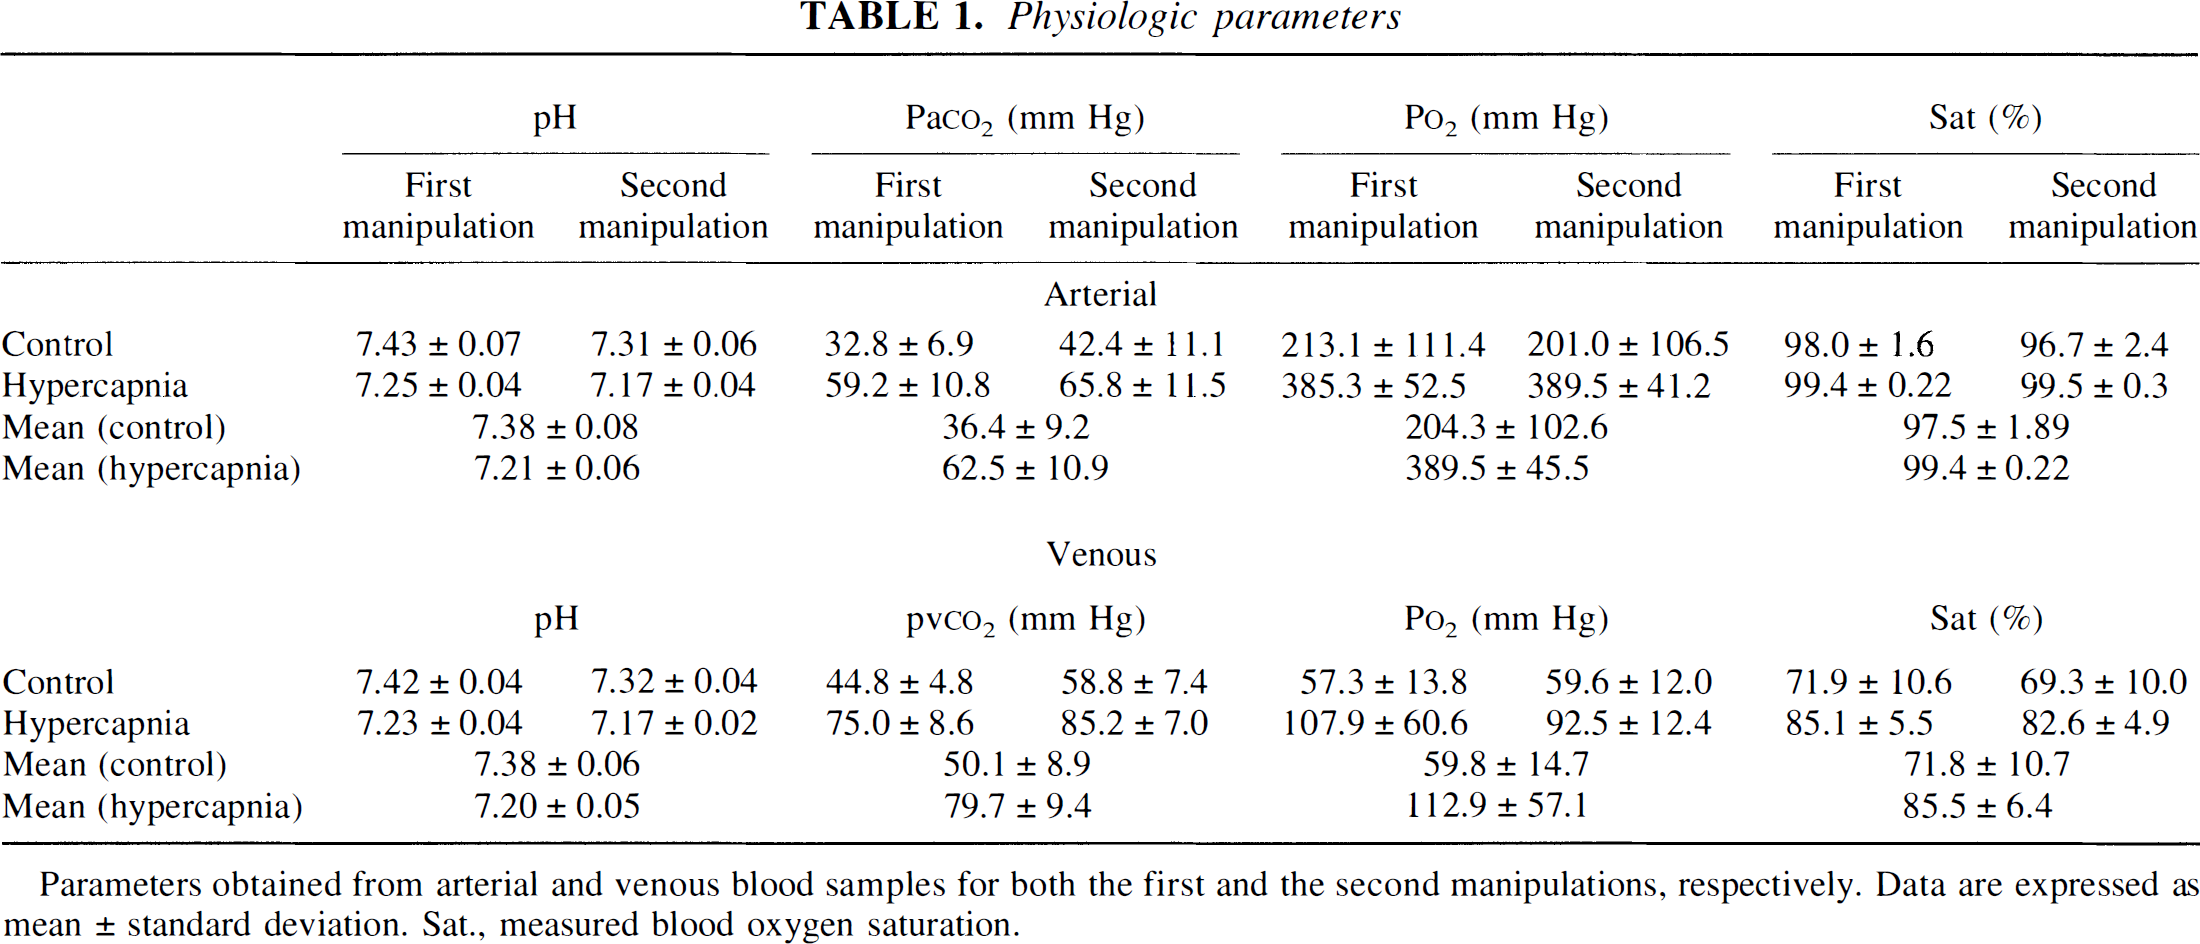
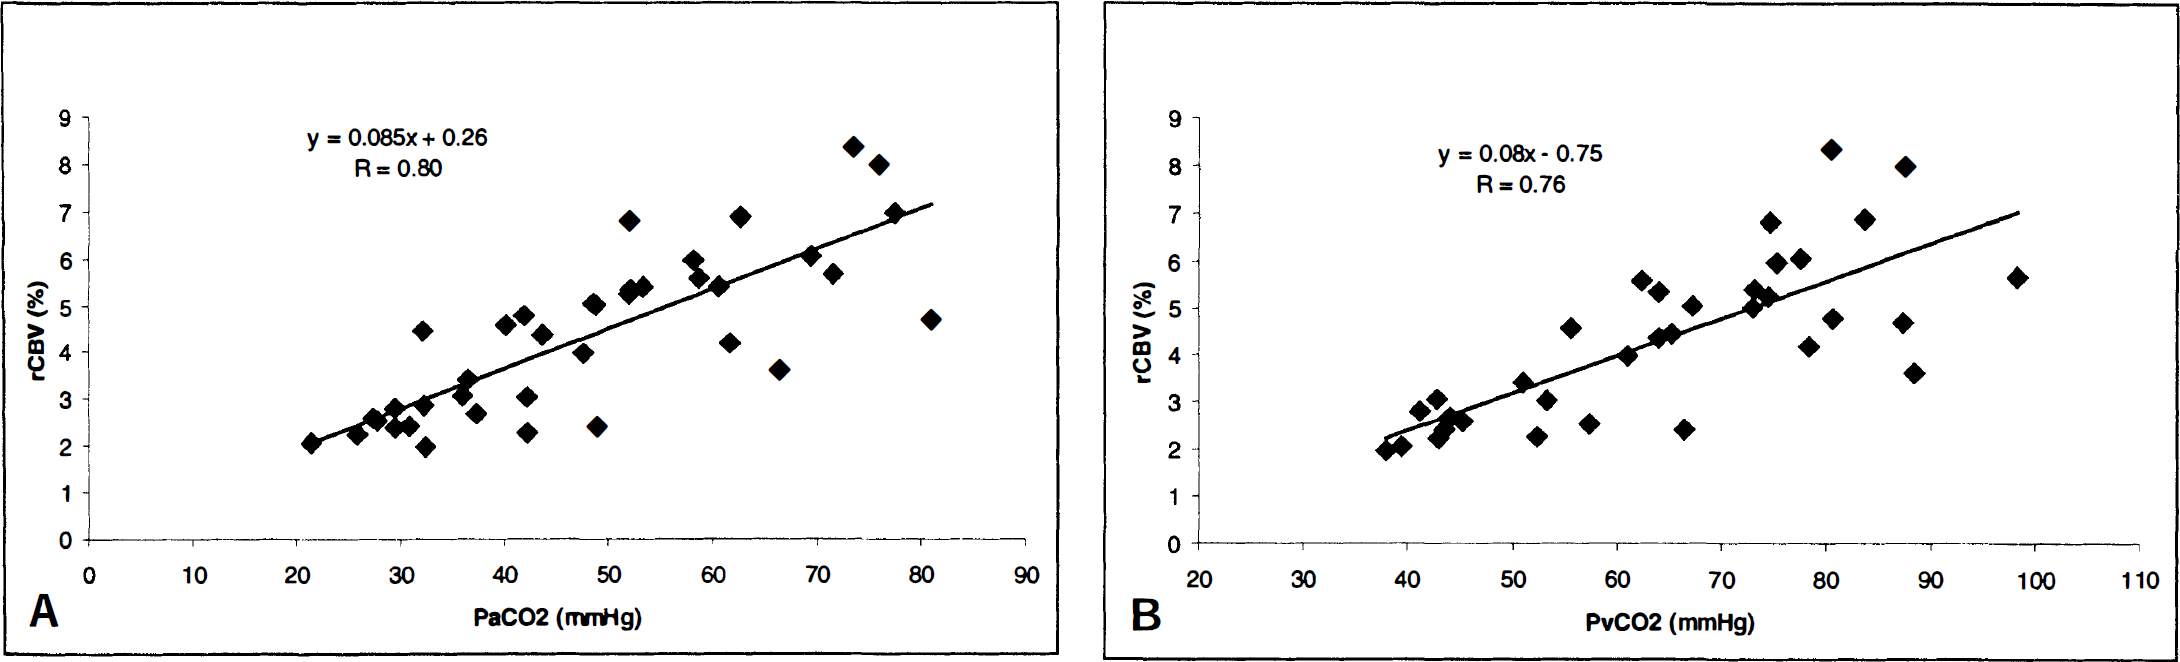
The measured rCBV values are summarized in Table 2 for both control and hypercapnic states. During the control state, a mean rCBV of 2.96 ± 0.82% was obtained for all rats. However, when the control-state rCBV values obtained from the first and the second hypercapnic manipulations were considered separately, rCBV values of 2.47 ± 0.32% and 3.79 ± 0.74% were obtained, respectively, indicating that rats started from higher baseline rCBV values during the second induction of hypercapnia. In addition, higher intersubject variability was observed for ΔrCBV in rats that underwent a second manipulation. This spread of rCBV values was valuable in establishing an adequate database for the correlation analysis presented later. The relations between rCBV and both arterial (Fig. 1A) and jugular venous (Fig. 1B) CO2 tensions are shown for all rats. As expected, over the range of CO2 tensions explored, there was a linear relation between Pa
The relation between CO2 tension in both arterial
Experimental measurements of regional cerebral blood volume
Cerebral blood volume measured in the brain parenchyma for all rats. The data are expressed as mean ± standard deviation where standard deviation is the inter-subject variability.
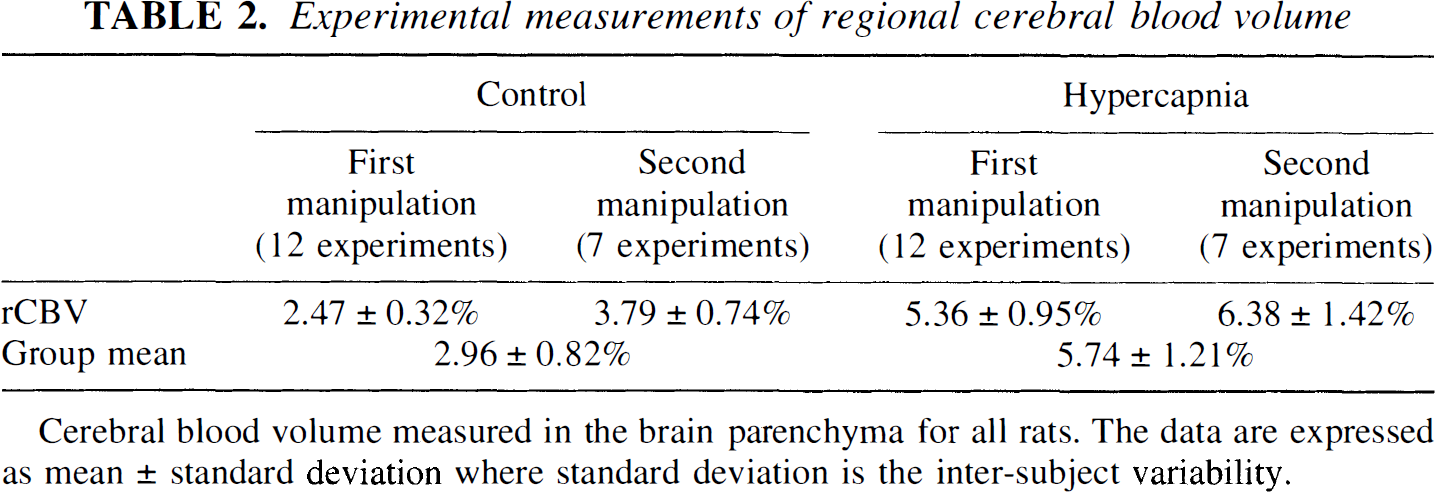
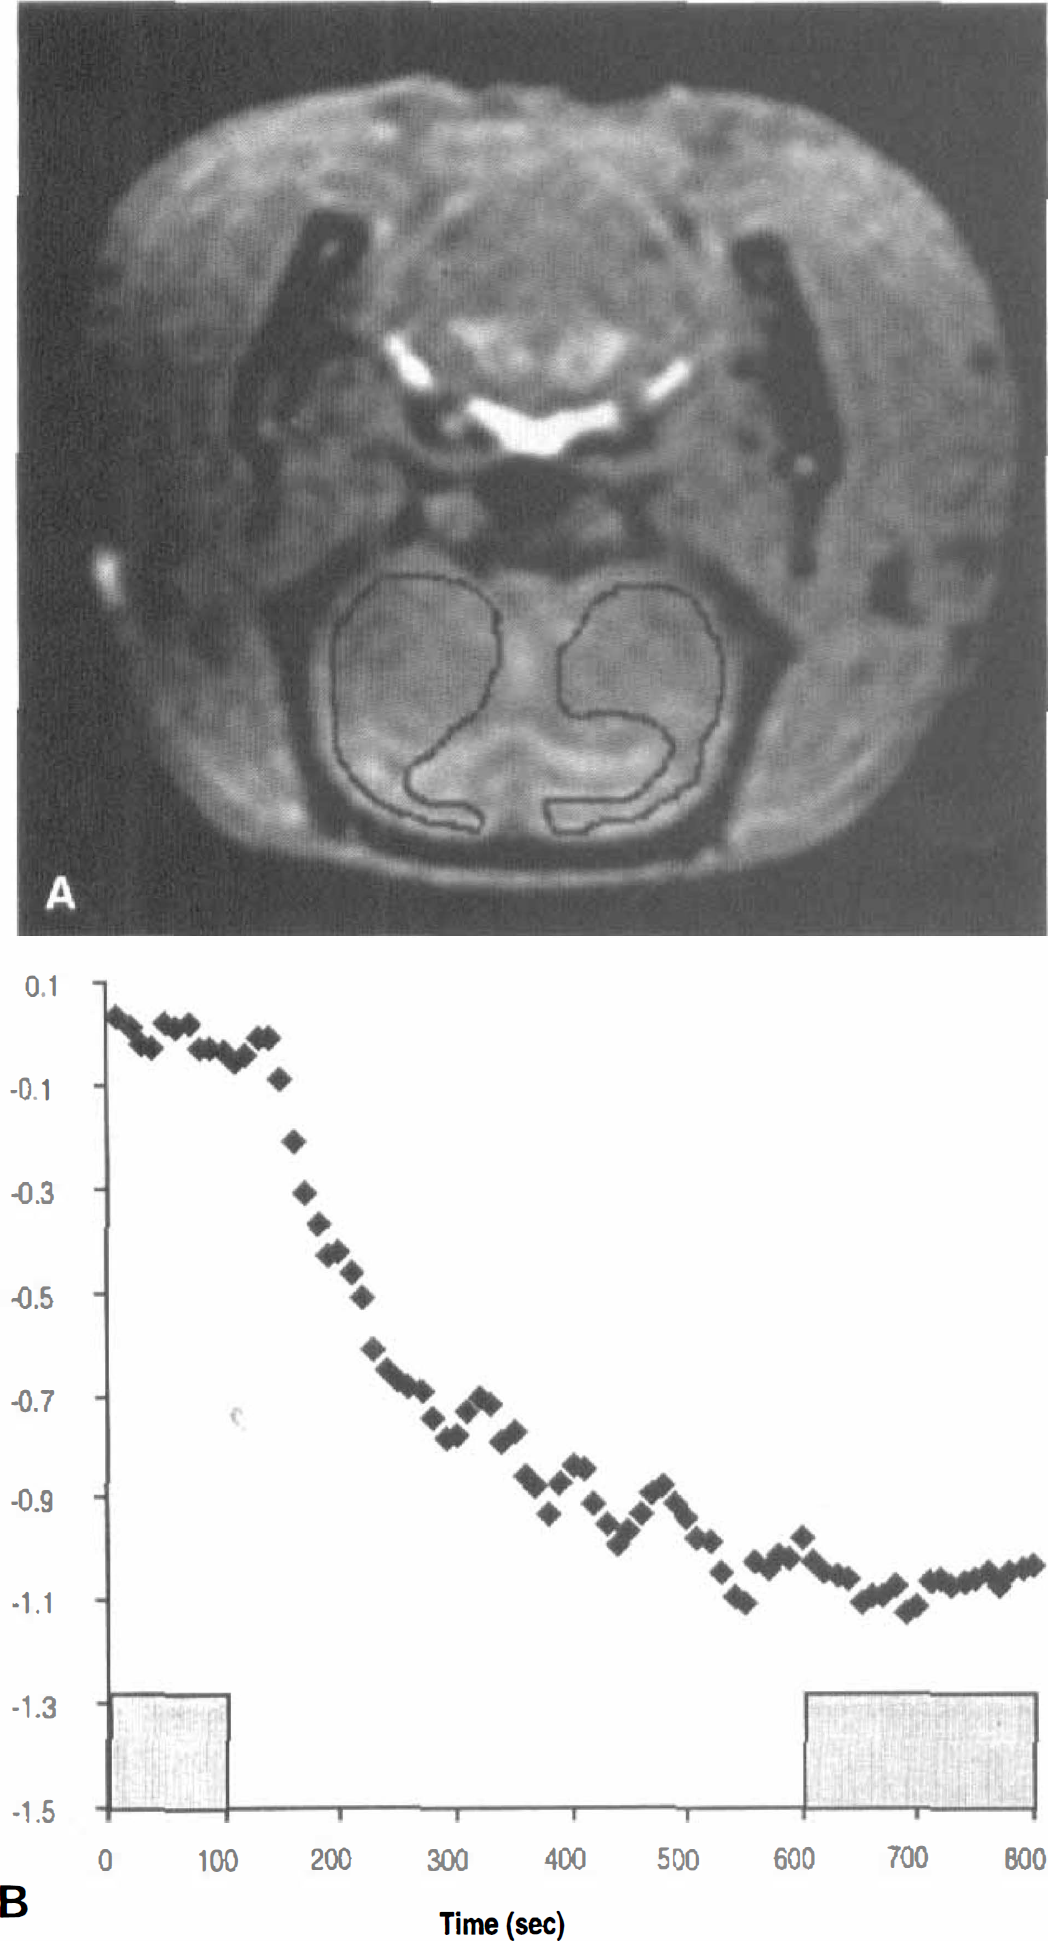
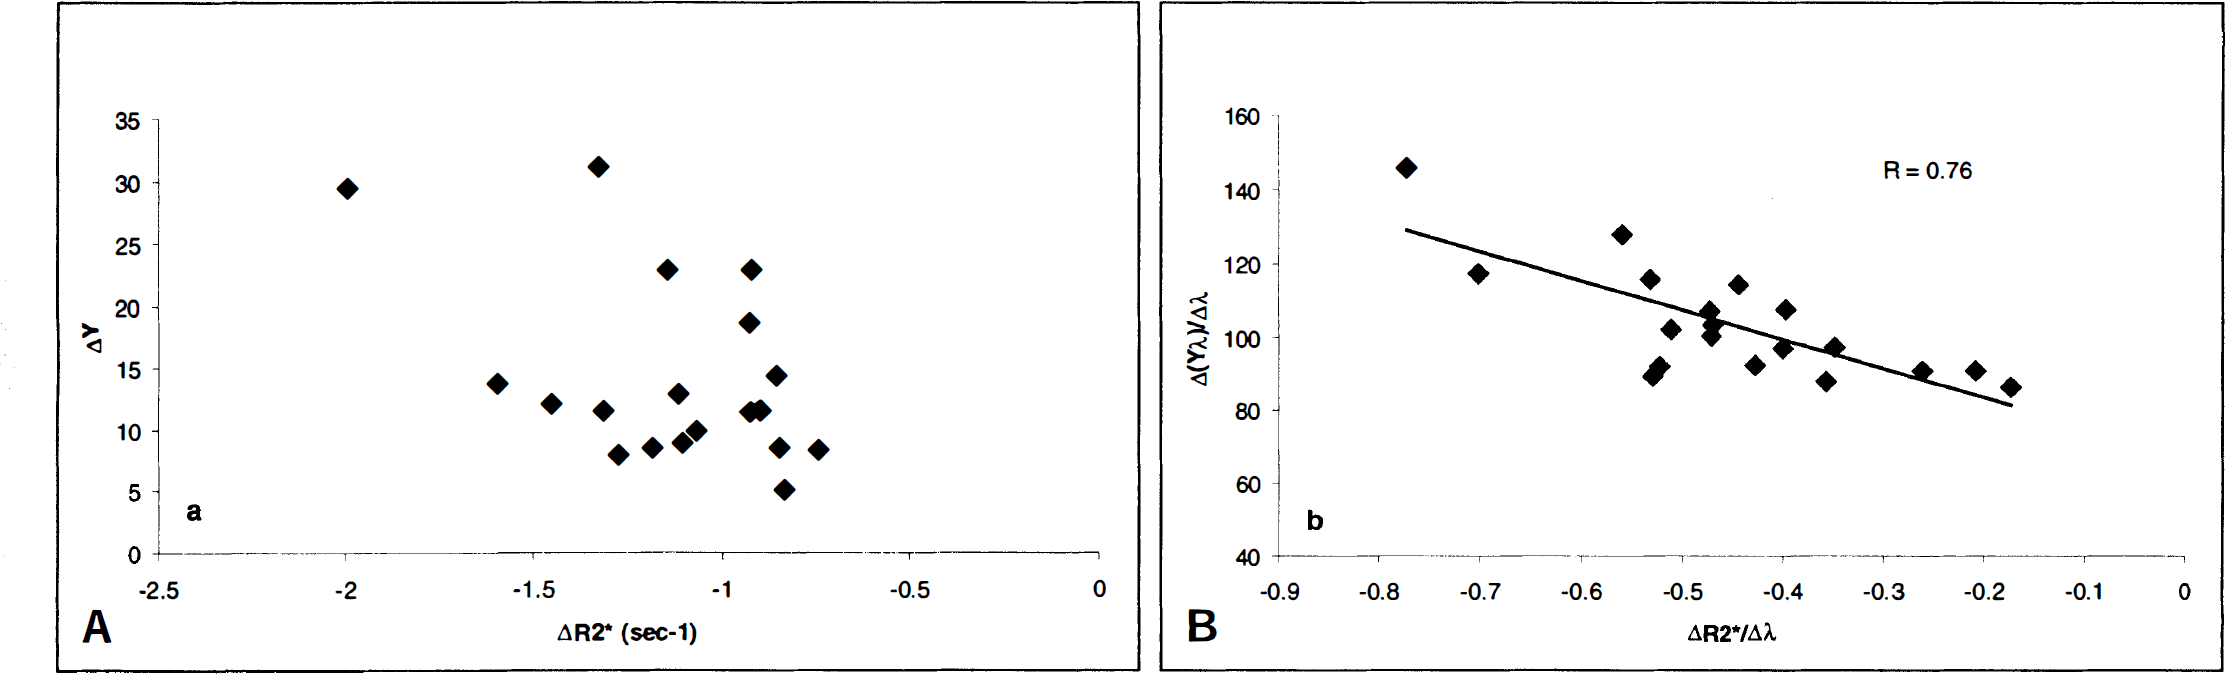
A represented anatomical image acquired with the 3D T1-weighted sequence is shown in Fig. 2A, where the contours indicate the ROI used for both rCBV and ΔR2* estimates. In addition, the associated ΔR2* as a function of time from the same animal is shown in Fig. 2B. A marked decrease in R2* was observed initially (from roughly 150 to 500 seconds) in response to the change in the CO2 content of the inspired gas followed by a relative plateau throughout the end of the experiment. The shaded areas in Fig. 2 indicate, respectively, the control state (10 to 100 seconds) and the plateau period of the hypercapnic state (610 to 800 seconds) during which data were averaged to provide the effective ΔR2* values attributable to hypercapnia. Similar temporal behavior for ΔR2* in response to hypercapnia was observed in all rats. The discrete ΔR2* values so calculated then were used for linear regression analysis with ΔYv. It is readily apparent from Fig. 3A that there is considerable scattering of the data, which exhibit no clear relation between ΔR2* and ΔYv (Fig. 3A). In contrast, when ΔrCBV values for the transition from control to the hypercapnic state were taken into account by plotting ΔR2*/Δλ against Δ(λYv)/Δλ (Fig. 3B; see Theory section), a linear relation was revealed (r = 0.76).
DISCUSSION
Alteration of arterial CO2 tension is a powerful means to induce cerebral hemodynamic changes. Hypercapnia causes an increase in both rCBV and regional CBF with little or no changes in the cerebral metabolic rate of oxygen utilization (Reivich, 1964; Eklof et al., 1995). As a result, an increase in Yv and jugular venous outflow often are reported. As demonstrated in Fig. 2, the net effect of this concomitant increase in rCBV and Yv is an increase in SI in brain parenchymal ROI in T2*-weighted images. This effect on SI most likely reflects a decrease in R2*, which is expected to parallel a decrease in the deoxyhemoglobin content of brain tissue. In general, the quantitative relation between R2* and Yv is of great practical interest because noninvasive estimates of Yv could be useful in both experimental and clinical investigation (Cruz, 1993; Bullock et al., 1993).
To investigate the relation between the ΔYv and ΔR2* induced by hypercapnia, the ΔR2* measured in the brain parenchyma was correlated with the changes in the oxygen saturation of venous blood as measured from samples obtained from jugular catheters. This experimental approach was justified for the following reasons. First, in previous studies, we have demonstrated that the oxygen saturation values in samples taken simultaneously from the proximal jugular vein (at the outlet of the transverse sinus) and the superior sagittal sinus are closely similar across a wide range of experimental conditions, including hypercapnia. This finding indicates that the oxygen saturation of blood taken from properly positioned jugular vein catheters is representative of the cerebral venous effluent in the rat (Lin et al., 1998a). Second, since the arterial blood entering the brain was maintained at nearly full saturation (greater than 95%) throughout each experiment, ΔY a does not contribute to the SI changes observed in these T2*-weighted images. Only the venous blood within the tissue is expected to contribute to bulk magnetic susceptibility effects. However, no correlation was apparent in the direct comparison of ΔYv and ΔR2* (Fig. 3A). To a large degree, these results may not be surprising, since, according to BOLD theory, ΔR2* is a function of both rCBV and CBOS (see Eq. 1) (Yablonskiy and Haacke, 1994; Haacke et al., 1995). When these two parameters vary concurrently, either one alone might be expected to correlate poorly with ΔR2*, as shown in Fig. 3A for ΔYv. In particular, if the blood volume within the venous portion of the circulation were to vary to a large and variable degree in relation to the changes in cerebral venous oxygen saturation, a poor correlation between ΔR2* and ΔYv would be expected, since venous blood volume is a co-determinant of tissue deoxyhemoglobin content. As shown in Eq. 2, ΔR2* can be characterized generally as a function of the changes in rCBV minus the changes of the product of the rCBV and CBOS. When both rCBV and venous oxygen saturation vary simultaneously and contributions to bulk magnetic susceptibility effect from arterial blood are minimized, a linear relation between ΔR2*/Δλ and Δ(λYv)/Δλ is predicted. Indeed, when the data were replotted in light of these considerations, a linear relation between ΔR2*/Δλ and Δ(λYv)/Δλ was revealed (Fig. 3B, r = 0.76).
These findings may seem at odds with the previously reported results of Prielmeier and colleagues (Prielmeier et al., 1994) and our group (Lin et al., 1998a,
b
) involving rat models of acute hypoxemic hypoxia. In those studies, ΔR2* was well correlated with changes in CBOS, even when cerebral blood volume was not taken into account. This discrepancy may be explained by consideration of two interrelated factors. First, in the experiments involving hypoxemic hypoxia, the overall magnitude of change in CBOS was much greater than the approximately 15% change in Yv associated with hypercapnia in the current experiments. Since CBOS is the primary determinant of the BOLD effect, the putative influence of changes in rCBV of whatever magnitude would be expected to be overwhelmed in the case of an experimental manipulation in which a large change in blood oxygen saturation is produced in the imaged brain. Second, it appears to be well established that the expected changes in rCBV in association with acute hypoxemic hypoxia of moderate degree are less than those related to moderate hypercapnia. In human volunteers, Fortune and coworkers (1995) showed that the cerebral blood volume, as measured by a collimated gamma detector with 99m-Tc-labeled red blood cells, increased by only 5.2 ± 0.03% after induction of hypoxemic hypoxia (Ya = 76.7 ± 2.0%). In contrast, the same investigators report an increase in cerebral blood volume of 12.8 ± 0.01% after induction of moderate hypercapnia (Pa
Measurements of regional cerebral blood volume
A steady-state approach was used in this study for the estimates of rCBV during control and hypercapnic states (Moseley et al., 1992; Schwarzbauer et al., 1993; Kuppusamy et al., 1996; Lin et al., 1997). This approach assumes that the brain contains two relatively separate compartments: extravascular (brain parenchyma) and intravascular (vessels). This assumption is reasonable in the current experimental setting, since there is no evidence that acute hypercapnia would alter blood–brain barrier integrity for molecules the size of the contrast agents, Gd-DTPA and MS-325 (EPIX, Inc., Cambridge, MA, U.S.A.) used in this and previous studies (Lin et al., 1997). Therefore, after contrast injection, only MR signal from the intravascular compartment should be affected. By subtracting the brain images obtained after contrast from the precontrast images and normalized by the precontrast and postcontrast SI differences obtained from intravascular voxels (see Methods), an absolute measurement of rCBV can be obtained. This steady-state method has been used to obtain rCBV in both humans and animals by our group as well as several other investigators (Moseley et al., 1992; Schwarzbauer et al., 1993; Kuppusamy et al., 1996; Lin et al., 1997). A good correlation between MR imaging–estimated rCBV values and those obtained using other imaging modalities has been reported (Kuppusamy et al., 1996; Lin et al., 1997). In a similar study using MS-325, an intravascular contrast agent with a much higher relaxivity than Magnevist, we report an rCBV value of 2.40 ± 0.34% in the rat during a control or baseline physiologic state (Lin et al., 1997). The mean control-state rCBV value (2.96 ± 0.82%) obtained in the current study is higher than those reported by us previously. This most likely reflects the higher baseline rCBV values in rats that underwent more than one manipulation to produce hypercapnia, with incomplete recovery between episodes. When data from rats that underwent only a single manipulation were analyzed separately (Table 2), a rCBV of 2.47 ± 0.32% was obtained. This comparison indicates that by using the 3D steady-state method, closely similar results can be obtained regardless of the specific contrast agent that is used. However, given the fact that the signal difference before and after contrast in the blood is the main determinant of the accuracy of rCBV estimates, MS-325, with a relaxivity roughly six times higher than Gd-DTPA (Lauffer et al., 1998), should provide a more accurate estimate of rCBV than Gd-DTPA. Nevertheless, a large ROI encompassing both hemispheres was used in this study to obtain an estimate of rCBV. In this case, the noise is reduced by the square root of the number of pixels (roughly 200) included in the ROI. This reduces the noise in a given ROI by a factor of 14, making the steady-state method less sensitive to the decreased relaxivity when Gd-DTPA is used. This is again consistent with our findings that a comparable rCBV was obtained between this study and our previous study in which MS-325 was used. In contrast, when a pixel-by-pixel analysis is desired, rCBV estimates would benefit from the higher relaxivity offered by MS-325.
Since there is no accepted “gold standard” for measuring regional blood volume in an organ as complex as the brain, we are unable to comment definitively on the accuracy—in absolute terms—of the 3D steady-state method. In addition to many other factors that have been addressed by other investigators (Moseley et al., 1992; Schwarzbauer et al., 1993) and our group (Kuppusamy et al., 1996; Lin et al., 1997), the signal alteration in the blood caused by the changes of deoxyhemoglobin concentration, in responding to hypercapnic manipulation could potentially affect the accuracy of rCBV estimates. However, the signal change is expected to be small, since a TE of 8 milliseconds was used for the rCBV estimates, and this TE is insensitive to BOLD effects at 1.5 T. Furthermore, the changes of jugular blood oxygen saturation in responding to experimental hypercapnic manipulations also is small (Table 1, from 71.8 ± 10.7% to 85.5 ± 6.4% during control and hypercapnic states, respectively). Therefore, signal changes induced by the alteration of deoxyhemoglobin concentration in responding to hypercapnic manipulations should have minimum effects on the estimates of rCBV. Furthermore, the results from the current study are in good agreement with the rat rCBV values of Todd and colleagues (1993) (2.67 ± 0.33%) who used a microwave fixation method to firmly trap an intravascular tracer before removal of the brain for ex vivo blood volume analysis. Overall, the steady-state method appears to produce rCBV values consistent with results obtained using alternative modalities and, within the limitations of the assumptions stated earlier, can be readily used in making determinations of ΔrCBV.
Relation between CO2 tension and regional cerebral blood volume
Over the range of Pa
Theoretical considerations
The effects of BOLD contrast on MR signal can be considered separately for the intravascular and extravascular compartments in which distinct signal behavior for each compartment is anticipated. In this study, the theory proposed by Yablonskiy and Haacke (Yablonskiy and Haacke, 1994; Haacke et al., 1995) was used to compare the theoretically predicted signal behavior with the experimentally measured MR signal changes in responding to hypercapnic manipulation. As addressed in the Theory section, the susceptibility induced by a set of randomly oriented cylinders that contain paramagnetic centers can be measured through an estimate of R2'. Here, the effects of the intravascular compartment and diffusion about the paramagnetic centers were ignored. In this study, ΔR2* and ΔrCBV measured in the brain parenchyma in responding to hypercapnic manipulation were used to investigate the effects of rCBV alterations between ΔR2* and CBOS changes. As demonstrated in Table 2, the rCBV measured in the brain parenchyma is 2.96% and 5.74% during the control and hypercapnic states, respectively. Therefore, any intravascular contributions are likely to be small and should not affect our data analysis. This is reinforced by our experimental results, where the relation between ΔR2* and ΔYv is greatly improved after the correction of rCBV, consistent with the anticipated theoretical prediction as proposed by Yablonskiy and Haacke (1994). However, the contributions of the intravascular compartment could play a more significant role when the blood volume ratio within a voxel is increased. For example, in a voxel that contains a pial vein, the blood volume ratio could be as high as 50%. Under this condition, contributions of both intravascular and extravascular compartments would need to be taken into account. This would require a careful modeling of both compartments and is beyond the scope of this report.
Effects of contrast agent in the measurements of ΔR2* and regional cerebral blood volume
The clearance of the contrast agent during the hypercapnic episode could potentially decrease R2* in addition to the anticipated reduction of R2* measured in the brain parenchyma in responding to experimental hypercapnia. However, this effect is anticipated to be small because of the fact that, as addressed in the imaging protocol, all 2D T2*-weighted images, including both the control and hypercapnic scans, are acquired after the injection of contrast agent. Furthermore, the first 8 minutes (when substantial changes of the concentration of contrast agent are anticipated) are used for the acquisition of the 3D T1-weighted images and then followed by the 2D T2*-weighted sequence. Therefore, the clearance of contrast agent should not affect our conclusion that the relation between R2* measured in the brain parenchyma and cerebral venous oxygen saturation can be improved after correction for changes in rCBV as shown in Fig. 3B.
In addition, since a paramagnetic contrast agent was used for the estimation of rCBV, after the injection of contrast, the R2* of blood potentially could be altered, resulting in an inaccurate estimate of rCBV. In our study, this confounding factor is avoided by delaying the first 3D T1-weighted imaging acquisition by at least 3 minutes so that the maximum induced R2* changes of contrast agent is minimized. In addition, a short TE, 8 milliseconds, was used for the 3D T1-weighted sequence. This should further reduce effects of contrast induced R2* changes in the blood.
CONCLUSION
In this study, hypercapnia was used to alter both rCBV and Yv while maintaining a stable Ya throughout each experiment. By doing so, the combined effects of changes in rCBV and ΔYv on the BOLD effect could be isolated. Although no clear relation was apparent in a direct comparison of ΔR2* and ΔYv, a linear relation between ΔR2*/Δλ and Δ(ΔYv)/Δλ was revealed. These data presuppose the ability to measure rCBV changes in individual subjects, as demonstrated amply by the 3D steady-state technique described earlier. The results of this study suggest two important conclusions. First, the overall comparability of the experimental results and theoretical predictions indicates that in addition to CBOS, rCBV is indeed an important physiologic parameter in the interpretation of SI in T2*-weighted images. Second, when attempting to quantitate the BOLD effect, it is essential to take into account changes in rCBV, particularly in the case of conditions such as hypercapnia, where large and variable absolute changes or large relative changes in blood volume concurrent with CBOS changes are expected. Although absolute estimates of CBOS using MR imaging are the ultimate goal and are an actively pursued area, only limited success has been reported. To a large degree, this results from the fact that the effects of rCBV alteration, as demonstrated in our study, and R2', as shown in Eq. 2, are likely to influence MR signal in the images. The accuracy of the measurements of these parameters are both technically challenging and beyond the scope of this report. For these and several other reasons, quantitative measurements of CBOS are not available. Nevertheless, in our study, we have demonstrated by measuring changes in both rCBV and R2* with MR imaging under conditions that preserve a high, constant Ya, noninvasive measurement of changes in Yv on a regional basis may be achievable. This information could be of use in the study of cerebral oxygen metabolism under a variety of physiologic or pathophysiologic conditions.
Footnotes
Acknowledgment
The authors thank Dr. E. Mark Haacke, Washington University, St. Louis, Missouri, for his valuable suggestions and review of this manuscript.