
Abstract
When a cerebral infarction occurs, surrounding the core of dying tissue there usually is an ischemic penumbra of nonfunctional but still viable tissue. One current but controversial hypothesis is that this penumbra tissue often eventually dies because of the metabolic stress imposed by multiple cortical spreading depression (CSD) waves, that is, by ischemic depolarizations. We describe here a computational model of CSD developed to study the implications of this hypothesis. After simulated infarction, the model displays the linear relation between final infarct size and the number of CSD waves traversing the penumbra that has been reported experimentally, although damage with each individual wave progresses nonlinearly with time. It successfully reproduces the experimental dependency of final infarct size on midpenumbra cerebral blood flow and potassium reuptake rates, and predicts a critical penumbra blood flow rate beyond which damage does not occur. The model reproduces the dependency of CSD wave propagation on N-methyl-D-aspartate activation. It also makes testable predictions about the number, velocity, and duration of ischemic CSD waves and predicts a positive correlation between the duration of elevated potassium in the infarct core and the number of CSD waves. These findings support the hypothesis that CSD waves play an important causal role in the death of ischemic penumbra tissue.
Keywords
Understanding the mechanisms underlying tissue damage in the ischemic penumbra is of paramount clinical importance, since it may lead to new therapeutic measures that reduce postinfarct debilitation. Whereas great progress has been made in this area (Iijima et al., 1992; Mies et al., 1993; Choi, 1994; Fisher and Garcia, 1996), the mechanisms by which focal ischemia evolves into infarction and the factors that determine the ultimate extent of the infarct are still unsettled. The prolonged reduction of blood supply in the periinfarct region may gradually lead to progressive tissue damage through numerous pathologic metabolic pathways, yet the relative importance of these factors remains controversial (Pulsinelli, 1992; Hossmann, 1994a,1994b; Ileiss and Graf, 1994). In this report, we develop and study the first computational model of the ischemic penumbra and use it to examine one of the several mechanisms hypothesized to be causally linked to penumbra tissue death: cortical spreading depression (CSD) waves.
Cortical spreading depression is a wave of reduced spontaneous electrical activity and biochemical changes that spreads across the normal cerebral cortex at a rate of about 2 to 5 mm/min. It is characterized by transient reductions in EEG power, failure of neurons to respond to evoked potentials, negative extracellular direct current potential shifts, increased extracellular potassium and glutamate, and increased intracellular calcium (Nedergaard and Hansen, 1993). Similar, repetitive spreading depression waves, called ischemic depolarizations, also have been reported in animal models to originate from the core of an infarct and progress outward across the penumbra (Nedergaard and Astrup, 1986; Mayevsky and Weiss, 1991; Gill et al., 1992; Iijima et al., 1992; Mies et al., 1993; Back et al., 1994; Heiss and Graf, 1994; Hossmann, 1994a).
Several experimental animal models of stroke suggest a significant correlation between the number of CSD waves and the evolving infarct volume (Gill et al., 1992; Iijima et al., 1992; Chen et al., 1993; Mies et al., 1993; Back et al., 1996). However, even in light of recent diffusion mapping studies showing an increase in infarct volume associated with CSD waves, the causative role of CSD waves in the evolution of penumbra damage still remains uncertain (Takano et al., 1996). In this report, we study the CSD hypothesis that CSD waves cause penumbra tissue death in stroke, with the aid of a computational model. Since the involvement of CSD in human stroke remains debatable, our model is best viewed as most directly related to animal models of stroke. After verifying the model's consistency with experimental data, we investigate systematically how various physiologic parameters interact and influence the ultimate amount of tissue damage. The results provide support for the CSD hypothesis, and the model makes testable predictions, meriting further experimental investigation.
METHODS
Models of ionic changes in CSD in normoxic tissue have been developed in the past, but were either one dimensional or had limited metabolic and physiologic scope (Tuckwell and Miura, 1978; Reshodko and Bures, 1975). Recently, a simple two-dimensional model of the potassium changes during CSD waves in normoxic tissue and during migraine aura has been developed (Reggia and Montgomery, 1996). The basic core of the model presented here draws on this recent normoxic CSD modeling study, but it has been further developed and extensively expanded to facilitate detailed investigation of many of the major variables relevant to the study of acute focal stroke. Although there are numerous variables of potential relevance in the ischemic penumbra, we focus on a subset of these and trace their temporal and spatial evolution. Later we summarize the mathematical model, its computational implementation, and experimental methods; a detailed formal description is given in the Appendix.
The model is based on a multidimensional set of nonlinear differential equations that govern key metabolic variables involved in CSD waves (listed in the Appendix). Both the spatial structure of the cerebral cortex and time are discretized. The cortex is represented as a two-dimensional, hexagonally tessellated array of elements, each of which represents a small volume of cortex. One cortical element is 0.125 mm in length, and one time step corresponds to 13 milliseconds. As elaborated later, each cortical element i has its own value for extracellular potassium K i , potassium reuptake R i , metabolic stores M i , persistent impairment P i , tissue intactness I i , internal potassium stores Sk i , cerebral blood flow F i , extracellular glutamate G i , intracellular glutamate Sg i , extracellular calcium Ca i , intracellular calcium Sc i , and calcium reuptake, Rc i . All variables incorporated into the model are dimensionless and are calculated and presented on a scaled basis from 0 to 1, since quantitative data on the rates of change for many of the variables in the model are unavailable. Numerous other variables and factors are relevant to understanding the ischemic penumbra(e.g., reactive oxygen species, lactic acidosis, mean neuronal firing rates). Some of these factors are being added to our model, but they are not considered in the current report, which focuses solely on the most fundamental aspects of ischemic CSD waves.
The extracellular potassium concentration K i , is modeled as a reaction-diffusion process consisting of a diffusion term reflecting the passive movement of potassium ions along their spatial concentration gradient; a reaction term modeling processes that generate the sharp rise of extracellular potassium; a reuptake term representing the reuptake of extracellular potassium by neuronal and glial Na/K-ATPase pumps, and an infusion term reflecting an external source of potassium infusion (in experiments simulating CSD wave generation in normoxic tissue). The rate of potassium reuptake R i , is determined by two terms reflecting the functioning of Na/K pumps: a rateincreasing term proportional to the levels of extracellular potassium, tissue intactness, metabolic stores levels, and partial impairment; and a decay term that gradually brings Na/K-ATPase pump activity back to its resting level when K i values are restored.
The levels of different metabolic factors that are important in defining the tissue energy state (e.g., glucose and high-energy phosphates) are combined into a single variable,M i , the metabolic stores level. Their supply is proportional to the blood flow rate (presumed to be normoglycemic and well oxygenated) and tissue intactness, and their consumption is governed by the basal metabolic rate and reuptake demands. Cerebral blood flow (F i ) to a given cortical unit is modulated by that unit's metabolic stores. The magnitude of resting F i varies linearly along the penumbra; cortical areas located closer to the infarct core have lower resting blood flow levels and a more subdued hemodynamic response. Tissue intactness (I i ) denotes the fraction of cellular components in a volume element that remains viable. Tissue damage occurs in a cumulative fashion when the energy stores of a cortical element fall below a threshold value, and the extent of the damage is proportional to the extent and duration of the energy shortage. A minimal value of tissue intactness is required to release sufficient potassium to induce local depolarization and subsequent propagation of CSD waves (Hull and Harreveld, 1964). The tissue sensitivity to damage is modulated by the energy stress that the tissue undergoes, reflecting a growing susceptibility to damage of metabolically compromised tissue. This increased susceptibility to damage, for which there is experimental support (Hossmann, 1994a; Iijima et al., 1992), is incorporated into the variable P i , termed the partial impairment. The rate of potassium effusion into the extracellular compartment when infarction occurs is determined by the level of intracellular potassium stores, Sk i . Changes in the level of extracellular glutamate, G i , are modeled by incorporating the flux pathways that are known to exist and are relevant to CSD. These include Na/glutamate carriers, amino acid carriers, vesicular release of glutamate, and release resulting from impaired metabolic status. The changes in intracellular glutamate, Sg i , are opposite those of the extracellular changes. Extracellular calcium levels, Ca i , are incorporated, and the movement of calcium ions is allowed to occur via voltage gated calcium channels, ligand gated channels (e.g., N-methyl-D-aspartate[NMDA]), the activity of the Ca-ATPase, the Na/Ca exchanger, and leakage from metabolic impairment. The changes in intracellular calcium, Sc i , are the opposite of the changes that occur in the extracellular levels. Finally, the Ca-ATPase pump, Rc i , is incorporated into the model, analogous to that for Na/K-ATPase.
This formal model described here and in detail in the Appendix has been implemented as a C program that runs under Unix (Digital Unix V4.0). An Euler numerical integration method is used, and key results have been verified using a fourth order Runge-Kutta method. Two kinds of numerical experiments were performed: normoxic and ischemic simulations of CSD waves. In the normoxic case, CSD waves were generated by simulating infusion of potassium (by setting K inf to a positive value; see Appendix) into the center of the model cortical region. In the ischemic case, the blood flow to the initial lesion core at the center of the model cortex was clamped to zero and a penumbra gradient of cerebral blood flow was simulated. Cerebral blood flow was linearly graded from zero at the cortical element immediately adjacent to the lesion core, to the normal “resting value” of 0.5 at the outermost elements of the penumbra. Values of the model variables are typically recorded at three distinct sites on the simulated cortex: the center of the lesion, 2.125 mm away from the center of the initial lesion core (halfway across the penumbra), and in an intact region, 5 mm from the center of the initial lesion core (or the center of the K+ stimulus in the normoxic simulations). The software required to run the simulations described in this report and a demonstration can be accessed through our web site at http://www.cs.umd.edu/~reggia/neural.html.
RESULTS
The Normoxic Case
The normoxic simulation produces CSD waves similar to those that have been reported to occur under conditions of normal cerebral blood flow in the cortex of a variety of experimental animals. The model equations and parameter values were selected by an extensive empirical trial-and-error search process so that the model successfully reproduces the fundamental properties of normoxic CSD waves, their velocity and duration, and the accompanying negligible damage.
In the normoxic CSD simulations, a sufficient amount of K+ was repeatedly infused into an area of 5.17 mm2 (equivalent to the initial lesion core area in the ischemic simulations that are given later) in the center of the simulated cortex, so that one CSD wave is generated and traverses the simulated cortex per infusion. The infusion regimen consists of 2-minute K+ pulses, repeated every 15 minutes. The values of the parameters and initial conditions used for the normoxic simulation can be found in Table 1 in the Appendix. The CSD waves in the simulation traversed the cortex at a velocity of approximately 3.9 mm/min, consistent with literature reports of a normoxic CSD wave velocity of 2 to 5 mm/min (Hansen et al., 1980; Nedergaard and Hansen, 1993). The duration of the normoxic CSD waves (approximately 80 seconds) also is consistent with literature reports (Nedergaard and Hansen, 1993; Sugaya et al., 1975). No infarction was detected as a result of the CSD waves generated during 3 hours of intermittent infusion of potassium (data not shown).
Reference parameter values used in the simulations
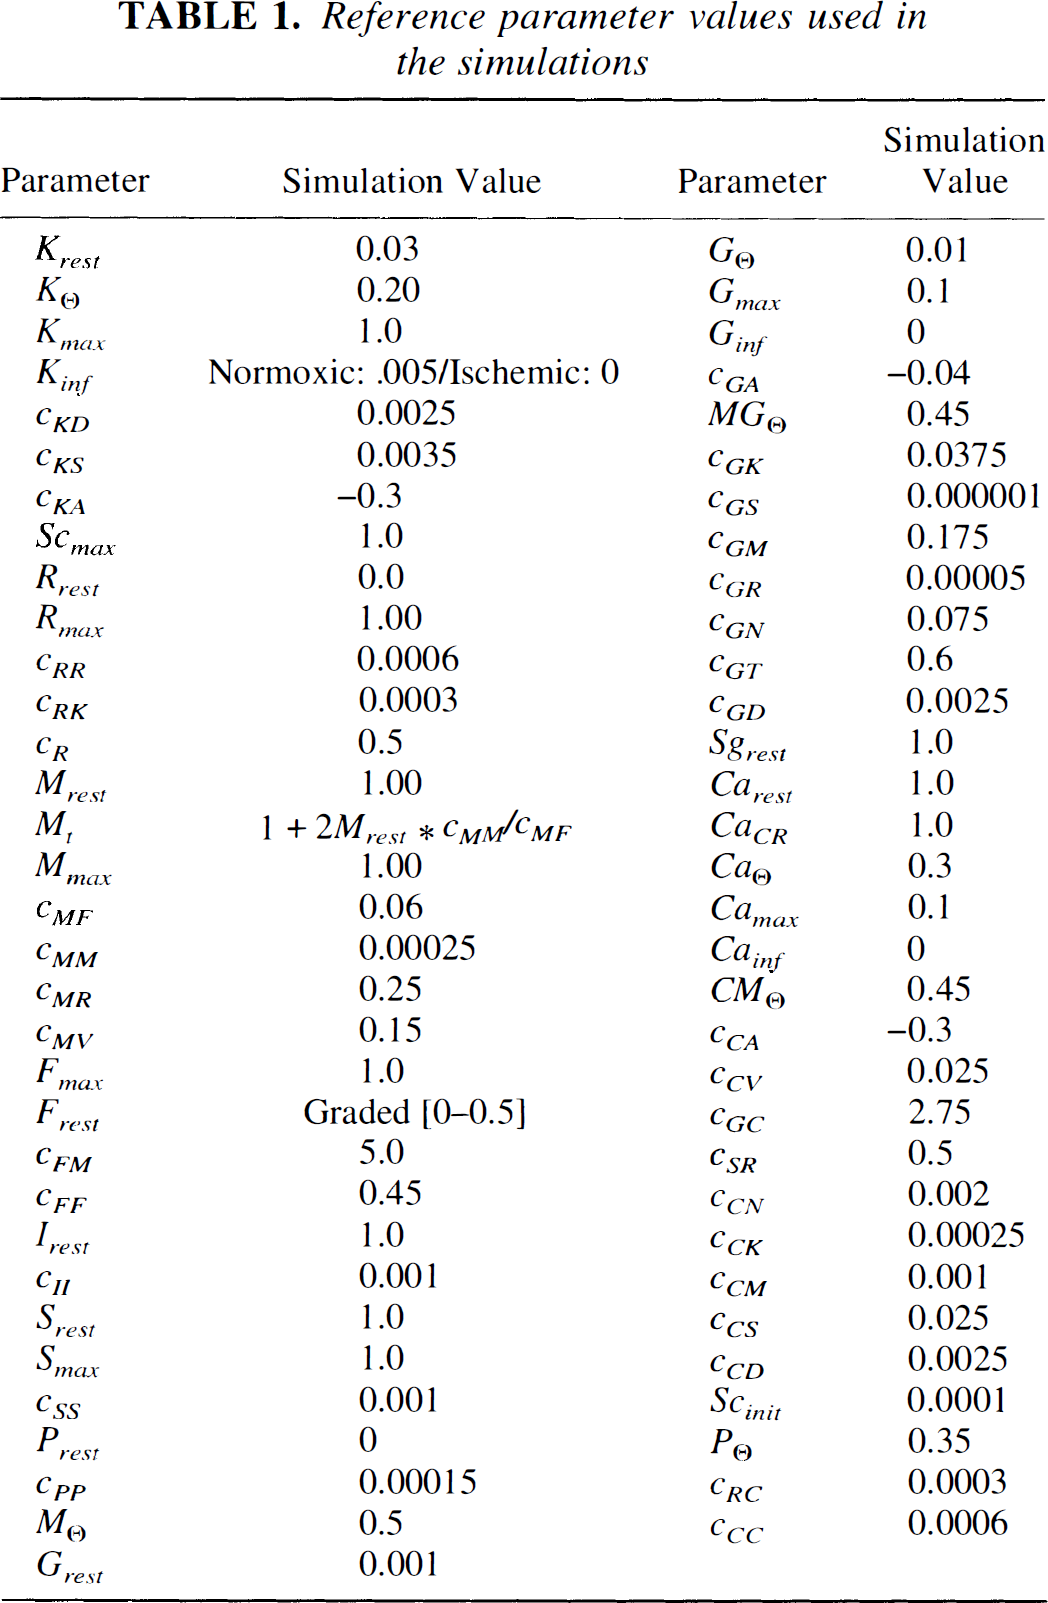
Fig. 1A presents the temporal behavior of the model variables during the passage of five normoxic CSD waves, as measured by a simulated electrode located 5 mm from the center of potassium infusion. Initially, the extracellular potassium levels are set to the normal resting level of 0.03 (corresponding to 3 mmol/L). The external infusion of potassium elevates extracellular potassium above the autocatalytic threshold value (KΘ). During CSD waves, the potassium levels increase rapidly to more than 20 times their resting levels, and the potassium reuptake rate R increases in response to rising extracellular potassium. As the reuptake mechanism returns the extracellular potassium levels back to basal levels, there is an initial undershoot of extracellular potassium followed by a slow return to resting levels. In the model, the length of time that extracellular potassium remains below resting levels determines the absolute refractory period during which subsequent CSD waves cannot be generated (approximately 3 to 4 minutes in the model). The behavior of the reuptake variable displays a profile that has been reported for metabolic, energy-driven cellular processes (Hansen and Mutch, 1984). We equate the reuptake rate variable with the activity of the membrane bound Na/K-ATPase (of neuronal or glial origin).
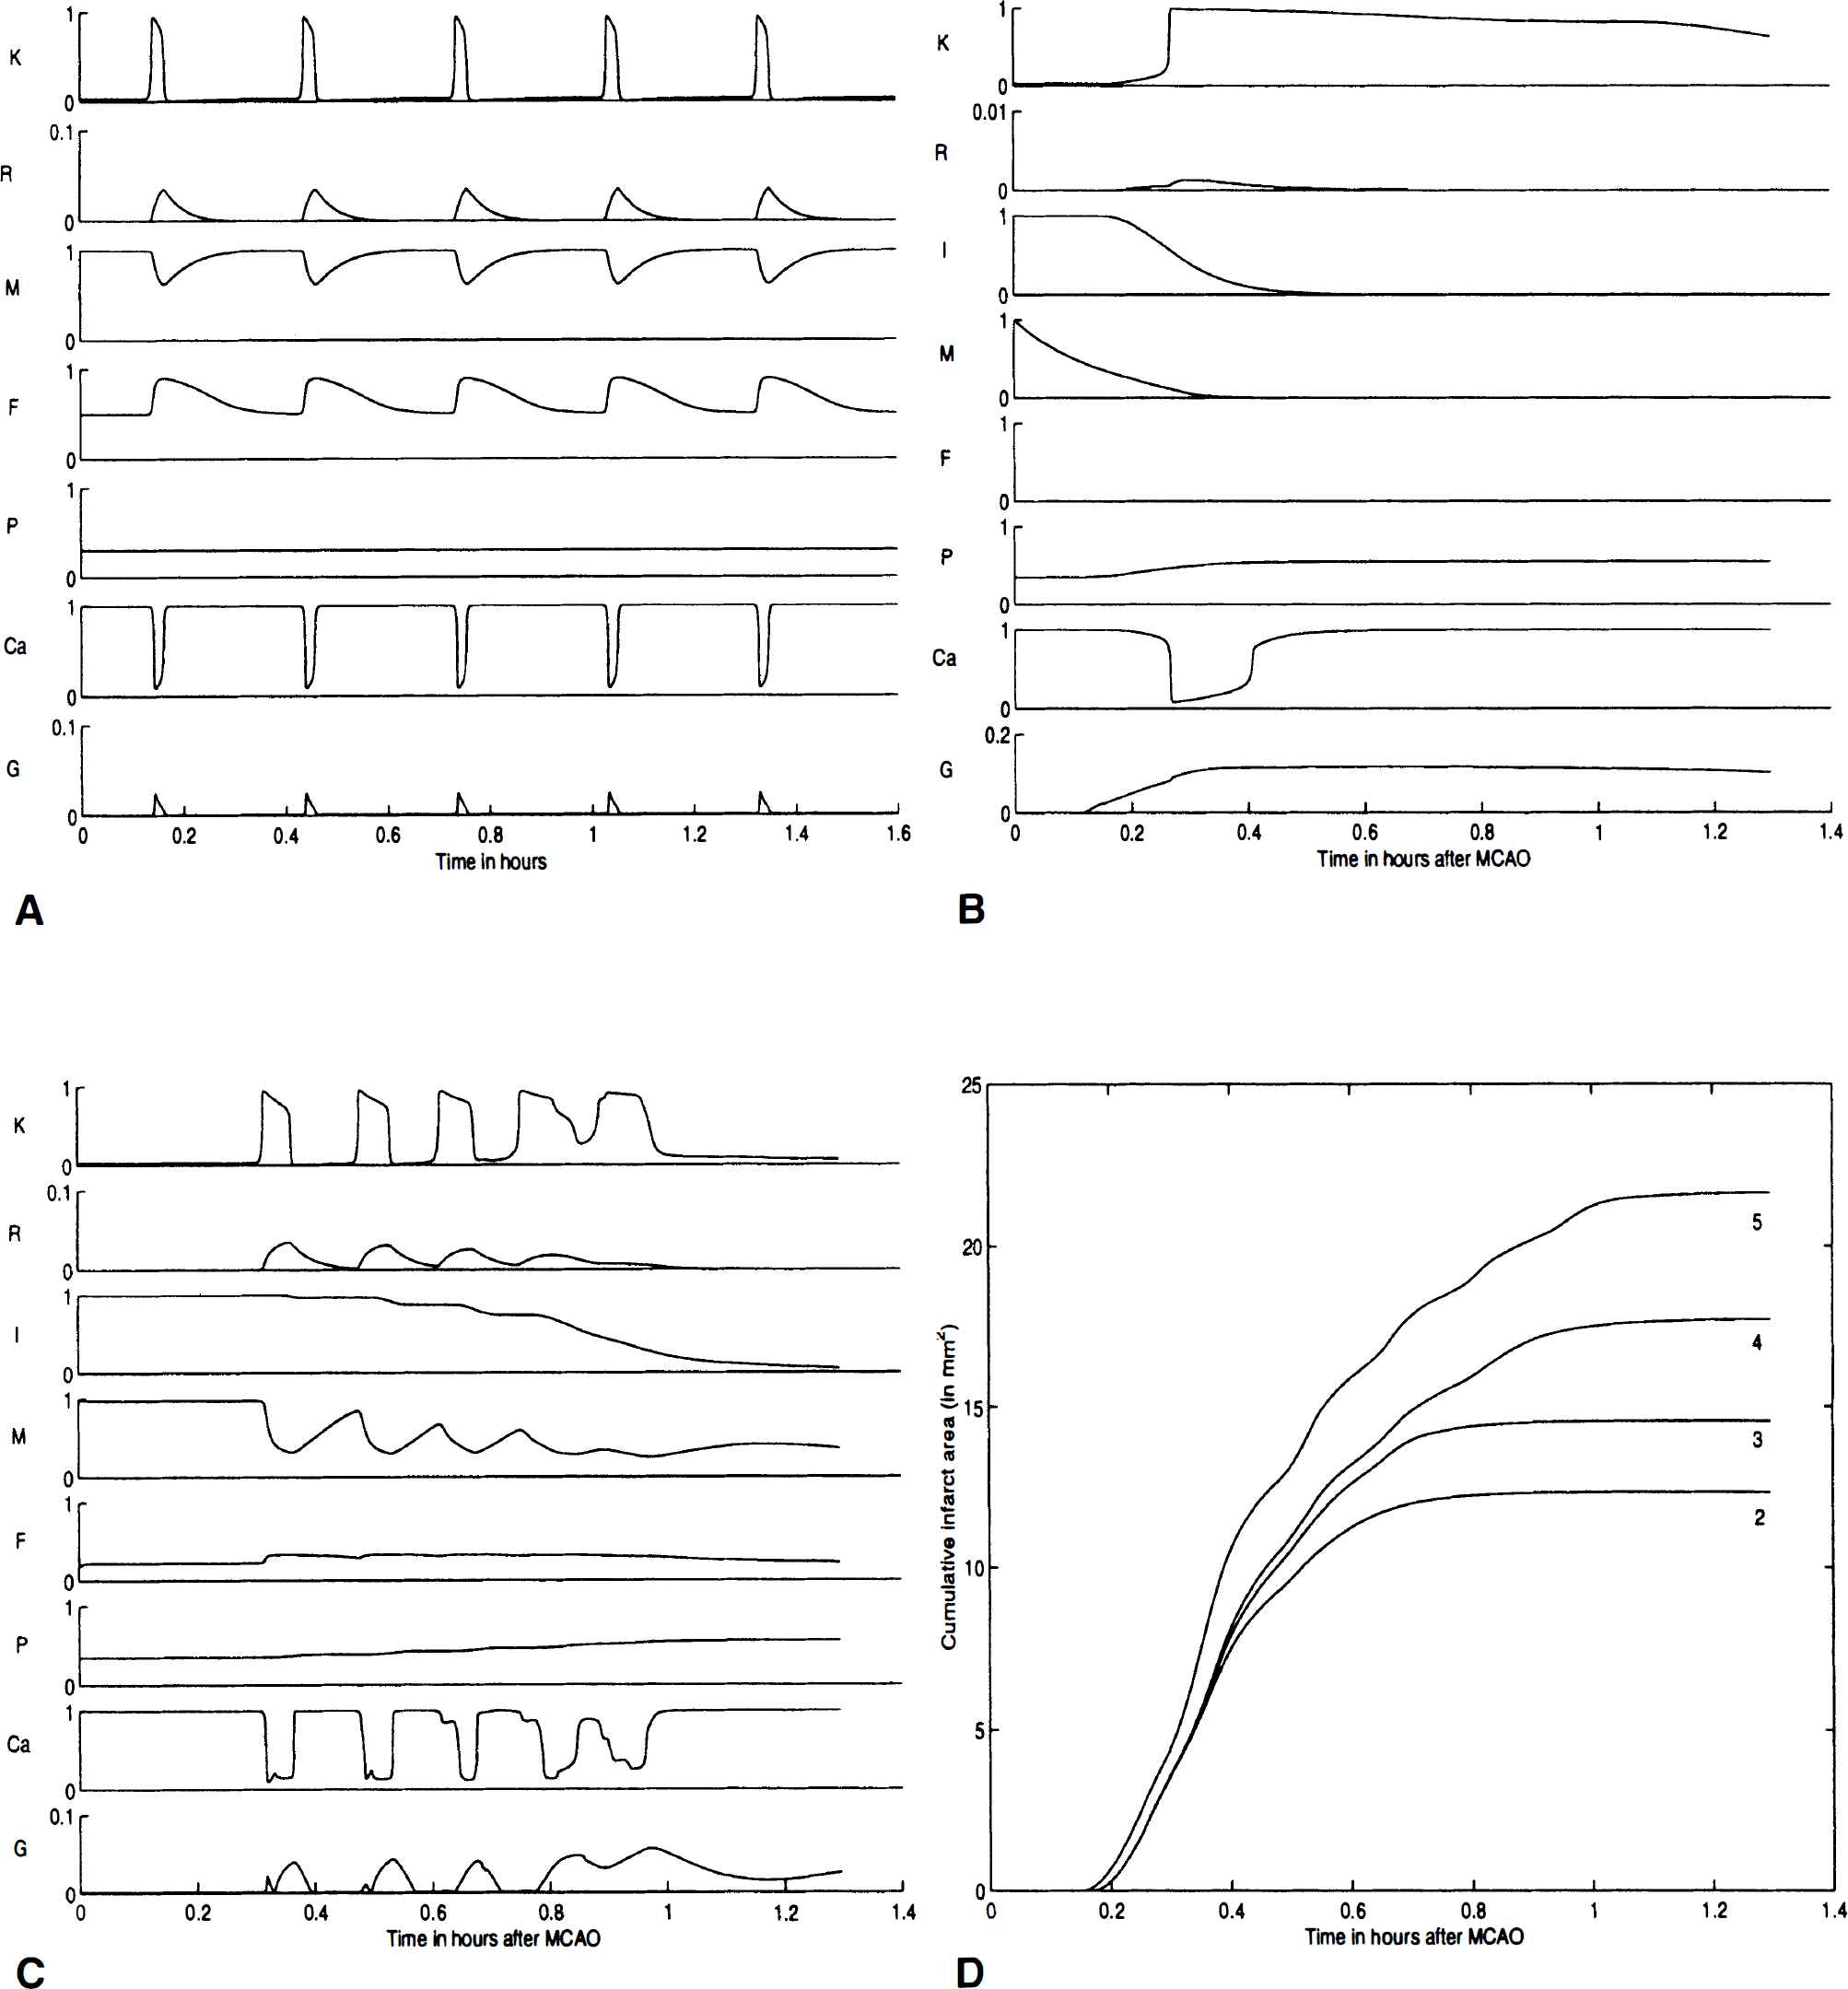
Increased reuptake rate in response to high extracellular potassium levels and the increases in the Ca-ATPase activity reduce metabolic energy stores (i.e., ATP) by about 40% for all cortical elements invaded by the CSD wave (M in Fig. 1A), consistent with literature reports (Mies and Paschen, 1984; Gault et al., 1994). As the tissue repolarizes, the metabolic energy stores return to near-basal levels within 5 minutes. There are numerous reports of the coupling between metabolic stores and cerebral blood flow under normoxic conditions (Mies and Paschen, 1984; Pulsinelli, 1992; Nedergaard and Hansen, 1993), which also is captured in the model where the restoration of metabolic stores M occurs concurrently with an increase in cerebral blood flow (F in Fig. 1A). As occurs biologically, cerebral blood flow increases significantly in response to increased energy demands (up to 90%) and returns to basal levels shortly after the restoration of metabolic stores (Hansen et al., 1980; Mies and Paschen, 1984; Back et al., 1994; Zhang et al., 1994). Extracellular glutamate levels in the model increase approximately 20-fold as extracellular potassium rises (Wahl et al., 1994). Extracellular calcium drops to approximately 10% of control, and intracellular calcium levels inversely mirror the changes in extracellular levels (Lauritzen, 1994). These changes in glutamate and calcium are transient, and total ionic homeostasis is achieved in the model within approximately 5 minutes after the passage of the CSD wave.
The Ischemic Case
To simulate focal ischemia within the model, cerebral blood flow is clamped to zero within an area designated as the initial lesion core and a cerebral blood flow gradient is established, which defines the penumbra that surrounds the lesion. The parameters for the ischemic simulations are identical to those used in the normoxic model (except for the creation of a penumbra). Fig. 1B presents a recording from the central cortical element within the ischemic core as blood flow F suddenly goes to zero at time zero. As the metabolic stores M drop below a threshold because of basal metabolic consumption, tissue intactness subsequently falls as infarction occurs (this occurs fairly rapidly in the case illustrated here; more gradual or delayed infarction can be modeled by parameter variations). As intactness drops, extracellular potassium and glutamate levels rise, caused by the release from the internal stores of the affected cortical elements. Potassium reuptake and calcium extrusion, which require metabolic energy, are negligible in the infarct core because of the reduced metabolic energy stores. Glutamate is released by both energy reduction and the drop in tissue intactness and increases more than 100-fold, consistent with literature reports (Wahl et al., 1994). Extracellular calcium drops and remains depressed until cellular lysis occurs, which rapidly releases Ca2+ back into the extracellular space. Since the recording electrode is in the center of the initial infarct core, it is surrounded by numerous cortical elements, all of which are simultaneously dying and releasing cellular ions and neurotransmitters. Since potassium reuptake is no longer operational and we assume negligible potassium clearance in the absence of blood flow, diffusion becomes the primary mechanism whereby extracellular potassium is cleared from the infarct core.
The concentration gradient of potassium is, however, essentially zero within the infarct core, so potassium is only slowly cleared from the center of the infarct core. Fig. 1C presents the output of the same simulation recorded near the midpenumbra (approximately 2 mm from the center of the initial lesion). During this specific simulation, five CSD waves were recorded at a more distant electrode located in the surrounding, normally perfused cortex. However, as seen in Fig. 1C, at this location the fourth and fifth waves partially coalesced. (Notice that even after CSD waves stop at one penumbral location, such as that in Fig. 1C, they may continue to be generated from the rim of the expanding infarct in more peripheral regions.) The penumbra CSD waves exhibit the same basic profile found in normoxic simulations, with elevated extracellular potassium and glutamate and decreased extracellular calcium. The velocity of the CSD waves remains similar to that found in the normoxic simulations, although there was a trend toward a decrease (from 4.8 to 4.3 mm/min). Their duration exhibited a 13% increase (from 2.0 to 2.3 minutes) between the first and last wave measured at the same location, consistent with experimental literature reports (Hansen and Mutch, 1984; Nedergaard and Astrup, 1986; Nedergaard and Hansen, 1993; Back et al., 1995). The increase in CSD wave duration in the model results from an increase in the partial impairment term, which decreases the reuptake rate and the rate of metabolic stores production. Since these variables are required for the restoration of ionic homeostasis, any reduction in their magnitude will prolong CSD wave duration. Cerebral blood flow (F) rises by 55% during the first wave in response to a 62% decrease in M. With each passing wave, the drop in M increased and the rate of recovery between CSD waves decreased, without a proportional increase in F. Intracellular calcium levels increased dramatically, consistent with literature reports (Lauritzen, 1994; Marrannes et al., 1988; Hossmann, 1994b). When intactness approaches zero, calcium returns to the extracellular space as membrane integrity is lost. Since the model does not represent dynamically varying extracellular and intracellular volume changes, nor intracellular calcium buffering, the rate of release of intracellular calcium is faster and the levels of extracellular calcium are higher than would be expected. Glutamate levels rise in synchrony with the CSD waves as in the normoxic case, but in a biphasic manner. The initial increase is by vesicular release, which is smaller in magnitude than that observed in the normoxic case. This could be accounted for based on the requirement for ATP in the vesicular release process. The second part of the response is mediated by metabolic release of glutamate (see the glutamate levels for the first and second wave in Fig. 1C). When infarction occurred (I decrease), additional glutamate is released as cellular membranes are destroyed. As cell intactness decreases, the extracellular potassium is cleared more and more by simple diffusion alone. As the infarct progresses into the penumbra, a steep extracellular potassium gradient results, which clears the potassium away from damaged cortical elements more quickly than in the center of the infarct core.
Effects of Model Variations
Fig. 1D plots the infarct area over time (since the model is two dimensional, we refer to infarct area instead of infarct volume) as it evolves during four simulations with a variable number of CSD waves. These results capture some important relations described in the literature. It has been reported that there is a strong linear correlation between the number of CSD waves and the size of the final infarct (Mies et al., 1993). However, using diffusion weighted imaging to map out damage as it occurs over time, it was recently shown that the infarct volume progresses in a less than linear fashion (Reith et al., 1995; Takano et al., 1996). Our model captures both the linear relation between the number of waves and the final infarct area (across experiments, r = 0.978), as well as the nonlinear relation between the number of waves and the amount of evolving damage (damage over time as seen in Fig. 1D). The pattern of infarct progression, which is coupled to the passage of CSD waves, is consistent with several recent reports supporting the hypothesis that CSD waves increase the infarct volume resulting from ischemic stroke (Mies et al., 1993; Back et al., 1996; Takano et al., 1996).
We also investigated the effects of penumbra and initial lesion sizes on the number of CSD waves generated and the size of the final infarct. Holding the total area of ischemia (initial lesion core plus penumbra) constant, the relation between initial lesion core area and final infarct area is roughly linear and highly correlated (r = 0.994). The number of CSD waves was reduced with an increase in the size of the initial core lesion from a maximum of four to a minimum of two CSD waves. The final infarct size was linearly proportional to the width of the penumbra, holding the initial lesion core area fixed (r = 0.997). In a separate experiment, the initial lesion core size was fixed and the surrounding penumbra was varied in its radius. As the penumbra size (radius) increased, the number of CSD waves increased from a minimum of two to a maximum of seven CSD waves. In the preceding two experiments, and for all others reported in this article, the final infarct area progressed to a location within the penumbra with a similar “critical” cerebral blood flow value of about 35% of control values. This is a testable prediction of the model under conditions with essentially linear blood flow gradients in the penumbra.
There was a trend toward an increase in CSD wave velocity (up to 6%) at the distal edge of the penumbra, compared with CSD waves measurements near midpenumbra, and a decrease in the duration(up to 13% at the distal edge compared with near midpenumbra) of CSD waves as they moved across the penumbra. These results are consistent with the hypothesis that CSD wave propagation is directly influenced by the metabolic status of the tissue through which it propagates. Since cerebral blood flow, metabolic stores, and hemodynamic responses are graded across the penumbra, the more distal from the core center the recording site is, the larger are the metabolic reserves and the greater is the degree of cerebral blood flow coupling to metabolic demands. When the CSD waves invade the normal tissue surrounding the penumbra, the physical characteristics of the CSD waves approach values found in the normoxic simulations.
The model exhibits an inverse relation between infarct area and midpenumbra cerebral blood flow (r= −0.835). By varying the blood flow gradient linearly and taking midpenumbra flow as essentially representing mean penumbra blood flow, the model successfully reproduces experimental results, indicating an inverse relation between the mean cerebral blood flow and final infarct volume (Takagi et al., 1993). Simulations also are consistent with data indicating that there is an inverse relation between final infarct area and activity of Na/K-ATPase, represented by the value c RK in the model (Williams et al., 1994). Interestingly, the total expenditure of metabolic energy is reduced when c RK is increased because of the reduction in the duration and the number of CSD waves. Thus, surprisingly, enhancing Na/K-ATPase activity may reduce metabolic load and tissue damage in the penumbra, suggesting a possible therapeutic avenue for future studies. Finally, the model captures the effects of administering NMDA channel blockers. This is done by having the threshold for the rise in potassium,KΘ, increase in the presence of channel blockers in proportion to the amounts of blocker infused and to local blood flow F i (i.e., more blocker reaches well-perfused areas). This is in accordance with the findings of Marrannes and coworkers (1988), which show that NMDA antagonists cause an increase in the threshold for CSD elicitation, that is, an attenuation of the positive feedback mechanism involved in CSD generation. As KΘ rises, CSD propagation is blocked and CSD wave amplitude is substantially attenuated in the penumbra, with incipient CSD waves quickly dying out when they occur (Marrannes et al., 1988). Both CSD initiation and anoxic depolarization onset time are maintained at their baseline values, since the metabolic status of the core is not greatly affected.
DISCUSSION
This article presents the first computational model examining the hypothesized role of CSD waves in ischemic stroke. Our results show that the basic formulation developed previously for the computational study of normoxic CSD waves can be extended in a natural, straight-forward manner to study ischemic CSD. Our model generates CSD waves that have similar characteristics to those observed experimentally, regarding their form, velocity, and duration (Mies et al., 1991). As shown, our model can successfully reproduce the general form and properties of CSD waves in the ischemic penumbra, and the typical profiles of blood flow response and increasing metabolic shortage observed in animal models of ischemic CSD.
The model has been used to conduct several simulation experiments that examine the plausibility of the hypothesis that CSD waves increase infarct volume. In summary, they are as follows:
The model displays the strong linear correlation found between the number of CSD waves traversing the penumbra and final infarct size. It shows how this overall linear correlation is observed while the damage observed in each individual acute stroke experiment progresses sublinearly over time. The model successfully reproduces the experimental dependency of final infarct size on mean cerebral blood flow and Na/K-ATPase levels (the latter represented by R in the model). Detailed quantitative predictions are generated, describing the effects of the initial infarct size and the extent of the accompanying penumbra on the final infarct size. A critical penumbra blood flow level is identified, beyond which damage does not progress. Several testable predictions characterizing ischemic CSD waves in the penumbra are made. A: The number of CSD waves generated by the model is highly correlated with the duration of elevated potassium in the infarct core. B: The velocity of CSD waves is dependent on the metabolic energy reserves of the tissue; it should increase as the wave spreads along the penumbra, approaching the velocity found in the normoxic case when it reaches the perfused tissue surrounding the penumbra. C: The duration of ischemic CSD waves is contingent on the recording location and should decrease as the wave traverses the penumbra. These predictions could be tested by measurements along multiple sites within the infarct core, the penumbra, and its surroundings. D: The model predicts a critical CBF threshold, beyond which damage is not likely to occur (35% of control).
These findings support the hypothesis that CSD waves play an important causal role in the progression of penumbra tissue damage resulting from acute stroke. Moreover, our results are not critically dependent on a spatially uniform set of values for the parameters and constants employed in the model. Fluctuations up to ±20% of their reference value did not alter qualitatively the physical characteristics (i.e., velocity and duration) of CSD waves observed in our experiments.
The model presented in this report lays the foundations for further computational study of acute focal stroke and the ischemic penumbra. Making first steps in this investigation, we have chosen to focus on a minimal set of variables that could provide meaningful insight as to the role of CSD waves in the penumbra. To develop the model further, additional variables that are known to play a significant role in the penumbra, such as free radicals, free fatty acids, pH, the type and relative distribution of various calcium ionophores(e.g., alphaamino-3-hydroxy-5-methyl-4-isoxazole proprionic acid receptors), could be added. From a broader perspective, an important result of this work is the demonstration that, with recent developments in available computational power, a complex multivariate computational study of acute stroke has become feasible.
Footnotes
Acknowledgements
The authors thank Dr. A. Mayevsky for useful discussions.