
Abstract
In the clinical setting it has been shown that activation will increase cerebral glucose uptake in excess of cerebral oxygen uptake. To study this phenomenon further, this study presents an experimental setup that enables precise determination of the ratio between cerebral uptake of glucose and oxygen in the awake rat. Global CBF was measured by the Kety-Schmidt technique, and the ratio between cerebral uptake rates for oxygen, glucose, and lactate was calculated from cerebral arterial—venous differences. During baseline conditions, rats were kept in a closed box designed to minimize interference. During baseline conditions CBF was 1.08 ± 0.25 mL·g−1·minute−1, and the cerebral oxygen to glucose uptake ratio was 5.5. Activation was induced by opening the sheltering box for 6 minutes. Activation increased CBF to 1.81 mL·g−1·minute−1. During activation cerebral glucose uptake increased disproportionately to cerebral oxygen uptake, and the cerebral oxygen to glucose uptake ratio was 4.2. The accumulated excess glucose uptake during 6 minutes of activation amounted to 2.4 μmol/g. Activation was terminated by closure of the sheltering box. In the postactivation period, the cerebral oxygen to glucose uptake ratio rose to a maximum of 6.4. This response is exactly opposite to the excess cerebral glucose uptake observed during activation.
Cerebral activation increases cerebral glucose uptake out of proportion to cerebral oxygen uptake (Fox et al., 1988; Ribeiro et al., 1993; Fellows et al., 1993; Madsen et al., 1995a; Villringer and Dirnagl, 1995; Frahm et al., 1996). Cerebral oxygen uptake is a precise measure for cerebral oxidative metabolism and it can be calculated that during cerebral activation 10% to 25% of the glucose taken up by the brain fails to be oxidized (Fox et al., 1988; Madsen et al., 1995a). It has been suggested that the glucose that is not oxidized during activation is glycolytically converted to lactate (Fox et al., 1988). Although this notion is widely accepted (Prichard et al., 1991; Sappey-Marinier et al., 1992; Fellows et al., 1993; Villringer and Dirnagl, 1995; Frahm et al., 1996), it has never been verified by direct observations, and the metabolic fate of activation-induced excess glucose uptake remains unknown. Although the experimental setting offers some important advantages, all data addressing activation-induced uncoupling of cerebral oxygen and glucose uptake has been obtained in humans. A main purpose of this study was therefore to establish a technique that enables simultaneous determination of cerebral glucose and oxygen uptake in the awake rat. In a recent study on humans by our group it was shown that cerebral uptake of glucose in excess of cerebral oxygen uptake persists after cessation of the activation task (Madsen et al., 1995a). In that study cerebral uptake rates were monitored for 40 minutes after activation, at which time excess glucose uptake was still manifest. Knowledge regarding excess glucose uptake in the postactivation period is thus incomplete. A second major purpose of this study was therefore to achieve a detailed description of the ratio of cerebral glucose and oxygen uptake in the postactivation period.
METHODS
Animals and surgical procedures
Normal male Sprague Dawley rats (Møllegaarden, Lille Skensved, Denmark) weighing 336 to 550 g were maintained on an alternate 12-hour light/dark cycle with humidity controlled at normal levels. Access to water and food was unlimited. All procedures performed on animals were in strict accordance with the National Institutes of Health Guide for Care and Use of Laboratory Animals and were approved by The Danish Animal Experiment Expectorate.
To accustom the animal to the experimental setting, they spent a minimum of 1 day in their cages in the laboratory setting. To stabilize arterial glucose levels during activation, rats were fasted for approximately 20 hours before the experiment. Access to water was unrestricted. On the experimental day the animal was anesthetized with halothane (4% for induction and 1.5% for maintenance) in 70% N2O/30% O2, and polyethylene catheters (length 18 cm, PE 50, Portex, Hythe, Kent, U.K.) filled with physiologic saline with 20 units of sodium heparin per milliliter were inserted in both femoral arteries and femoral veins. The surgical incisions were closed and infiltrated with lidocaine/prilocaine (EMLA creme, Astra, Södertälje, Sweden). Cerebral venous blood was obtained through a catheter that was inserted into the confluence of sinuses through a screw placed just posterior to the lambdoid suture. The cerebral venous catheter was identical to the catheters inserted in the femoral vessels. A plaster cast was applied around the lower torso for restraint, and an average of 3 hours 28 minutes (range 3 hours 4 minutes to 4 hours 31 minutes) was allowed before initiating experimental procedures. In the recovery period, the rat was kept in a shelter specially designed to minimize external stimulation. The shelter was a closed triangular box with apertures permitting passage of blood sample catheters. In the shelter, the rat was monitored by closed circuit video surveillance, and air change was assured by a small ventilator. Rectal temperature was monitored with a rectal probe, and MABP was continuously measured with a pressure transducer connected to one of the arterial catheters.
Experimental protocols
Measurements were performed during three different conditions. Blood samples before activation were obtained with the animal remaining in the closed sheltering box. External stimulation was kept at a minimum. Activation was induced by opening of the shelter, exposing the rat to the environment. No further activation procedures were performed. After 6 minutes, the shelter was closed, and blood samples in the postactivation period were obtained exactly as before activation.
Cerebral arterial—venous differences for oxygen, glucose, lactate and β-hydroxybutyrate. Blood for determination of cerebral arterial—venous differences for oxygen [(a−v)
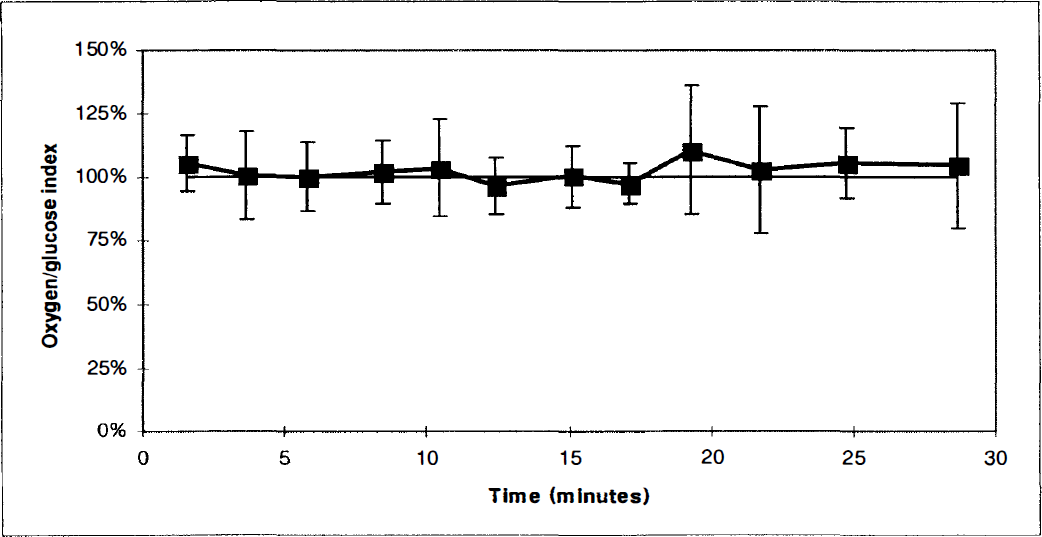
The cerebral oxygen—glucose index (OGI) calculated during 12 consecutive measurements with the experimental animal remaining in the sheltering box. Values represent the mean of determinations in a group of 6 animals. Vertical bars represent SD. The OGI expresses the proportion of cerebral glucose uptake that is oxidized, and is calculated from cerebral arterial—venous differences by OGI = 100 (a−v)
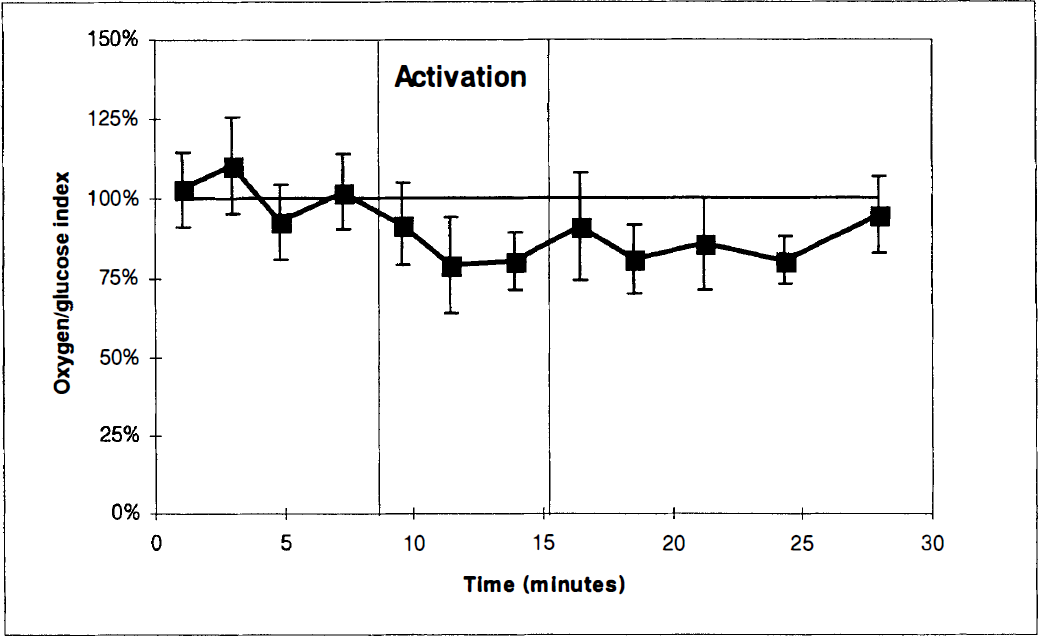
The cerebral oxygen—glucose index before, during, and after activation. The first four paired measurements were obtained with the experimental animal in the sheltering box. After opening of the box (first vertical bar), three paired blood samples were obtained. After 6 minutes of activation the box was closed (second vertical bar), and five paired blood samples were obtained with the animal in the sheltering box. Values represent the mean of determinations in a group of 6 animals. Vertical bars represent SD.
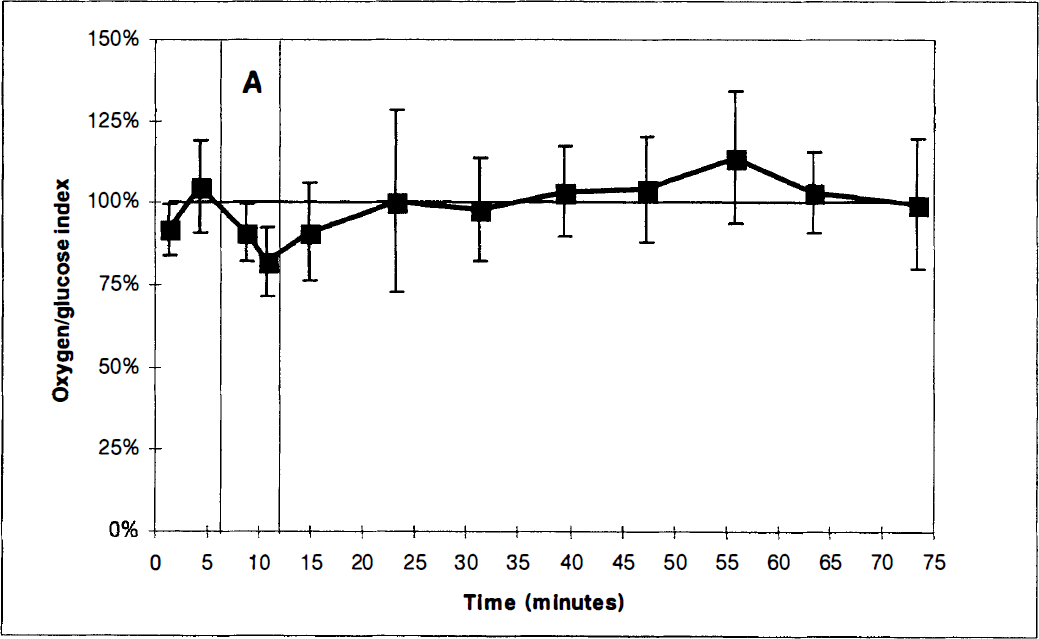
The cerebral oxygen-glucose index before, during, and after activation. In this study series, measurements in the postactivation period were performed for 60 minutes. The first two paired measurements were obtained with the experimental animal in the sheltering box. After opening of the box (first vertical bar), two paired blood samples were obtained. After 6 minutes of activation the box was closed (second vertical bar), and eight paired blood samples were obtained with the animal in the sheltering box. Values represent the mean of determinations in a group of 6 animals. Vertical bars represent SD.
Determination of global cerebral blood flow. In eight rats global CBF was determined twice, one time during preactivation conditions and one time during activation. Global CBF was measured with a modification of the Kety-Schmidt technique. A detailed description of the procedure will be given elsewhere; in brief the methodological approach can be described as follows. The brain was saturated by intravenous infusion of 133Xe dissolved in saline at a constant rate of approximately 2.5 MBq/minute. After 30 minutes of constant 133Xe infusion, three paired blood samples were obtained from the arterial and cerebral venous catheters. Infusion with 133Xe was terminated, and during the first 9 minutes of tracer desaturation arterial and cerebral venous blood was sampled at a constant rate of 0.50 mL/minute, using a mechanical withdrawal pump (model 55-2226, Harvard Apparatus, South Natick, MA, U.S.A.). After completion of continuous blood sampling, paired blood samples were obtained from the two catheter systems. The concentration of 133Xe in the blood samples was determined in a gamma counter (Packard Auto-Gamma Cobra II, Meridian, CT, U.S.A.), and CBF was calculated using a slightly modified version of the Kety-Schmidt equation:
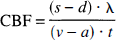
where s and d signify tracer concentration in blood samples obtained before and after the period of continuous blood sampling, and λ denotes the blood to brain partition coefficient for Xe133 in whole rat brain (Gjedde et al., 1975). In the denominator, a and v denote tracer concentrations in arterial (a) and cerebral venous (v) blood obtained during t minutes of desaturation. The period of activation was 6 minutes when (a−v)glc, (a−v)
Calculations
Cerebral (a−v)
Cerebral arteriovenous differences and physiologic variables obtained before, during, and after activation
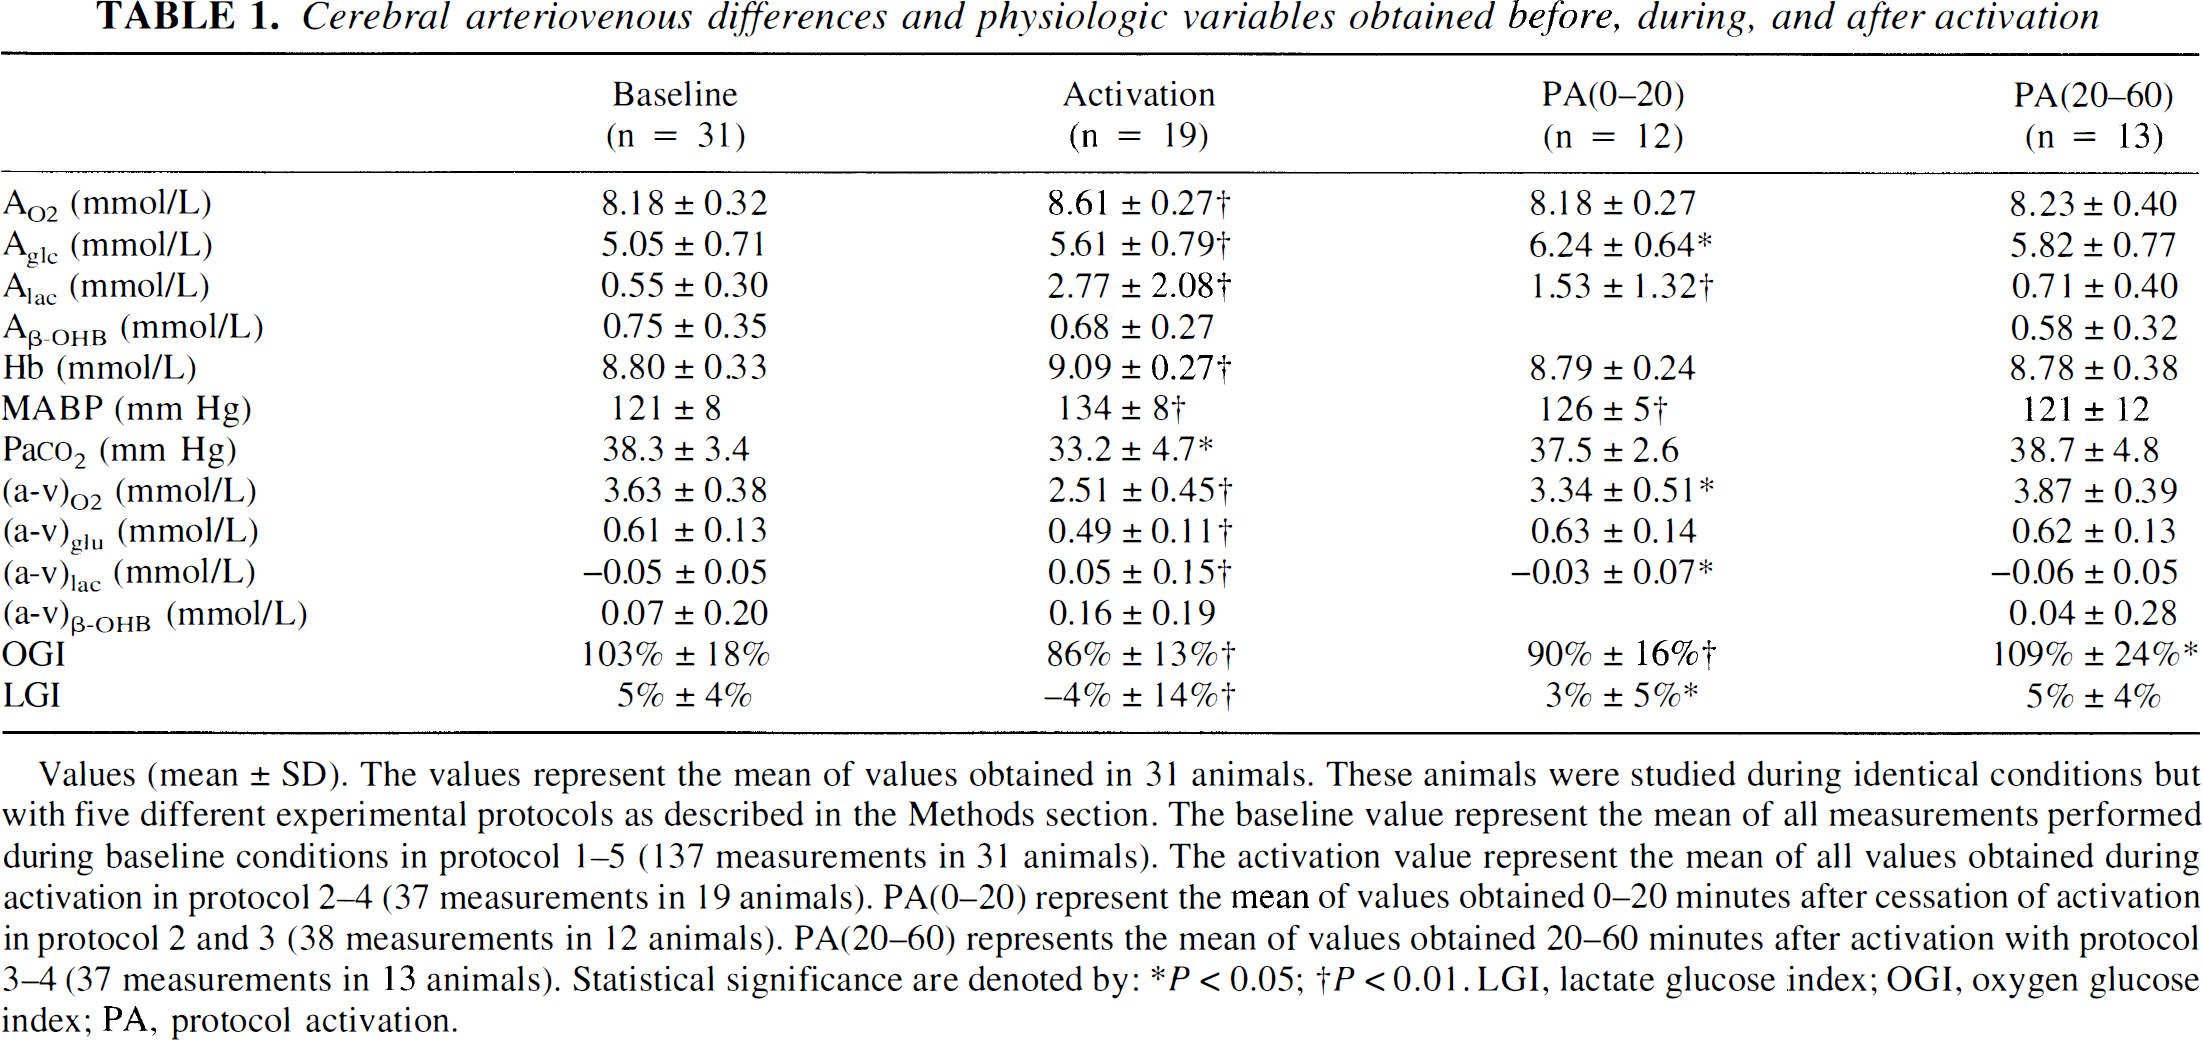
Values (mean ± SD). The values represent the mean of values obtained in 31 animals. These animals were studied during identical conditions but with five different experimental protocols as described in the Methods section. The baseline value represent the mean of all measurements performed during baseline conditions in protocol 1–5 (137 measurements in 31 animals). The activation value represent the mean of all values obtained during activation in protocol 2–4 (37 measurements in 19 animals). PA(0–20) represent the mean of values obtained 0–20 minutes after cessation of activation in protocol 2 and 3 (38 measurements in 12 animals). PA(20–60) represents the mean of values obtained 20–60 minutes after activation with protocol 3–4 (37 measurements in 13 animals). Statistical significance are denoted by:
P < 0.05
P < 0.01.
LGI, lactate glucose index
OGI, oxygen glucose index; PA, protocol activation.
RESULTS
Values obtained before activation
Values for physiologic values determined before activation were all within the normal range (Table 1). Values for cerebral arterial—venous differences are listed in Table 1. Before activation, the mean OGI was 103%± 18%(mean ± SD), and the mean LGI was 5% ± 4%. The cerebral oxygen to glucose ratio as corrected for cerebral uptake of β-OHB was 5.5. In the experimental series in which 12 consecutive blood samples were obtained with the rat remaining in the sheltering box, all measured values remained constant (Figure 1). Before activation, the cerebral blood flow was 1.08 ± 0.25 mL·g−1·minute−1, and the calculated values for CMR
Cerebral blood flow and cerebral uptake rates for oxygen, glucose, lactate, and β-OHB during baseline and activation
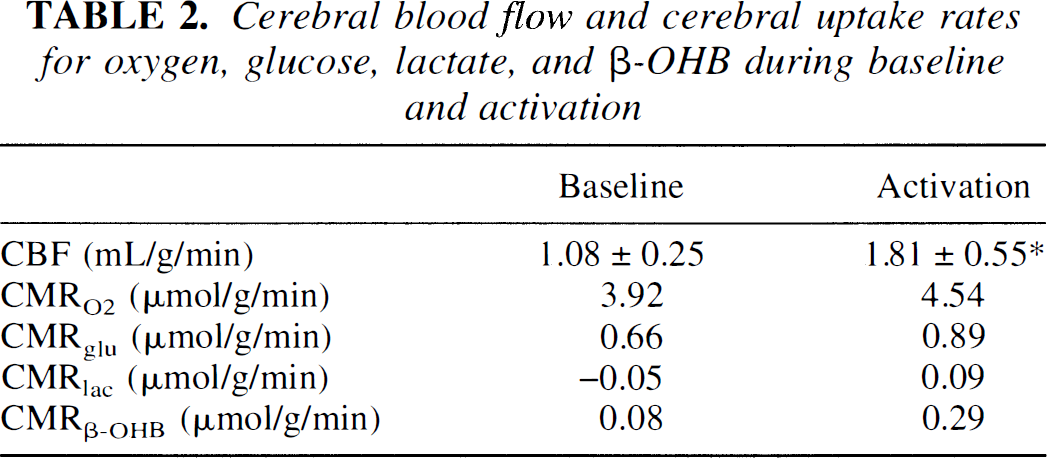
Cerebral blood flow and cerebral uptake rates for oxygen (CMRO2), glucose (CMFglc), lactate (CMRlac), and β-OHB (CMRβ-OHB). Cerebral blood flow values represent values determined in the second part of the study (n = 8), statistical significance are denoted by:
P < 0.05. Cerebral uptake rates was calculated as the product of CBF and the mean values for (a-v)O2, (a-v)glc, (a-v)lac, and (a-v)β-OHB listed in Table 1. As uptake rates were calculated as the product of two mean values, no value for SD are given, and no statistical analysis could be performed.
Values obtained during activation
Activation increased MABP (P < 0.01), Hb (P < 0.01), and the arterial concentrations of glucose (P < 0.05) and lactate (P < 0.01). Pa
Values obtained 0 to 20 minutes after activation
In the early postactivation period values were partially normalized (Table 1). The OGI remained reduced (P < 0.01) (Figure 2). During this period, the arterial glucose concentration reached its maximum, being 1.2 mmol/L higher than before activation (P < 0.01).
Values obtained 20 to 60 minutes after activation
With the exception of the OGI, all values were normalized in the latter part of the postactivation period (Table 1). In the late postactivation phase, changes in the OGI were the opposite of what was observed during activation (Figure 3) and the OGI was 109% ± 24% (P < 0.05). The cerebral oxygen to glucose ratio as corrected for cerebral uptake of β-OHB was 6.0, reaching a maximal value of 6.4 approximately 40 minutes after the sheltering box was closed (Figure 3).
Cerebral (a−v) differences during glucose infusion
Infusion of glucose increased the arterial glucose concentration by 1.26 ± 0.28 mmol/L. The arterial lactate concentration increased slightly (P < 0.05), while Hb was slightly reduced (p < 0.01). No other value measured in the study series was changed by glucose infusion. The cerebral OGI was 103% ± 15% before infusion, and 100% ± 12% during infusion.
DISCUSSION
In the clinical setting cerebral activation will increase cerebral glucose uptake in excess of cerebral oxygen consumption. The data from the present study indicate that this also applies to the experimental setting. In the recovery period after activation we observed cerebral oxidative metabolism in excess of cerebral glucose uptake. This is opposite to what we observed during activation and indicates that at least part of the activation-induced excess glucose is released during recovery.
Baseline
Data from the study series in which 12 consecutive blood samples were obtained with the rat kept in the sheltering box remained stable, indicating that interference from experimental procedures was minimal (Figure 1). The physiologic variables obtained before activation are in close accordance with values obtained elsewhere during nonstressed conditions (Sokoloff et al., 1977; Carlsson et al., 1977; Siesjö, 1978; Ghajar et al., 1982; Keykhah et al., 1985; Dienel et al., 1990; Adachi et al., 1995; Horinaka et al., 1997). We therefore conclude that our rats, before activation, were in a nonactivated behavioral state, and the baseline condition will in the following be defined as the state of the animal when remaining in the closed shelter before activation. Ratios between (a−v)glc, (a−v)
Activation
Opening the sheltering box was associated with arousal. The experimental animal became active and displayed explorative behavior. Arterial glucose and MABP increased whereas Pa
In another study with an almost identical experimental setup, and with similar activation-induced changes in cerebral arterial—venous differences, we have observed an activation-induced 20% reduction in cerebral glycogen content (Madsen et al., 1995b). Adding the glucose carbon originating from a reduction of the cerebral glycogen pool would further increase the activation-induced increase of the cerebral content of glucose intermediary substrates.
Postactivation
Cerebral glucose uptake remained higher than cerebral glucose oxidation for about 20 minutes after activation (Figure 2). Such a persistent excess glucose uptake has also been observed in humans (Madsen et al., 1995a). Approximately 20 minutes after cessation of activation, however, we observed exactly the opposite of what was observed during activation. During this period, the cerebral carbon uptake from glucose and β-OHB was too small to account for oxidation and cerebral lactate efflux. Our data thus indicate that the later postactivation phase is associated with a net flux of glucose carbon from the brain. Taken together our data indicate that part of the activation-induced increase in cerebral glucose uptake is accumulating in the brain during the activation period and subsequently released during the recovery phase.
Comment
The data from the present study does not identify the metabolic pools in which glucose carbon accumulates during activation. According to the lactate hypothesis excess carbon uptake would be converted to lactate. If this was the case the 2.4 μmol/g of glucose accumulating in the brain during activation would be converted to 4.8 μmol/g of lactate. This increase is more than fourfold higher than the lactate increase of approximately 1 μmol/g that was observed during similar conditions in another study by our group (Madsen et al., 1995b). The available data thus imply that conversion to lactate fails to account for activation-induced excess glucose uptake. The maximal increase in the arterial glucose concentration during activation was 1.0 ± 0.6 mmol/L (range 0.45 to 1.39 mmol/L). The cerebral glucose content will increase with the arterial glucose concentration, and excess glucose uptake could be caused by accumulation of unphosphorylated glucose in the brain. To evaluate this possibility we determined cerebral arterial—venous differences during glucose infusion but without activation. Although glucose infusion increased the arterial glucose concentration by 1.26 ± 0.29 mmol/L, the cerebral OGI remained virtually unchanged, and our data indicate that the activation-induced excess glucose uptake is caused by mechanisms other than cerebral accumulation of unphosphorylated glucose.
In our study, activation increased CMR
Footnotes
Abbreviations used
Acknowledgments
The authors thank Mette Fredenslund and Gerda Thomsen for their skillful technical assistance. The authors also thank Peter Kjøbsted.