
Abstract
Few data regarding early developmental changes in cerebral (blood-to-brain) glucose transport (CTXglc) and CMRglc are available for humans. We measured CBF, CTXglc, and CMRglc with positron emission tomography at 4 to 7 days of life in six preterm human infants whose estimated gestational age was 25 to 34 weeks. The Michaelis-Menten constants Kt and Tmax were estimated from CTXglc and the calculated cerebral capillary plasma glucose concentration. Mean CMRglc was 8.8 μmol 100 g−1 min−1. The CMRglc did not correlate with plasma glucose concentration (r = .315, P = .543), whereas CTXglc showed a significant correlation with plasma glucose concentration (r = .836, P = .038). Estimation of the Michaelis-Menten constants from the best fit to the measured data produced values of Kt = 6.0 μmol mL−1 and Tmax = 32.6 μmol 100 g−1 min−1. These values for Kt in the developing human brain are similar to those that have been reported for the mature brain of adolescent and adult humans and adult nonhuman primates, indicating the affinity of the glucose transport protein for
Studies in experimental animals show that mammalian brain goes through a complex series of developmental changes in blood-brain barrier glucose transport (CTXglc) and CMRglc. The blood-brain transport protein GLUT1 can be detected in vascular endothelial cells early in fetal life and continues to increase throughout the postnatal period (Dwyer et al., 1993; Vannucci, 1994; Cornford et al., 1993; Morin et al., 1988; Devaskar et al., 1991). The functional capacity of the blood-brain barrier to transport glucose is lower in fetal than in neonatal brain and continues to increase in the immediate postnatal period (Fuglsang et al., 1986; Dyve et al., 1991; Cremer et al., 1979; Vannucci et al., 1994b; Daniel et al., 1978). The CMRglc follows a similar pattern with low values in fetal animals that steadily increase through adolescence and then decline to adult levels (Gleason et al., 1989; Chugani et al., 1991; Abrams et al., 1984).
Few data regarding CTXglc and CMRglc during early brain development are available for humans. Measurements of CMRglc have been reported in a few newborn term infants, most of whom have had hypoxic—ischemic encephalopathy (Blennow et al., 1995; Suhonen-Polvi et al., 1995; Chugani et al., 1987). No measurements of CMRglc in preterm infants or measurements of CTXglc have been reported.
METHODS
Subjects
Potential subjects were identified by monitoring all admissions to the Neonatal Intensive Care Unit at St. Louis Children's Hospital. Infants were considered eligible for study only when the attending neonatologist considered that the infant's respiratory, circulatory, and metabolic status was stable for transport to the positron emission tomography (PET) scanner. Infants were transported to the PET facility in an Ohio Transport Incubator. The incubator was equipped with (1) a monitor to indicate respiratory rate, cardiac rate, ECG, and body temperature; (2) a pediatric respirator for intubated infants requiring ventilatory support, including tanks of oxygen and compressed air with a blender to provide the desired mixture; (3) an automatic syringe-type pump to deliver continuous, accurate intravenous infusions; and (4) an emergency kit with the necessary equipment for neonatal resuscitation. During transport and scan, the infant was attended by a neonatologist and a neonatal transport nurse. The PET scanning facility is accessible by enclosed bridge from Children's Hospital. Travel time each way is 10 to 20 minutes, depending on elevator availability. When out of the incubator and on the PET table, the infant remained attached to the monitor, intravenous pump, and ventilator if necessary. Temperature was maintained at 36.5°C by placing the infant on a thermal blanket.
Infants were fasted for at least 1 hour before the PET study. No change was made in the infants' oral or intravenous intake to manipulate the plasma glucose concentration for the purposes of this study. In our neonatal intensive care unit, there is no fixed protocol regarding the need for glucose supplementation to treat hypoglycemia, but values below 1.7 μmol mL−1 generally are treated.
Positron emission tomography
Subjects were positioned in a Siemens ECAT 961 EXACT HR PET scanner (Siemens Medical Systems, Inc., Hoffman Estates, IL, U.S.A.) such that the head was in the approximate center of the field of view. Individual attenuation measurements were made with 68Ge−68Ga rotating rod sources. Emission data was acquired in the three-dimensional mode (inter-slice septa retracted). Scatter from outside the field of view was minimized by using a semicylindrical lead cradle (Ollinger et al., 1996).
The CBF was measured with a 40-second emission scan after 0.5 mCi kg−1 of H215O in 0.5 mL of saline was injected manually over 2 to 5 seconds into a peripheral vein. Arterial blood samples of 0.1 to 0.2 mL were drawn into syringes from the umbilical artery catheter. The blood radioactivity and scan data were corrected for physical decay of 15O. The CBF was calculated using an adaptation of the Kety autoradiographic method. We have published details of this method in newborn infants (Altman et al., 1988).
Measurements of CTXglc and CMRglc were performed after slow intravenous injection of 0.1 mCi kg−1 of 1−11C-
Arterial blood gases were measured during the PET study with an IL 1306 pH/Blood Gas Analyzer (Instrumentation Laboratory, Lexington, MA, U.S.A.). Capillary plasma glucose [Glcp] was measured from a heel stick sample after the end of data acquisition. Capillary glucose concentration correlates closely with arterial concentration in fasted subjects (Larsson-Cohn, 1976). Total blood loss, including samples for arterial blood gases, did not exceed 5% of the infant's total blood volume.
All radiopharmaceuticals were produced in the Washington University School of Medicine cyclotron facility (Dence et al., 1993; Welch et al., 1985).
The radiation exposure associated with these PET studies is equivalent to a uniform whole-body exposure of 276 mrem, slightly less than the amount received from natural sources during 1 year in St. Louis. This study protocol was approved before inception by the Human Studies Committee (Institutional Review Board) and the Radioactive Drug Research Committee of Washington University. Informed consent, documented in writing, was obtained from the parent or guardian in all cases.
Data analysis
All images were reconstructed using the PROMIS algorithm with scatter correction using the single-scatter simulation method (Watson et al., 1996; Ollinger, 1996; Kinahan et al., 1989). Mean transaxial resolution is 3.7 mm full width half maximum at the center and 4.6 mm at 10 cm off center. Mean axial resolution is 4.4 mm full width half maximum at the center and 6.4 mm at 10 cm off center (Wienhard et al., 1994).
Regional physiologic data were calculated for a 44 mm wide × 44 mm long × 15.6 mm thick rectangular region centered at a midhemispheric slice encompassing insular cortex, basal ganglia, and adjacent white matter. 1-11C-
Since the parameter estimation was based on time—radioactivity data from whole blood, we calculated the glucose concentration of whole blood [Glcwb] = [Glcp] (1–0.30 · hematocrit) (Dillon, 1965). Hematocrit was calculated from the hemoglobin concentration using a mean corpuscular hemoglobin concentration of 0.31 (Letsky, 1992). Implicit in these calculations is the assumption that there exists rapid equilibration between plasma and intraerythrocytic glucose. This has been demonstrated for human blood (LeFevre et al., 1997; Murphy, 1960).
The parameter estimation results were used to calculate the following biological quantities:


We also performed parameter estimation for the two Michaelis-Menten constants Kt and Tmax; based on the measured CTXglc and the calculated brain capillary plasma glucose concentration (Cc):


Because of the small number of data points, we did not attempt to estimate the diffusion constant Kd, and it was set equal to 0.
RESULTS
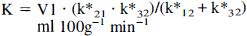
Studies were carried out on six preterm newborn infants (Table 1). All infants had infantile respiratory distress syndrome and were intubated endotracheally shortly after delivery. They all had been cared for in the Neonatal Intensive Care Unit with close attention to maintenance of blood pressure and tissue oxygenation since shortly after birth. None showed evidence of parenchymal brain damage by cranial ultrasound, although one had unilateral subependymal hemorrhage and one had unilateral intraventricular hemorrhage. All infants had indwelling umbilical arterial and intravenous catheters placed for clinical intensive care. All four infants with patent ductus arteriosus had umbilical arterial Po2 greater than 90 mm Hg, indicating that there was no significant right-to-left shunt at the time of the PET study. Therefore, the umbilical arterial blood samples are a valid representation of the arterial input function to the brain (Altman et al., 1988).
Clinical data for six preterm infants
Birth Wt, birth weight; EGA, estimated gestational age; CUS, cranial ultrasound; PROM, prolonged rupture of membranes; CSx, Cesarean section; PDA, patent ductus arteriosus; CHF, congestive heart failure; R, right; L, left; SEH, subependymal hemorrhage; NL, normal; IVH, intraventricular hemorrhage.
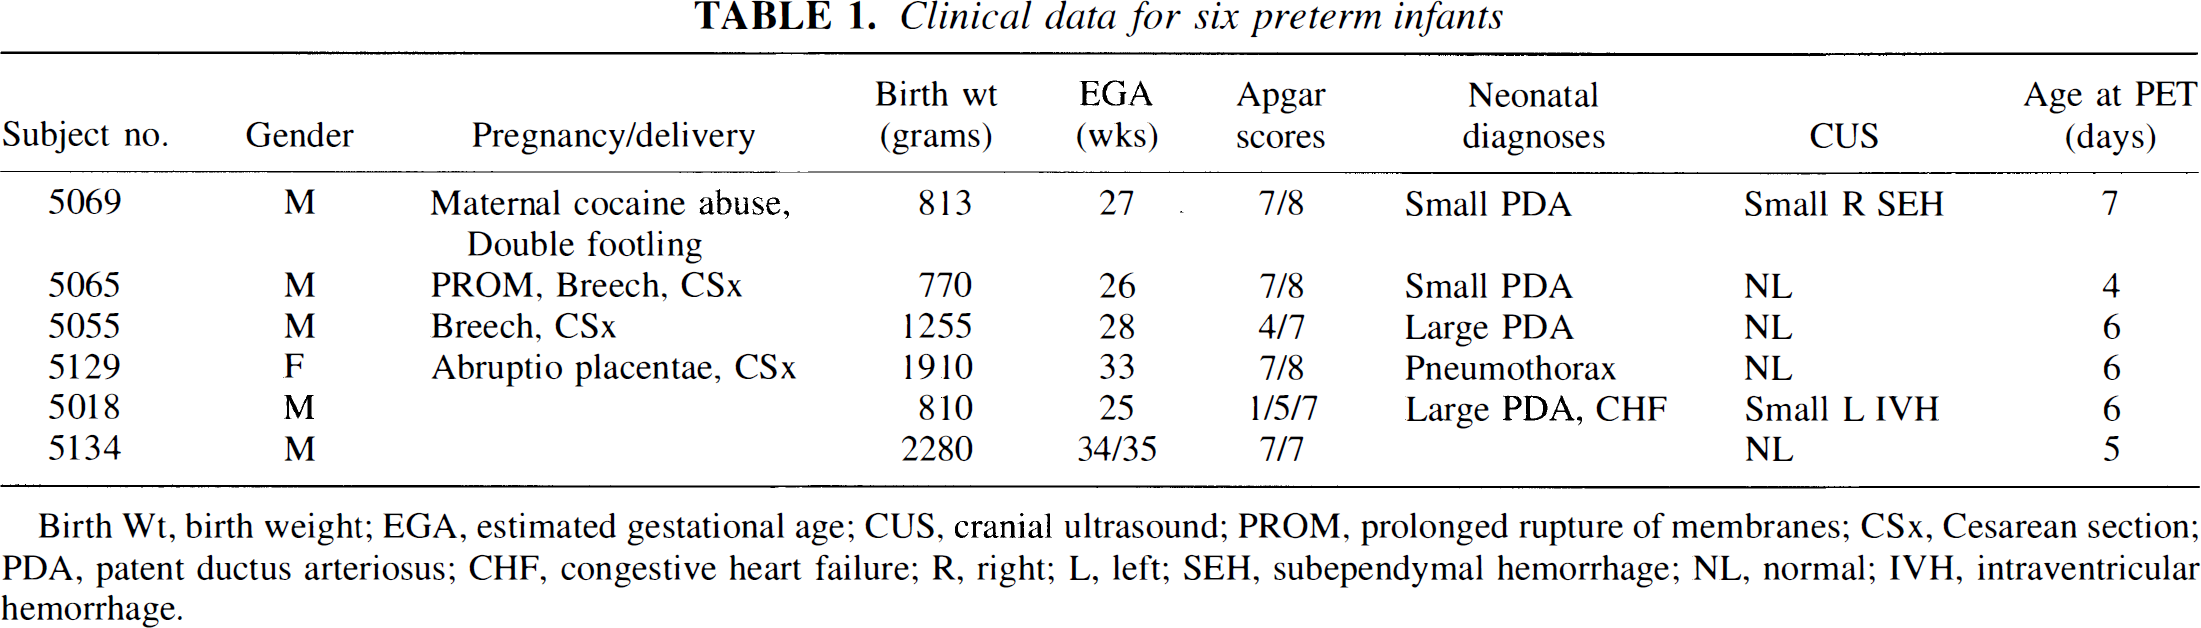
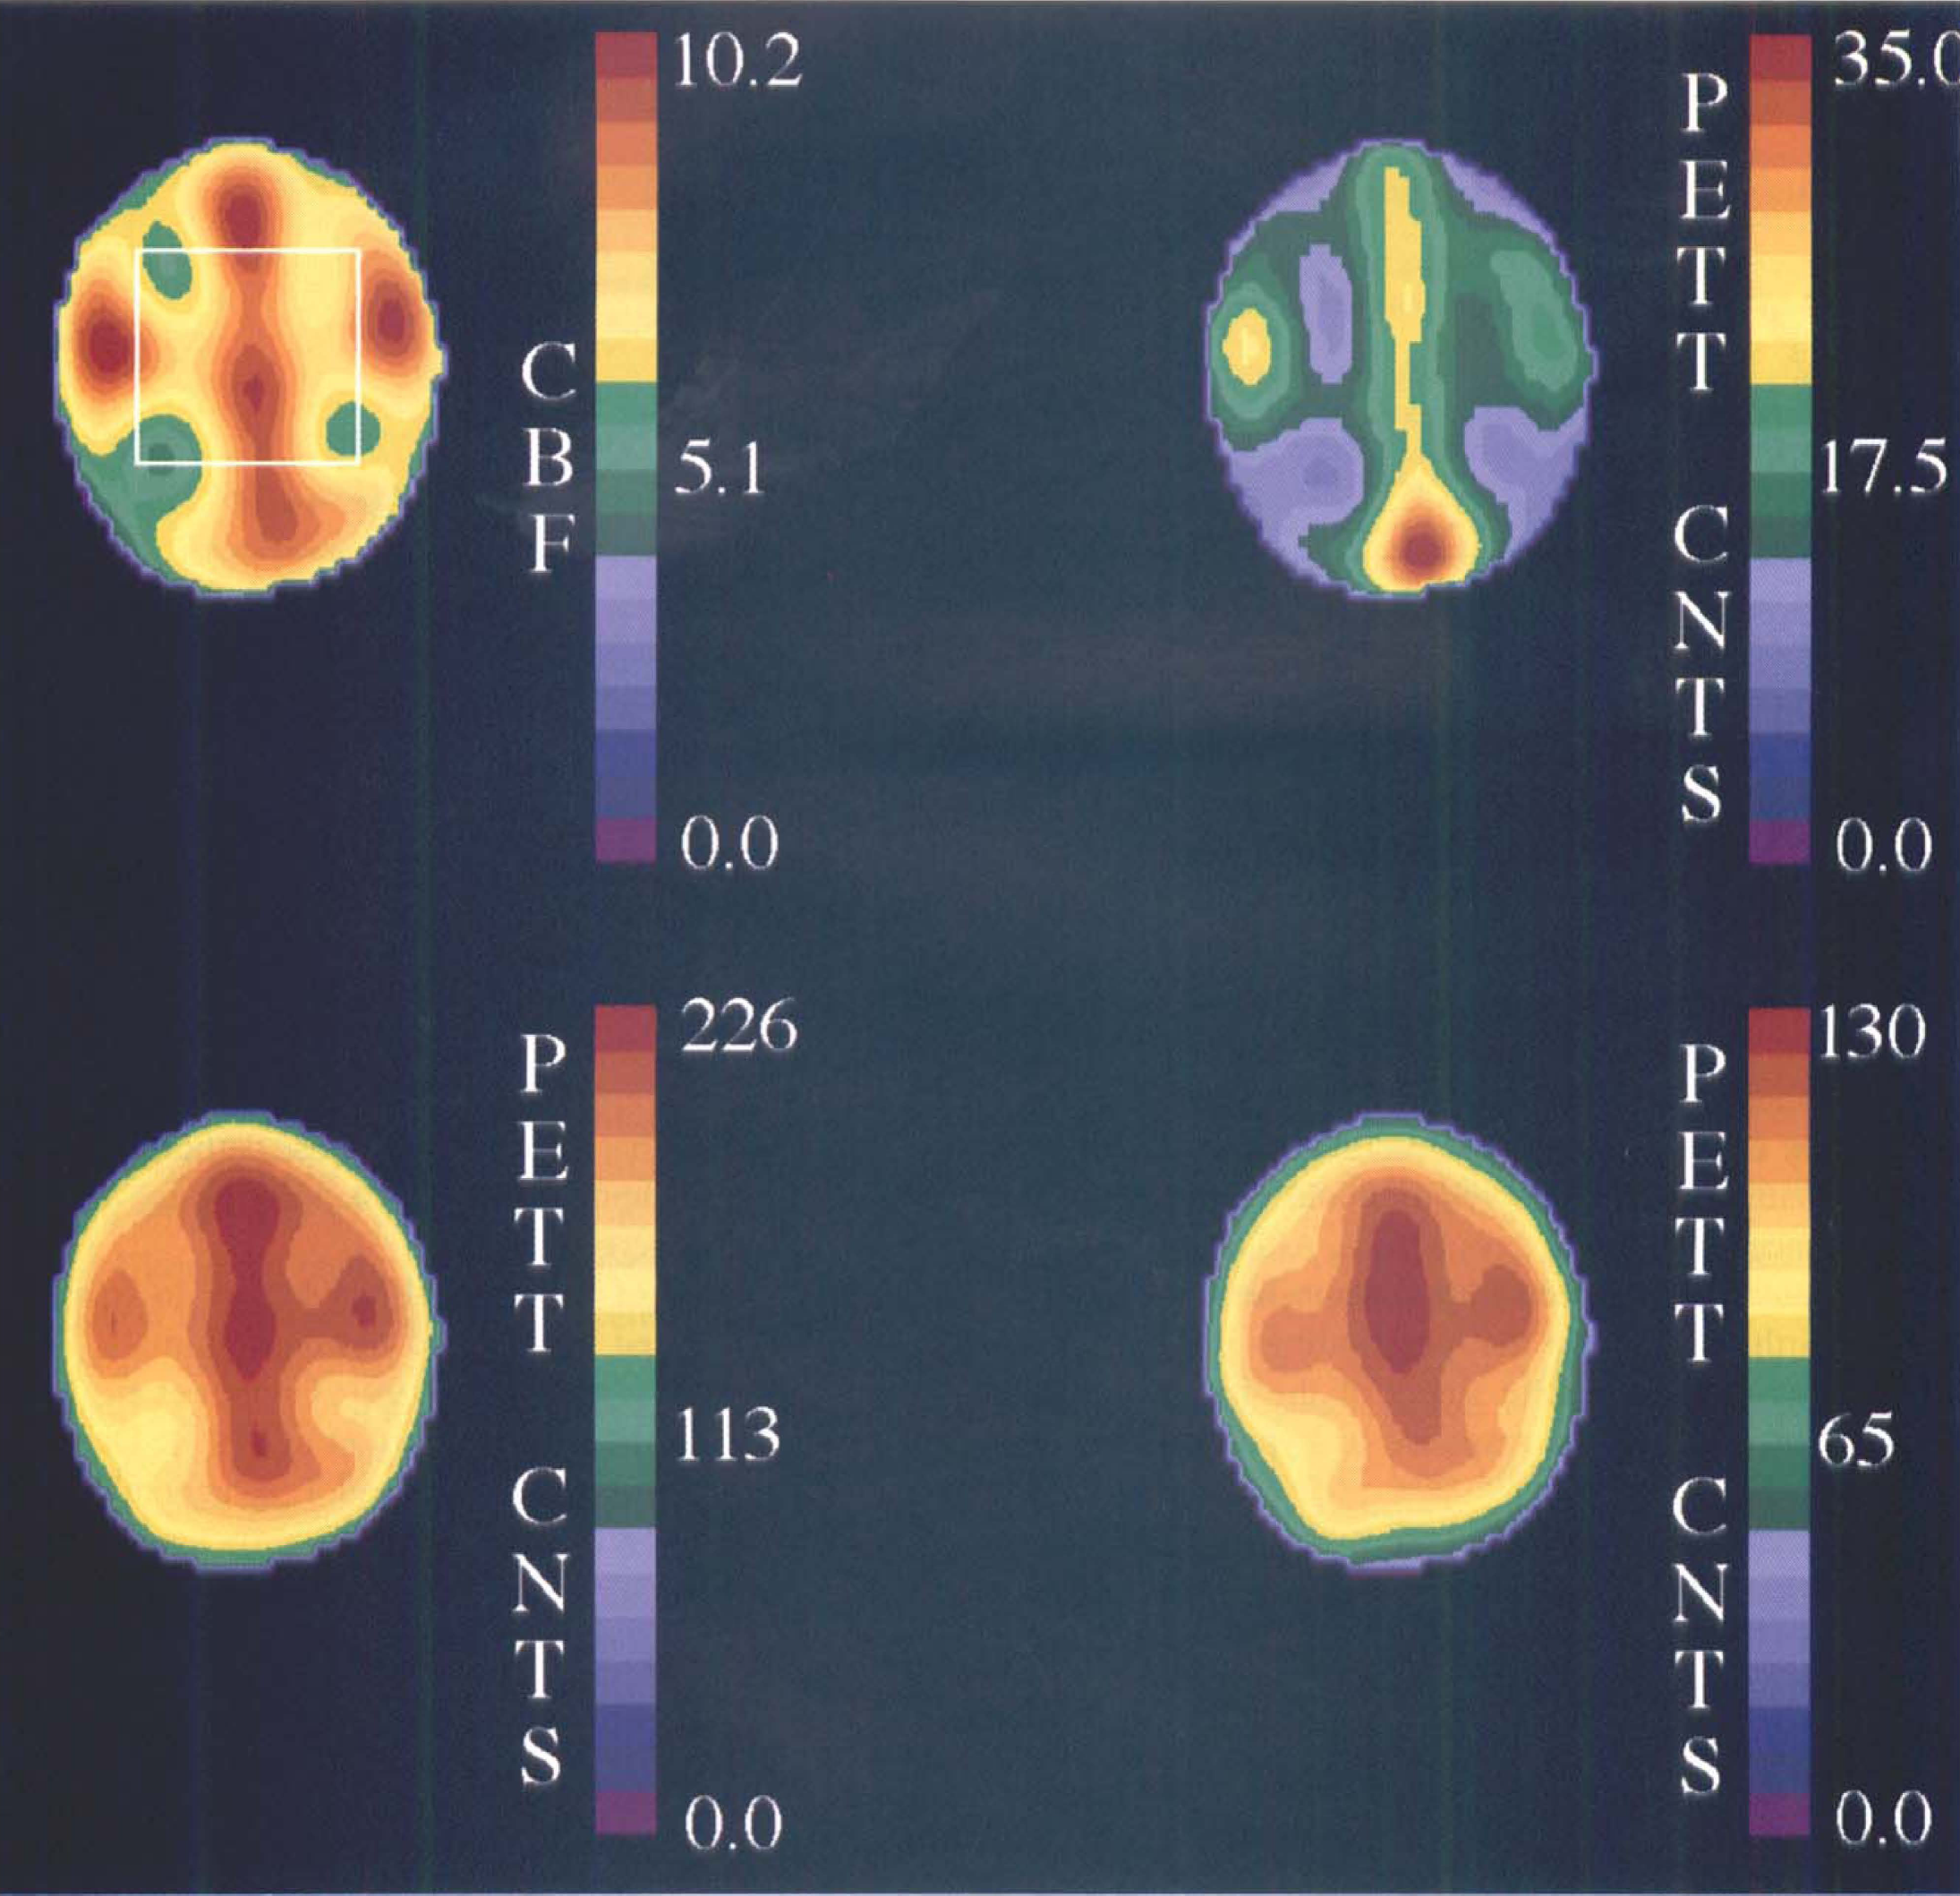
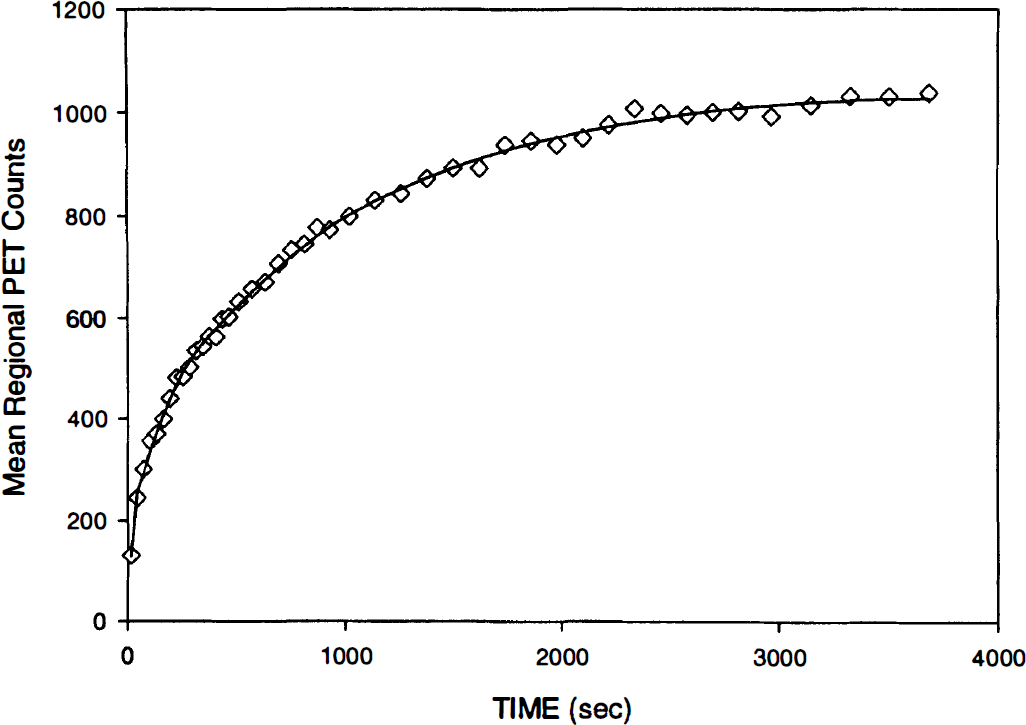
Representative images (Fig. 1) and regional 11C time-radioactivity curve (Fig. 2) from one of the subjects are shown. As can be seen from this example, the time-radioactivity curves derived from the estimated parameters fit the measured regional time activity well, especially in the early part of the curve, which is critical for the accurate estimation of V1. The two most critical rate constants are k*21 (for the calculation of CTXglc) and k*43 (for the calculation of CMRglc). The mean coefficients of variation for the estimates of these three parameters were all less than 10%: V1 5.4%, k*21 9.9%, and k*43 7.2%. These values are comparable with those that we obtained in our experimental validation study: V1 7.7%, k*21 11.1%, and k*43 8.2% (Powers et al., 1995).
Representative positron emission tomography (PET) images obtained from subject #5129. (Upper left) A 40-second CBF image obtained after injection of 840 μCi of H215O. The region of interest was centered on this slice and extended two slices above and below. (Upper right) A 30-second image obtained 30 seconds after slow intravenous injection of 178 μCi of 111C-glucose. Notice the predominance of the intravascular signal. (Lower left) A 2-minute scan beginning 20 minutes after 1-11C-glucose injection. (Lower right) A 2-minute scan beginning 40 minutes after 1 -11C-glucose injection. These images were reconstructed with a Gaussian filter to a resolution of 15.5 mm FWHM for display.
Regional time—radioactivity curve obtained after the intravenous administration of 178 μCi of 1−11C-glucose in subject #5129 (diamonds). The line shows the regional time—activity curve derived from the estimated rate constants.
Mean CMRglc was 8.8 μmol 100 g−1 min−1 (Table 2). The CMRglc did not correlate with plasma glucose concentration (r = .315, P = .543). CTXglc showed a significant correlation with plasma glucose concentration (r = .836, P = .038). The CTXglc began to approach CMRglc as the plasma glucose concentration fell toward 3.6 μmol mL−1 (Fig. 3).
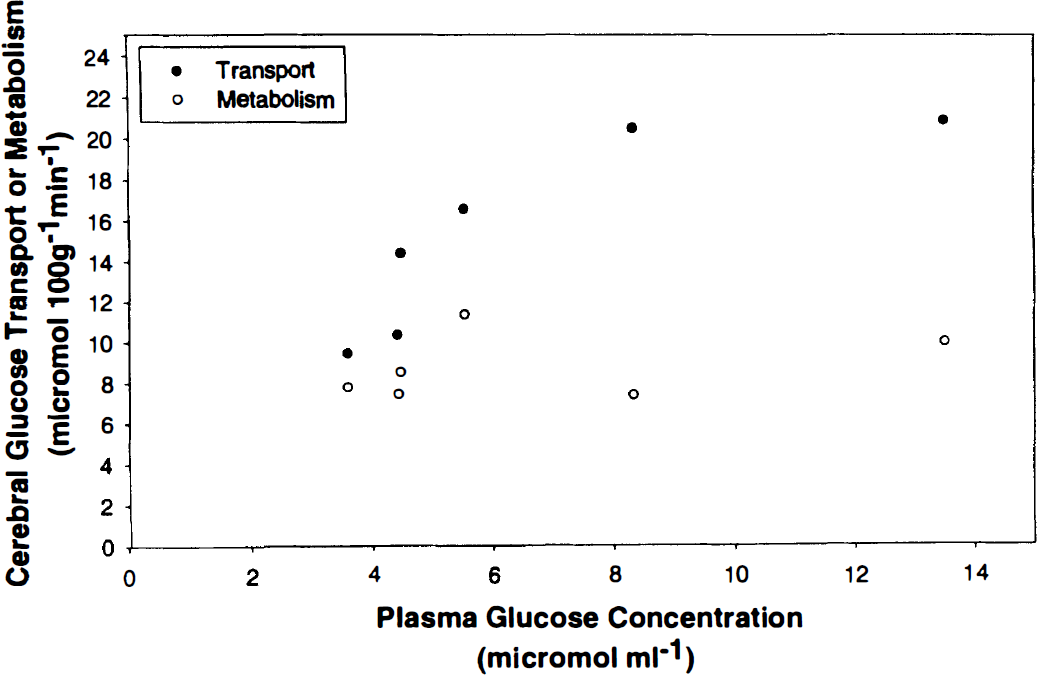
Cerebral (blood-to-brain) glucose transport and cerebral glucose metabolism in six preterm infants with different plasma glucose concentrations.
Cerebral glucose transport and metabolism in preterm human infants
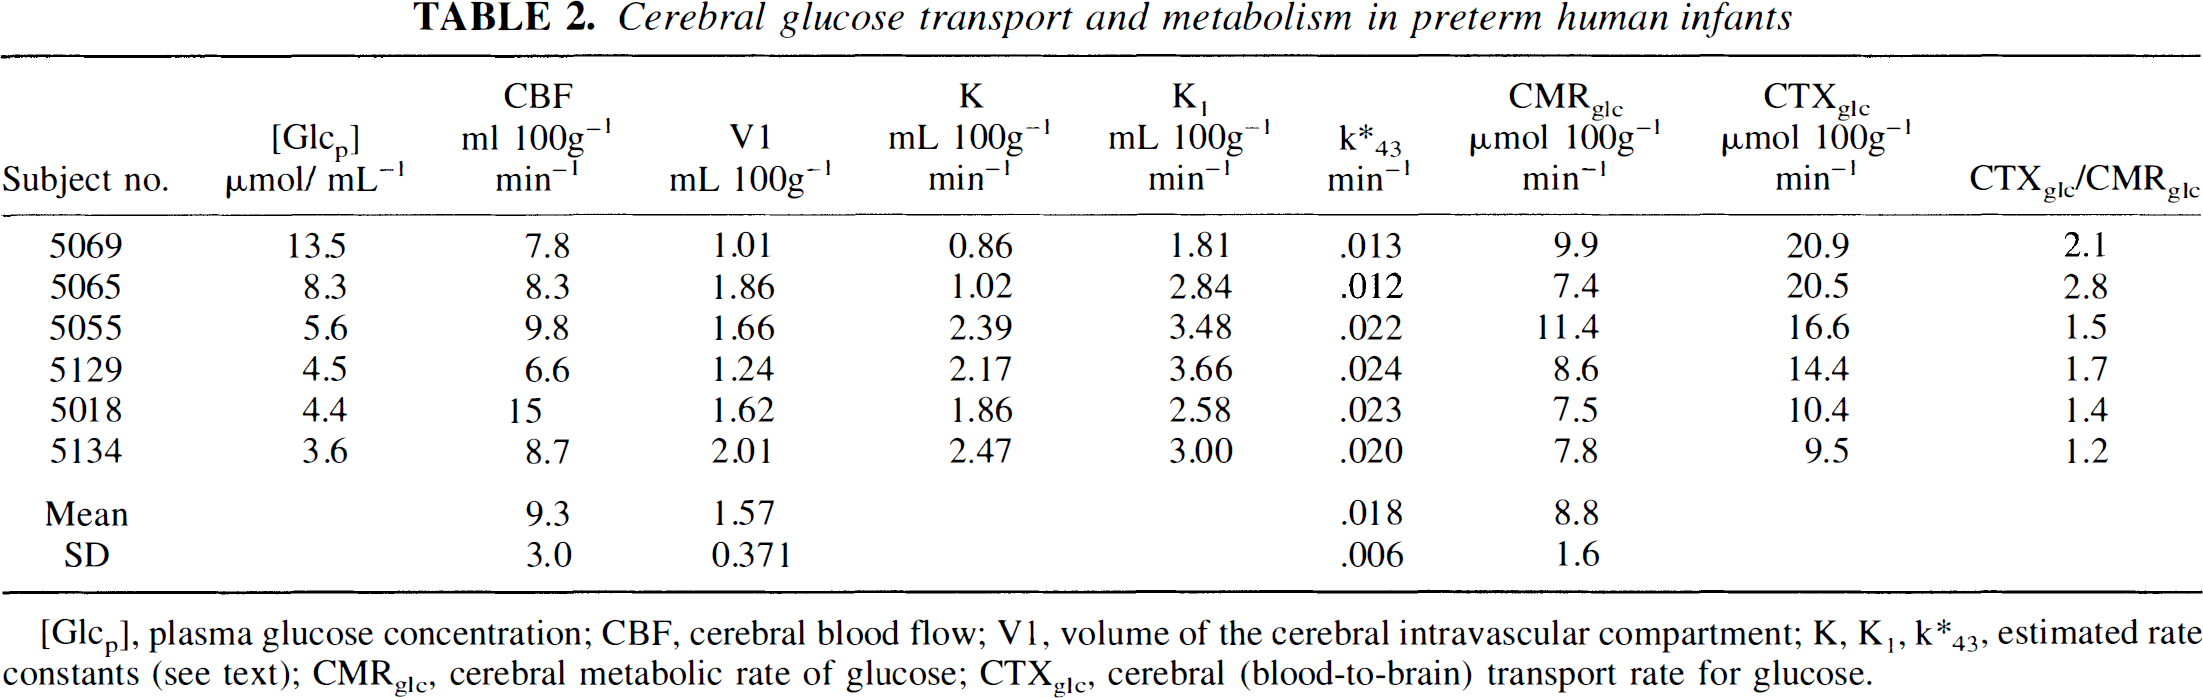
[Glcp], plasma glucose concentration; CBF, cerebral blood flow; V1, volume of the cerebral intravascular compartment; K, K1, k*43, estimated rate constants (see text); CMRglc, cerebral metabolic rate of glucose; CTXglc, cerebral (blood-to-brain) transport rate for glucose.
Estimation of the Michaelis-Menten constants from the best fit to the measured data produced values of Kt = 6.0 μmol mL−1 and Tmax = 32.6 μmol 100 g−1 min−1 (Fig. 4). The standard error of the estimates is 3.4 (55%) for Kt and 10.3 (27%) for Tmax.
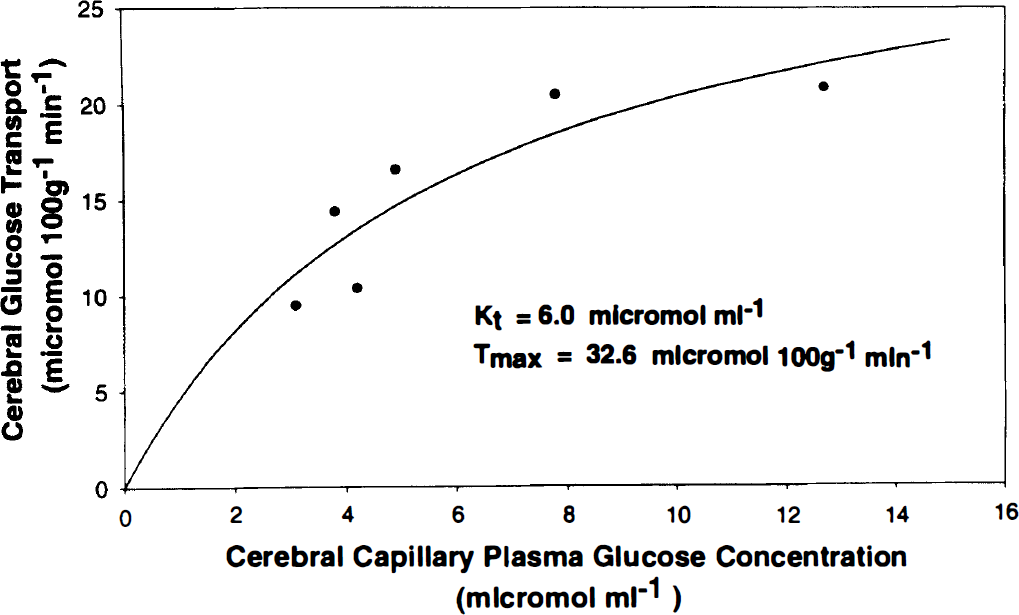
Best-fit line resulting from parameter estimation of the two Michaelis-Menten constants (Kt and Tmax) based on calculated cerebral capillary plasma glucose concentration and measured cerebral (blood-to-brain) glucose transport.
DISCUSSION
Performance of these PET measurements in these small preterm infants presented formidable technical and logistical problems. Because of the presumed long-term risk, the amount of radioactivity that can be used under Food and Drug Administration regulations is only one tenth that allowed in adults. Only large regions of interest provide adequate counting statistics for accurate parameter estimation. The PET studies themselves require sufficient blood samples to generate reasonable blood time—radioactivity curves. All ancillary blood drawing must be kept to a minimum. We therefore collected only a single heel-stick sample in a capillary tube for plasma glucose determination. Whereas multiple samples drawn from the arterial line would have been preferable, the increase in blood loss, albeit only a few milliliters, represented a substantial addition blood loss in some of these infants whose total blood volume is only 50 mL. Since these infants were fasted, we have no reason to believe that the plasma glucose values varied substantially during the procedure.
Values for CBF of 6.6 to 15 mL 100 g−1 min−1 were similar to those we have previously measured in preterm infants. Values for V1 estimated from the dynamic PET data were similar to direct measurements of cerebral blood volume of 1.5 to 3.1 mL 100 g−1 that we have made in other preterm infants (Altman et al., 1993; Altman et al., 1988).
The CMRglc in these preterm newborn infants was approximately one third the normal adult whole-brain value of 25 μmol 100 g−1 min−1 obtained with the Kety-Schmidt technique (Madsen et al., 1993; Siesjo, 1978). These substantially reduced rates for CMRglc in preterm infants compared with adults are consistent with data reported from fetuses of other mammalian species (Abrams et al., 1984; Dyve et al., 1991; Gleason et al., 1989). Total body glucose metabolism of the preterm infant is approximately 40 μmol kg−1 min−1 (Tyrala et al., 1994). At this stage of development, the brain weighs approximately 14% of the body weight (Gruenwald and Minh, 1960). Thus, based on our mean CMRglc of 8.8 μmol 100 g−1 min−1, the brain accounts for about 30% of total body glucose utilization for infants this size. This is substantially less than the 50% utilization by the brain in adults (Dineen et al., 1992).
Blennow and coworkers report cortical CMRglc of 5.5 to 24.1 μmol 100 g−1 min−1 measured at 2 to 3 days of life in three term newborn infants with hypoxic—ischemic encephalopathy (Blennow et al., 1995). Suhonen-Polvi and others report whole-brain CMRglc of 9.0 to 25.6 μmol 100 g−1 min−1 measured within the neonatal period in seven infants taken from a study of hypoxic—ischemic brain injury and severe neonatal hypoglycemia (Suhonen-Polvi et al., 1995). Our data from preterm infants are within the lower portion of the ranges reported by these investigators. Hypoxic—ischemic damage to the immature rat brain causes an increase in both CMRglc and expression of blood-brain barrier GLUT1 (Vannucci et al., 1996; Vannucci et al., 1994a). These changes are largely resolved after 24 hours. In the infants that we studied, there was no evidence of parenchymal brain damage by cranial ultrasound. Careful attention had been paid to maintenance of oxygenation and perfusion in all infants since birth 4 to 7 days before. Although we cannot rule out some degree of hypoxic—ischemic brain injury at birth, we believe that our findings primarily reflect the normal metabolic status of the preterm brain rather than a pathologic response to hypoxic—ischemic injury.
Interpretation of these data with regard to energy metabolism must be done cautiously. As opposed to the steady state in adult brain, the fetal brain is growing and uses intermediary compounds of glucose metabolism for synthesis of complex lipids (Lajtha et al., 1981). The portion of net cerebral glucose uptake that goes to synthesis of new compounds retained in the brain cannot be directly determined from this study. However, an indirect assessment of this can be obtained from the rate constant k*43, which describes the fractional rate of the labeled metabolite pool that leaves the brain. The value of .018 ± .006 min−1 that we obtained for these preterm infants is almost identical to the values of .0185 ± .003 that we obtained in macaques and of .020 ± .001 that we have recently measured in normal adult humans (Powers et al., 1997; Powers et al., 1995). The similarity of these values suggests that most of the glucose carbons taken up by the preterm human brain, like adult brain, are metabolized and excreted.
The capacity of the blood—brain barrier to transport glucose is reduced in fetal and newborn animals (Fuglsang et al., 1986; Dyve et al., 1991; Cremer et al., 1979; Vannucci et al., 1994b; Cornford et al., 1994; Daniel et al., 1978). Measurements of Kt and Tmax generally have shown a reduction in Tmax with no significant alteration in Kt (Cremer et al., 1979; Cornford et al., 1994; Daniel et al., 1978), although changes in Kt also have been reported (Fuglsang et al., 1986). The blood-brain glucose transport protein GLUT1 is present in the vascular endothelium of preterm human infants of 24 to 33 weeks gestational age (Mantych et al., 1993). As would be expected for the same glucose transport protein, our value of Kt = 6.0 μmol mL−1 in the developing human brain is similar to those that have been reported for mature brains of adolescent (4.9 μmol mL−1) and adult humans (4.1 μmol mL−1), and also is similar to the value we have previously reported in adult nonhuman primates (5.8 μmol mL−1) (Powers et al., 1995; Blomqvist et al., 1991; Gruetter et al., 1992). However, at 32.6 μmol 100 g−1 min−1, Tmax in the preterm human brain is approximately one third to one half the values reported for mature humans of 62 and 110 μmol 100 g−1 min−1 and adult nonhuman primates of 87 μmol 100 g−1 min−1 (Powers et al., 1995; Blomqvist et al., 1991; Gruetter et al., 1992). This reduction in transport capacity indicates a reduced number of available luminal transporters. This may reflect the reduced vascularity of the developing brain (Morin et al., 1988; Zeller et al., 1996).
Blood—brain transport was correlated with plasma glucose concentration, as predicted by the Michaelis-Menten equation. The transport rate exceeded metabolic demand at all plasma glucose values that we studied. The ratio of CTXglc:CMRglc approached unity as plasma glucose declined toward 3.6 μmol mL−1. Based on these data, transport limitation of metabolism can be expected to occur at a plasma glucose level of approximately 3.0 μmol mL−1.