
Abstract
Quantification of human brain muscarinic cholinergic receptors was investigated with the use of [11C]N-methyl-4-piperidyl benzylate (NMPB) and positron emission tomography (PET). Whole-brain uptake of NMPB at 90 to 110 minutes after intravenous injection was approximately 10% of the administered dose. The initial cerebral distribution of NMPB corresponded to the pattern of cerebral perfusion; however, at progressively longer postinjection intervals, regional distinctions consistent with muscarinic receptor binding were evident: activity at 90 to 110 minutes postinjection was highest in the striatum and cerebral cortex, intermediate in the thalamus and pons, and lowest in the cerebellum. After the development of a chromatographic system for isolation of authentic [11C]NMPB in plasma, tracer kinetic modeling was used to estimate receptor binding from the cerebral and arterial plasma tracer time-courses. Ligand transport rate and receptor-binding estimates were obtained with the use of compartmental models and analytical methods of varying complexity, including a two-parameter pixel-by-pixel-weighted integral approach and regional least-squares curve-fitting analyses employing both two-and three-compartment model configurations. In test—retest experiments, precision of the methods and their abilities to distinguish altered ligand delivery from binding in occipital cortex during an audiovisual presentation were evaluated. Visual stimulation increased the occipital blood-to-brain NMPB transport rate by 25% to 46% in estimates arising from the various approaches. Weighted integral analyses resulted in lowest apparent transport changes and in a concomitant trend toward apparent binding increases during visual activation. The regional least-squares procedures were superior to the pixel-by-pixel method in isolating the effects of altered tracer delivery from receptor-binding estimates, indicating larger transport effects and unaltered binding. Precision was best (less than 10% test—retest differences) for the weighted integral analyses and was somewhat lower in the least-squares analyses (10–25% differences). The authors conclude that pixel-by-pixel-weighted integral analyses of NMPB distribution introduce transport biases into receptor-binding estimates. Similar confounding effects also are predicted in noncompartmental analyses of delayed radiotracer distribution. The use of regional nonlinear least-squares fitting to two- and three-compartment models, although more labor intensive, provides accurate distinction of receptor-binding estimates from tracer delivery with acceptable precision in both intra- and intersubject comparisons.
Keywords
Changes in the number or function of muscarinic cholinergic receptors (mAChRs) and cholinergic synapses have been proposed in a number of neurologic and psychiatric illnesses. For example, losses of markers for cholinergic neurons and presynaptic terminals, as well as more controversial mAChR changes, have been suggested in postmortem and biopsy studies of patients with Alzheimer's disease (Davies and Maloney, 1976; Sims et al., 1983; Mash et al., 1985; DeKosky et al., 1992). During the course of Huntington's disease, there is a loss of striatal mAChRs, reflecting reduction in intrinsic striatal neurons (Enna et al., 1976; Wastek and Yamamura, 1978). Functional alterations of the mAChR also have been hypothesized on the basis of clinical observations in idiopathic dystonia (Fahn, 1983), Parkinson's disease (Ruberg et al., 1982), and schizophrenia (Tandon and Greden, 1989), and in the affective disorders (Janowski et al., 1972).
Previous studies have sought in vivo muscarinic receptor quantification using either single-photon emission computed tomography (SPECT) or positron emission tomography (PET) to image the human brain distributions of muscarinic antagonist radioligands. Precise quantification of mAChRs has, however, been hampered by the in vivo kinetic behaviors of the radiotracers employed, including [11C]scopolamine (Frey et al., 1992), [11C]tropanyl benzilate (Koeppe et al., 1994), [11C]benztropine (Dewey et al., 1990), [123I]3-quinuclidinyl-4-iodobenzilate (Eckelman et al., 1984; Sawada et al., 1990), and [123I]iododexetimide (Müeller-Gärtner et al., 1992). These agents share relatively slow dissociation rates from the mAChRs, which may limit the precision of their uses for in vivo binding site density estimates. Slow dissociation from receptors precludes the use of equilibrium binding or of single scan analyses because true equilibrium is not achievable during the imaging times permitted by the isotopic half-lives of the tracers. Thus, compartmental kinetic analyses must be employed to estimate binding with these agents. However, when the rate of ligand binding is rapid relative to the rate of its transport from blood to tissue, tissue activity levels are delivery limited and receptor estimates become imprecise and prone to bias from effects of altered blood flow.
We have developed the novel, radiolabeled nonsub-type-selective muscarinic receptor antagonist [11C]N-methyl-4-piperidyl benzylate (NMPB; Mulholland et al., 1988) which possesses more favorable kinetic properties in preliminary animal (Buck et al., 1996) and human studies than prior ligands (Frey et al., 1992; Koeppe et al., 1994). In the present study, we implement and characterize alternatives for the analysis of [11C]NMPB distribution and evaluate the specificity of binding estimates derived from several kinetic modeling alternatives in healthy human volunteers. Two- and three-compartment model configurations and pixel-by-pixel-weighted integral versus regional nonlinear least-squares fitting procedures are compared for their abilities to describe the in vivo kinetics of NMPB and to differentiate the radiotracer delivery and binding processes. In a test—retest paradigm, we assess the degree of independence of receptor estimates from altered tracer delivery, as well as the intrasubject variability of the measurements.
METHODS
Subjects
Nineteen young healthy volunteers (24 ± 4 years of age; 11 men, 8 women) were recruited via local advertisement and enrolled after normal physical and neurologic examination results. Participants had no current or prior significant medical, neurologic, or psychiatric illness and reported no family history of neurologic or psychiatric illness in first-degree relatives. Subjects with history of drug or alcohol abuse, cigarette smoking, or excessive consumption of caffeine (>300 mg/day) were excluded. The studies were approved by The University of Michigan Institutional Review Boards governing the use of human subjects and the use of radionuclides in human research, and written informed consent was obtained before all experimental procedures.
Positron emission tomography data acquisition and experimental designs
In initial studies of NMPB distribution kinetics, seven subjects underwent a single dynamic sequence of scans with eyes and ears unoccluded in a room with dimmed lighting. In subsequent model validation experiments, one group of six subjects completed two identical baseline studies. A second group of six subjects were studied once with eyes patched and once while watching a videotape during the entire imaging period, in a balanced design (baseline-stimulation or stimulation-baseline, 3 subjects each). Audiovisual stimulation was initiated 5 minutes before the injection of the radioisotope and consisted of a popular adventure screenplay selected by the subject to ensure continuous attention during the study.
At the beginning of imaging sessions, radial artery and antecubital vein catheters were placed for collection of arterial blood samples and for radiotracer administration, respectively. Subjects then were positioned supine in the gantry of a CTI/Siemens 931/08–12 tomograph (Knoxville, TN, U.S.A.), which acquires 15 contiguous slices from a 10-cm axial field of view with reconstructed in-plane resolution of 8 to 9 mm full width at half-maximum for the current studies.
Each scan was initiated after the intravenous bolus administration of no-carrier—added, high-specific activity (>1000 Ci/mmol) [11C]NMPB (Mulholland et al., 1988), at a dose of 20 ± 2 mCi. A sequence of 18 PET scans was acquired, covering 110 minutes (2 times 30 seconds, 4 times 1 minute, 2 times 2.5 minutes, 2 times 5 minutes, 7 times 10 minutes, 1 times 20 minutes). Blood samples were withdrawn from the radial artery every 10 to 15 seconds for the first 2 minutes of the scanning period, and then at 2.5, 3, 4, 5, 7.5, 10, 15, 20, 30, 45, 60, 85, and 110 minutes postinjection. In subjects undergoing two consecutive studies, [11C]NMPB administrations were separated by at least 130 minutes to allow isotopic decay and biologic clearance of the previously administered tracer before initiating the second scan.
In visual stimulation experiments, both NMPB studies were preceded by the measurement of cerebral blood flow (CBF) after the intravenous injection of 80 ± 6 mCi [15O]H2O, to assess the effect of visual stimulation in each subject. A dynamic sequence of nine scans was acquired over 6 minutes. The arterial blood concentration of [15O]H2O was obtained by continuous counting from the radial artery catheter using a flow-through plastic scintillation detector (Hutchins et al., 1986). Cerebral blood flow was calculated by a weighted integral method (Alpert et al., 1984), omitting the first 30 seconds of data, as described previously (Koeppe et al., 1987).
Compartmental modeling of [11C]NMPB transport and binding
The tracer kinetic analyses applied to [11C]NMPB have been described in detail in prior studies with other radiotracers (Koeppe et al., 1992; 1994). A general model depicting the distribution of binding site radioligands in brain, which includes a plasma compartment and three tissue compartments, was employed (Fig. 1). The tissue compartments represent free, nonspecifically bound, and specifically bound radiotracer pools, with intercompartmental exchange described by six first-order kinetic rate constants (K1 through k6) when the administered radioligand occupies only a negligible fraction of the available receptors. The kinetic parameters are defined in the four-compartment model as follows:


where f is cerebral blood flow (mL plasma/mL brain/minute), E0 is the single-pass extraction fraction of the ligand across the blood-brain barrier, PS is the capillary permeability surface area product (mL plasma/mL brain/minute), kon is the bimolecular association rate between ligand and receptor (mL brain/ mol/minute), Bmax' is the density of available receptors (mol/ mL brain), and koff is the dissociation rate of ligand from the receptor (min−1). The model parameters are related to the equilibrium ligand-binding constant for NMPB at the receptor site, kd, as follows:

and thus:
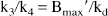
The ratio of receptor-related parameters Bmax'/kd is proportional to receptor binding, provided that kd is similar for all receptors, and has been introduced previously as the “binding potential” by Mintun et al. (1984).
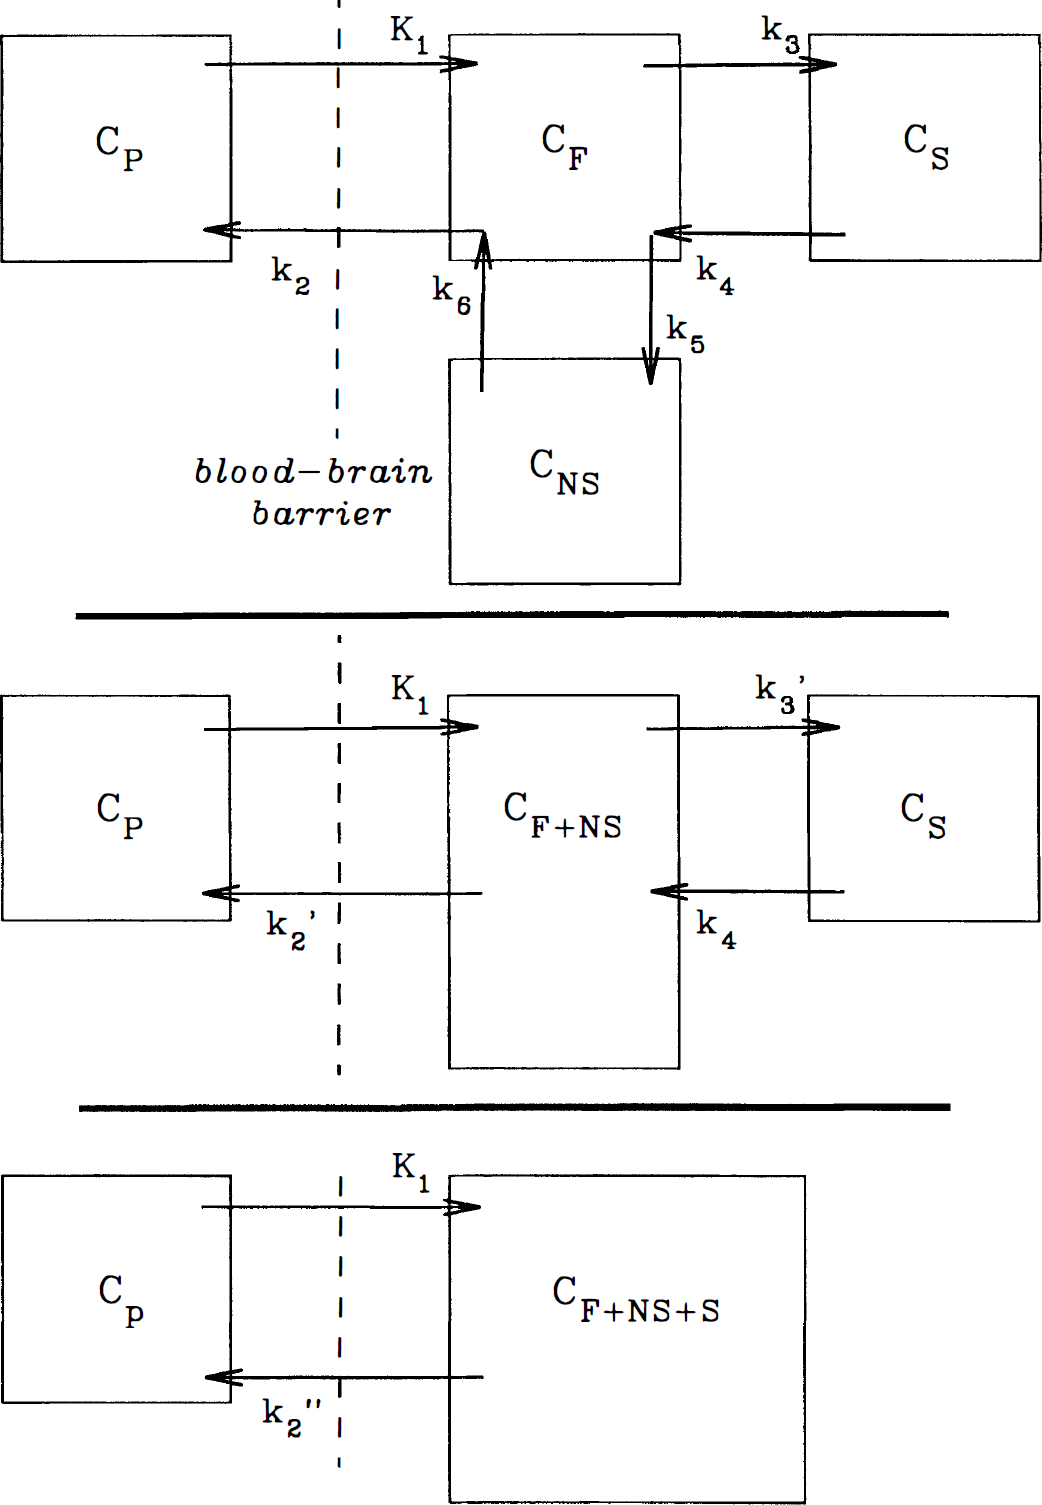
Compartmental model configurations and designated intercompartmental transfer coefficients used in [11C]N-methyl-4-piperidyl benzylate (NMPB) distribution analyses. Top: The most general model describing the distribution of receptor-binding ligands includes an intravascular compartment (CP) and three tissue tracer compartments representing free tracer (CF), nonspecifically bound tracer (CNS), and specifically-bound tracer (Cs). Intercompartmental transfer coefficients K1 and k2 describe the blood flow- and diffusion-mediated exchanges of tracer across the blood-brain barrier. Coefficients k5 and k6 describe exchange between the free tissue and nonspecific binding pools, whereas k3 and k4 describe tracer binding to and dissociation from muscarinic cholinergic receptor sites. Middle: The initial model simplification considered reflects combination of the free and nonspecific binding tracer pools into a common compartment (CF+NS). Transfer coefficients leading from the new combined compartment have modified definitions (see Equations 7 and 8), and are designated k2' and k3'. Bottom: Further simplification of the model combines all three tissue pools into a single compartment (CF+NS+S). Definition of the transfer coefficient leading from the newly defined tissue compartment is further modified (see Equations 9 and 10) and is designated k2”.
The aforementioned general model is described by more independent variables than may typically be estimated from a single tracer injection study, thus, simplifications were explored. A three-compartment, four-parameter model was configured, which includes blood-to-brain ligand transport (K1), the free plus nonspecific tissue ligand distribution volume (DV'), and the receptor-binding and dissociation rate constants (k3' and k4). This configuration combines the free and nonspecific pools into a single compartment, assuming that the rates of exchange between the free tissue and the nonspecific binding pools (k5 and k6) are rapid compared with the other model parameters (K1 through k4). In the simplified three-compartment model (Fig. 1), the rate constants are:
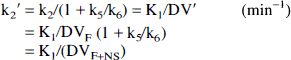
where DV' is the summed distribution volumes of the combined free and nonspecifically bound compartments (mL plasma/mL brain). Assuming the free distribution volume to be 1 (K1 = k2), DV' is equivalent to the quantity (1 + k5/k6) in the four-compartment model configuration and reflects the apparent increase in size of the receptor-binding precursor compartment because of the presence of nonspecific binding.
A further simplified two-compartment, two-parameter model also was evaluated. If, in addition to rapid equilibration of free and nonspecific tracer compartments, the specific binding and dissociation rates (k3' and k4) are rapid compared with the blood-brain transport parameters (K1 and k2'), the model can be reduced to two compartments and two kinetic parameters (Fig. 1). In this simplified construct, a single tissue compartment incorporates free, nonspecifically bound, and specifically bound tracer with a new derived rate constant (k2”), reflecting the loss of tracer from the combined tissue compartment to plasma as follows:
and thus:
where DV” is the apparent distribution volume of the summed free, nonspecific binding, and specific binding tissue compartments (K1/k2”). In this model, receptor information is represented in the DV” parameter (Frey et al., 1991). As the ratio of association to dissociation rates (k3/k4) becomes progressively higher, the specific distribution volume term increases, leading to linear, positive correlation between DV” and local receptor density (Koeppe et al., 1991).
Development of rapid plasma NMPB chromatography
Methodology for the separation of NMPB from its labeled metabolites in blood was developed in a manner similar to that used for other tracers in our laboratory (Frey et al., 1991; 1992). Rapid column chromatographic separation with stringent solvent elution conditions and correction for recovery of the unmetabolized tracer using a tritiated internal standard was employed. This procedure allows metabolite correction of a larger number of samples containing short-lived radiotracers than is feasible by high pressure liquid chromatography.
The chromatographic behaviors of NMPB and its radiolabeled metabolites were studied after their isolation from a 200-g male Sprague-Dawley rat. Fifteen minutes after intravenous administration of 1 mCi of [3H]NMPB (custom synthesis, New England Nuclear, Boston, MA, U.S.A.), samples of liver, brain, and arterial plasma were obtained. Solid tissues were homogenized in 4 vol of 95% ethyl alcohol (EtOH). Plasma underwent deproteinization by the addition of 1 vol of 95% EtOH. The ethanolic suspensions were then centrifuged for 1 minute at 15,000 × g. Aliquots of the supernatants and of the original homogenates were assayed by liquid scintillation spectroscopy both before and after drying at 60°C to 70°C to detect the possible presence of volatile radioactive species. Additional aliquots of the ethanolic supernatants were concentrated under vacuum and then underwent chromatography on silica thin-layer chromatographic plates (No. 5721, E. Merck, Darmstadt, Germany) with a triethylamine:diethyl ether:dichloromethane:ethanol (1:10:15:1) mobile phase. After development and drying, plates were sprayed with a fluorographic enhancer (En3hance, New England Nuclear, Boston, MA, U.S.A.) and apposed to x-ray film (Type SB, Eastman Kodak, Rochester, NY, U.S.A.) for 7 days at − 70°C. The autoradiograms were used to locate and recover major radiolabeled species from the plates.
The rapid separation of [3H]NMPB from its major radiolabeled metabolites was investigated with the use of Sep-Pak C18 cartridges (Waters, Milford, MA, U.S.A.). Columns were prepared by prewashing with 0.1 mL triethylamine, followed by 10 mL of EtOH, and finally by 10 mL of borate-buffered saline (BBS: sodium chloride 137 mmol, sodium borate 10 mmol; pH 10). Samples of authentic [3H]NMPB or labeled metabolites obtained from rat liver chromatography were added in 1-mL volumes of BBS to the Sep-Pak columns. Columns then were washed with mobile phases of various EtOH—BBS content (10–50% EtOH). The eluted fractions were collected and assayed by liquid scintillation spectroscopy to optimize distinct elution patterns of NMPB versus its polar metabolites.
Routine metabolite correction of arterial plasma [11C]NMPB input functions
A total of 14 plasma samples were analyzed and corrected for the presence of metabolites during each dynamic NMPB PET scan. Arterial blood samples were centrifuged, and 0.4 mL aliquots of plasma were mixed with 0.6 mL of BBS containing 0.01 μCi of [3H]NMPB and then applied to Sep-Pak C18 columns. A metabolite fraction was obtained by washing the column with 9 mL of 36% EtOH:BBS. An authentic NMPB fraction then was eluted with 5 mL of absolute EtOH. The [11C]NMPB and [11C]metabolite fractions were assayed in a sodium iodide well counter followed by liquid scintillation spectroscopy of aliquots determined after decay of the carbon-11. The NMPB fraction was corrected for recovery on the basis of the distribution of the [3H]NMPB, and the fraction of total activity in the original plasma sample corresponding to unchanged NMPB was calculated as described previously (Frey et al., 1992).
Parametric image generation
Individual frames from each dynamic NMPB emission image sequence were reconstructed with calculated attenuation correction using an ellipse-fitting routine. Reconstructed images then were realigned to correct for patient motion that may have occurred during the sequence on the basis of labeled beads (1–2 mm in diameter), which were placed at various points on the subject's scalp before scanning. Six to 8 μCi of [11C]NMPB were used to label each of the beads. The approximate locations of each of three beads were identified manually in the 17th frame of the study and used as base orientation. The precise (x, y, z) coordinates of the centers of activity were then automatically determined based on the activity distribution in the vicinity of the beads and the measured point spread function of the tomograph. An automated routine subsequently located and calculated the coordinates for each bead in the remaining 17 frames, which then were realigned to the orientation of the base frame, correcting for three translational and three rotational degrees of freedom to within 0.5 mm and 1°, respectively.
After realignment, the dynamic sequence of emission images and the corresponding metabolite-corrected arterial plasma tracer input function were used to create pixel-by-pixel images of ligand transport (K1) and total tissue distribution volume (DV”, see equation 9) on the basis of the simplified, two-compartment, two-parameter model. The parametric images were calculated using a weighted integral look-up table analysis (Alpert et al., 1984), as previously applied to estimation of CBF and receptor ligand-binding estimates in our laboratories (Frey et al., 1991, Koeppe et al., 1994). The first 30 seconds of scan data were omitted from these calculations to reduce central blood volume effects on the estimated parameters (Koeppe et al., 1987).
Parametric image calculations performed on a pixel-by-pixel basis are more prone to the effects of statistical uncertainty (noise) than are analyses of region-of-interest data; therefore, a modification of the look-up table approach was employed in the present analyses. Because the measured tissue tracer concentration changes very little as DV” increases at high values (>50 mL plasma/mL brain), the noise in pixel-by-pixel analyses creates highly variable DV” estimates when k2” is small (leading to high DV”). To reduce this effect, the mapping between the look-up table and the optimal k2” was modified (rolled-off) so that small changes in tissue concentration cause smaller changes in the estimate of DV” than they would under other circumstances. Although different than simple temporal or spatial parameter smoothing, the modification achieves a similar qualitative effect on calculated parametric images. The positive consequence of this modification is that pixel-by-pixel functional images can be produced with acceptable noise levels. The negative consequence is that in high-binding regions, such as the basal ganglia and cortex, DV” is consistently biased, yielding progressive underestimates as DV” increases. However, even with this bias in high-binding regions leading to some loss of contrast, the procedure results in better overall distinction between regions of high and low receptor density than methods using either graphical analysis or simple region-to-cerebellar ratios.
Regional kinetic analyses of [11C]NMPB distribution
Anatomically configured regions of interest were drawn on the K1 maps from the weighted integral pixel-by-pixel analyses. In test—retest experiments, regions of interest were determined on the resting image (baseline-stimulation experiments) or the initial scan (baseline-baseline precision experiments). These regions of interest then were applied to the entire dynamic sequence of individual images of the corresponding subject, including both NMPB sequences in test—retest studies and the parametric CBF scans obtained in the baseline-stimulation studies. This resulted in regional NMPB tissue time-activity curves and CBF values for regions of interest corresponding to the frontal and occipital cerebral cortices, putamen, thalamus, pons, and cerebellar hemisphere.
The NMPB regional tissue and the corresponding metabolite-corrected arterial plasma time-activity curves were analyzed according to both the three-compartment and the two-compartment kinetic models by nonlinear least-squares curve-fitting, using the Marquardt algorithm (Bevington, 1969) with constraints restricting parameters to positive values and data weighting in proportion to the number of detected events before decay correction. The effects of a cerebral blood volume component in the measured PET data and the time disparity between the arrival of arterial activity in the wrist versus the brain also were accounted for in each of the models. The time offset was estimated first by fitting the initial 20 minutes of the time-activity curve for an entire brain slice at the midthalamic level, using the two-compartment, two-parameter model. In this fit, a fixed, whole-slice cerebral blood volume of 0.035 mL/mL brain (3.5%) was assumed. In all subsequent regional curve-fitting for that scan, the temporal offset was fixed to this estimated value. In the individual regional curve fits, either two or four intercompartmental transfer rate coefficients and local cerebral blood volume were estimated simultaneously. In reporting and statistical analyses of bilateral structures, left and right hemispheric parameters were averaged on an individual scan basis.
Statistics
Statistical evaluations of the test—retest experiments were conducted separately according to both experimental protocol (baseline-baseline or baseline-visual stimulation) and analytic method (2-parameter pixel-by-pixel—weighted integral, 2-parameter regional least squares, or 4 parameter regional least squares). We hypothesized that no changes in the binding should occur between baseline and visual stimulation, although K1 should increase in the occipital cortex during visual stimulation on the basis of increased synaptic activation. Paired, two-tailed Student's t tests were used for comparison of regional values in the test-retest studies at the P < 0.05 level of significance. Comparisons between fits resulting from the two least-squares fitting procedures for each region were made on the basis of two statistical procedures. Residual error, assessed by χ2, was evaluated with F tests with a significance threshold of P < 0.05. In addition, the fits were assessed by calculating the information criterion of Akaike (1974), followed by Student's t-test.
RESULTS
Metabolism and chromatography of labeled NMPB
Analyses of rat tissues revealed presence of volatile, radiolabeled species accounting for approximately 50% of plasma, 20% of liver, and less than 5% of cerebral activities. It is notable that this activity, likely representing labeled water after N-demethylation of NMPB, is not expected after metabolism of the carbon-11-labeled tracer (see discussion in Frey et al., 1991). Thin-layer chromatography of the nonvolatile activity from liver revealed the presence of a group of very polar metabolites remaining at the origin or migrating with rf values of less than 0.1 (group I), metabolite species of intermediate polarity migrating with rf values between 0.1 and 0.25 (group II), and [3H]NMPB migrating with rf of 0.5, accounting for 50%, 20%, and 25% of total nonvolatile activity, respectively. In plasma, the same three groups of species accounted for approximately 45%, 2%, and 45% of the nonvolatile activity. Analysis of brain revealed more than 90% of activity attributable to authentic [3H]NMPB, with an additional band of activity (5% of total) migrating with slightly higher rf than the authentic tracer. This latter material was evident in both plasma and liver, accounting for 1 % to 2% of total activities, and was identified as a minor contaminant in the starting material, accounting for 1% of nonvolatile activity injected. Thus, there are peripheral radiolabeled metabolites of NMPB present in peripheral tissues, but not in brain. A minor, less polar species is identified in brain, corresponding to a contaminant of the injected [3H]NMPB.
Samples of the two groups of labeled metabolites isolated from liver and of [3H]NMPB were chromatographically separable on Sep-Pak C18 columns. A mobile phase consisting of EtOH:BBS (36:63, v/v) eluted 100% of group I and 93% of applied group II metabolite activity in a volume of 9 mL, although 77% of unmetabolized [3H]NMPB was retained (Fig. 2).
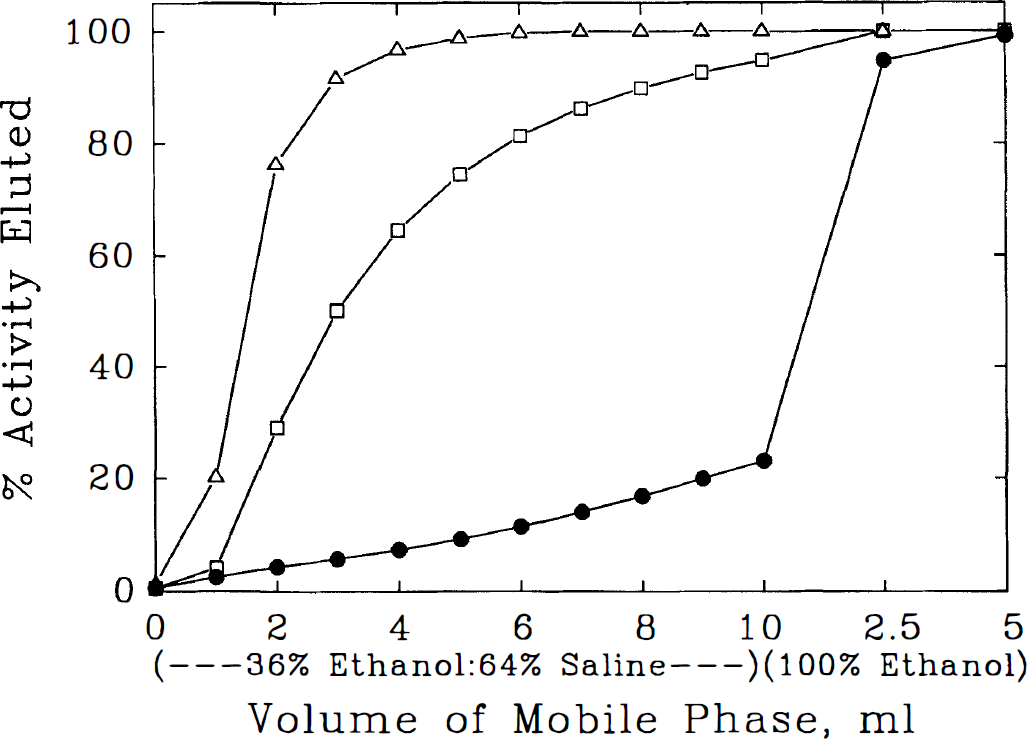
Chromatographic separation of labeled metabolites and authentic [11C]N-methyl-4-piperidyl benzylate (NMPB). Elution profiles of authentic [3H]NMPB (•), highly polar metabolites (group I, Δ), and intermediate polarity metabolites (group II, □) from chromatographic columns is depicted. NMPB or tritiated metabolites recovered from thin-layer chromatography of rat liver were applied to Sep-Pak C18 columns and eluted progressively with alcohol:borate-buffered saline (EtOH:BSS) and absolute EtOH. After washing with 9 mL of EtOH:BSS, most of the metabolites are eluted with retention of more than 80% of NMPB on the column. Subsequent absolute EtOH application results in complete recovery of NMPB.
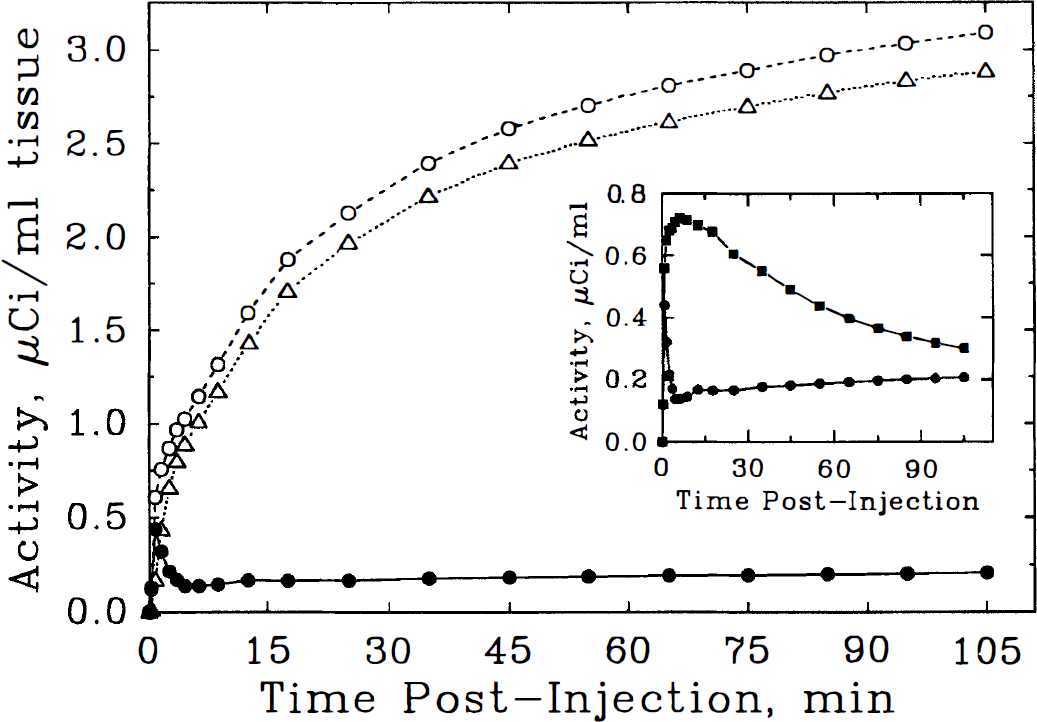
In arterial plasma samples from human subjects, intravenously administered [11C]NMPB was metabolized rapidly with polar labeled metabolites detected by 15-minute post-tracer administration (Fig. 3). At the end of a 110-minute scanning session, authentic [11C]NMPB accounted for less than 25% of total plasma activity, emphasizing the necessity of chromatographic correction of plasma curves.
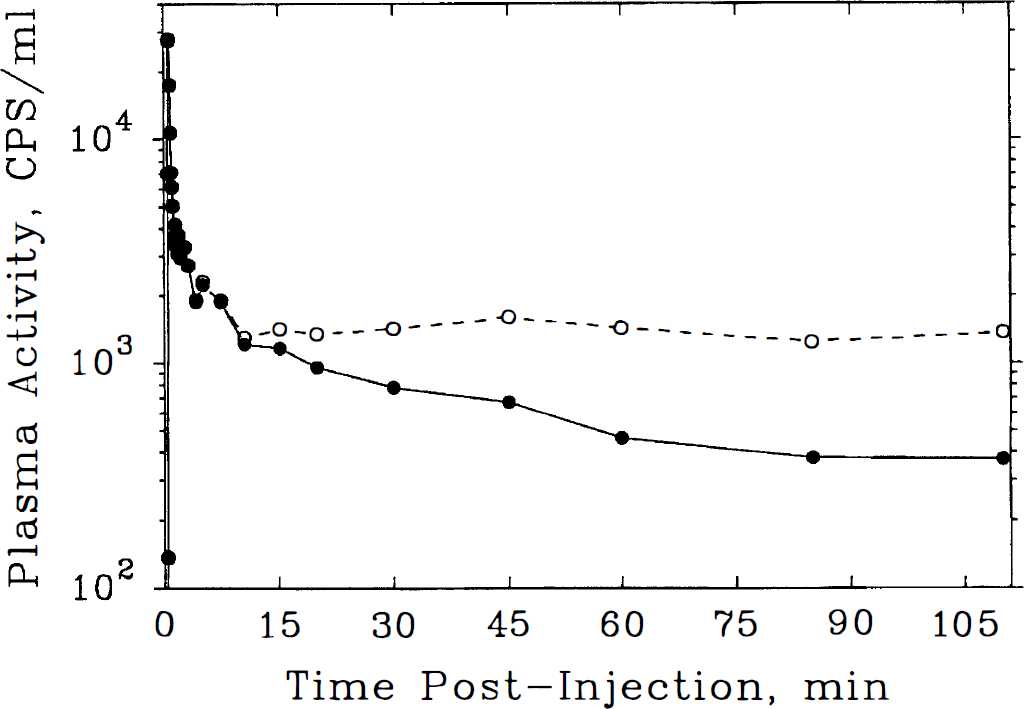
Time-course of activity in arterial plasma after bolus intravenous injection of [11C]N-methyl-4-piperidyl benzylate ([11C]NMPB) in a representative healthy subject. Total activity (○, dashed line) and unmetabolized [11C]NMPB after chromatographic correction (•, solid line) are depicted. The data are corrected for effects of radioactive decay. Note that activity corresponding to untransformed tracer deviates from total plasma activity as early as 10 minutes postinjection. At the end of the 110-minute experimental period, radiolabeled metabolites reflect more than 75% of total plasma activity.
Uptake and distribution of [11C]NMPB in human brain
Brain uptake of [11C]NMPB demonstrated peak activity levels between 80 and 110 minutes postinjection in all regions (Fig. 4). Initial levels of activity were higher in gray matter structures than in white matter, consistent with the pattern of CBF. Whole brain uptake of [11C]NMPB at 90 to 110 minutes postinjection averaged 10.5% ± 1.4% of the administered dose, corresponding to an average brain concentration of 3 ± 1 nmol (Table 1).
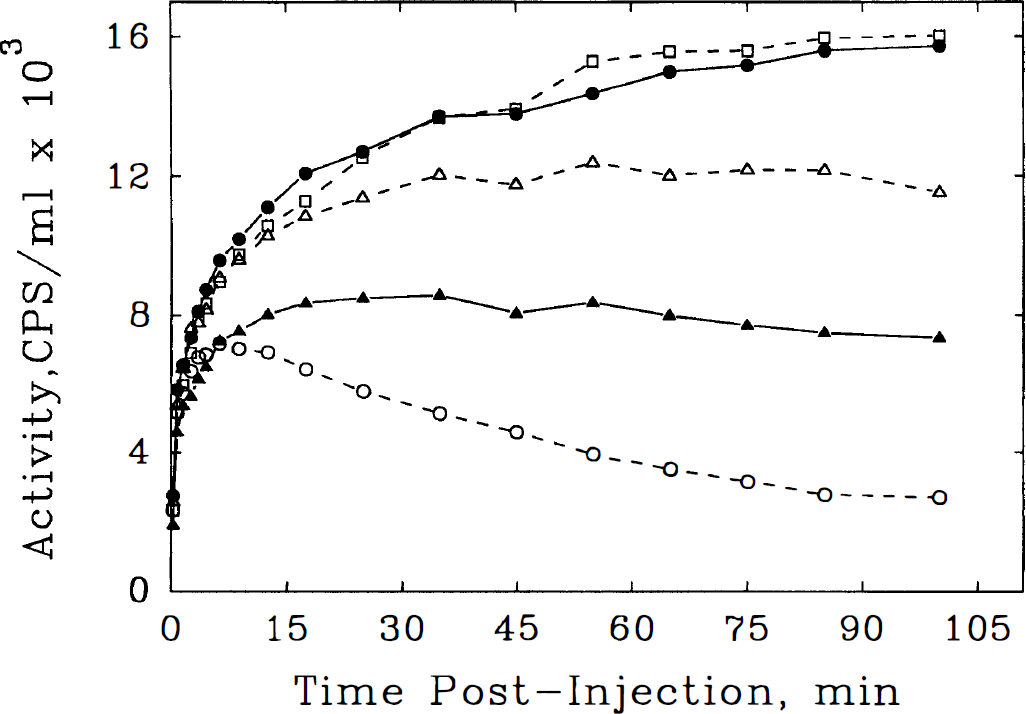
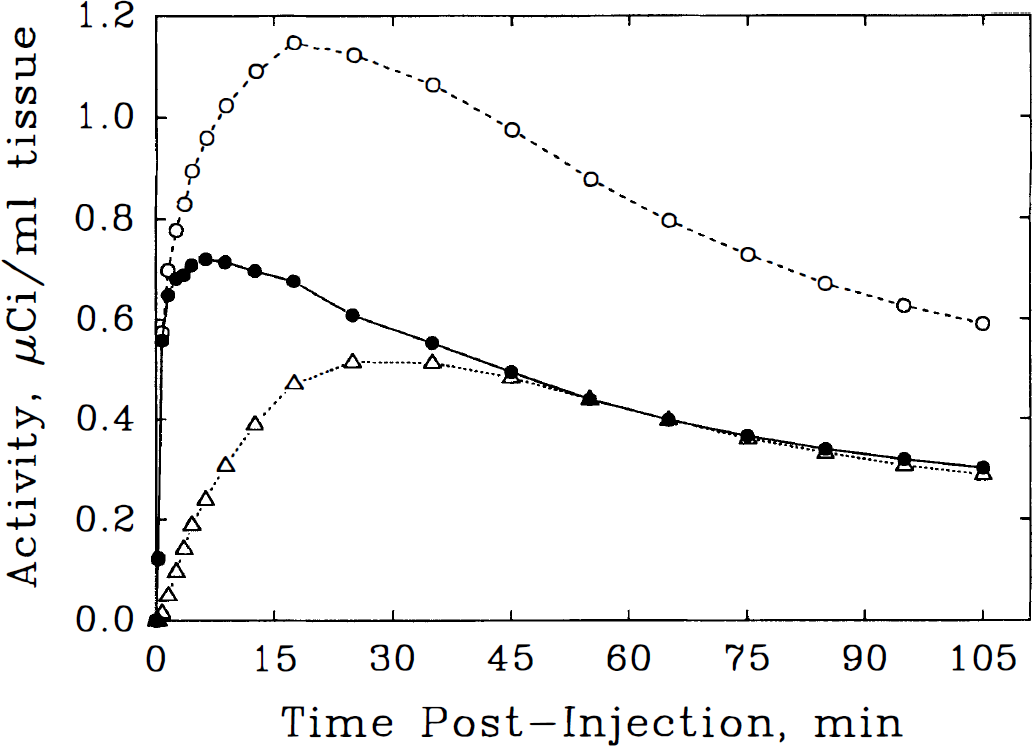
Time course of [11C]N-methyl-4-piperidyl benzylate (NMPB) in brain regions after injection in a representative healthy subject. Decay-corrected tissue time-activity curves are depicted, corresponding to the arterial plasma data presented in Fig. 3, for the occipital cortex (•, solid line), putamen (□, dashed line), thalamus (Δ, dashed line), pons (▶, solid line), and cerebellum (○, dashed line). Initial rate of NMPB uptake from plasma is rapid in all regions. Progressive increases in tissue NMPB concentration are seen until the end of the experimental period in regions of highest receptor density (cortex and striatum), whereas regions of lower receptor density plateau at earlier times (thalamus and pons) or show declining tracer concentration after an initial peak at 10 minutes postinjection (cerebellum).
Whole brain uptake of [11C]NMPB 90 to 110 minutes after injection
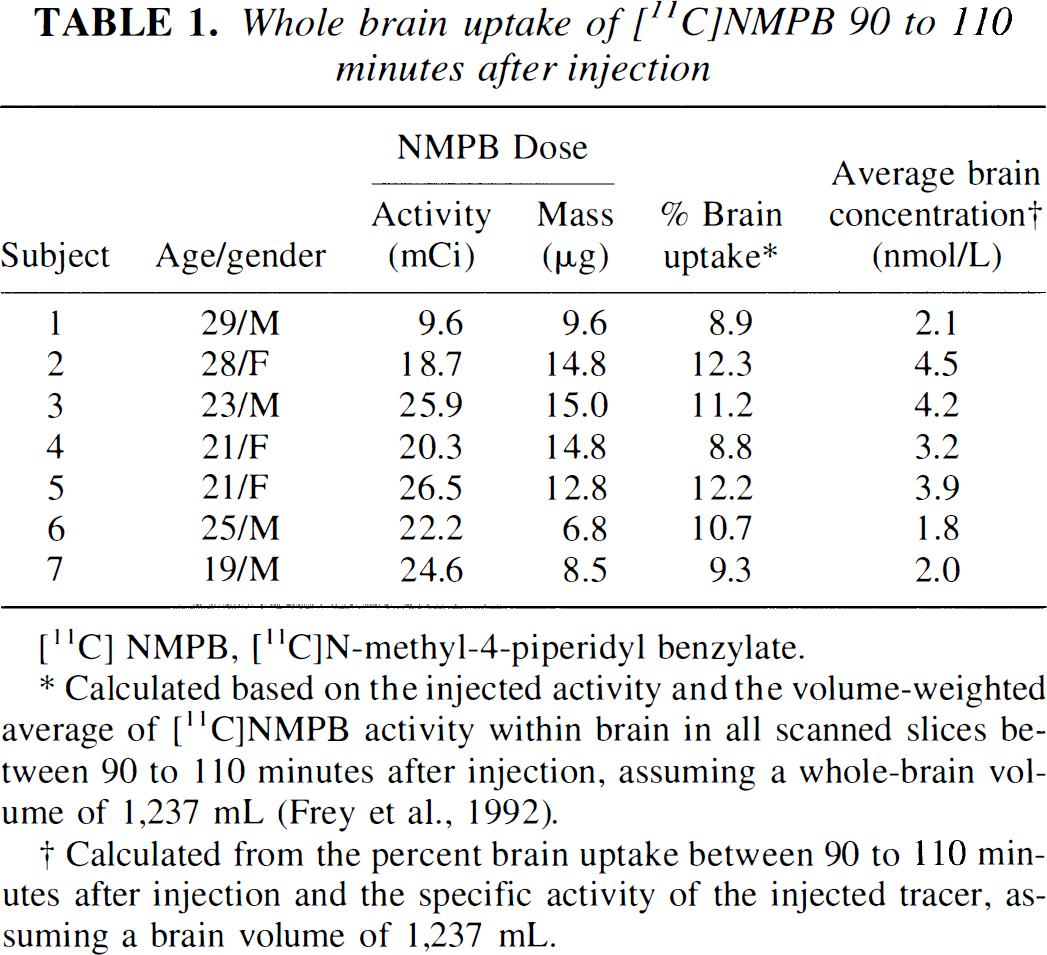
[11C] NMPB, [11C]N-methyl-4-piperidyl benzylate.
Calculated based on the injected activity and the volume-weighted average of [11C]NMPB activity within brain in all scanned slices between 90 to 110 minutes after injection, assuming a whole-brain volume of 1,237 mL (Frey et al., 1992).
Calculated from the percent brain uptake between 90 to 110 minutes after injection and the specific activity of the injected tracer, assuming a brain volume of 1,237 mL.
The regional concentration of [11C]NMPB at 90 to 110 minutes postinjection (Table 2; Fig. 5) was highest in basal ganglia and neocortical regions, intermediate in thalamus and pons, and lowest in the cerebellum, corresponding in rank order to the known distribution of muscarinic receptor densities in human brain (Lin et al., 1986).
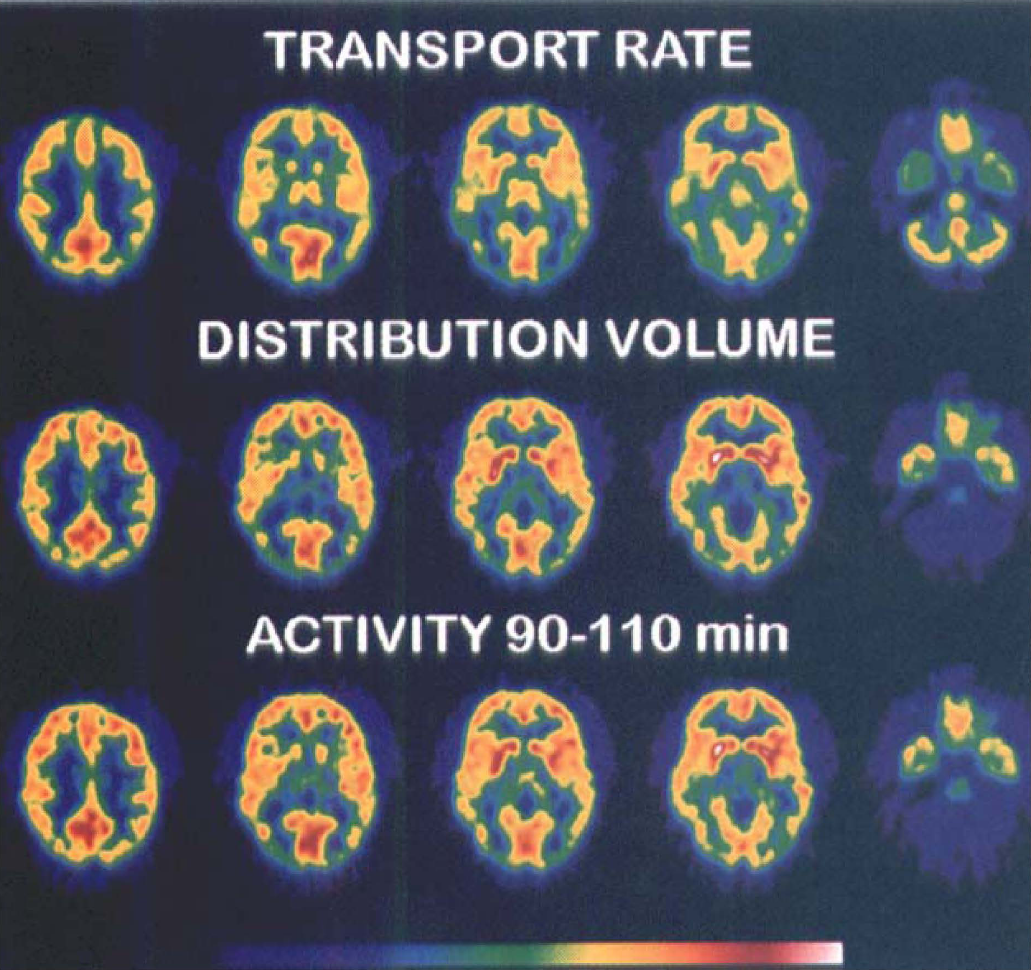
Images of [11C]N-methyl-4-piperidyl benzylate ([11C]NMPB) distribution parameters and activity. Transaxial images of NMPB transport (K1; top row), total tissue distribution volume (DV“; middle row) and delayed tracer concentration (bottom row) are depicted in matching transaxial slices from supra-ventricular (left column) to posterior fossa (right column) levels. Images are displayed in pseudocolor representation according to the scale at the bottom, with highest parameter values or activity levels corresponding to white and red and lowest values corresponding to blue and violet. The distribution of K1 resembles that of cerebral blood flow, with considerably higher values in gray than in white matter. Although the DV” and activity maps appear comparable in the cerebral cortices and striatal patterns, there are lower relative DV” than tracer activity values in the thalamus and cerebellum.
[11C]NMPB Concentration and kinetic parameter estimates from pixel-by-pixel weighted integral analyses
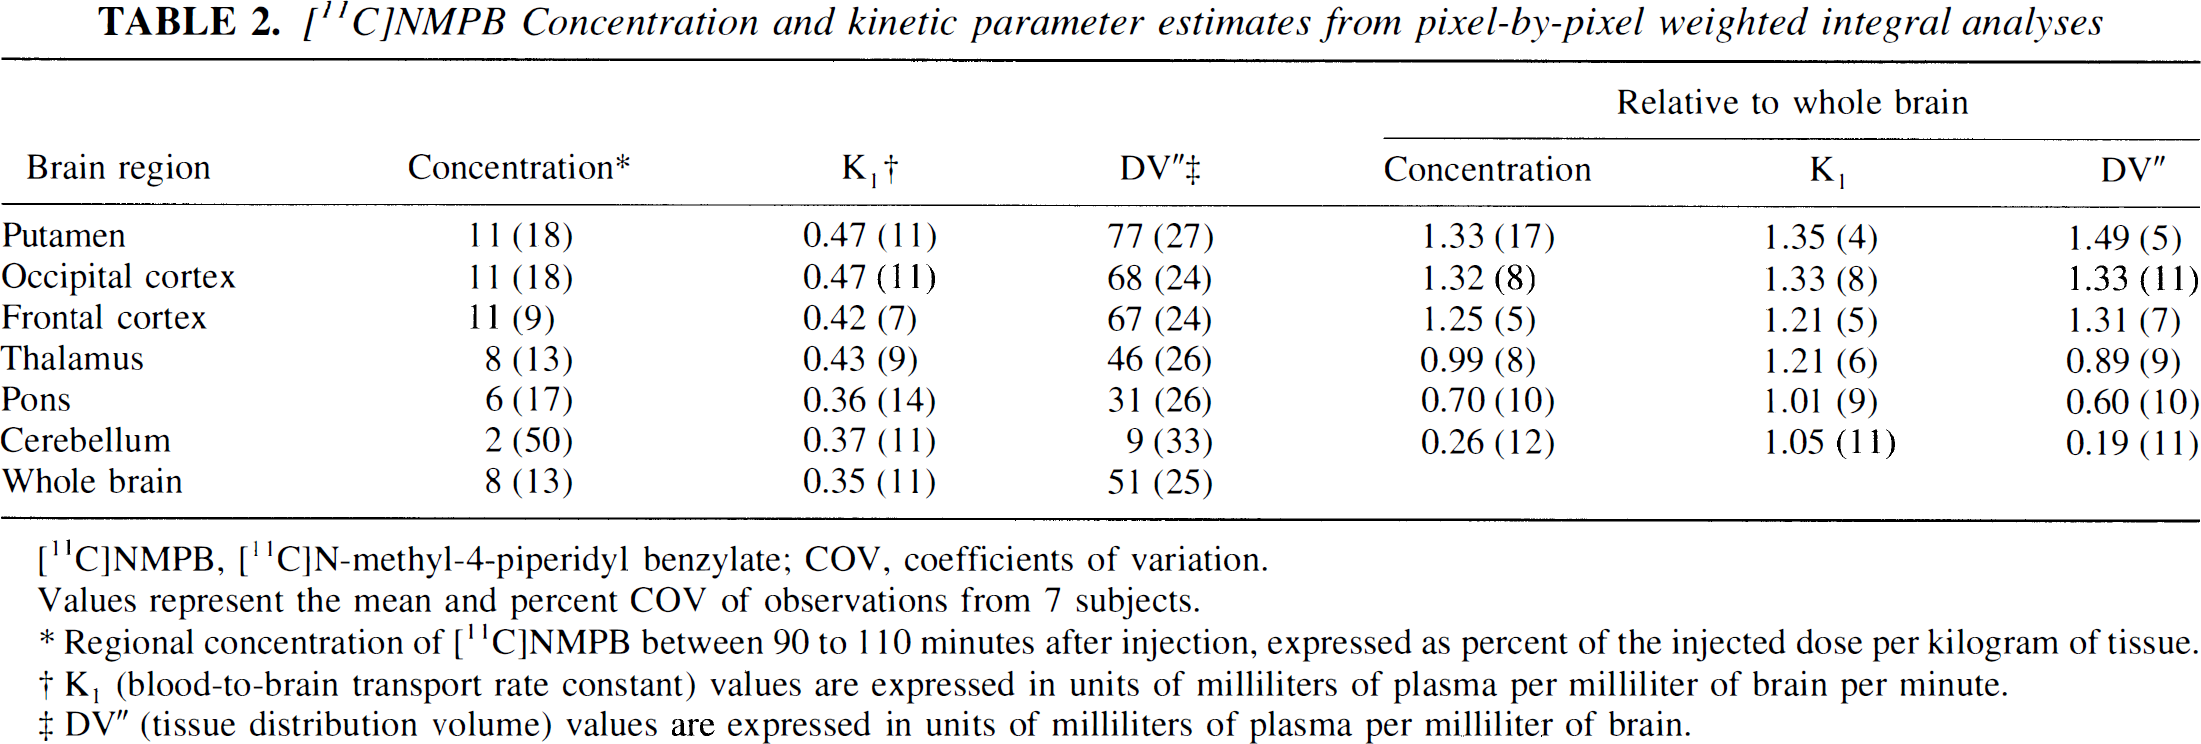
[11C]NMPB, [11C]N-methyl-4-piperidyl benzylate; COV, coefficients of variation.
Values represent the mean and percent COV of observations from 7 subjects.
Regional concentration of [11C]NMPB between 90 to 110 minutes after injection, expressed as percent of the injected dose per kilogram of tissue.
K1 (blood-to-brain transport rate constant) values are expressed in units of milliliters of plasma per milliliter of brain per minute.
DV” (tissue distribution volume) values are expressed in units of milliliters of plasma per milliliter of brain.
Pixel-by-pixel and regional [11C]NMPB-binding estimates
Pixel-by-pixel parametric estimates of NMPB K1 were similar across gray matter brain regions, ranging from 0.36 to 0.47 mL plasma/mL brain/minute, with coefficients of variation (COV) between 7% and 17% (Table 2; Fig. 5). NMPB DV” values corresponded in rank order to the pattern of tracer concentration observed at 90 to 110 minutes postinjection but displayed much broader dynamic range, with COV ranging from 24% (neocortical regions) to 33% (cerebellum). After normalization of regional to whole brain values, COVs were reduced to between 4% and 11% for both K1 and DV”.
Regional, nonlinear least-squares analyses of NMPB kinetics revealed adequate descriptions of the experimental data by both the two- and three-compartment kinetic model configurations. “Goodness-of-fit” estimates were not significantly different for the two model configurations in regions of highest binding, such as the cerebral cortex and striatum. In regions of lower receptor concentration, including the thalamus, pons, and cerebellum, both residual χ2 and Akaike information criterion analyses indicated significantly better descriptions of the data by the three-compartment model. With this model configuration, estimates of K1 and DV' (tissue distribution volume of free and nonspecific binding of NMPB) were similar across regions and revealed between-subject COVs in the range of 10% to 15% (Table 3). Values of the forward binding rate constant, k3', corresponded to the distribution of mAChRs in human brain but were associated with COVs between 35% and 72%. Mean values for the ligand-receptor dissociation rate k4 were similar across the regions studied, ranging from 0.07 to 0.09 min−1, but like k3', demonstrated relatively high variances (COVs of 28–67%), especially in the cerebellum. The ratio of k3'/k4, an estimate of the specific receptor-binding distribution volume (“binding potential” in the nomenclature of Mintun et al., 1984), provided a broad dynamic range of binding estimates, with COVs ranging from 19% in the putamen to 35% in the cerebellum. This parameter better reflects the known in vitro muscarinic receptor distribution than does untransformed [11C]NMPB activity (see Tables 2 and 3).
[11C]NMPB Parameter estimates from three-compartment kinetic model
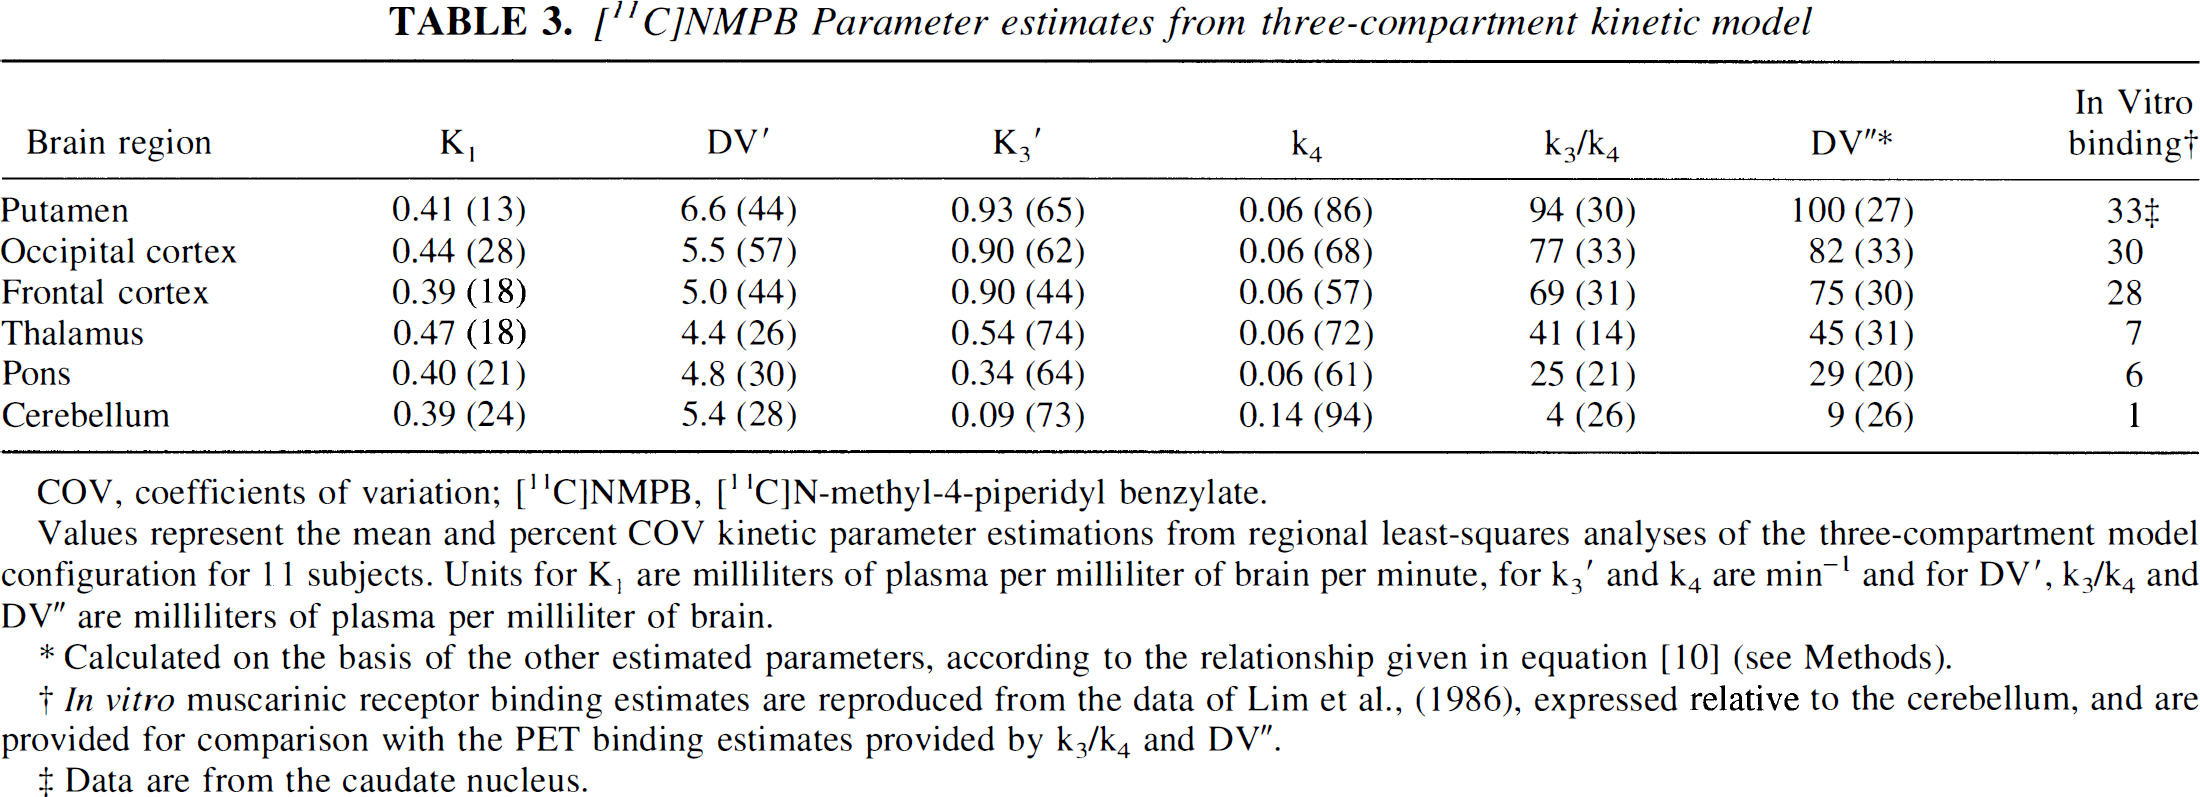
COV, coefficients of variation; [11C]NMPB, [11C]N-methyl-4-piperidyl benzylate.
Values represent the mean and percent COV kinetic parameter estimations from regional least-squares analyses of the three-compartment model configuration for 11 subjects. Units for K1 are milliliters of plasma per milliliter of brain per minute, for k3' and k4 are min−1 and for DV', k3/k4 and DV” are milliliters of plasma per milliliter of brain.
Calculated on the basis of the other estimated parameters, according to the relationship given in equation [10] (see Methods).
In vitro muscarinic receptor binding estimates are reproduced from the data of Lim et al., (1986), expressed relative to the cerebellum, and are provided for comparison with the PET binding estimates provided by k3/k4 and DV“.
Data are from the caudate nucleus.
Precision of NMPB-binding estimates
Estimates of the blood-to-brain NMPB transport rate (K1) were relatively similar across the various kinetic estimation schemes. Parametric values tended to be slightly higher with the regional, three-compartment, nonlinear least-squares procedure than with the pixel-by-pixel-weighted integral method, with intermediate results obtained with the regional two-compartment least-squares method (Tables 4 and 5). The regional between-subject precision of parametric K1 estimates with the three methods was similar, ranging between approximately 10% and 20% COV. After normalization to the global mean, the pixel-by-pixel K1 values demonstrated increased precision, with COVs in the range of 5% to 10%. The brain regional pattern of K1 appeared highly conserved both between subjects as well as within subjects, the latter reflected by interscan differences ranging from − 2% to − 20% (average − 6%). A trend toward reduced transport values in the second of the two sequential studies was noted; however, it did not achieve statistical significance in any region with any of the estimation methods.
Within-subject precision of pixel-by-pixel estimates of [11C]NMPB transport rate and distribution volume
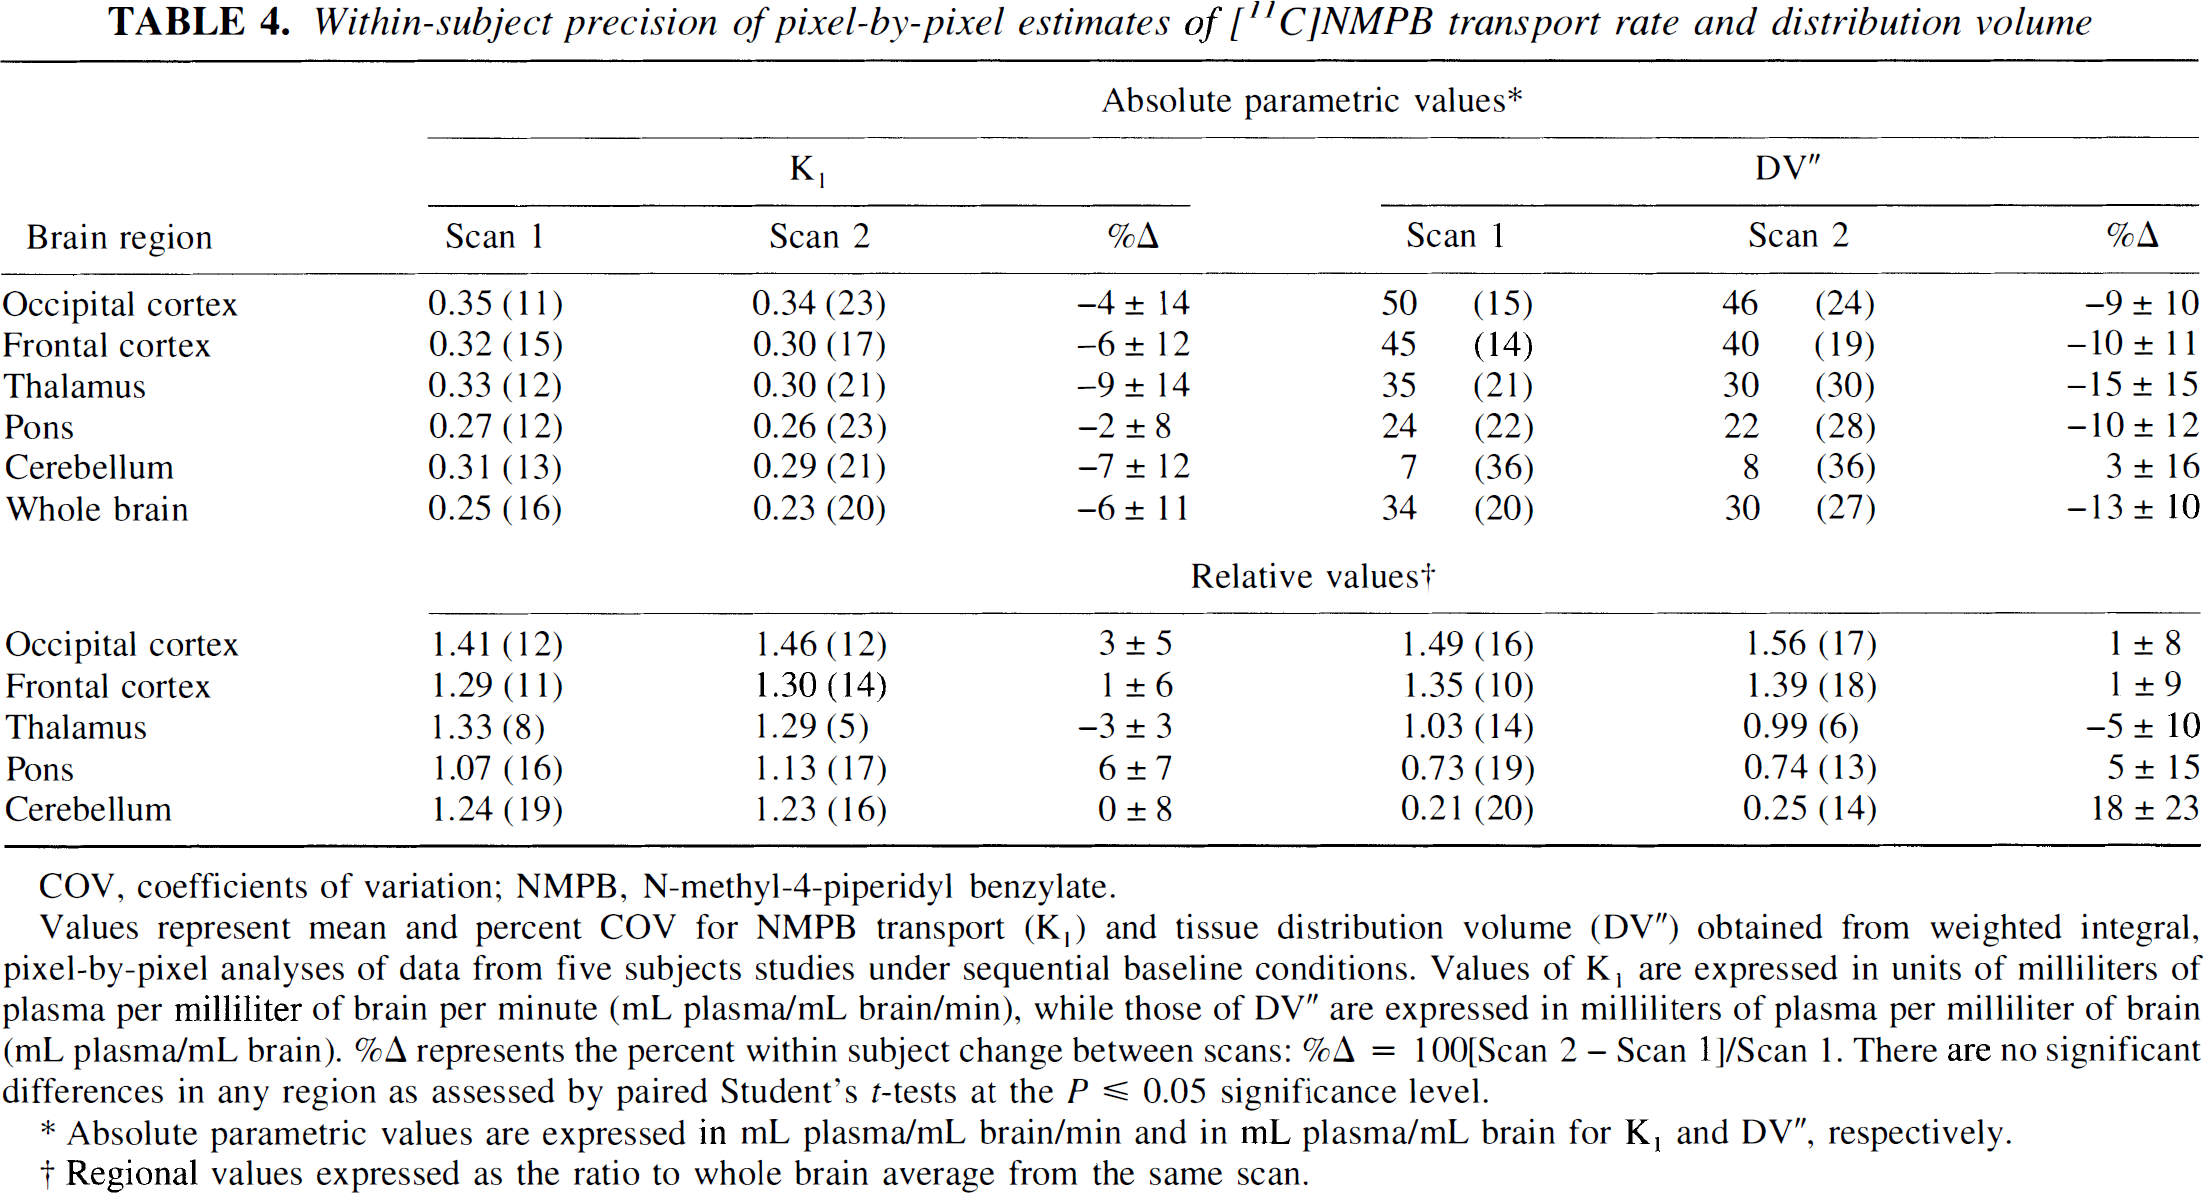
COV, coefficients of variation; NMPB, N-methyl-4-piperidyl benzylate.
Values represent mean and percent COV for NMPB transport (K1) and tissue distribution volume (DV“) obtained from weighted integral, pixel-by-pixel analyses of data from five subjects studies under sequential baseline conditions. Values of K1 are expressed in units of milliliters of plasma per milliliter of brain per minute (mL plasma/mL brain/min), while those of DV” are expressed in milliliters of plasma per milliliter of brain (mL plasma/mL brain). %D represents the percent within subject change between scans: %Δ = 100[Scan 2 − Scan 1]/Scan 1. There are no significant differences in any region as assessed by paired Student's t-tests at the P ≤ 0.05 significance level.
Absolute parametric values are expressed in mL plasma/mL brain/min and in mL plasma/mL brain for K1 and DV”, respectively.
Regional values expressed as the ratio to whole brain average from the same scan.
Within-subject precision of least-squares estimates of [11C]NMPB kinetic parameters
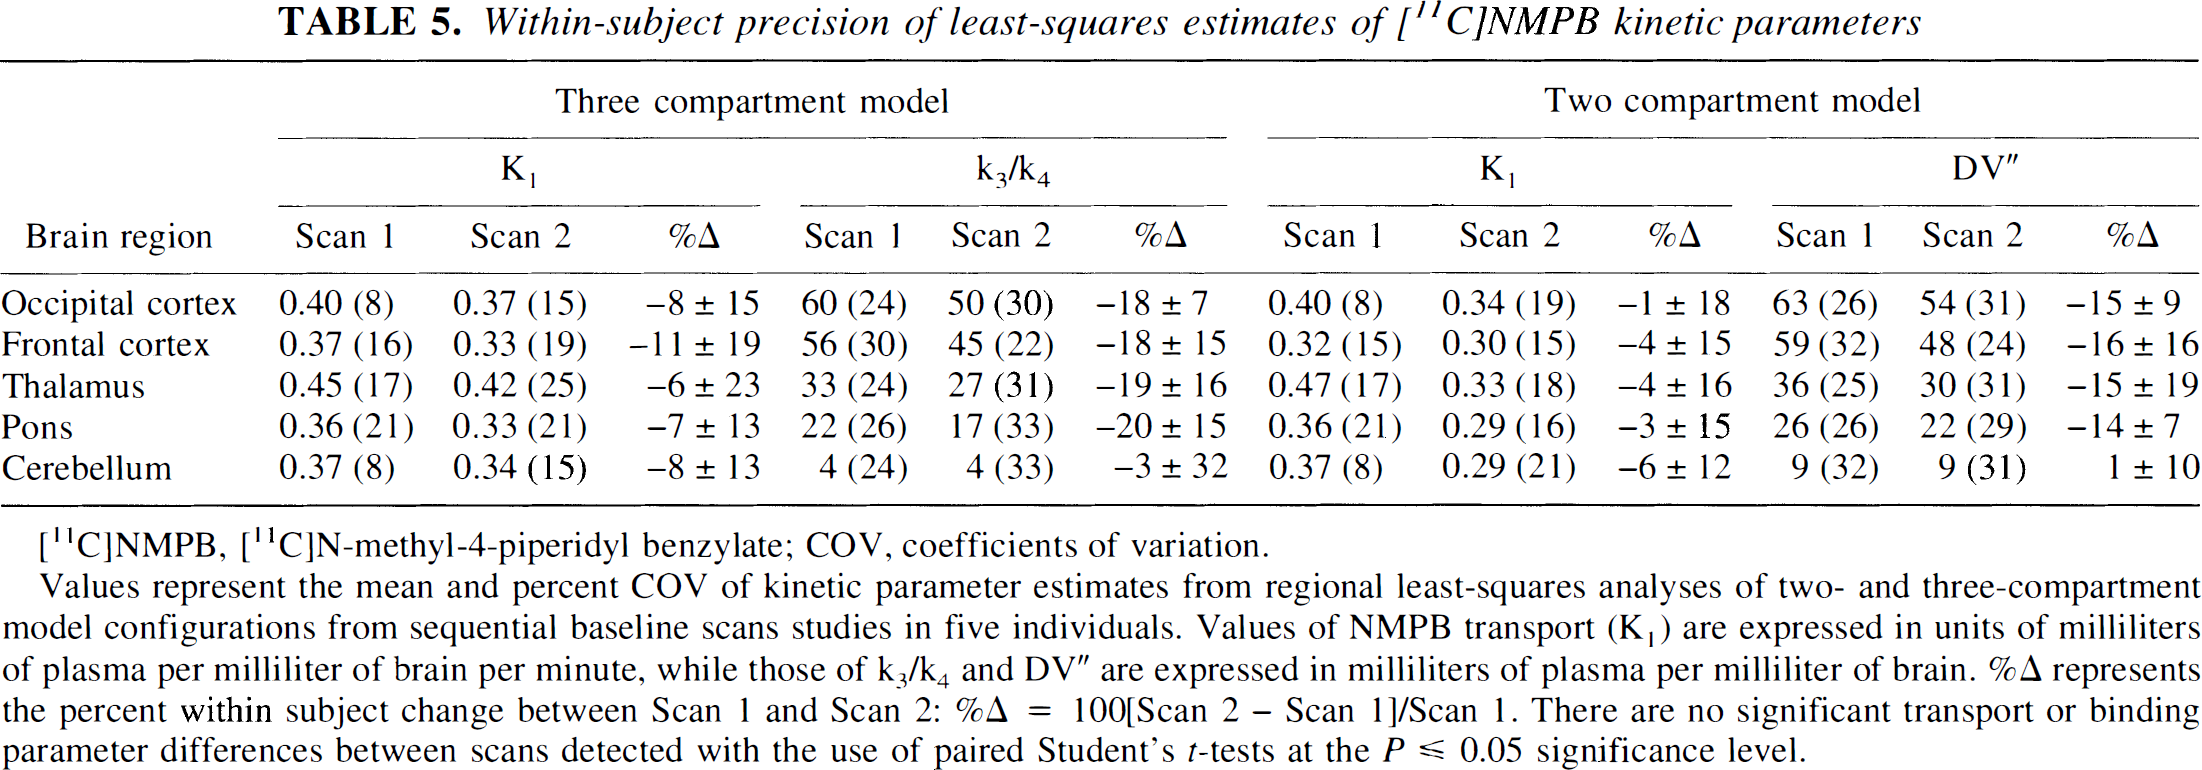
[11C]NMPB, [11C]N-methyl-4-piperidyl benzylate; COV, coefficients of variation.
Values represent the mean and percent COV of kinetic parameter estimates from regional least-squares analyses of two- and three-compartment model configurations from sequential baseline scans studies in five individuals. Values of NMPB transport (K1) are expressed in units of milliliters of plasma per milliliter of brain per minute, while those of k3/k4 and DV” are expressed in milliliters of plasma per milliliter of brain. %Δ represents the percent within subject change between Scan 1 and Scan 2: %Δ = 100[Scan 2 - Scan 1]/Scan 1. There are no significant transport or binding parameter differences between scans detected with the use of paired Student's t-tests at the P ≤ 0.05 significance level.
The ranges and precision of mAChR density estimates varied more extensively between the three analytic methods than did the estimates of ligand transport. There was progressive increase in the dynamic range of receptor density estimates from the pixel-by-pixel-weighted integral (DV') to the two-compartment regional least-squares (DV') to the three-compartment regional least-squares analyses (k3'/k4). The greatest distinction, that between the latter two procedures, is attributable to isolation of specific from the nonsaturable ligand distribution pools in the three-compartment configuration. In general, the between-subject precision of the three methods was similar in the forebrain regions, ranging between 20% and 30% COV. Variances in cerebellar binding estimates were greater with all three methods (COVs 30–47%), owing to the low levels of mAChRs present (Lin et al., 1986). Within-subject precision of the parametric binding estimates appeared higher with the pixel-by-pixel procedure (range, − 6–10% interscan average differences) than with the least-squares regional procedures (−22–16% average differences). Normalization of the pixel-by-pixel DV” estimates provided further reduction in forebrain intrasubject mean differences to between − 5% and 1%. No significant differences were identified between the sequential scans within subjects for any brain region with any of the analysis procedures.
Distinction of NMPB transport and binding in occipital cortex
Visual stimulation resulted in increased primary visual cortex CBF of 74% ± 34% and 51% ± 12%, for absolute and normalized (to global activity) CBF estimates, respectively.
Analyses of the relative (expressed as a ratio to the cerebellum) NMPB distribution between 90 and 110 minutes postinjection in the primary visual cortex revealed a 28% increase during visual stimulation. Relative occipital uptake in the eyes open condition was 7.2 ± 1.7 (mean ± SD) compared with 5.6 ± 0.6 in the eyes closed state (P < 0.05, paired Student's t test). In the frontal cortex, visual simulation was without effect on NMPB activity (4.7 ± 2.3 versus 5.3 ± 0.6 in the stimulated and eyes closed states, respectively).
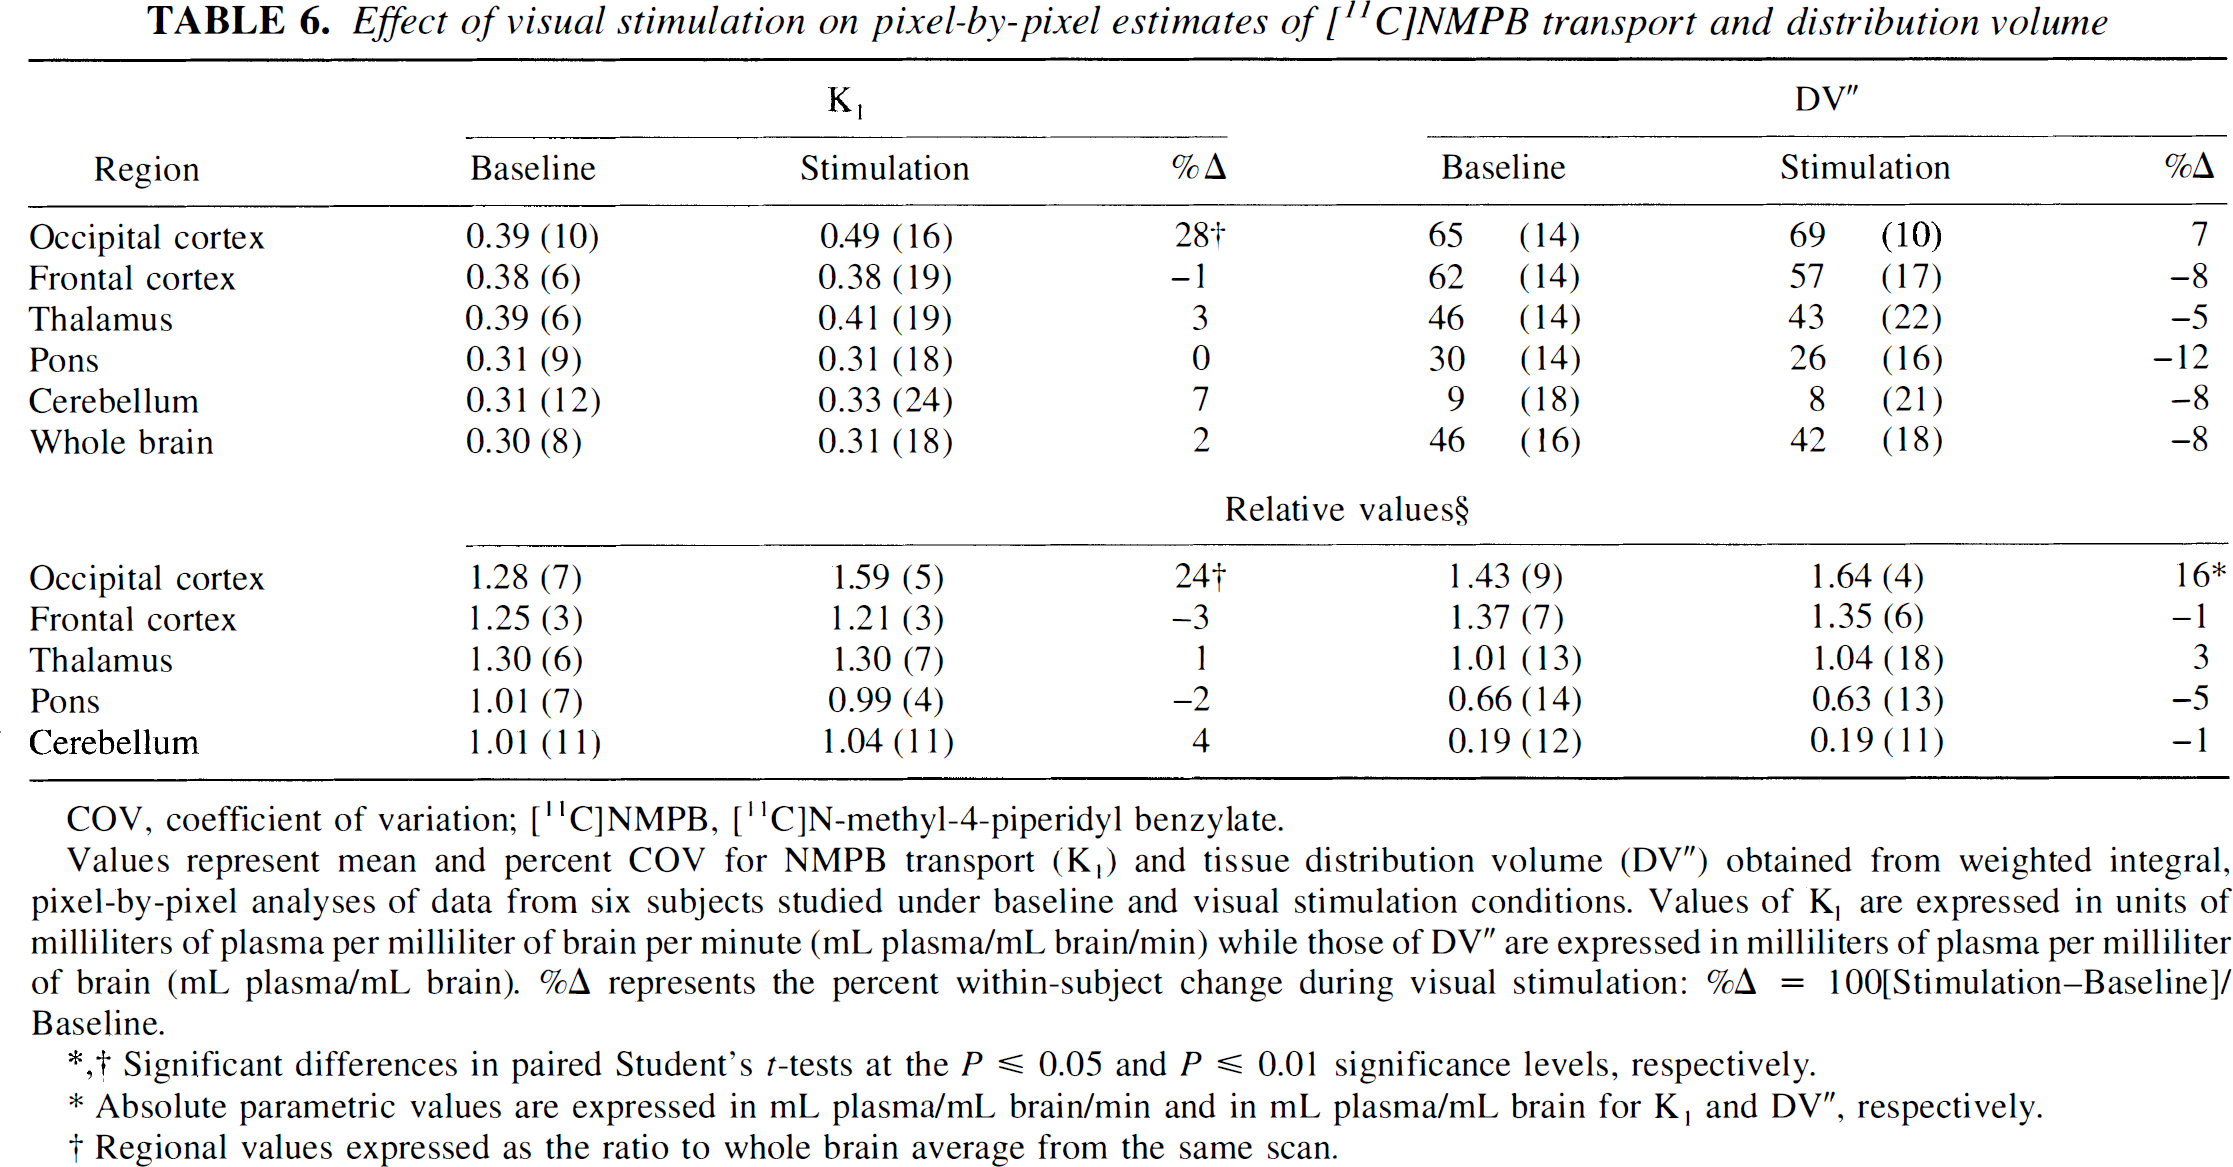
Pixel-by-pixel—weighted integral tracer kinetic analyses indicated a significant apparent [11C]NMPB transport rate (K1) increase of 28% and 24% in the primary visual cortex for absolute and normalized (to whole brain) estimates, respectively (Table 6, Fig. 6). The apparent increases in K1 averaged 39% and 46% in the occipital cortex, as estimated with the regional, two-compartment and three-compartment model, least-squares procedures, respectively (Table 7).
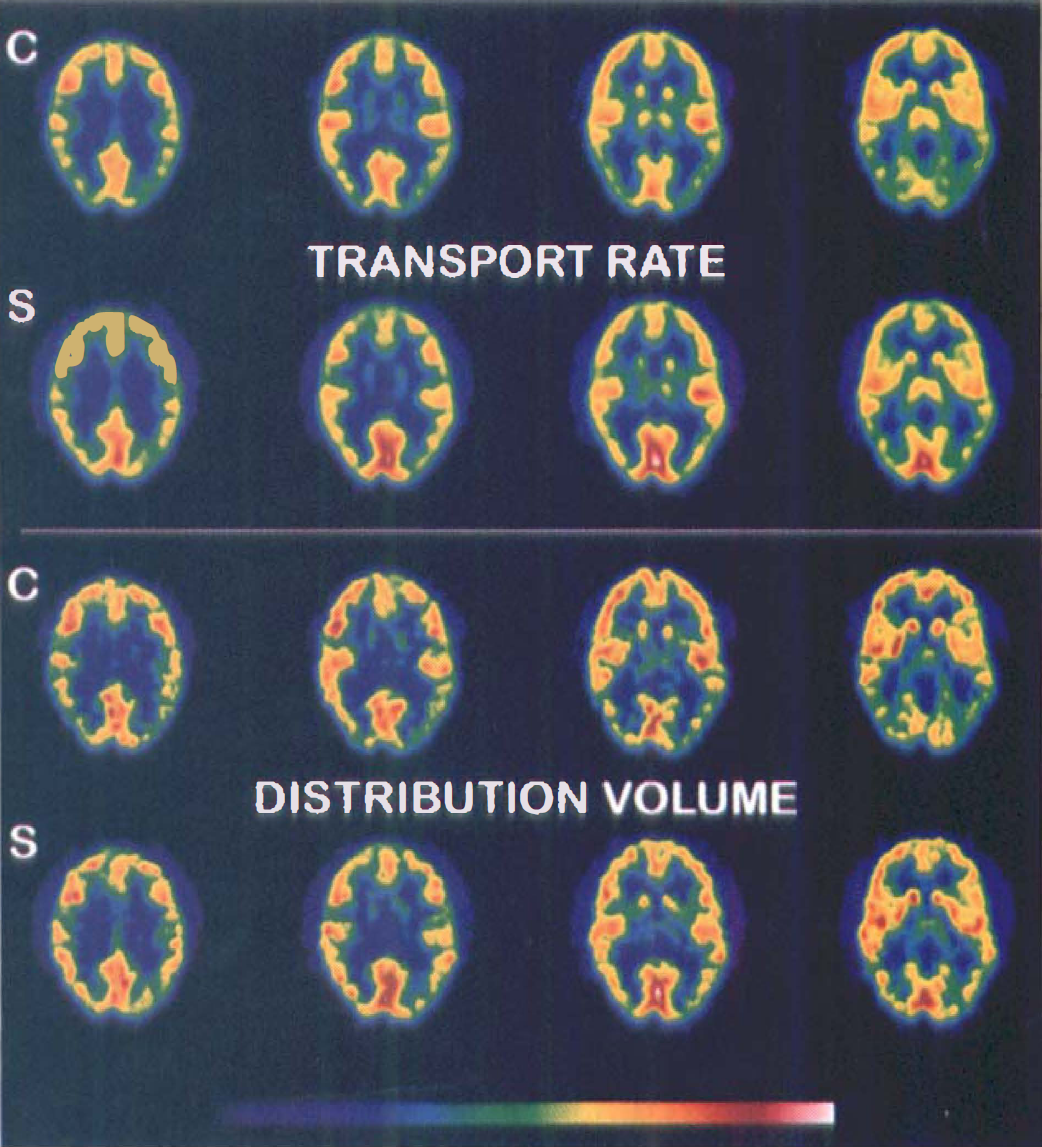
Parametric images of [11C]N-methyl-4-piperidyl benzylate ([11C]NMPB) transport and distribution volume in a representative subject under eyes-closed control conditions (C), and again during visual stimulation (S). Each row of images represents four adjacent transaxial levels through the primary visual cortex (from most superior on left to inferior on right) selected from sets of 15 simultaneously scanned planes. Top: Note increased NMPB transport rate in the visual cortex during stimulation, attributable to augmented cerebral blood flow. Bottom: The NMPB distribution volume images demonstrate a minor, yet statistically-significant increase in the visual cortex during stimulation.
Effect of visual stimulation on pixel-by-pixel estimates of [11C]NMPB transport and distribution volume
COV, coefficient of variation; [11C]NMPB, [11C]N-methyl-4-piperidyl benzylate.
Values represent mean and percent COV for NMPB transport (K1) and tissue distribution volume (DV“) obtained from weighted integral, pixel-by-pixel analyses of data from six subjects studied under baseline and visual stimulation conditions. Values of K1 are expressed in units of milliliters of plasma per milliliter of brain per minute (mL plasma/mL brain/min) while those of DV” are expressed in milliliters of plasma per milliliter of brain (mL plasma/mL brain). %Δ represents the percent within-subject change during visual stimulation: %Δ = 100[Stimulation—Baseline]/Baseline.
Significant differences in paired Student's t-tests at the P ≤ 0.05 and P ≤ 0.01 significance levels, respectively.
Absolute parametric values are expressed in mL plasma/mL brain/min and in mL plasma/mL brain for K1 and DV”, respectively.
Regional values expressed as the ratio to whole brain average from the same scan.
Effect of visual stimulation on regional least-squares estimates of [11C]NMPB kinetic parameters
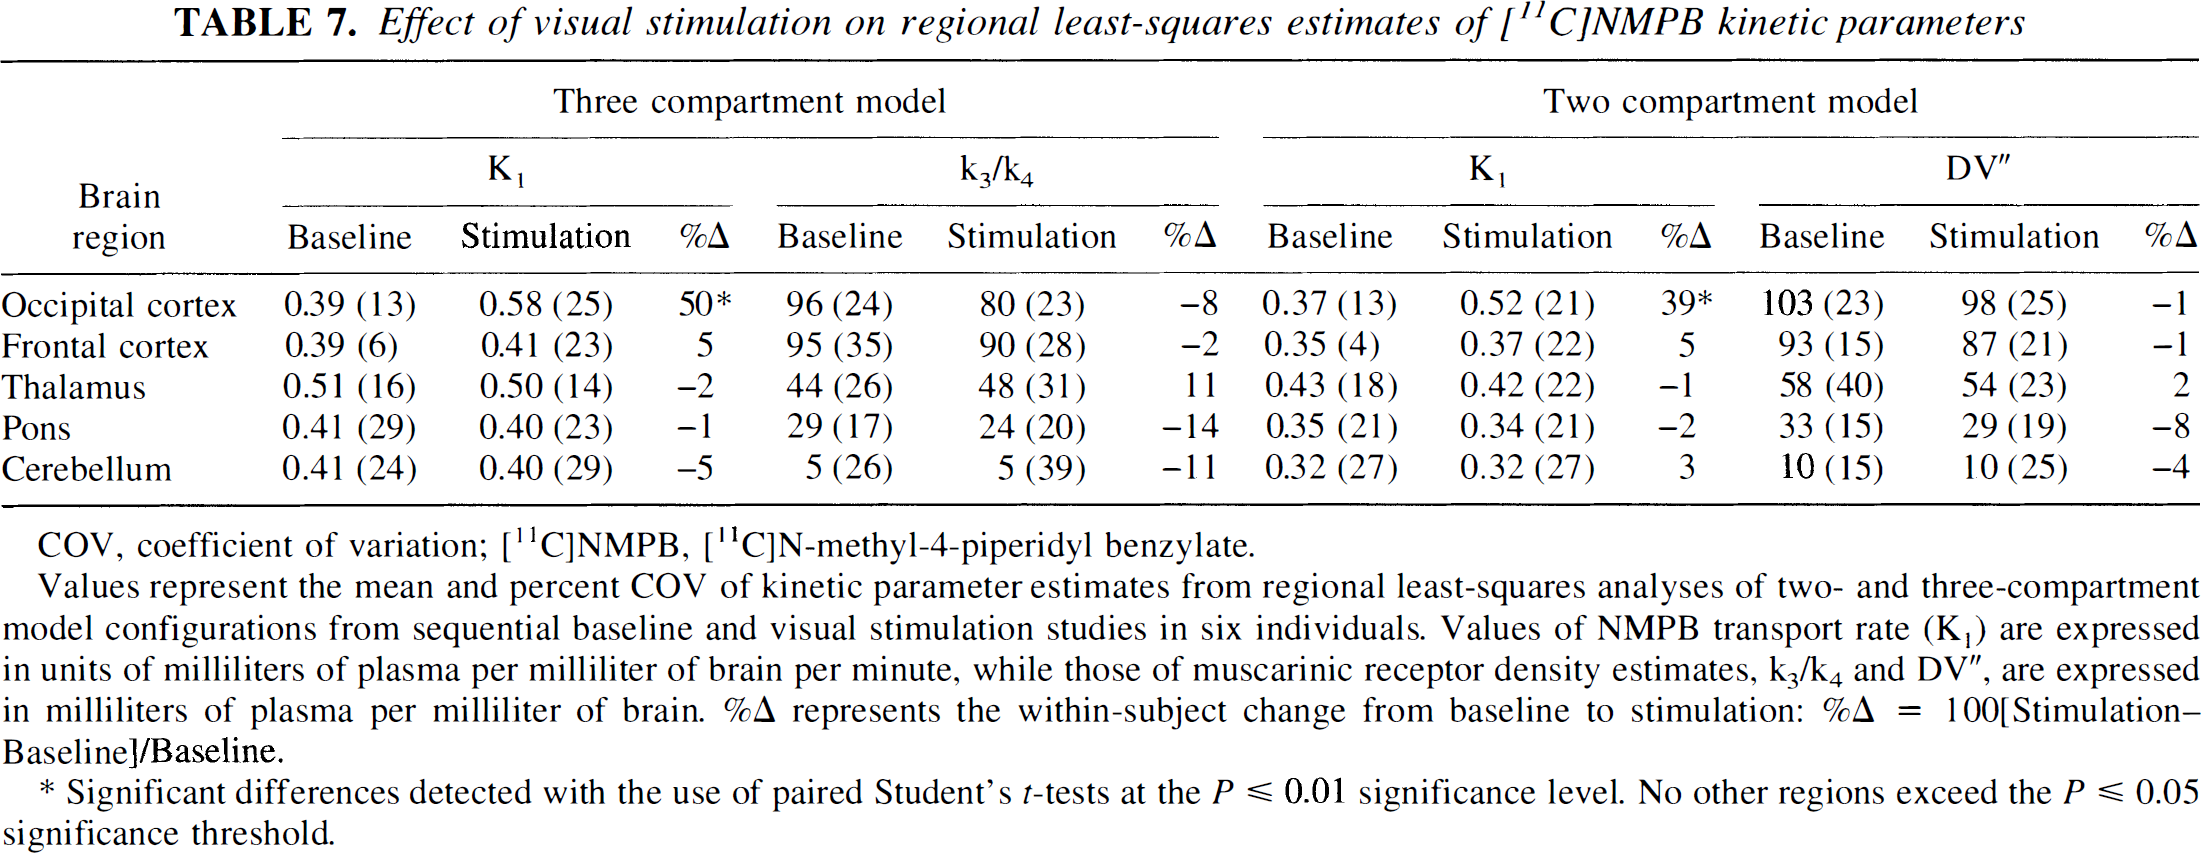
COV, coefficient of variation; [11C]NMPB, [11C]N-methyl-4-piperidyl benzylate.
Values represent the mean and percent COV of kinetic parameter estimates from regional least-squares analyses of two- and three-compartment model configurations from sequential baseline and visual stimulation studies in six individuals. Values of NMPB transport rate (K1) are expressed in units of milliliters of plasma per milliliter of brain per minute, while those of muscarinic receptor density estimates, k3/k4 and DV”, are expressed in milliliters of plasma per milliliter of brain. %Δ represents the within-subject change from baseline to stimulation: %Δ = 100[Stimulation—Baseline]/Baseline.
Significant differences detected with the use of paired Student's t-tests at the P ≤ 0.01 significance level. No other regions exceed the P ≤ 0.05 significance threshold.
Binding parameter values obtained from the pixel-by-pixel—weighted integral analysis suggested an insignificant 7% increase in the absolute DV” in the occipital cortex during visual stimulation. After normalization to whole-brain DV”, the relative occipital cortical estimate increased by 16% (P < 0.05) during visual stimulation. No other regional changes in DV” were identified in either absolute or normalized estimates. Both the regional two- and three-compartment least-squares procedures suggested lack of change in occipital cortical binding during visual activation, with negative (rather than positive), insignificant mean differences of − 1% and − 6% between scans, respectively.
DISCUSSION
The present studies describe methodology for kinetic determinations of muscarinic receptor binding from the time courses of [11C]NMPB activities in arterial blood and brain. Of the analytic strategies for estimating receptor availability tested, we identified the best fidelity and precision from the application of regional, nonlinear, least-squares fitting of either two- or three-compartment kinetic models (Table 3). Our findings indicate that NMPB may be applied successfully to in vivo muscarinic receptor quantification; however, arterial blood sampling to determine the cerebral tracer input function is essential to the extraction of unbiased binding estimates. Nonlinear, least-squares kinetic analysis of simple compartmental models permits distinction of tracer transport from its tissue binding, even in regions of high receptor concentration, such as the cerebral neocortex. However, mathematically constrained kinetic analyses, methods employing reference brain regions for input function estimation, or simple tracer activity level analyses are insufficient to eliminate transport (blood flow) biases from binding estimates, as demonstrated by the effects of visual stimulation on the occipital distribution of NMPB in our experiments. However, the present studies do not independently verify the saturable nature of the binding parameters. This would require the administration of pharmacologically significant doses of unlabeled blockers, and complete blockade may be expected to produce severe side effects and toxicity (see discussion in Frey et al., 1992).
Results of the most detailed compartmental model analyzed indicate the presence of substantial specific binding of NMPB in essentially all gray matter regions. Even in the cerebellum, where muscarinic receptor concentration is the lowest of the major cerebral structures (Lin et al., 1986), there is appreciable apparent binding of NPMB. As a consequence, methods of analysis that rely on the use of cerebellar curves to estimate the arterial tracer time course (Shinotoh et al., 1994; Suhara et al., 1993; 1994) may be in substantial error and are additionally sensitive to changes in cerebellar receptor concentration or blood flow. This is illustrated by the predicted time courses of total versus free [11C]NMPB arising from a typical arterial time-activity input curve and the population-average cerebellar intercompartmental exchange rate constants (Fig. 7). Within minutes after injection of NMPB, a substantial portion of cerebellar activity is bound, and after 45 minutes postinjection, bound and free tracer levels essentially are equal. Thus, there is a time-dependent and significant distinction between the total and the actual free cerebellar NMPB curves. A further problem with strategies employing a tissue “reference” region in lieu of arterial blood sampling is illustrated by considering tracer pools in receptor-rich areas such as the striatum (Fig. 8). In this instance, it is evident that rapid NMPB binding depletes tracer from the free and nonspecific binding pools throughout the study. Thus, even if a cerebral region entirely devoid of muscarinic receptors could be identified, the level and time-course of activity would not provide an accurate estimate of the free NMPB levels in tissues with receptors. Arterial blood sampling and compartmental analysis are, therefore, essential in obtaining accurate in vivo receptor-binding estimates with NMPB and similar tracers. In recent compartmental kinetic analyses of the muscarinic receptor antagonist [11C]tropanyl benzilate (Lee et al., 1996), for example, we failed to verify the age-related receptor declines suggested by the cerebellar reference approach (Suhara et al., 1993). Here, in addition to the aforementioned kinetic issues, an apparent change in the reference region may have accounted for most of the reported cerebral binding decline.
Model-based simulation of cerebellar [11C]N-methyl-4-piperidyl benzylate (NMPB) activity curves. Total tissue tracer (○, dashed line), free plus nonspecifically bound tracer (•, solid line), and receptor-bound NMPB (Δ, dotted line) are depicted with the use of the population-average three-compartment kinetic model parameters from Table 3 and a typical arterial input function. There is a considerable fraction of bound activity, despite the low cerebellar receptor concentration. This renders the total and free tracer activity curves distinct in both shape and in scale.
Model-based simulation of putaminal NMPB activity curves. Total tracer (○, dashed line), receptor-bound tracer (Δ, dotted line) and free plus nonspecifically bound NMPB (•, solid line) are depicted from model-based projections as described in the legend to Fig. 7. Note that in regions of very high receptor concentration, there is little difference between total and receptor-bound tracer levels. Inset: Comparison of free plus nonspecifically bound NMPB in cerebellum and putamen. There are major distinctions in both shape and scale of the activities in the two regions, precluding use of the cerebellum as a valid estimator of binding precursor levels in receptor-rich regions.
In comparison with muscarinic receptor ligands studied previously in our laboratory (Frey et al., 1992; Koeppe et al., 1993), there is improved differentiation of binding with NMPB (as reflected either by k3'/k4 or by DV“) between brain regions with low (cerebellum), intermediate (pons and thalamus), and high (neocortex, basal ganglia) mAChR concentration. Thus, the kinetic properties of [11C]NMPB appear very favorable for assessment of muscarinic receptors in the range of concentrations encountered in the human brain. In the instance of between-subject comparisons of binding, the precision of k3'/k4 ratios (COVs from 20–35%) is superior to that of k3' estimates (COVs of 35–70%), as reported previously by Mintun et al. (1984) in kinetic studies of dopamine D2 receptor binding. Of particular note, estimates of the NMPB dissociation rate from receptors (k4 values 0.07 to 0.09 min−1 are higher than those found either for [11C]scopolamine (negligible dissociation over 3 hours in rat brain; Frey et al., 1985) or for [11C]tropanyl benzilate (less than 0.02 min−1 in human brain; Koeppe et al., 1994). This property allows more accurate definition of ligand-receptor dissociation rates during the limited scanning interval permitted with the use of 11C-labeled tracers. Thus, NMPB provides better statistical estimates of the binding potential (k3'/k4) and better satisfies the assumptions underlying the two-compartment simplification of the tracer kinetic model (Fig. 1) than do the other agents.
Our modeling experiments objectively evaluated the independence of binding estimates from tracer transport effects employing physiologic visual activation. Using the pixel-by-pixel—weighted integral analysis, a small increase in apparent receptor binding was noted in the primary visual cortex as a result of stimulation. This effect was statistically significant after normalization to whole-brain average binding values because of the reduction in variance achieved with this procedure. Such apparent receptor differences are not anticipated under normal physiologic conditions and were not apparent when the least-squares regional analyses were applied to the same data. Most likely, some tracer transport effects are propagated procedurally into the receptor-binding parameter in the pixel-by-pixel procedure. The effect may be most pronounced in regions of high receptor density (i.e., cerebral cortex or striatum), where bound radiotracer dominates the tissue time-activity curves, and minor errors in estimation of tracer delivery have limited impact on the overall goodness of fit. Thus, details of the pixel-by-pixel procedure, including absence of tracer arrival time-shift correction and lack of a blood volume correction, may have resulted in biases not seen in the regional fits, where these additional factors were taken into consideration. As indicated in the Methods section, our modification of the look-up table approach used in the pixel-by-pixel parametric K1 and DV” maps causes underestimation of DV” in high receptor density regions. Without the roll-off modification, parameter maps are unacceptably noisy and difficult to visually analyze. Therefore, despite the bias, the ability to view functional parametric images of the entire brain is important for detection of unanticipated changes. If abnormalities are seen in DV” maps, subsequent region-of-interest analyses can be made to provide more accurate binding estimates. In addition, as mentioned previously, the degree of bias in our parametric maps is less than that introduced by graphical or region ratio-to-cerebellum analyses.
Regional least-squares fitting with either two- or three-compartment models resulted in comparable estimates of NMPB transport and binding. Distribution volume values from two-compartment fits were not affected significantly by visual stimulation. In the occipital cortex, the observed mean change in DV” (−1%) was well within the average intrasubject variation noted for other, nonstimulated brain regions (4–12%). Similar results were obtained with the three-compartment model configuration. In this analysis, binding potential (k3'/k4; Bmax'/Kd) differences did not change significantly during visual stimulation (−6% difference from baseline), again, well within the range of binding variances in remote brain regions or in the test-retest control experiments. These observations suggest that excellent physiologic fidelity and relative insensitivity to the confounding effects of blood flow alterations are obtainable with either two- or three-compartment models and regional least-squares fitting analyses.
Our results indicate the potential for accurate and precise determinations of muscarinic receptor binding in the living human brain with the use of [11C]NMPB and PET. This promising radioligand yields valid binding estimates, however, only in experimental designs incorporating direct determinations of the arterial tracer input function and employing subsequent compartmental analyses of plasma and cerebral time-activity curves. The best analytic procedure for obtaining unbiased binding estimates is with the use of a three-compartment model to estimate the binding potential parameter. More simplified analytic schemes include some bias from tracer delivery (pixel-by-pixel—weighted integral method) or fail to separate specific binding form nonsaturable tissue tracer pools (both two-compartment analyses). However, a potential limitation of the three-compartment model, as implemented here, is its inability to provide images of the binding and ligand transport parameters. Thus, in future applications, it may be of benefit to calculate and survey pixel-by-pixel K1 and DV” maps to identify potential areas of change, followed by regional three-compartment fits to objectively distinguish receptor-binding changes from alterations in the delivery of radiotracer.