
Abstract
The positron emission tomography (PET) ligand [11C]MDL 100,907 has previously been introduced to image the
Introduction
The serotonin 2A (5-HT2A) receptor has been implicated both in the pathophysiology of depression and in the mode of action of the atypical antipsychotics. The gene for the receptor is located on chromosome 13q14–q21 (Hsieh et al, 1990), and the receptor has a relatively high amino-acid sequence homology with the human 5-HT2C receptor. The 5-HT2A receptor has been localized throughout the brain, including cortical areas (neocortex, entorhinal and pyriform cortex, claustrum), caudate nucleus, nucleus accumbens, olfactory tubercle and hippocampus with little species differences (Pazos et al, 1985). Its cellular localization is on GABAergic neurons (Francis et al, 1992; Morilak et al, 1993, 1994) and glutamatergic cortical pyramidal (projection) neurons (Burnet et al, 1995; Wright et al, 1995).
Evidence for the role of the 5-HT2A receptor in the aetiology of depressive illness comes from postmortem studies and also brain imaging experiments. The interpretation of the post-mortem data is confounded by the fact that these studies did not always clearly distinguish the overlap in the subjects of suicide and depression. Nevertheless, the bulk of evidence suggests that there seems to be a trend for increased 5-HT2A binding in the prefrontal cortex and possibly the hippocampus (for a review, see Meltzer et al, 1998). In contrast to the postmortem work, most imaging studies in depressed patients have found either no change or a decrease in 5-HT2A receptor binding in cerebral cortex (see Stockmeier, 2003 for a review). However, methodological problems related to the available radioligands as well as the use of psychotropic medications before scanning (Stockmeier, 2003) limit the conclusions that can be drawn from these studies. In support of this notion, a recent study of acutely depressed patients who were drug free for more than 3 months found increased 5-HT2A receptor binding in frontal cortex in subjects with high scores on the dysfunctional attitudes scale (Meyer et al, 2003).
A recent advance in the imaging of the 5-HT2A receptor has been the introduction of [11C]MDL 100,907, which is the most selective of the 5-HT2A receptor PET ligands available. Initial studies with this PET ligand have revealed high-quality images of receptor availability, which correspond well with the known distribution of 5-HT2A binding sites from post-mortem studies (Mathis et al, 1996; Lundkvist et al, 1996; Watabe et al, 2000b). In vitro MDL 100.907 is moderately lipophilic (logp of 2.7) and binds with subnanomolar affinity to 5-HT2A receptors (Ki 0.2 nmol/L), but its affinity for other putative receptors is at least 100 times lower. Imaging studies in man show that it binds specifically and reversibly to 5-HT2A receptors with high specific to nonspecific binding (Ito et al, 1998; Mawlawi et al, 2001). More recently, new methods for fast functional parametric mapping of [11C]MDL 100,907 binding by multilinear analysis (Ichise et al, 2002) or rank-shaped regularized spectral analysis (Turkheimer et al, 2003) were presented, which allow to use a reference tissue input function. These methods were devised to reduce the noise-induced bias in conventional graphical analysis (Slifstein and Laruelle, 2000) and to be applicable to tracers with slow kinetics.
While a number of issues regarding the quantification of [11C]MDL 100,907 have been clarified, a final validation of the method of quantification of HT2A receptors in human brain with PET is still pending. Ito et al (1998) were uncertain whether specific binding of [11C]MDL 100,907 or the contamination of the tissue signal by a metabolite were the cause of the need for a two-tissue compartment model for the description of the time course of radioactivity in the cerebellum. In addition, Watabe et al (2000b) found a reduction of the volume of distribution in all brain regions including the cerebellum of rhesus monkeys in a blocking study with unlabelled MDL 100,907. Finally, the use of the cerebellum as a reference region devoid of 5-HT2A receptors to quantify [11C]MDL 100,907 binding still remains to be clarified.
To resolve these issues, we studied [11C]MDL 100.907 binding to 5-HT2A receptors in vivo in healthy control subjects and also examined the occupancy of a single dose of the antidepressant mirtazapine at the receptor. Mirtazapine (1,2,3,4,10,14b-hexahydro-2-methylpyrazino[2,1-α]pyrido[2,3-c]benzazepine) is a ‘dual action’ antidepressant, which acts by antagonizing adrenergic α2 autoreceptors (pKi 7.7) and a2 heteroceptors (pKi 8.0) as well as blocking 5-HT2A/2C (pKi 8.2) and 5-HT3 (pKi 8.1) receptors (Anttila and Leinonen, 2001). We utilized its antagonist action at the 5-HT2A receptor to study the effect of the drug on time activity curves for [11C]MDL 100,907 binding and also to determine the occupancy of a single, clinically effective dose of the antidepressant.
Materials and methods
Subjects and Medication
Five normal volunteers (four males aged 37, 55, 62 and 63 years and one female of 59 years) gave written informed consent to be included in the study. They were screened by an experienced psychiatrist (ZB) to exclude any past or current history of psychiatric illness using the Structured Clinical Interview for DSM-IV disorders (SCID; First et al, 1997). They were also screened using the Hamilton Depression Rating Scale (HDRS; Hamilton 1960) (mean score 0) and the Beck Depression Inventory (BDI; Beck et al, 1961) (mean score 0). Subjects were included only if they had not been on any medication for at least 6 months before the scan, did not abuse alcohol or illicit drugs and did not have any significant current or history of medical or neurologic illness.
Each subject had two PET scans using [11C]MDL 100,907 at the same time of the day with an interval of at least 1 week between the two scans. Subjects were given a single tablet of mirtazapine 30 mg approximately 90 mins before the start of the acquisition of PET data on one of the two occasions in a randomized open label design. In healthy volunteers, mirtazapine is rapidly absorbed after a single dose and its peak plasma concentration is reached within 1 to 2.1 h (Timmer et al, 2000). The scans were timed to coincide with the time of peak plasma concentration of mirtazapine after an oral dose (emission scan start time 90 mins after ingestion of tablet). All subjects had an indwelling venous cannula inserted into the median cubital vein of the forearm to inject the radioligand and also had an indwelling arterial cannula in the radial artery to withdraw blood for the measurement of the PET input function.
Two out of the five subjects had their blocking scan before the baseline scan, the other three had the tracer alone scan before the scan with mirtazapine pretreatment. The time interval between the two PET scans in individuals ranged between 6 and 83 days. The Research Ethics Committee of the Hammersmith Hospitals Trust and the Administration of Radioactive Substances Advisory Committee (ARSAC) of the United Kingdom approved the study.
Positron Emission Tomography Scans
The radiotracer [11C]MDL 100,907 was synthesized according to the method previously described by Lundkvist et al (1996), and was injected by hand into an antecubital vein as a smooth bolus over 30 secs. The injected radioactivity dose was between 337 and 379 MBq (mean: 361 MBq, SD: 14 MBq). The radiochemical purity of the injected [11C]MDL 100,907 was high and ranged from 97.9% to 100% with a mean of 99.4% and an SD of 0.8%. The injected mass of MDL 100,907 varied between 0.8 and 8.9 μg with a mean value of 3.4 μg and an SD of 2.6 μg. The specific activity was on average 65 GBq μmol−1 with an SD of 48 GBq μmol−1. The dose of MDL 100,907 injected in a subject in one scan ranged from 0.021 to 0.293 nmolkg−1 body weight. In rat brain scans with similar specific activity, Hirani et al (2003) have found no effect of coinjected MDL 100,907 between 0.50 and 0.97 nmol kg−1 on the specific binding of [11C]MDL 100,907.
All PET scans were performed on the high-sensitivity Siemens/CTI scanner ECAT EXACT3D with an axial field of view of 23.4 cm and 95 reconstructed transaxial image planes (Spinks et al, 2000). A 5-mins transmission scan using a 137Cs point source was performed before each study for subsequent attenuation correction (Xu et al, 1994) and scatter correction (Watson et al, 1996). The 95-mins three-dimensional (3D) dynamic emission scan was acquired in list mode. In the postacquisition frame rebinning, 28 time frames of increasing length were generated (30 s background frame before the injection, then three 10s-frames, three 20s-frames, three 30s-frames, three 60s-frames, four 120s-frames, six 300s-frames and five 600s-frames). The spatial resolution of the images reconstructed using the reprojection algorithm (Kinahan and Rogers, 1989) with the ramp and Colsher filters set to Nyquist frequency is close to isotropic: 5.1 mm full-width at half-maximum (FWHM) transaxially and 5.9 mm FWHM axially averaged over a radius of 10 cm from the centre of the field of view (Spinks et al, 2000).
Arterial whole-blood activity was monitored continuously for the first 15 mins of the scan with a bismuth germanate coincidence detector (Ranicar et al, 1991). A total of 10 discrete arterial blood samples were taken at 5, 10, 15, 20, 30, 40, 50, 60, 75 and 95 mins into heparinized syringes. The activity concentration of the whole blood and plasma were measured.
Eight plasma samples per scan (at 5, 15, 30, 40, 50, 60, 75 and 95 mins) were analysed for metabolites using a semiautomated system with on-line solid-phase extraction (SPE; small column packed with C-18) followed by reverse-phase chromatography (Luthra et al, 1993). The plasma samples were loaded onto the SPE column and eluted with diammoniumhydrogen phosphate (0.01 mol/L) and further analysed using reverse-phase column (μ–Bondapak C18 column, 30 × 0.78 cm2 i.d.) eluted with a mixture of ammonium acetate (10 mmol/L), acetonitrile and trifluoroacetic acid (55:45; 0.1 v/v) at a flowrate of 3 ml/min. In order to identify the peak representing the unmetabolized compound, cold standard MDL 100,907 was added. In one selected case, cold MDL 105,725 was also added such that the position of the peaks of the radiolabelled metabolites relative to MDL 105,725 could be located. The eluate was then monitored for ultraviolet (UV) absorbance at 210 nm, and radioactivity and subsequent data captured on a PC-based integrator. The amount of [11C]MDL 100,907 and its radioactive metabolites at a given time point was calculated from the decay-corrected integrated radiochromatogram and the levels of radioactivity in the SPE eluate and expressed as a percentage of total plasma sample injected.
Magnetic Resonance Scans and Definition of Volumes of Interest
For each subject, brain magnetic resonance images (MRI) were acquired with T1 weighted RF spoiled gradient echo volume scans on an 1 T Philips Medical Systems HPQ + Scanner. The echo time TE was 6 ms, the repetition time TR was 21 ms, the flip angle was 35°, yielding an image resolution of 1.6 mm × 1.6 mm × 1.0 mm (AP, LR, HF, respectively).
A set of volumes of interest (VOI) was defined with a probabilistic brain atlas template (Hammers et al, 2002, 2003). The following 11 VOIs were chosen for the kinetic analysis of [11C]MDL 100,907 (the volume of these VOIs in the defining template is given in parenthesis):
neocortical regions: anterior medial temporal lobe (20.2 cm3), insula (41.3 cm3), anterior cingulate gyrus (24.3 cm3), occipital lobe (155 cm3), frontal lobe (575 cm3) and parietal lobe (364 cm3);
limbic regions: hippocampus (6.9 cm3) and amygdala (4.8 cm3);
thalamus (21.4 cm3) and putamen (11.9 cm3);
a region with negligible concentration of HT2A receptors: cerebellum (206 cm3).
After coregistering the individual MRI to the PET image summed from 7 to 95 mins after tracer injection using an automated multiresolution optimization procedure (Studholme et al, 1997), regional time–activity curves were generated from the dynamic images using the medical imaging software ANALYZE (Robb and Barillot, 1989; Robb et al, 1989).
Data Analysis
For the generation of the plasma input functions, the time course of the plasma-to-blood activity concentration ratio, obtained from the first four discrete arterial samles at 5, 10, 15 and 20 mins scan time, was first fitted to a model function. Then the measurement of the arterial whole-blood activity concentration obtained from the continuous detector system (Ranicar et al, 1991) was multiplied with that model function to obtain a total plasma activity concentration curve for the first 15 mins of the scan. This curve was then combined with the discrete plasma activity concentration measurements at 20, 30, 40, 50, 60, 75 and 95 to obtain an input function describing the total plasma activity concentration for the entire scan. Finally, the input function of the activity concentration due to unmetabolized [11C]MDL 100,907 in plasma was created by multiplying the total plasma activity input function with the function obtained from the fit of the model for the parent fraction in plasma to the eight measurements of the parent compound during the scan. Calculations were performed using MATLAB® (The Math-Works, Inc., Natick, MA, USA) on Sun Ultra™ 10 workstations (Sun Microsystems, Inc., Santa Clara, CA, USA).
Estimates of the compartmental model microparameters were obtained from weighted fits as previously described (Gunn et al, 1998).
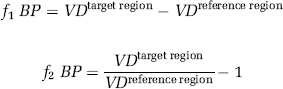
In all reversible plasma input function compartmental models, the total volume of distribution VD is given by the integral of the impulse response function (Gunn et al, 2001). With the definition of binding potential BP introduced by Mintun et al (1984), f1 as the fraction of radioligand not bound in plasma and f2 as the free fraction of radioligand in tissue, estimates of binding potential in a target region with specific binding can be obtained from the estimated VD in that region and the estimated VD in a reference region without specific binding (Gunn et al, 2001)

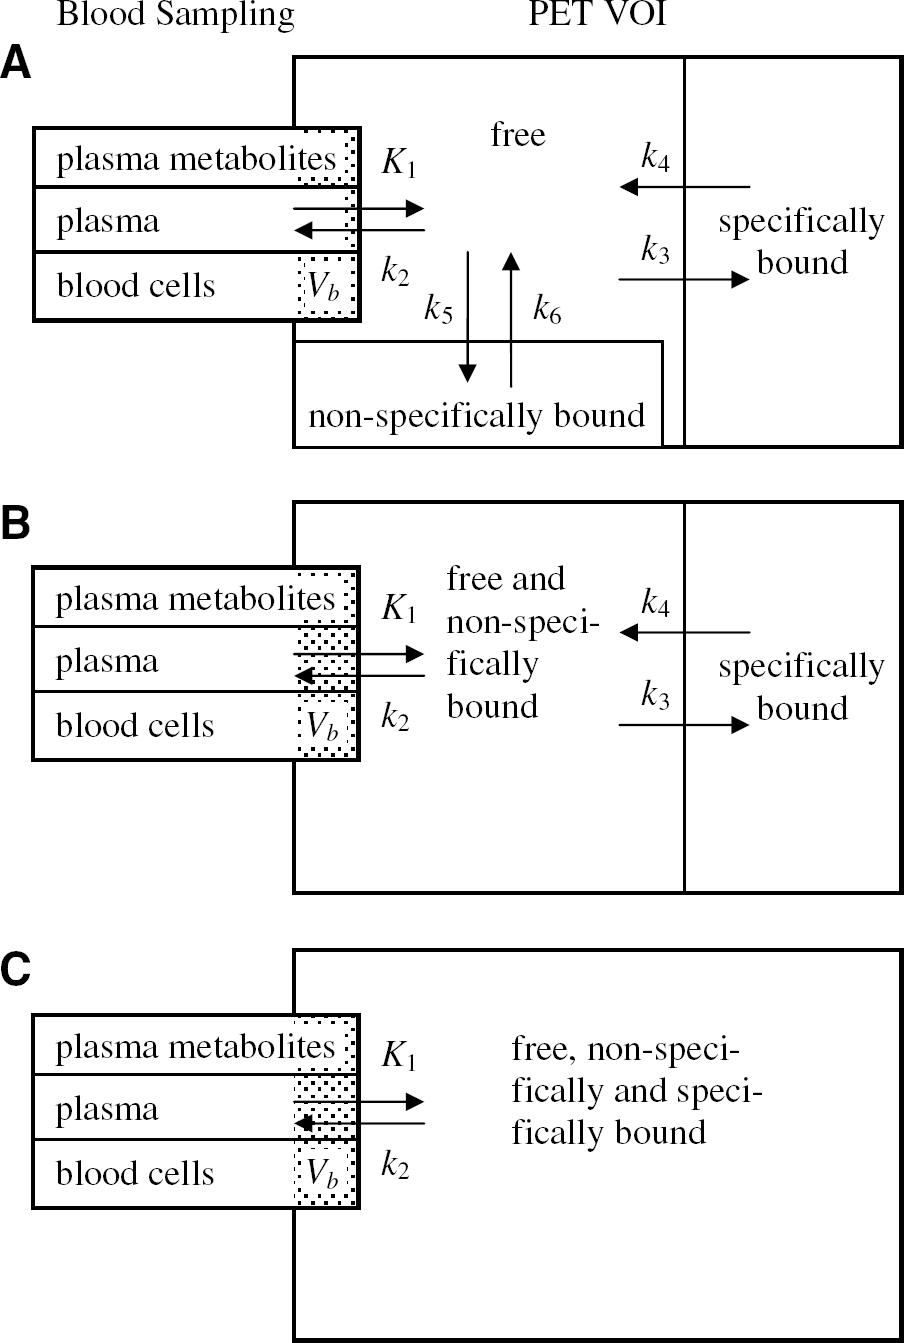
Watabe et al (2000a) proposed a reference tissue input function model with three compartments for the quantification of dynamic studies with [11C]MDL 100,907. The kinetic behaviour in the reference tissue is described based on two tissue compartments (similar to Figure 6B except that the second tissue compartment is for nonspecific binding) using four rate constants K′1, K′2, K′5 and K′6. For the target region, one tissue compartment with the rate constants K1 and k2 is assumed to characterize the combined kinetics of free, non-specific and specific binding (Figure 6C). Time–activity curves of the target regions were fitted using a cerebellar reference tissue input function and the system impulse response function HTR(t) for the Watabe reference tissue model as described by Gunn et al (2001):
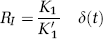
with
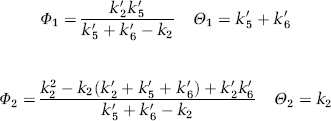
the symbolic Dirac delta function δ(t)
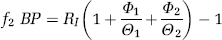
As the integral of the impulse response function of all reference tissue input function models with reversible kinetics in both the target and the reference region is equal to VDtarget region / VDreference region (Gunn et al, 2001), a binding potential estimate was calculated from:

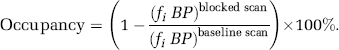
The regional receptor occupancy in a subject was estimated from the ratio of the regional binding potentials in the blocked scan over the regional binding potentials in baseline scan and expressed as a percentage:
Statistical analyses were performed using Statistical Package for Social Sciences SPSS version 11 (SPSS Inc., Chicago, IL, USA). Values are given as mean ± standard deviation (SD) unless specified otherwise. Significant interactions were explored using a two tailed paired samples t-test. All correlations were performed using Pearson's product moment correlation coefficient r.
Results
Input Function
After intravenous injection of the [11C]MDL 100,907 bolus, the radioactivity concentration in whole blood was higher than in plasma throughout the time of the PET scan as reported by Ito et al (1998). During the first phase of the scan (approximately 20 mins), the plasma-to-blood activity ratio decreased further, and after it reached a minimum in the middle of the scan it began to rise (Figure 1). This later rise is indicative of the appearance of radiolabelled polar metabolites, which tend to accumulate in plasma rather than in red cells.
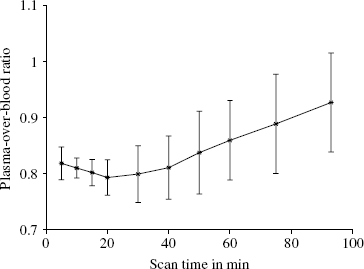
Ratio of plasma activity concentration over whole-blood activity concentration obtained from the ten PET scans (five subjects, baseline and blocked scans). Depicted are the mean values of the 10 discrete arterial blood samples from each scan connected with the solid line with their standard deviations as bars.
A polynomial was tested as the model function describing the time course of the plasma-over-whole-blood activity concentration ratio (POB ratio) during the first 15 mins of the scan when the continuously operating blood detector system (Ranicar et al, 1991) was used to record the whole-blood activity concentration. Since the decrease of the measured POB ratios over the considered period was small compared with the variability inherent in these POB ratios originating from the division of two radioactivity measurements, a polynomial with order zero was sufficient to describe the data:

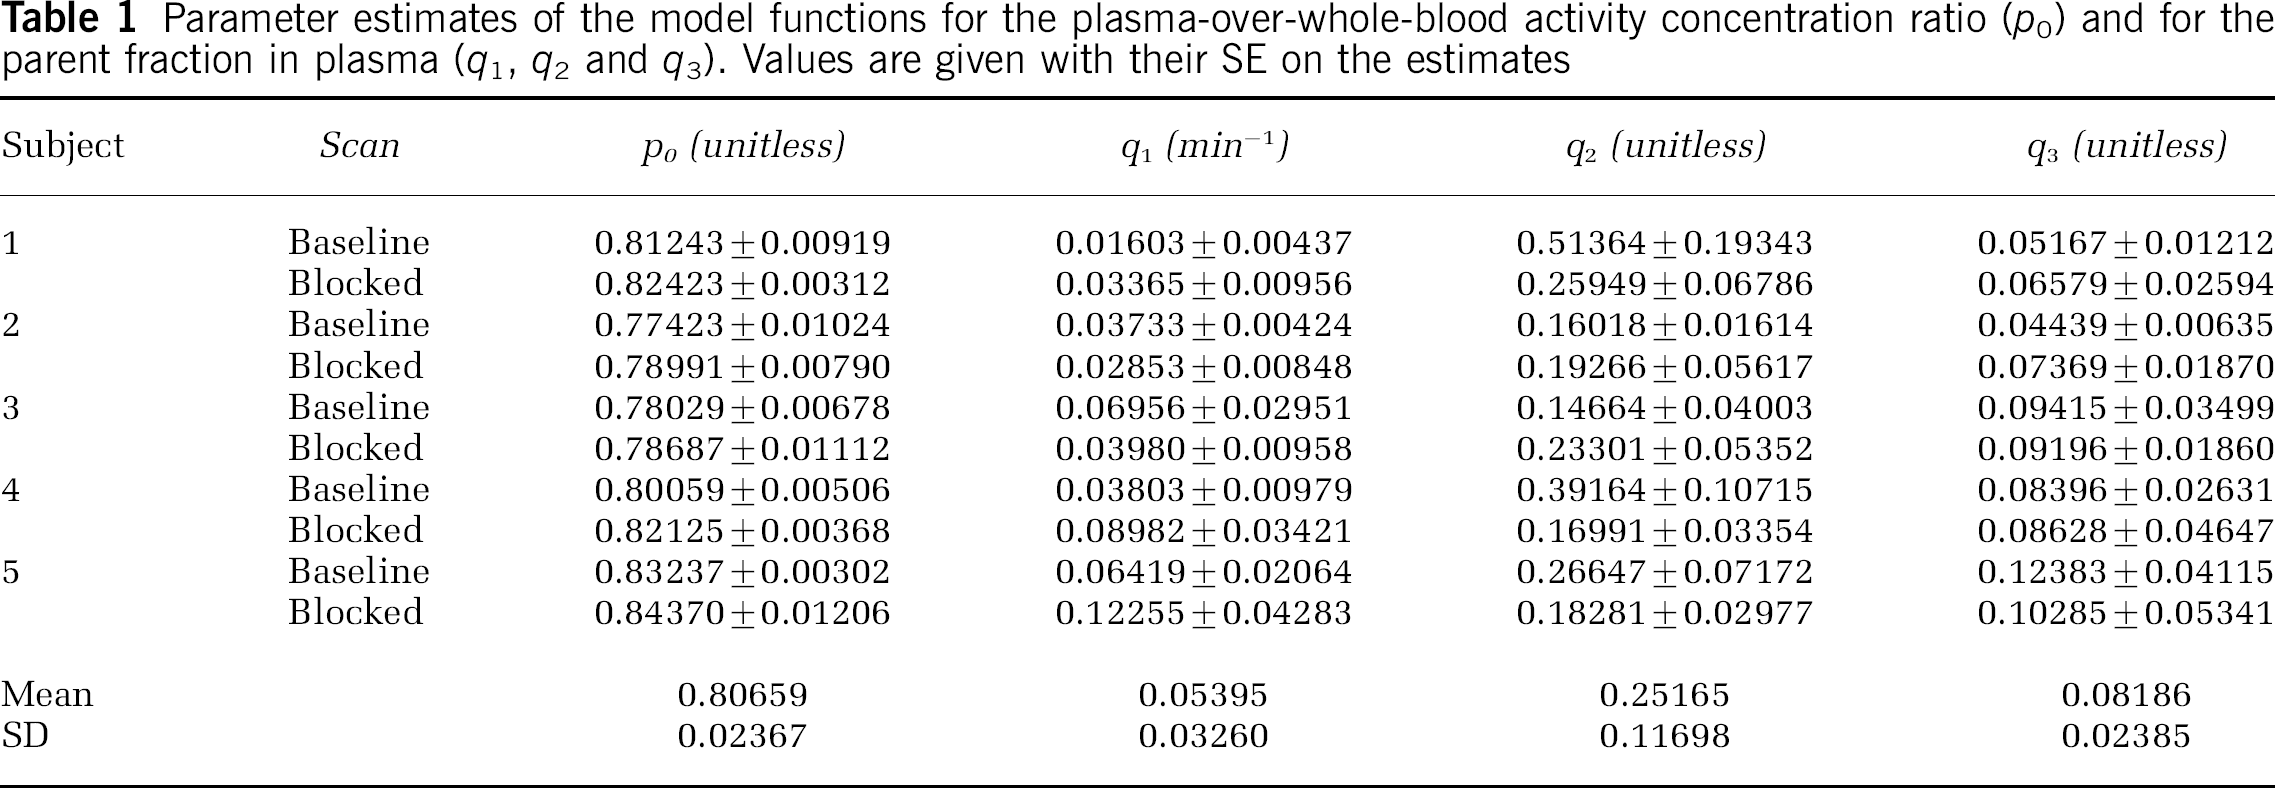
The estimated POB ratios for all five subjects under baseline and blocked condition are given in Table 1. In all subjects a small increase of the parameter p0 in the blocked scan relative to the baseline scan was observed. This increase was on average only 1.6%, with the biggest increase observed in subject 4 with 2.5%. Ito et al (1998) suggested that [11C]MDL 100,907 may bind to the 5-HT2A receptors in platelet membranes. The small albeit consistent across subjects increase of the POB ratio observed in this study is in agreement with the possibility that the administration of mirtazapine lead to a blockade of these placelet binding sites, hence reducing the activity concentration in the red cell fraction of the blood sample relative to the activity concentration in the plasma fraction.
Parameter estimates of the model functions for the plasma-over-whole-blood activity concentration ratio (po) and for the parent fraction in plasma (q1, q2 and q3). Values are given with their SE on the estimates
The main metabolite of MDL 100,907 at pharmacological doses in rats and dogs has been identified as MDL 105,725 (Scott and Heath, 1998). These authors also reported that MDL 105,725 is able to cross the blood brain barrier (BBB) with a permeability of 25% of the BBB permeability of MDL 100,907. Therefore, the metabolite analysis of a PET scan was done with plasma samples spiked with unlabelled MDL 105,725. As shown in Figure 2, the peak of MDL 105,725 in the UV spectrum does not match with a peak in the radiochromatogram. All radiolabelled metabolites in the radiochromatogram had a shorter retention time on the column than MDL 105,725. They are more polar than MDL 105,725 and much more polar than the parent compound MDL 100,907.
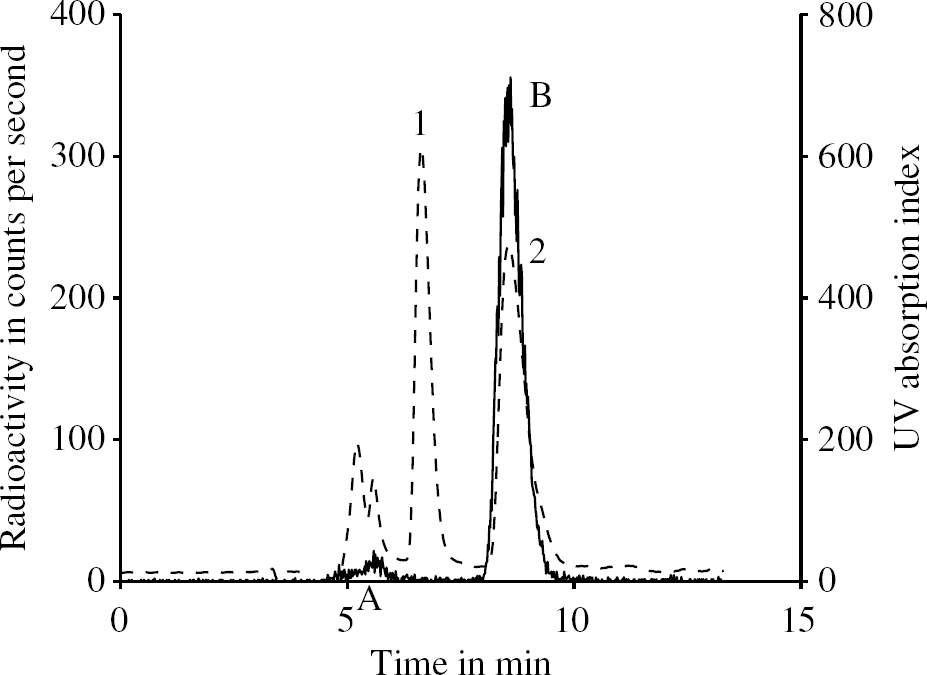
HPLC analysis of the plasma sample from one subject taken at 15 mins. The solid line depicts the radioactivity measurement, and the dashed line represents the chromatogram from the UV detector. In the UV spectrum, peak 1 corresponds to unlabelled MDL 105,725 and peak 2 comes from the cold standard MDL 100,907. In the radiochromatogram, peak A is some of the unidentified radiolabelled metabolites of [11C]MDL 100,907 and peak B marks the unmetabolized parent compound [11C]MDL 100,907 in plasma.
These findings are in agreement with (Scott and Heath, 1998) who reported that the major phase I metabolite of MDL 100,907 in animals is 3′-O-desmethylated MDL 100,907 (MDL 105,725). Since the [11C]CH3 group in [11C]MDL 100,907 is in that position, the same desmethylation process would result in very polar metabolites labelled with 11C and would leave the MDL 105,725 molecule unlabelled.
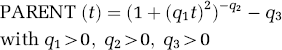
The mathematical model for the description of the amount of parent compound in plasma was described by the following equation:
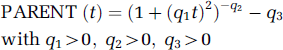
In Table 1, the estimated parameters of this model function are shown for all five subjects. The original equation using two free parameters q1 and q2 was proposed by Watabe et al (2000b). Here, the additional third parameter q3 reflects the proportion of plasma radioactivity at time zero, which is not due to the parent compound. The estimates of q3 are based on extrapolated data since no parent fraction measurement could actually be performed before 5 mins scan time. Values of q3 greater than zero represent co-injected radiochemical impurities or rapidly formed radiolabelled metabolites in the body, for example, created during the first pass of the radioligand from venous blood to arterial blood through the lungs. Since the fraction of radio-chemical impurities measured in the product before injection never exceeded 2.1%, co-injected radiochemical impurities cannot solely explain the estimates of q3 in Table 1, which range from 0.04439 to 0.12383. The fact that the q3 estimates of subjects 1, 3, 4 and 5 are well reproduced in the two scans is consistent with the possibility that a substantial proportion of the parameter q3 accounts for subject-specific rapid initial metabolism of [11C]MDL 100,907 in the body.
The time courses of the plasma-over-blood ratio (Figure 1) as well as of the parent fraction in plasma (Figure 3) exhibit pronounced inter-individual differences as indicated by the standard deviation bars in these figures. Therefore, the use of population based values for the parent fraction and plasma-over-blood ratio instead of individually measured values cannot be recommended. There is an inverse relationship between these two measurements, that is, those subjects with a parent fraction above population average had a plasma-over-blood ratio lower than the population average and vice versa.
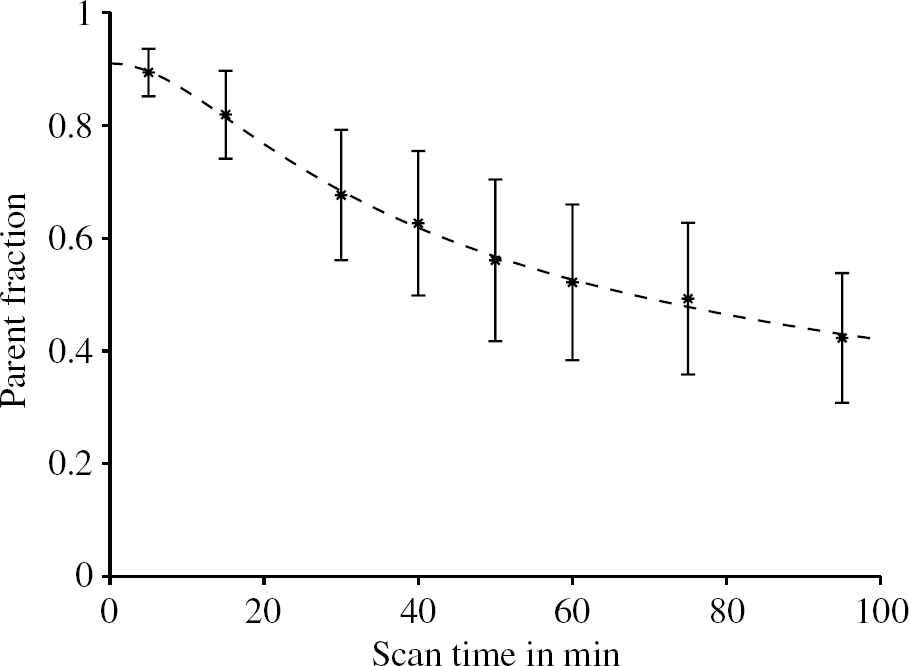
Fraction of unmetabolized parent compound in arterial plasma. The plotted bars are mean values ±SD from all 10 PET scans. The dashed line is the fitted metabolite model to the population mean values, for which the model parameter estimates with standard errors are q1 = (0.05463 ± 0.00573) min−1, q2 = 0.19635 ± 0.01490 and q3 = 0.08991 ± 0.01061. In Table 1, the parameter estimates for all scans are presented.
The difference between the estimated parameters to describe the time course of the parent fraction in plasma for each subject under baseline and blocked condition is smaller than the standard deviation of the population (Table 1). A paired two-tailed t-test of the computed parent fractions at 30 and 60 mins scan time did not reject the null hypothesis that there was no significant difference between the baseline and the blocked scans (P > 0.75). Therefore, no effect of the blocking drug on an alteration of the peripheral metabolism of [11C]MDL 100,907 could be seen. The inter-subject variability (especially of the parameter q3) is higher than the inter-scan difference for one individual.
Compartmental Analysis
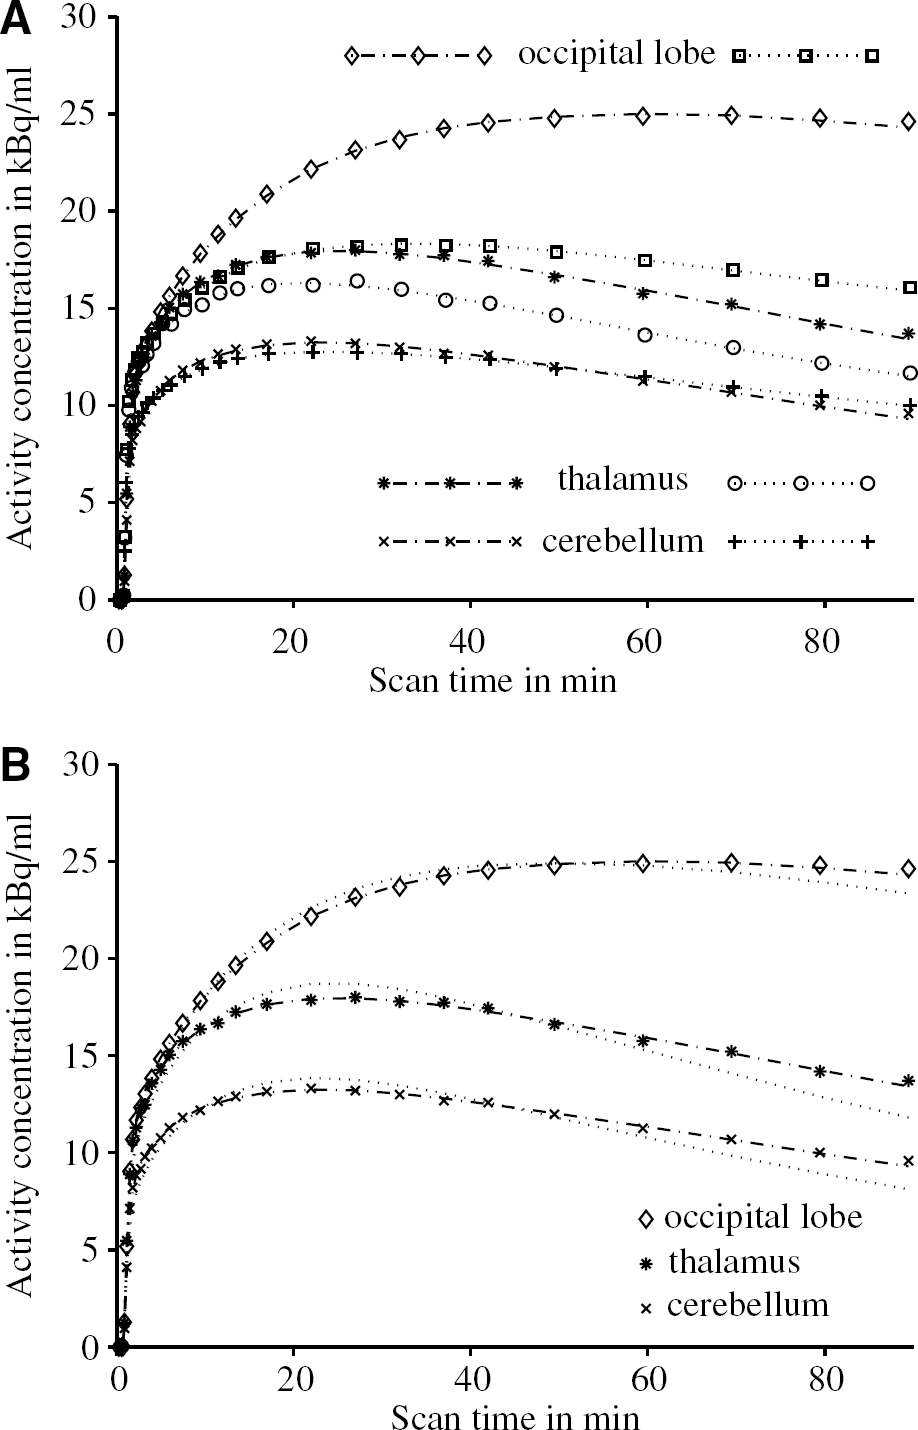
After bolus injection of [11C]MDL 100,907, there was a rapid uptake of radioactivity in brain tissue, as previously described by Lundkvist et al (1996) and Ito et al (1998). There was a clear qualitative difference in the summed PET scans of the baseline and blocked condition for each subject (see Figure 4). In Figure 5A, tissue time–activity curves for a receptor-rich region (occipital lobe), a region with moderate density of 5-HT2A receptors (thalamus) and the cerebellum are plotted under baseline and blocked condition for subject 1.
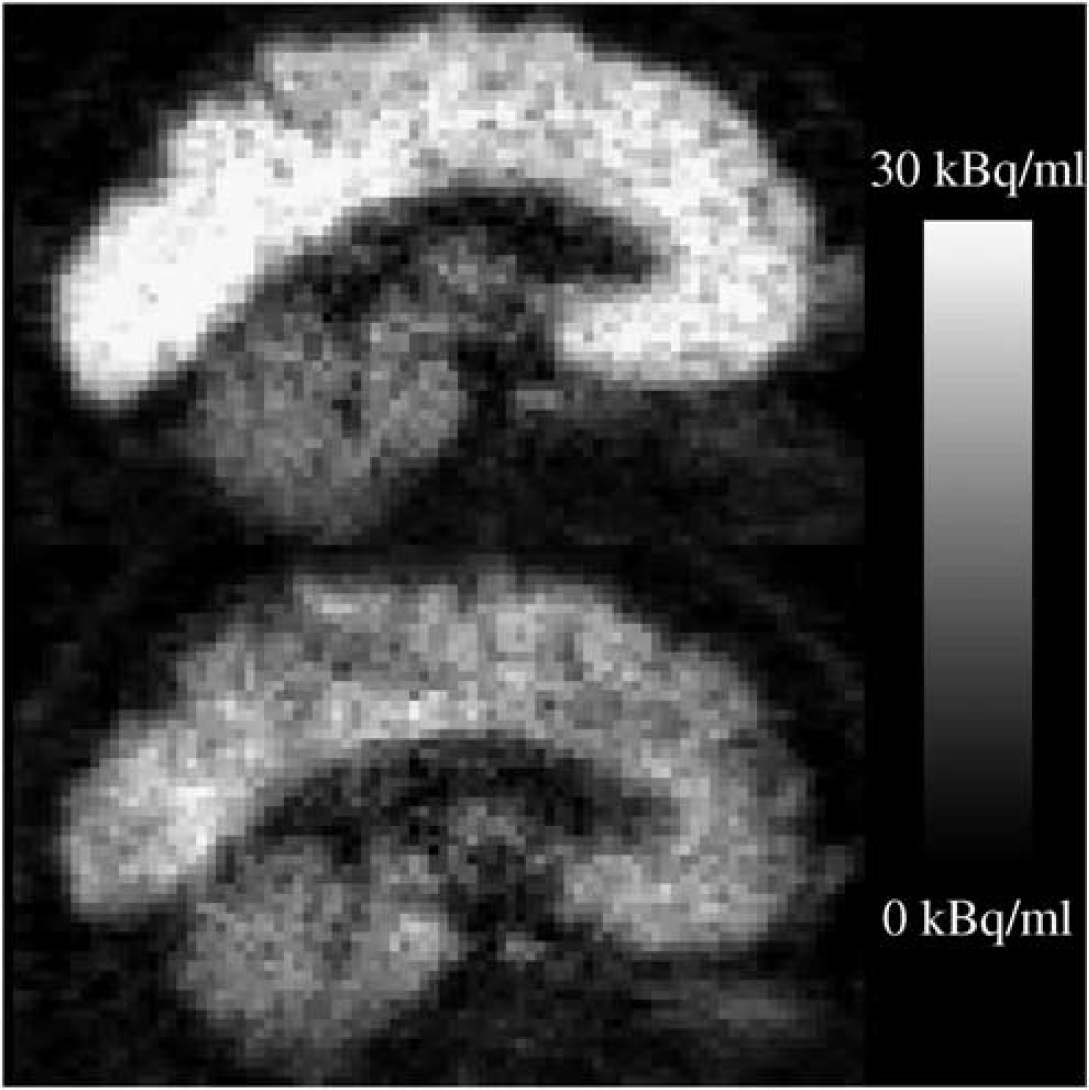
PET images of the mean decay-corrected activity concentration between 7 and 95 mins after blous injection of 370 MBq [11C]MDL 100,907. Sagittal slices of the first subject under baseline condition (top) and in the blocked scan (bottom) are shown. A displacement of the [11C]MDL 100,907 binding in cortical regions is clearly visible whereas no relative change in the cerebellum can be observed.
The regional tissue time–activity curves were initially fitted to the three-tissue compartment, six rate constants model with a free blood volume term using the arterial input function (Figure 6A). The obtained estimates for the rate constants were very sensitive to the choice of the initial parameter values, and the estimated total volumes of distribution had a high coefficient of variation (ratio of the standard error of the parameter estimate over the parameter estimate greater than 30%). Therefore, a two-tissue compartment, four rate constants kinetic model (Figure 6B) was used to obtain estimates of K1,k2, k3, k4 and fractional blood volume Vb (Kegeles and Mann, 1997). This simplified compartmental structure was introduced by Koeppe et al (1991) for the description of the kinetics of the PET ligand [11C]flumazenil with rapid equilibration between the free and nonspecifically bound tracer pools in brain tissue. Watabe et al (2000b) previously concluded from the analysis of scans in rhesus monkeys that a two-tissue compartment model with four rate constants would be the method of choice among the simplified methods for the analysis of [11C]MDL 100,907 scans. However, it was unclear whether the volume of distribution of the free and nonspecifically bound compartment K1/k2 should or should not be fixed to the total volume of distribution obtained in a cerebellar reference region. Since the coefficient of variation of the estimated total volumes of distribution in all brain regions appeared acceptable (< 10%), it was decided to perform the fit of the tissue time–activity curves to the reversible two-tissue compartment model (Figure 6B) with five free parameters (K1, k2, k3, k4 and V b ). The K1/k2 ratio in the target regions was not constrained to the total volume of distribution of the cerebellum.
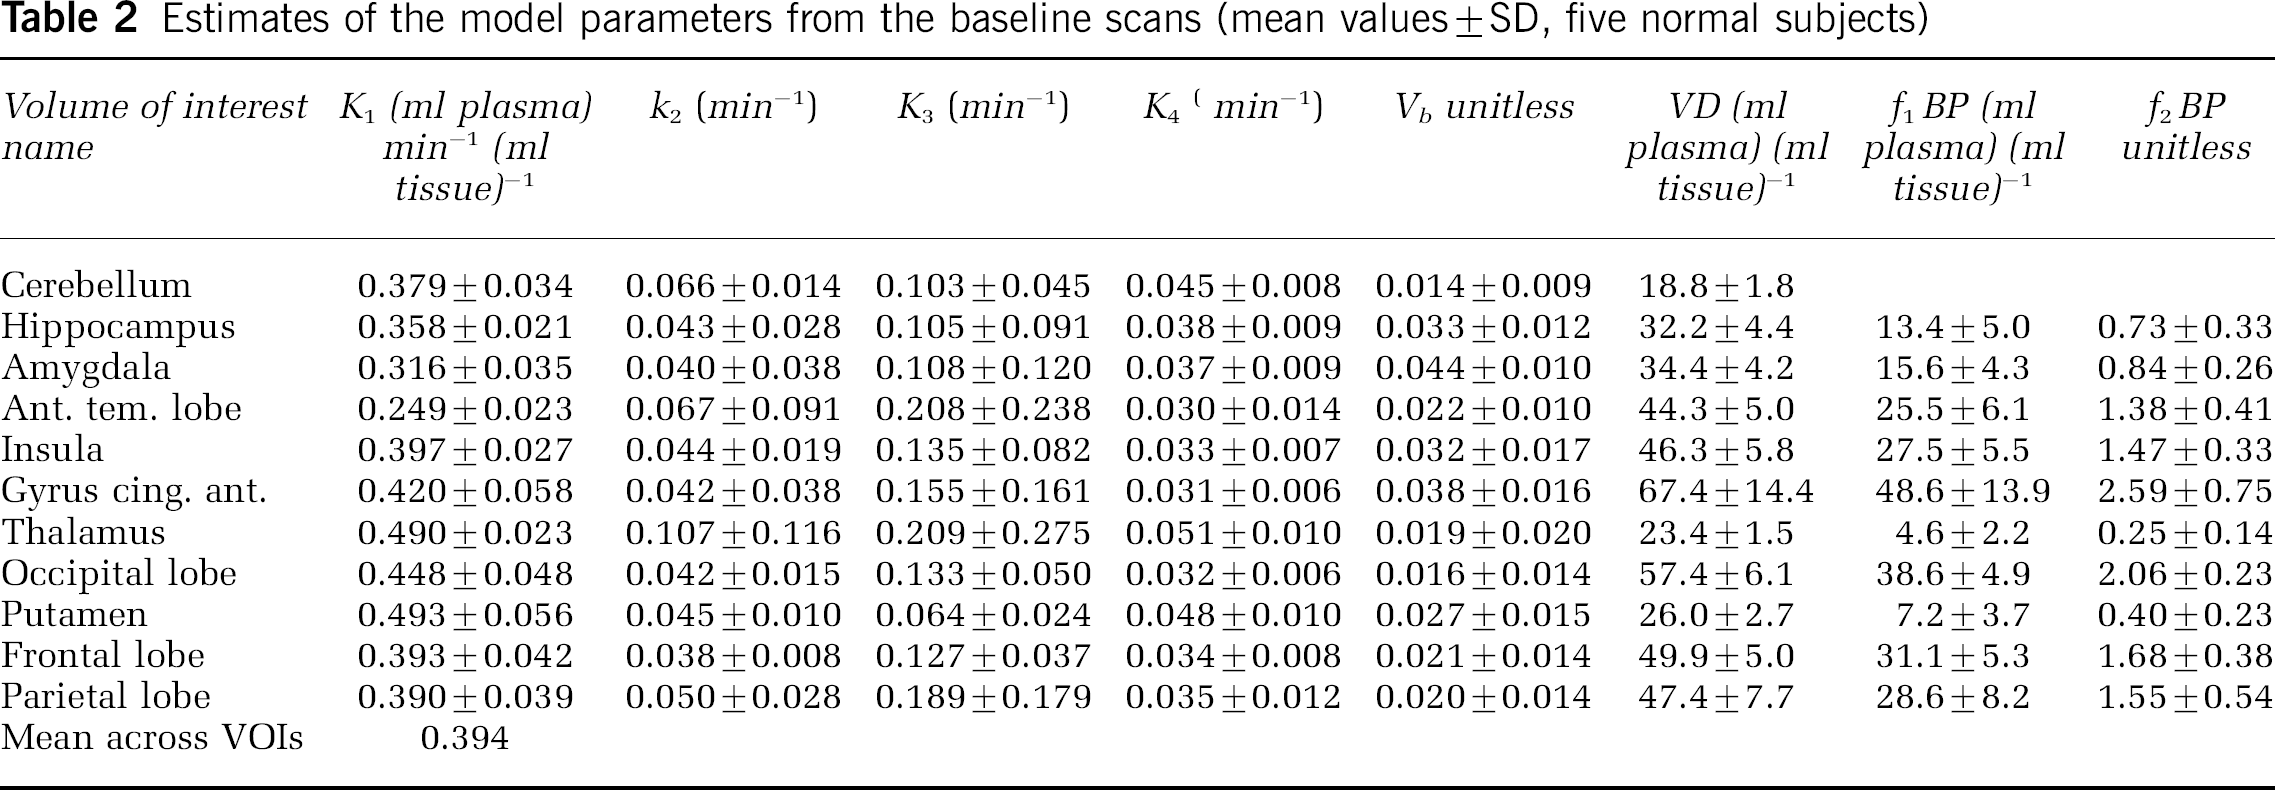
In Table 2, a summary of the estimated model parameters of all five baseline scans is presented. The median coefficients of variation for the estimated parameters were 2% for K1, 21% for k 2 , 30% for k3 and 14% for k4, based on the 11 regional estimates in five subjects. Even in the regions with high binding, that is, the neocortical regions with an average VD greater than 40 (ml plasma) (ml tissue)−1, the coefficients of variation for the k4 estimates were not significantly higher. The values for the two potential binding potential measures f1 BP and f2 BP are given in the last two columns of Table 2. Their between-subject variability is substantially higher than that of VD, which has a mean coefficient of variation of 12%. The mean coefficients of variation derived from the VOIs listed in Table 2 are 30% for f1 BP and 34% for f2 BP, respectively. Despite its slightly higher variability, it was decided to choose f2 BP as the binding potential outcome measure for the calculation of occupancy estimates in the blocked scans, since it was not possible to obtain reliable measurements of the free fraction in plasma f1 in this study. Therefore, the possibility of changes of f1 between the baseline and blocked scans could not been eliminated. However, the parameter f2 is not determined experimentally and the underlying assumption of uniformity of the nondisplaceable compartments can more easily be assessed by a comparison of the reference region VDs. The use of f2 BP as the preferred outcome parameter is in agreement with previous findings (Laruelle et al, 1994; Carson et al, 1997).
Estimates of the model parameters from the baseline scans (mean values±SD, five normal subjects)
A further simplification of the compartmental model to a one-tissue compartment model with two rate constants and fractional blood volume (Figure 6C) significantly decreased the quality of the fit as demonstrated in Figure 5B for three time–activity curves. As previously described (Carson et al, 1998), regions with less specific binding and a smaller VD (e.g. cerebellum, thalamus) appear to require more clearly the two-tissue compartment model than regions with high specific binding (e.g. occipital lobe).
(
(
Regional Volumes of Distribution, Binding Potentials and Occupancies
Quantification of [11C]MDL 100,907 binding in the brain revealed a wide variation in binding as expected from the preclinical and post-mortem literature. Regional mean VD values of the baseline scans (Table 2) ranged from 18.8 (ml plasma) · (ml tissue)−1 for the cerebellum to 67.4 (ml plasma) · (ml tissue)−1 for the anterior cingulate (anterior cingulated > occipital lobe > frontal lobe > parietal lobe > insula > anterior temporal lobe > amygdala > hippocampus > putamen > thalamus).
There was no significant difference in cerebellar VD between the baseline scan and the mirtazapine scan: VDbaseline= 18.8 ± 1.8 (ml plasma) · (ml tissue)−1, VDmirtazapine = 17.2 ± 1.6 (ml plasma) · (ml tissue)−1, P> 0.05. However, there was a statistically significant decrease in VD values for all other 10 regions studied (see Figure 7A). A post hoc t-test showed that f2 BP was significantly reduced across all ten regions after administration of mirtazapine (see Figure 7B). Mean regional VOI occupancy values ranged from 27% in the putamen to 70% in the occipital lobe with the mean occupancy across all VOIs being 60% (see Figure 7C). There appeared to be an age-related decline in binding potential, however, no effect of age on occupancy.
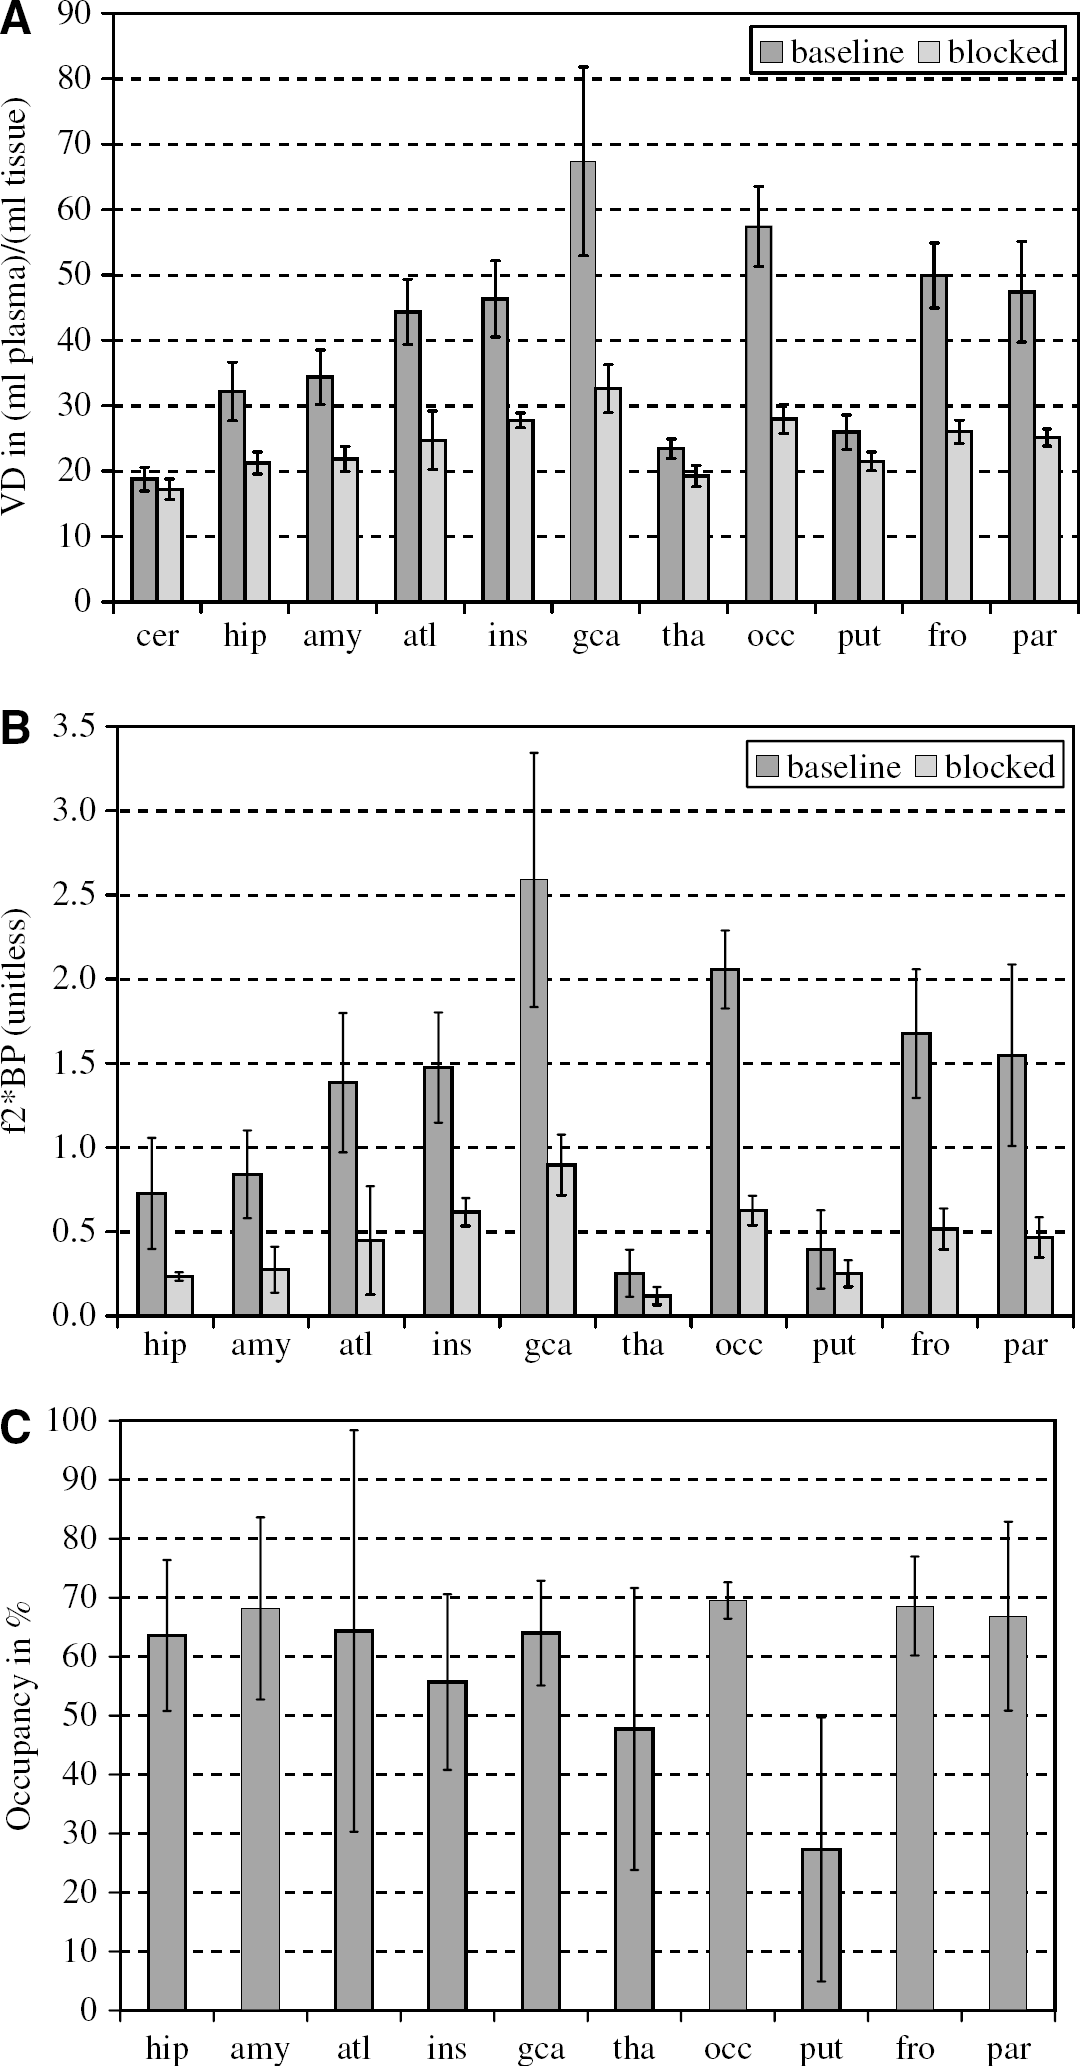
Comparison of the regional volumes of distribution VD (
The use of the cerebellar time–activity curve as a reference tissue input function for the reference tissue model with three compartments (Watabe et al, 2000a) did not provide reliable estimates of the five mathematically identifiable microparameters of the model (results not shown). The estimates of the macroparatmeter VDtarget region/VDreference region of the reversible reference tissue model were generally associated with high standard errors, often exceeding the parameter estimate itself. In consequence, the reference tissue input model analysis did not provide occupancy estimates with a consistency across regions similar to those shown in Figure 7C.
Discussion
These data confirm the fact that [11C]MDL 100,907 binds with high affinity in brain regions known to be rich in 5-HT2A receptors. This study extends work previously done on the tracer kinetic modelling of [11C]MDL 100,907 by clarifying outstanding issues. First, there do not appear to be radiolabelled metabolites of [11C]MDL 100,907 in human plasma, which are likely to cross the BBB. Second, there was no significant blocking of [11C]MDL 100,907 binding in the cerebellum after a single dose of mirtazapine, an antidepressant with a high affinity for 5-HT2A receptors. Regional binding potentials were therefore calculated using the cerebellar VD as an estimate of the free and nonspecific binding. The compartmental model of choice for the estimation of the regional VDs was a reversible, two tissue, four rate constants model with a variable fractional blood volume term and the metabolite-corrected plasma input function. Finally, from the reduction of the binding potentials in the blocked scans occupancy estimates were obtained, which were fairly uniform across the brain regions considered.
An important issue in the quantification of PET radioligands is the presence of radiolabelled metabolites that might enter the brain. As previoulsy reported, the main metabolite of MDL 100,907 in animal studies is MDL 105,725 (Scott and Heath, 1998). In this study, the analysis of the radiolablled metabolites of [11C]MDL 100,907 in human plasma did not show any [11C]MDL 105,725. The radiolabelled metabolites observed were all more polar than MDL 105,725. Based on these findings, it is unlikely that radiolabelled metabolites of [11C]MDL 100.907 cross the BBB and contaminate the brain tissue signal in PET scans with [11C]MDL 100,907. As a consequence, the analysis of the brain tissue data from [11C]MDL 100,907 scans do not require corrections for the contamination of the signal from radiolabelled metabolites.
This absence of radiolabelled metabolites that are likely to cross the BBB appears to be an advantage of [11C]MDL 100,907 in comparison with [18F]altanserin another widely used PET radioligand to image the 5-HT2 receptor (Biver et al, 1994; Sadzot et al, 1995). Tan et al. (1999) have found at least four radio-metabolites of [18F]altanserin in plasma of humans, which were described as being likely to penetrate the BBB. Subsequently, van Dyck et al. (2000) suggested a bolus plus infusion paradigm to overcome difficulties associated with lipophilic radiolabelled metabolites. This approach has been developed further into a clinical protocol, which requires only five frames of 8 mins each for the actual image acquisition and which should not reflect pharmacological alterations in blood flow (Pinborg et al, 2003). As an alternative, bolus injection [18F]altanserin quantification procedures with single or dual input function have been proposed (Price et al, 2001a, b).
There was no significant blocking of [11C]MDL 100.907 binding in the cerebellum after oral administration of 30 mg mirtazapine 90 mins before radioligand injection. This is consistent with the work by Hall et al (2000), who found the cerebellum in postmortem human brain as virtually devoid of 5-HT2A receptors. Therefore, the estimated total volume of distribution in the cerebellum can subsequently be used as a measure of the free and nonspecifically bound radioligand in the brain. However, Watabe et al (2000b) found that unlabelled MDL 100,907 blocked [11C]MDL 100,907 binding in the cerebellum of rhesus monkeys. This could be attributed to species differences between monkeys and humans in cerebellar 5-HT2A receptor distribution. However, Lopez-Gimenez et al (2001) reported only very low in vitro specific binding in the cerebellum of primate brain, which is consistent with our findings. Further even in rats, where 5-HT2A receptor density in cerebellum is minimal, Hirani et al (2003) measured VOI-to-cerebellum ratios of unity in rats predosed with either MDL 100,907 or ketanserin indicating that species differences are unlikely to account for the displacement in Watabe et al (2000b).
The baseline VD values of Table 2 are in good agreement with results in humans previously obtained by Mawlawi et al (2001). They found a mean cerebellar VD of 18.2 ± 4.3 ml/g in seven healthy volunteers (33 ± 9 years) and reported high values of f1 BP between 35 and 40 ml/g in neocortical regions. There is, however, considerable disagreement with the first study reported in humans with [11C]MDL 100.907 by Ito et al (1998). They found in three healthy men (aged 20, 23 and 35 years) cerebellar VD of 28.6, 32.0 and 31.5 (ml plasma) (ml tissue)−1 using the two-tissue compartment model with four rate constants (Ito et al, 1998, Table 1). These differences might be due to between subject variability (e.g. the volunteers in this study were all older) and can be attributed to the estimates of K1, which were reported between 0.50 and 0.70 (ml plasma) min−1 (ml tissue)−1 in all VOIs except the pons (Ito et al, 1998; Table 2). Those K1 estimates are approximately 50% greater than the K1 estimates found in this study (Table 2) with a mean K1 of 0.394 (ml plasma) min−1 (ml tissue)−1 across the investigated regions. Taking a mean value for the cerebral blood flow of 0.54 ml g−1 min−1, as obtained in healthy volunteers by Kety and Schmidt (1948), into account, plasma to brain transport constants K1 of this size classify [11C]MDL 100,907 as a highly permeable ligand. While the volume of distribution itself is not dependent on blood flow, one has to keep in mind that, for a highly permeable ligand, estimates of K1 might be affected by flow changes during the PET scan.
The use of the measured time course of radioactivity in the cerebellum as an input function for reference tissue models, as proposed by Watabe et al (2000a), failed to provide reliable parameter estimates. This is likely due to the presence of too many free parameters in this particular reference tissue model configuration (two rate constants for the target region and four rate constants in the reference region) and the very slow kinetics of [11C]MDL 100.907 in tissue, which makes it more difficult to obtain stable parameter estimates from data collected during a 90 mins PET scan. Other work has been carried out in the meantime to develop methods, which are more robust against noise and constrain better the parameter space than the traditional reference tissue models. See the specific examples on [11C]MDL 100,907 data analysis given in Ichise et al (2002) and Turkheimer et al (2003) with particular emphasis on the generation of parametric maps.
There were no significant regional differences in mirtazapine occupancy at the 5-HT2A receptor. Therefore the assumption of no regional differences in the free and nonspecifically bound [11C]MDL 100.907 across the brain appeared to not have been violated. The region with the highest occupancy in the cohort of five subjects was the occipital lobe with 70% ± 3%, based on mean VDbaseline = 57.4 ± 6.1 (ml plasma) (ml tissue)−1 and VDmirtazapine = 28.0 ± 2.2 (ml plasma) (ml tissue)−1. In the putamen, the smallest estimated occupancy was obtained with 27 ± 22%, based on mean VDbaseline = 26.0 ± 2.7 (ml plasma) (ml tissue)−1 and VDmirtazapine = 21.5 ± 1.4 (ml plasma) (ml tissue)−1.
It is possible that the higher dose of mirtazapine 45 mg, which is widely used clinically, may result in occupancy levels higher than 70%. However, mirtazapine has a complex pharmacology and the contribution of 5-HT2A receptor blockade to its therapeutic effects is not clear (Anttila and Leinonen, 2001). While the number of subjects in the study was reasonable to establish quantification of the radioligand binding in humans, further studies would be required to validate the occupancy effect seen in this study. An ultimate proof of no regional variation of the free and nonspecifically bound [11C]MDL 100,907 across the brain would require the use of a higher occupancy 5-HT2 antagonist than in this study.
As previously demonstrated by Hirani et al (2003) in small animal PET studies, [11C]MDL 100,907 appears insensitive to an increased concentration of synaptic 5-HT. Recent studies with tryptophan depletion in humans also showed no modulation by lowered synaptic 5-HT concentrations (Talbot et al, 2004). This suggests that the ligand can be used clinically to monitor 5-HT2A receptor function or dysfunction in disease or during therapy, without the need to consider concomitant changes in neurotransmitter concentration.
In conclusion, the 5-HT2A ligand [11C] MDL100,907 is characterized by a high brain uptake, good contrast of the PET images and the absence of radiolabelled metabolites likely to cross the blood–brain barrier. Estimates of binding potential can been obtained from regional estimates of the total volume of distribution VD assuming that the cerebellar VD is an estimate of the size of the free and nonspecifically bound tracer pools throughout the brain. The results of our blocking study with an oral dose of 30 mg mirtazapine 90 mins before the onset of the PET scan suggest that this is an acceptable assumption. Furthermore, we confirmed that this single, clinically effective dose of the antidepressant corresponds with a mean occupancy of 60% without any significant regional differences between the areas of the brain investigated. These favourable properties suggest that [11C]MDL100,907 would currently be the PET ligand of choice to study of 5-HT2A receptors in health and disease.
Footnotes
Acknowledgements
The authors gratefully acknowledge the excellent work of Safiye Osman with the bioanalysis and quality control teams. The authors thank Leonhard Schnorr and Abel Haida for their expert technical support. Andy Blyth, Hope McDevitt, Stella Ahier and Ann Peers receive our thanks for their assistance in making the scans possible.