
Abstract
The current study follows angiogenesis and microcirculatory changes associated with malignant glioma growth by means of an intravital fluorescence microscopic approach, which allows for the direct and continuous visualization of the glioma microvasculature and its quantitative analysis. Fluorescently labeled C6 rat glioma cells (5 × 10⁵) were implanted into dorsal skinfold chamber preparations of athymic nude mice. Glioma growth, vascularization, microhemodynamics, vascular permeability, and leukocyte–endothelial cell interactions were simultaneously followed over a 22-day observation period using intravital epiillumination microscopy and a multifluorescent labeling technique. Analysis of the process of glioma vascularization revealed three stages with distinct microvascular characteristics: avascular stage (days 0 to 6), lag of glioma growth but initial glioma-induced angiogenesis within the host tissue in peritumoral areas; early vascular stage (days 6 to 14), glioma cell proliferation associated with a spatially homogeneous development of a glioma microvasculature; and late vascular stage (days 14 to 22), exponential tumor growth and expansion (> 400 mm3) with high vascular densities in the peritumoral region and reduced vascularization (microvascular perfusion) in the glioma center. Within the center, the functional vessel length per area correlated inversely with glioma size (P<0.01). In the peritumoral region, functional vessel length per area was independent of glioma size, indicating persistent, high angiogenic activity throughout the observation period. Thus, the microvasculature of mature gliomas revealed a microvascular zonal division with a progressive reduction of the functional vessel length per area within the tumor center. The perfusion failure of individual microvessels within the glioma center was partly compensated by an increase of diameters (P<0.05), and thus by an increase of blood flow in these functional microvessels (P<0.05) over time. Histologic analysis demonstrated both expanding and infiltrating growth patterns, as well as focal necroses on day 22. These are the first data from repeated in vivo analysis of glioma growth, vascularization, and microcirculation.
Marked microvascular proliferation, indicating a high degree of neoangiogenesis, is a characteristic histologic feature of malignant glioma (Deane and Lantos, 1981) and has been shown to be of prognostic value in patients with astroglial tumors (Leon et al., 1996). Without this continuous formation of new blood vessels, malignant gliomas do not progress to a clinically relevant size because of limitations in oxygen and nutritional supply (Folkman, 1990; Millauer et al., 1994). Induction of glioma neoangiogenesis seems to be based on genetic transformation of glioma cells (Abe et al., 1993), or on intratumoral hypoxia or nutritional deficiency (Ikeda et al., 1995; Shweiki et al., 1995). So far, numerous angiogenic factors have been identified in human brain tumor biopsy material (Stefanik et al., 1991; Plate et al., 1992; Plate et al., 1994). Accordingly, several novel angiostatic approaches have been proposed for glioma therapy (Millauer et al., 1994; Takamiya et al., 1994; Stan et al., 1995). In addition to glioma angiogenesis, changes in glioma microcirculation play an important role for therapeutic considerations. The efficacy of radiotherapy generally depends on local tissue P
Despite this impact of the vascular compartment on glioma physiologic makeup and potential therapeutic strategies, there is still a significant lack in the understanding of the complex mechanisms underlying glioma angiogenesis and changes in glioma microcirculation. This is partly because of limitations of available assays to adequately reflect the dynamic relation between glioma growth, angiogenesis, and microcirculation. Studies performed in vitro address glioma angiogenesis by analyzing the attachment of endothelial cells to matrix proteins, microvascular proliferation, and vascular tube formation in response to glioma cell–conditioned media (Abe et al., 1993; Nida et al., 1995). Studies based on in vivo experiments evaluate glioma angiogenesis and microcirculation solely by indirect techniques such as histologic vessel counts (Wesseling et al., 1994), three-dimensional vascular corrosion casts (Orita et al., 1988), microangiography by injection of dyes (Bernsen et al., 1995), and blood flow measurements applying [14C] iodoantipyrine autoradiography (Whittle et al., 1996), 133Xe-washout (Andrade et al., 1992), Laser-Doppler flowmetry (Foltz et al., 1995), or perfusion-weighted magnetic resonance microimaging (Abramovitch et al., 1995). Taken together, these procedures have distinct disadvantages. Postmortem approaches are invasive, limited to a single observation time point, and bear the danger of artefacts arising from methodologic problems or fixation techniques. Laser Doppler flowmetry and magnetic resonance microimaging provide only a low spatial resolution, with little information on distinct vascular development.
Intravital microscopy represents an ideal tool to quantitatively assess the dynamic process of angiogenesis and microvascular perfusion of normal and neoplastic tissue (Leunig et al., 1992; Menger et al., 1994; Vajkoczy et al., 1995a, 1995b, 1997). It allows for a direct, continuous, and noninvasive visualization of the microvasculature at the level of individual microvessels and for quantitative evaluation of microhemodynamic parameters. Yuan and others (1994) and Foltz and colleagues (1995) reported the intravital microscopic analysis of malignant gliomas transplanted into a cranial window preparation. This model, although elegant with the pia as the host tissue, is limited to the visualization of a fully developed glioma microvasculature at one individual time point, and does not allow for a detailed analysis of the dynamic process of angiogenesis induced by proliferating glioma cells. Thus, these studies failed to demonstrate the relation of glioma growth and microcirculation in a chronic model over time. This, however, is of essential interest, especially in the early stages of tumor growth when subtle alterations are difficult to visualize.
To further address this objective, we developed a noninvasive, in vivo model that allows for the simultaneous and repetitive analysis of malignant glioma growth, angiogenesis, and microcirculation. With the use of the dorsal skinfold chamber preparation in the nude mouse (Vajkoczy et al., 1995a) and the transplantable C6 rat glioma cell line, intravital epiillumination microscopic study, coupled with a multiple-fluorochrome labeling technique, allowed for simultaneous visualization of individual proliferating glioma cells, angiogenic microvessels, and circulating leukocytes over a period of up to 3 weeks. With respect to glioma growth, we report the characteristics of glioma angiogenesis and microcirculation in terms of total and functional vascular densities, vessel diameter, red blood cell velocity, microvascular blood flow, microvascular permeability, and leukocyte–endothelial cell interaction.
METHODS
Animal and tumor model
The experiments were performed in athymic, adult nude mice (nu/nu; male, 28 to 32 g), bred and maintained within a specific pathogen-free environment. The microsurgical techniques for the implantation of the dorsal skinfold chambers, as well as for the indwelling venous catheters, have been previously described in detail (Vajkoczy et al., 1995a). Briefly, animals were anesthetized with ketamine/xylazine (7.5 mg ketamine hydrochloride and 2.5 mg xylazine/100 mg body weight, subcutaneously). Using microsurgical techniques, two symmetrical titanium frames were implanted into the dorsal skinfold so as to sandwich the extended double layer of skin. One layer was completely removed in a circular area of 15 mm in diameter, and the remaining layer, consisting of striated muscle, subcutaneous tissue, and epidermis, was covered with a glass coverslip incorporated into one of the frames. This observation window allows for repeated intravital microscopic observations of the microvasculature. The backside of the preparation is open, thus allowing a three-dimensional growth pattern of the implanted glioma cells. To eliminate the effects of surgical trauma, chambers were implanted 2 days before glioma cell implantation. The animals tolerated the skinfold chamber well and showed no signs of discomfort. In particular, no effects on sleeping and feeding habits were observed. For administration of fluorescent markers, a fine polyethylene catheter was inserted into the jugular vein, passed subcutaneously to the dorsal side of the neck, and sutured to the titanium frames.
The C6 rat glioma cell line, generated by exposure of rats to N-nitrosomethylurea, has been used extensively as an glial neoplasm model in the nude mouse (Peterson et al., 1994). The glioma cells were frozen in HAM's F-10 culture medium with 10% DMSO, grown in HAM's F-10 culture medium, and plated in 12-well dishes for incubation in a 5% carbon dioxide–humidified atmosphere at 37°C. For glioma cell implantation, awake animals were restrained in a plexiglass tube. The coverslip of the dorsal skinfold chamber was temporarily removed, and a dense glioma cell suspension was placed directly onto the surface of the striated skin muscle. Before tumor inoculation, C6 glioma cells were incubated for 2 hours with the fluorescent neuronal tracer Fast Blue (Kuypers and Huisman, 1984; Sigma Chemical Co., St. Louis, MO, U.S.A.). The tracer is taken up by both mitochondria and nucleus of all cells when exposed to Fast Blue–containing medium and is characterized by a bright blue fluorescence with only little bleaching at an excitation wave length of 365 nm (Chicoine and Silbergeld, 1995). Pilot in vitro studies revealed that the fluorescence persists through several cell generations for up to 3 weeks without affecting cell viability.
Intravital microscopy
After cell inoculation, glioma growth and vascularization were documented daily by photomicroscopic study. Repeated intravital fluorescence microscopy (epiillumination) was performed on days 6, 10, 14, 18, and 22 after glioma cell implantation using a modified Axiotech Vario microscope with a 100-W mercury lamp attached to a Ploema-Pak illuminator with an ultraviolet (excitation wave length: 340 to 380 nm), a blue (450 to 490 nm), and a green (520 to 570 nm) filter block (Zeiss, Oberkochen, Germany). For this purpose, the animals were anesthetized (7.5 mg ketamine hydrochloride and 2.5 mg xylazine/100 mg body weight, subcutaneously), immobilized in a plexiglass tube, and the chamber preparations were placed on the microscope stage. Observations were made using ×3.2 long-distance, ×10 long-distance, and ×20 water immersion working objectives (all Zeiss, Oberkochern, Germany), resulting in magnifications of ×71, ×216, and ×435, respectively. To standardize the repeated intravital microscopy of the heterogeneous glioma microvasculature, the tumor mass and the peritumoral tissue were divided into three radial zones (peritumoral, marginal, and central) at high magnification using the ×20 water immersion working objective. On each day, the newly formed microvasculature was investigated individually within these distinct zones (two to three fields zone), resulting in a total of six to nine measurements per animal and per observation time point. Microscopic images were recorded by means of a low-light level charge-coupled device video camera (Cohu FK 6990, Pieper, Schwerte, Germany) and were transferred to a S-VHS video system (Panasonic, Munich, Germany) for off-line evaluation. Fast Blue labeling of glioma cells allowed for precise delineation of the glioma from the surrounding, unaffected host tissue with ultraviolet light epiillumination. By contrast enhancement with 2% fluorescein isothiocyanate (FITC)–dextran (0.1 mL FITC-dextran150 intravenously; molecular weight [Mw] = 150,000; Sigma) and use of the blue light epiillumination, angiogenic sprouts, individual microvessels, and, finally, the glioma microvasculature were visualized. Furthermore, extravasation of FITC-dextran150 allowed for an estimate of the microvascular permeability to circulating macromolecules throughout the observation period. Simultaneous in vivo staining of leukocytes with 0.2% rhodamine 6G (0.1 mL intravenously; Sigma) and the use of green light epiillumination enabled sequential analysis of leukocyte–endothelial cell interaction within individual glioma microvessels. In addition to these repeated intravital microscopic observations of the glioma microvasculature, glioma vessel permeability to circulating molecules in mature gliomas was assessed in detail on days 18 and 22. Therefore, fluorescent markers with distinct mean molecular weights (Na-fluorescein, Mw = 376) and FITC-dextrans (FITC-dextran150 and FITC-dextran500, Mw = 500,000, respectively) (all Sigma) were injected intravenously. Extravasation of the test molecules was analyzed 5, 15, and 30 minutes after administration, applying the following semiquantitative score: no extravasation (–); moderate extravasation (increased extravasal gray levels without negatively contrasted microvascular imaging) forming a patchy (+) or homogeneous (++) pattern; extravasation with negatively contrasted microvascular imaging (+++).
Analysis of parameters
Glioma growth was assessed by measurements of the area covered by the glioma mass within the chamber (mm2) and the tumor volume (mm3), which was calculated according to V = ⅔ × A × h, where A is the area of the glioma mass and h the thickness of the glioma bulging out at the chamber backside. Quantitative analysis of microcirculatory parameters included the area containing newly formed microvessels (mm2), the total vessel length per area (cm−1) (defined as length of all newly formed microvessels per area of interest and observation time point), the functional vessel length per area (cm−1) (defined as length of red blood cell perfused microvessels per area of interest and observation time point), microvessel diameters (μm), and microvascular red blood cell velocities (μm/second). All measurements were performed by means of a computer-assisted image analysis system (CAPIMAGE, Zeintl Software Engineering, Heidelberg, Germany). Newly formed glioma microvessels were not categorized into arterioles, capillaries, and venules, since this classification is based on morphologic and physiologic criteria for normal tissue and might thus not be applicable to tumors (Jain, 1988). A perfusion index (PI) was calculated as the percentage of the functional vessel length per area (FVL) and total vessel length per area (TVL) as follows: PI = FVL/TVL × 100. Blood flow rate Qv (nL/second) of individual microvessels was calculated according to Qv = π × (D/2)2 × RBCV/K, where RBCV represents the red blood cell velocity, D the microvessel diameter, and K (= 1.3) the Baker/Wayland factor (Baker and Wayland, 1974) considering the parabolic velocity profile of blood in microvessels.
Histology and immunohistochemistry
At the end of the in vivo experiments, the animals were killed, and the chamber tissue was excised and processed for histologic and immunohistochemical analysis. The specimens were fixed with 10% paraformaldehyde and embedded in paraffin. For conventional histologic study, 3-μm sections were stained with hematoxylin–eosin. For immunohistochemical detection of the glial fibrillary acidic protein and S-100 protein, 3-μm sections were incubated with appropriately diluted anti–glial fibrillary acidic protein (1:100) and anti–S-100 protein (1:300) antibodies (both Dako, Hamburg, Germany) and with biotinylated secondary antibodies. Specimens were finally incubated with avidin–biotin–horseradish complex (Vector Laboratories, Burlingame, CA, U.S.A.), developed with Fast Red (Sigma), and counterstained with Hemalaun (Merck, Darmstadt, Germany). Controls were performed without primary and secondary antibodies to exclude nonspecific staining.
Statistical analysis
Quantitative data are given as mean values ± standard deviation. Mean values of microcirculatory data were calculated from the average values in each animal. Comparisons of dependent variables over the observation period were tested using the paired Student's t test and Bonferroni probabilities for repeated measurements. Interrelations between glioma size and glioma microcirculation were assessed with univariate linear regression analysis. Results with P<0.05 were considered significant.
RESULTS
Pilot studies
Initially, pilot studies were performed to establish and standardize the glioma model in the dorsal skinfold chamber of nude mice. In these experiments, the number of implanted C6 glioma cells was titrated between 5 × 10⁴ and 5 × 10⁶ glioma cells, aiming at a sufficient take rate of the tumors, a high optical quality enabling visualization of early angiogenic response during the first days of glioma vascularization, and adjustment of glioma growth characteristics to the finite lifetime (3 to 4 weeks) of the chamber preparation.
The pilot studies revealed that after implantation of 5 × 10⁴ glioma cells, tumor growth and angiogenic response were markedly retarded during the initial 14 days, thus resulting in a relatively small glioma mass at the end of the 22-day observation period. In contrast, after implantation of 5 × 10⁶ glioma cells, the glioma mass rapidly overgrew the chamber size, and optical quality for intravital microscopic observations was poor because of the dense glioma cell mass overlying the microvasculature of the host tissue. Therefore, visualization of glioma angiogenesis was possible only from day 10 to 14 after glioma implantation. Implantation of 5 × 10⁵ glioma cells guaranteed both a good optical quality for intravital microscopic analysis of glioma growth and angiogenesis throughout the entire observation period, as well as a tumor growth kinetics that respected the limited lifetime of the chamber preparation (~4 weeks). Therefore, the following experiments were performed with implantation of 5 × 10⁵ C6 glioma cells.
Glioma growth and vascularization
The take rate of the C6 rat glioma in the chamber preparation of nude mice was 100% (n = 15). Between days 2 and 4 after glioma cell implantation, first signs of glioma-induced angiogenesis were observed. They comprised a dilation and tortuous elongation of host vessels (Fig. 1), as well as the formation of microvascular sprouts and sinusoidal vessel configurations originating from host capillaries and postcapillary venules (Fig. 1). As verified by the multifluorescence technique, initial angiogenesis was observed only within the peritumoral zone. Microvascular sprouting was oriented multidirectionally rather than directed specifically toward the glioma cells. The newly formed microvessels subsequently branched and interconnected, forming complex microvascular networks in the peritumoral area that presented with red blood cell perfusion (Fig. 1). In this early phase, the area of the tumor mass was macroscopically characterized by local hyperemia and diapedesis of red blood cells, leading to multiple intratumoral hemorrhages. Between days 6 and 10, the area of the glioma mass was completely vascularized, and the yet dormant glioma started to grow steadily. The microvasculature was characterized by a homogeneous angioarchitecture, including a population of microvessels with diameters ranging between 8 and 16 μm (Fig. 1). With the glioma mass rapidly increasing in size between days 14 and 22, the microangioarchitecture appeared more heterogeneous and chaotic. During this period, the microvasculature could be classified into three distinct zones based on microvascular morphologic features: (I) the peritumoral zone comprised a region of high angiogenic activity with multiple capillary sprouts and microvessels measuring 8 to 16 μm in diameter (Fig. 2); (II) the marginal zone of the glioma mass was characterized by an irregular branching pattern of glioma vessels and some enlarged sinusoidal vessel configurations (diameter 20 to 40 μm) with heterogeneous blood flow; the angiogenic activity within this zone was dependent on the distance to the glioma center and decreased centripetally (Fig. 2); and (III) the central zone of the glioma mass revealed only few signs of neovascularization and contained a large amount of microvessels with either sluggish or no blood flow (no contrast enhancement) (Fig. 2). Throughout the whole observation period, neither significant accumulation of leukocytes nor leukocyte–endothelial cell interaction was observed within glioma microvessels.
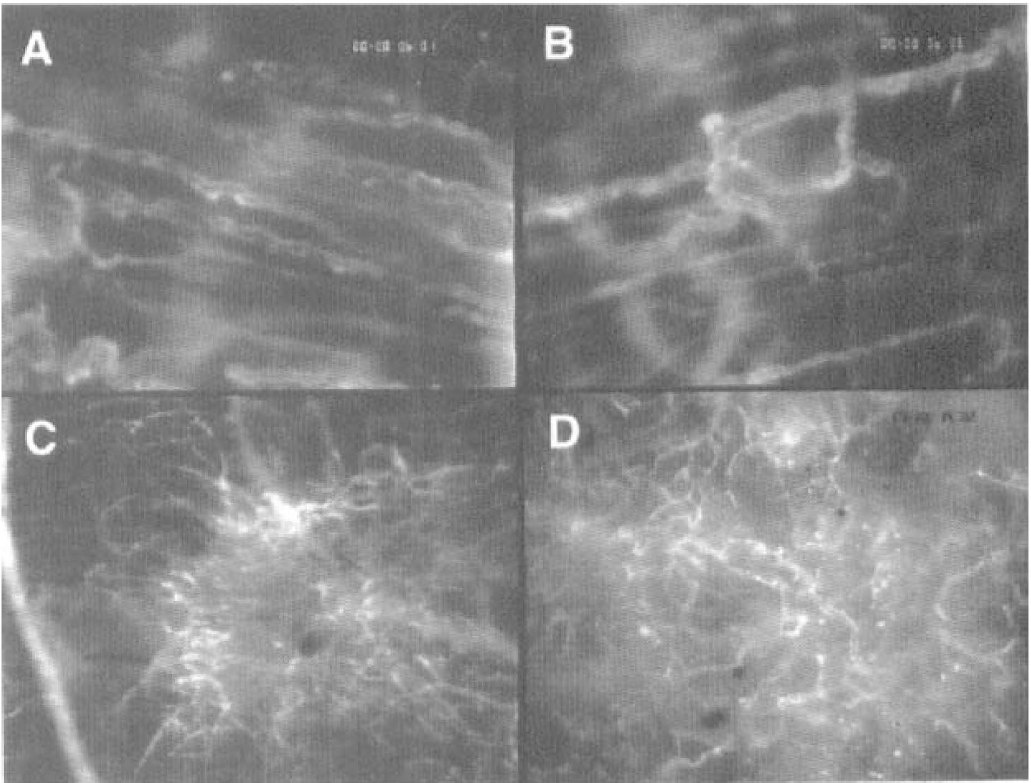
First signs of glioma-induced neovascularization on days 2 to 4 after C6 glioma cell implantation into the dorsal skinfold chamber preparation, characterized by dilated and tortuous host vessels (
Quantitative analysis revealed that the growth curves for the glioma area and glioma volume were characterized by an initial lag of tumor growth until day 6 after implantation, but subsequently followed linear and exponential kinetics, respectively (Fig. 3). The newly formed glioma microvasculature was not only confined to the labeled tumor mass but exceeded its size throughout the entire observation period, reflecting a significant peritumoral, glioma-induced neovascularization (Fig. 3). By day 22, the area of the glioma mass in general began to exceed the size of the observation window, and the glioma thickness measured approximately 10 mm.
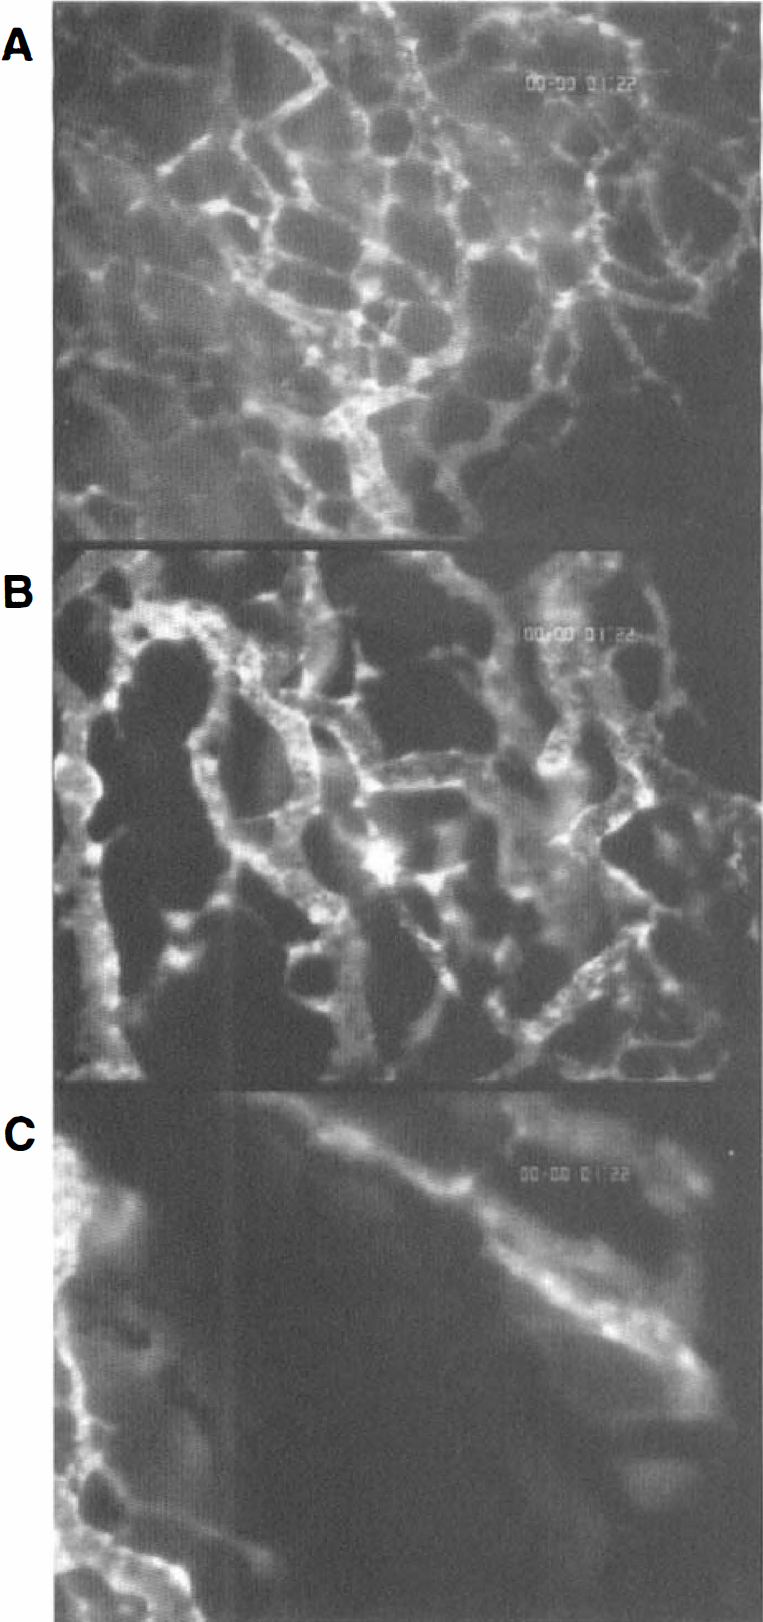
Glioma microvasculature on day 18 after C6 glioma cell implantation in the peritumoral (
Quantitative evaluation of microcirculatory parameters revealed persistent high values for both total and functional vessel length per area within the peritumoral zone during the whole observation period (Fig. 4A and Fig. 4B). In contrast to these peritumoral regions, total and functional vessel length per area within the glioma margin and center were lower and regressed, most prominent within the glioma center, over time (Fig. 4A and Fig. 4B). As a consequence, the microvasculature of the growing glioma was characterized by a zonal microvascular gradient with high vascular densities in the peritumoral zone and low vascular densities in the central zone. Calculation of the zonal perfusion indices from the functional and total vessel length per area revealed constant values (45% to 70%) between days 6 and 18 (Fig. 4C). However, on day 22, the marginal and central perfusion index decreased to values between 15% and 40%, indicating a further zone-dependent aggravation of microvascular dysfunction (Fig. 4C).
The dynamic relation between glioma growth and vascularization was further analyzed with respect to different tumor zones. Therefore, the functional vessel length per area of each zone was compared with the area covered by the glioma mass applying univariate regression analysis. No correlation was observed within the peritumoral and marginal zones of the glioma (Fig. 5A and Fig. 5B). In contrast, within the central zone, the functional vessel length per area was inversely related to glioma growth (Fig. 5C).
From days 6 to 14, mean diameters of the newly formed microvessels revealed no zonal differences. Whereas diameters of peritumoral microvessels persisted over time (diameterday 6 = 12.8 μm, diameterday 18 = 12.7 μm), diameters of perfused marginal and central vessels increased during the further observation period (days 14 to 22) by 36% and 60%, respectively (Fig. 6A). In parallel, analysis of red blood cell velocities revealed constantly higher values within peritumoral microvessels when compared with the low marginal and central microvascular red blood cell velocities (Fig. 6B). As a consequence, mean blood flow in peritumoral, marginal, and central glioma microvessels persisted at comparable values between days 10 and 18 after glioma cell implantation. However, on day 22, blood flow in individual marginal and central microvessels finally decreased (Fig. 6C).
Microvascular permeability
In parallel to the initial microvascular signs of glioma-induced neovascularization, a high microvascular permeability already was detectable within the first days after glioma cell implantation, which accompanied the process of subsequent glioma vascularization as evidenced by a significant peritumoral edema and microvascular leakage of FITC-dextran150. Detailed analysis in the mature glioma (days 18 and 22) revealed a strong molecular weight dependence of the microvascular permeability (Table 1). After injection of Na-fluorescein, a rapid and homogeneous extravasation of the low molecular fluorescent marker (Mw = 376) from the newly formed glioma microvessels was observed. Within a few minutes, the entire glioma microvasculature appeared in a negative contrast. In contrast, extravasation of the macromolecular markers FITC-dextran150 and FITC-dextran500 was markedly retarded and more heterogeneous. Extravasation was characterized by a patchy microvascular leakage pattern with areas of both minimal and maximal extravascular fluorescence that was often localized close to each other. Especially in large tumors, leakage in the glioma center appeared reduced when compared with the leakage within the peritumoral zones.
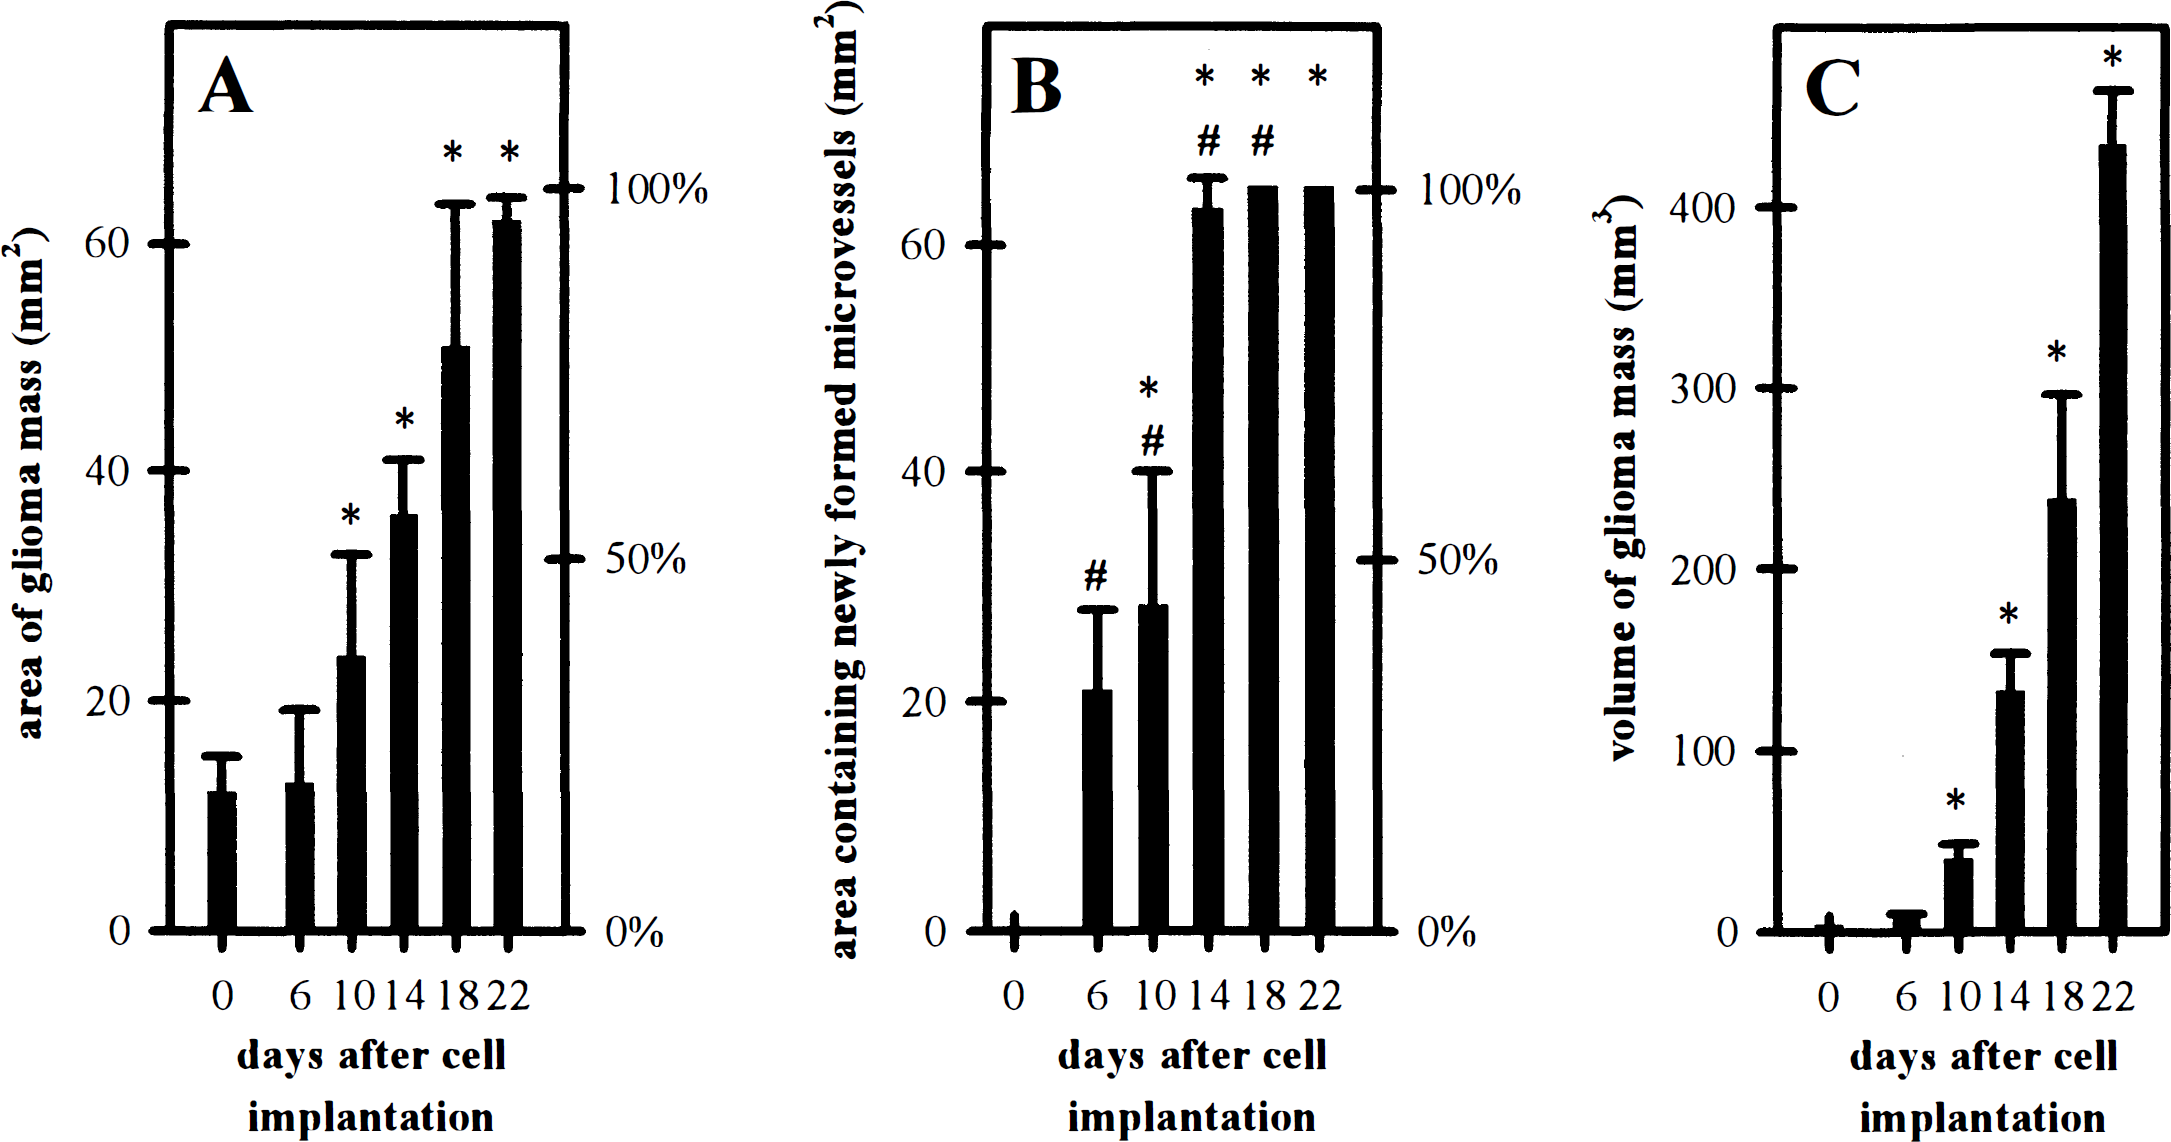
Area covered by glioma mass (
Histology
Histomorphologic analysis of the established tumor demonstrated an undifferentiated malignant glioma with small, anaplastic tumor cells and nuclear polymorphisms grown on the striated skin muscle and subcutaneous tissue of the chamber preparation. Both expanding growth and diffusely infiltrative growth into the underlying chamber tissue could be documented. On day 22, evidence for early glioma necrosis was observed within the center of the tumor mass. Immunohistochemical analysis revealed a weak detection of glial fibrillary acidic protein and strong staining for S-100 protein.
Extravasation of circulating test molecules with distinct molecular weights
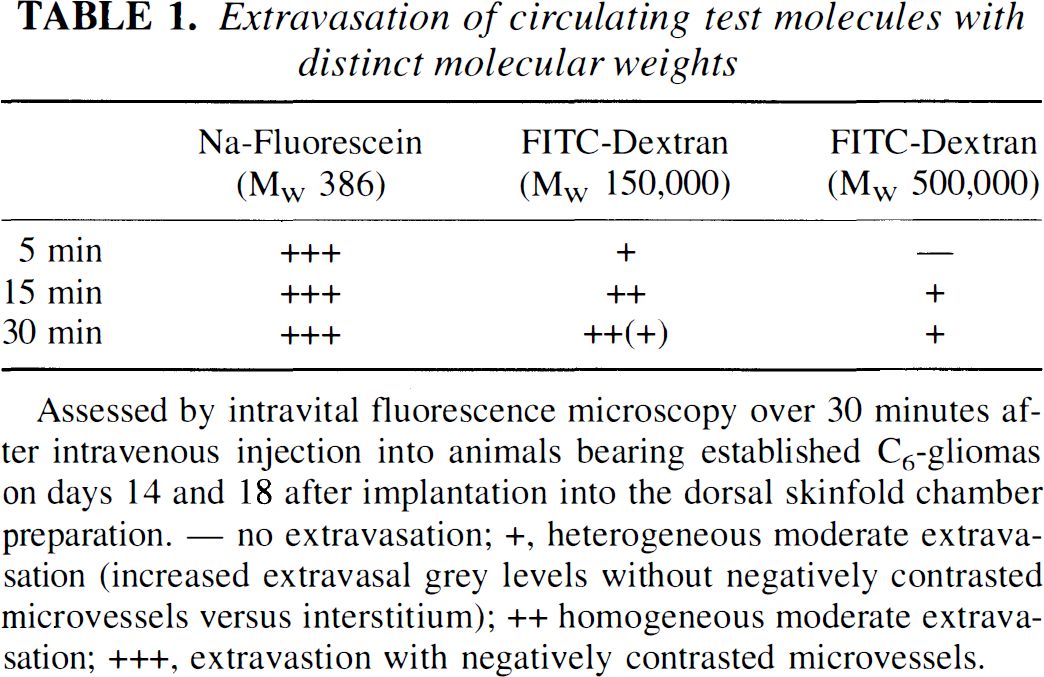
Assessed by intravital fluorescence microscopy over 30 minutes after intravenous injection into animals bearing established C6-gliomas on days 14 and 18 after implantation into the dorsal skinfold chamber preparation. — no extravasation; +, heterogeneous moderate extravasation (increased extravasal grey levels without negatively contrasted microvessels versus interstitium); ++ homogeneous moderate extravasation; +++, extravastion with negatively contrasted microvessels.
DISCUSSION
Like in most tumors beyond a certain size, malignant glioma proliferation depends critically on a high degree of neovascularization to guarantee adequate oxygen and nutritional supply (Folkman, 1990). The efficacy of the new microvasculature to meet the metabolic demands of the growing tumor is determined by morphologic (i.e., microangioarchitecture, microvascular density, perfusion index, vessel diameter), microhemodynamic (i.e., microvascular red blood cell velocity, blood flow rate), and rheologic (i.e., microvascular hematocrit, viscosity, cell deformability, cell aggregation/adhesion) parameters (Jain, 1988). We have, therefore, developed a novel in vivo approach that allows the repetitive study of the spatial and temporal relations of malignant glioma-induced neoangiogenesis and tests the functional state of the newly developed glioma microvasculature.
Discussion of model
We have previously used the hamster and mouse dorsal skinfold chamber preparation to investigate the microcirculatory phenomena after organ transplantation (Vajkoczy et al., 1995a,b, 1997). Based on these studies, we have further developed this experimental approach to follow angiogenesis and microcirculation during the progression of malignant glioma. Using a multiple fluorescent labeling technique, this model allows for the repetitive and simultaneous identification of individual glioma cells, the precise measurement of glioma growth, the visualization of individual glioma microvessels, and quantitative analysis of microcirculatory parameters, including microvascular leukocyte–endothelial cell interactions. The implantation of the rat C6 glioma cell line into the dorsal skinfold chamber preparation offers significant advantages. (1) The individual glioma and the development of its microvasculature can be observed in vivo noninvasively and repeatedly over a period of several weeks; therefore, our model allows the analysis of dynamic processes and requires less animals compared with studies applying invasive postmortem techniques. (2) In contrast to histologic vessel counts or global perfusion studies, the process of glioma vascularization can be directly assessed at the level of individual newly formed microvessels. (3) The identification of the glioma mass and differentiation between peritumoral and tumoral microvasculature allows for a high spatial resolution of glioma-induced angiogenesis and determination of microcirculatory characteristics. (4) To date, the early stage of glioma angiogenesis has received only little attention. The excellent optical clarity of our model enables, for the first time, monitoring of glioma-induced angiogenesis, even during early stages of tumor growth. (5) Glioma growth is not restricted and can be analyzed three-dimensionally. Similar to the brain as host tissue, both expanding and diffusively infiltrative glioma growth patterns can be observed. Furthermore, gliomas grow to large tumors (more than 400 mm3 on day 22) with early focal necrosis, thus allowing for analysis of microcirculatory characteristics in mature gliomas. (6) Our model provides direct access to the glioma mass for superfusion studies or invasive measurements (e.g., tissue P
However, this model also has some limitations. The glioma investigated in this preparation is based on a transplantable cell line. Thus, it may respond differently to treatment modalities directed toward the vascular compartment compared with primary tumor models (Field et al., 1991). Furthermore, C6 glioma cells are implanted into the dorsal skinfold of nude mice. The subcutaneous and muscle tissue, however, are well established implantation sites for studying brain tumors (Coomber et al., 1988; Millauer et al., 1994; Abramovitch et al., 1995). The rationale for transplanting gliomas subcutaneously is based on the hypothesis that the graft rather than the surrounding host tissue dictates the process of neovascularization as well as the manifestation of glioma microvascular characteristics and endothelial function. Accordingly, ultrastructural analyses of gliomas implanted into brain and muscle demonstrated that glioma vessels differed significantly from host vessels but not from each other with respect to vessel morphologic features and permeability, regardless of host tissues, which suggests comparability of cerebral and extracerebral implantation sites (Coomber et al., 1988). In addition, the findings of the current experiments are consistent with the results of previous histologic studies on gliomas that were implanted into the brain and were vascularized within a similar time period (i.e., 14 days after tumor cell injection; Deane et al., 1981).
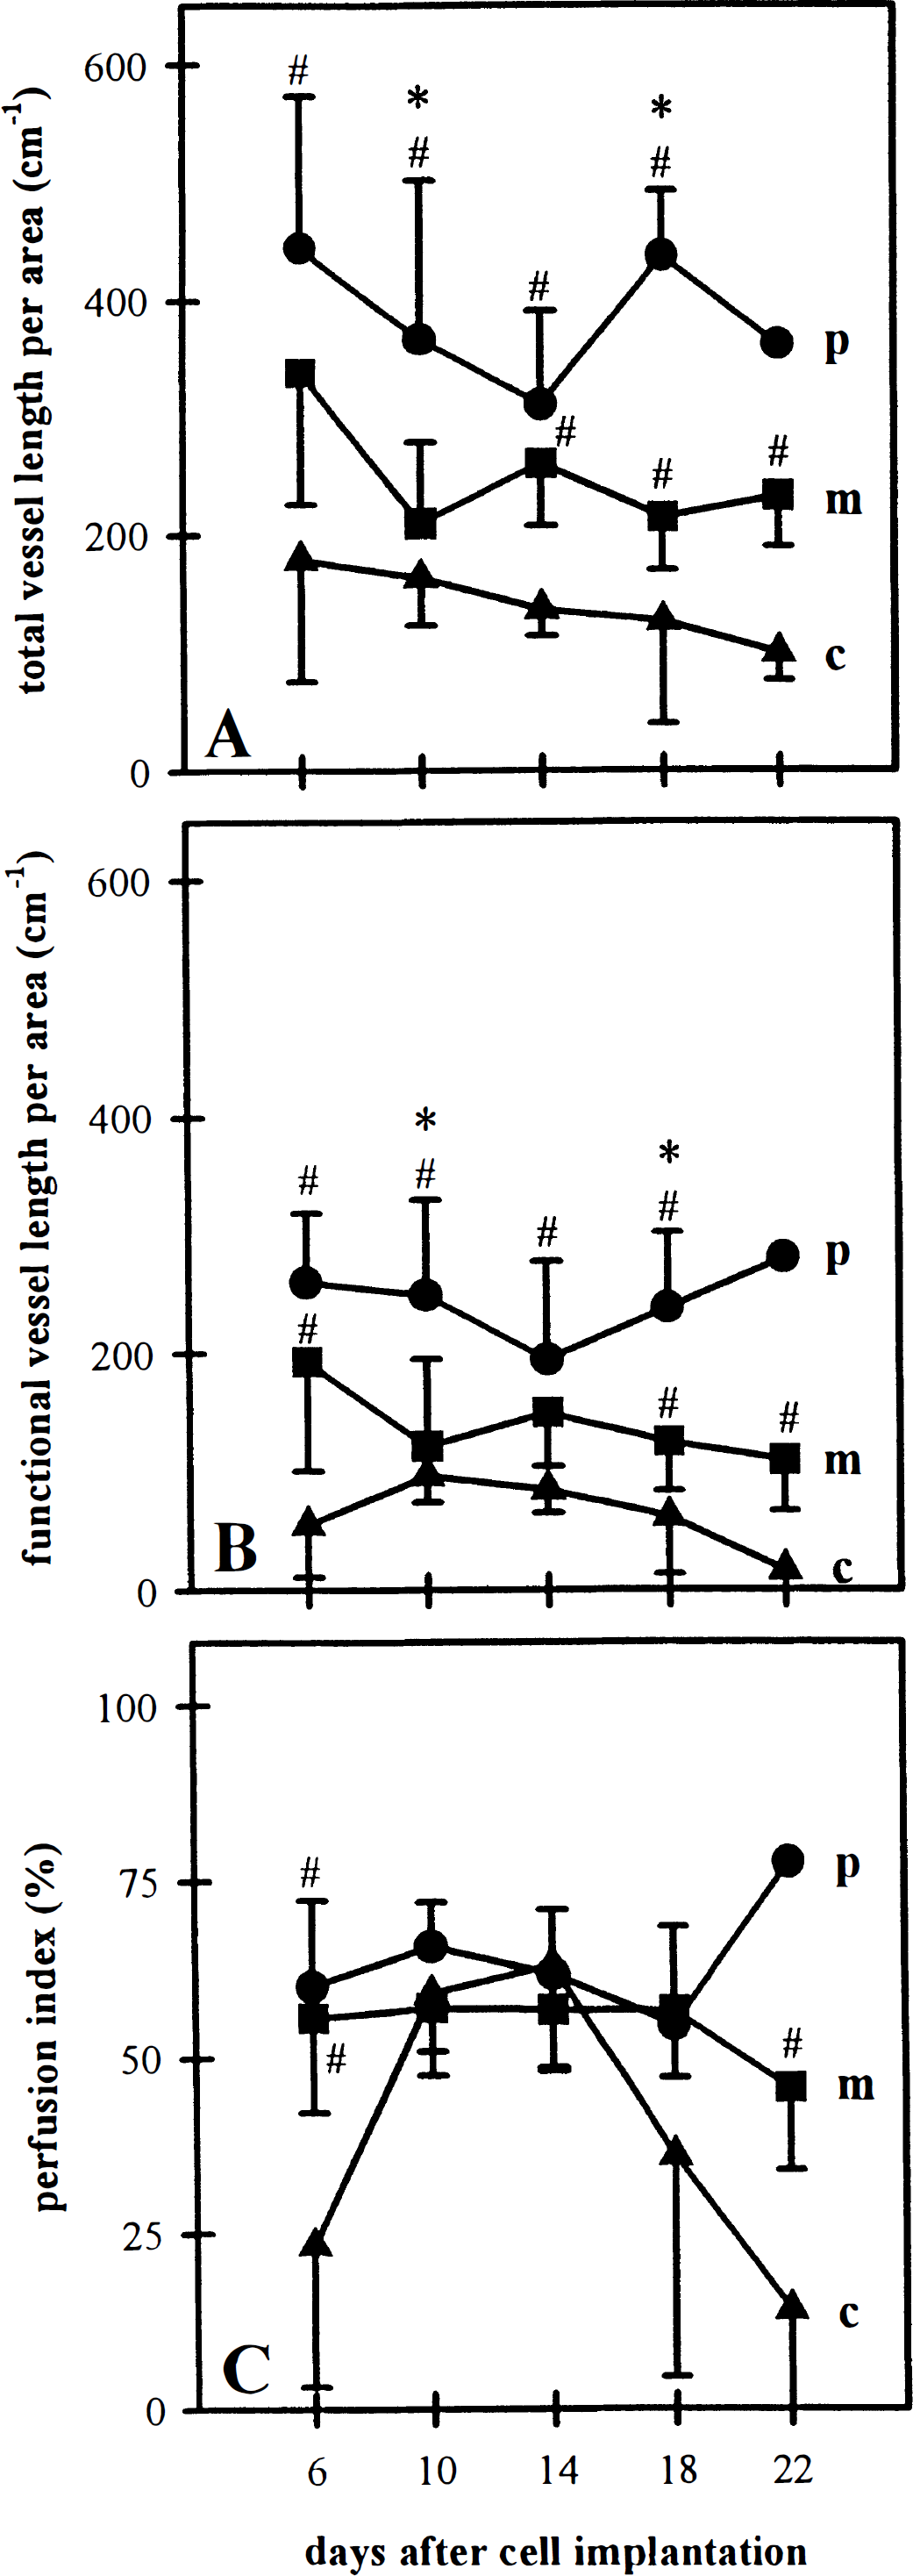
Total vessel length per area (
The use of the dorsal skinfold chamber model in the athymic nude mouse, presented here, may be further limited because it does not permit studying the lymphocytic infiltration of the tumor because of immunoincompetence of the animal. This might be of particular significance, since C6 gliomas, like other experimental brain tumors, provoke a specific immunologic response, including infiltration of lymphocytes and macrophages (Morioka et al., 1992; Whittle et al., 1996). However, by means of injecting ex vivo fluorescently labeled lymphocytes or subpopulations of lymphocytes, our model may have the advantage of enabling separate study of the role of distinct lymphocytic functions in the glioma-related immunologic response. The intravital microscopic approach would then allow visualization and quantification of infiltration kinetics and distribution of these cells.
Discussion of results
Time course and mechanisms of neovascularization
The processes of glioma growth and glioma vascularization were studied immediately after cell implantation and were divided into three stages: in stage 1, the avascular stage (day 0 to day 6) was characterized by a lag in glioma growth and by initial glioma-induced angiogenesis within the host tissue; in stage 2, the early phase of glioma vascularization (day 6 to day 14), a glioma microvasculature with a homogeneous population of microvessels was found established and, in parallel, glioma cells started to proliferate; and in stage 3 (day 14 to day 22), the microvasculature of the large tumors revealed a clear spatial division. Although a high angiogenic activity and thus functional vessel length per area was observed within the peritumoral region (i.e., where the tumor grows and expands), vascularization and microvascular perfusion progressively failed within the tumor center.
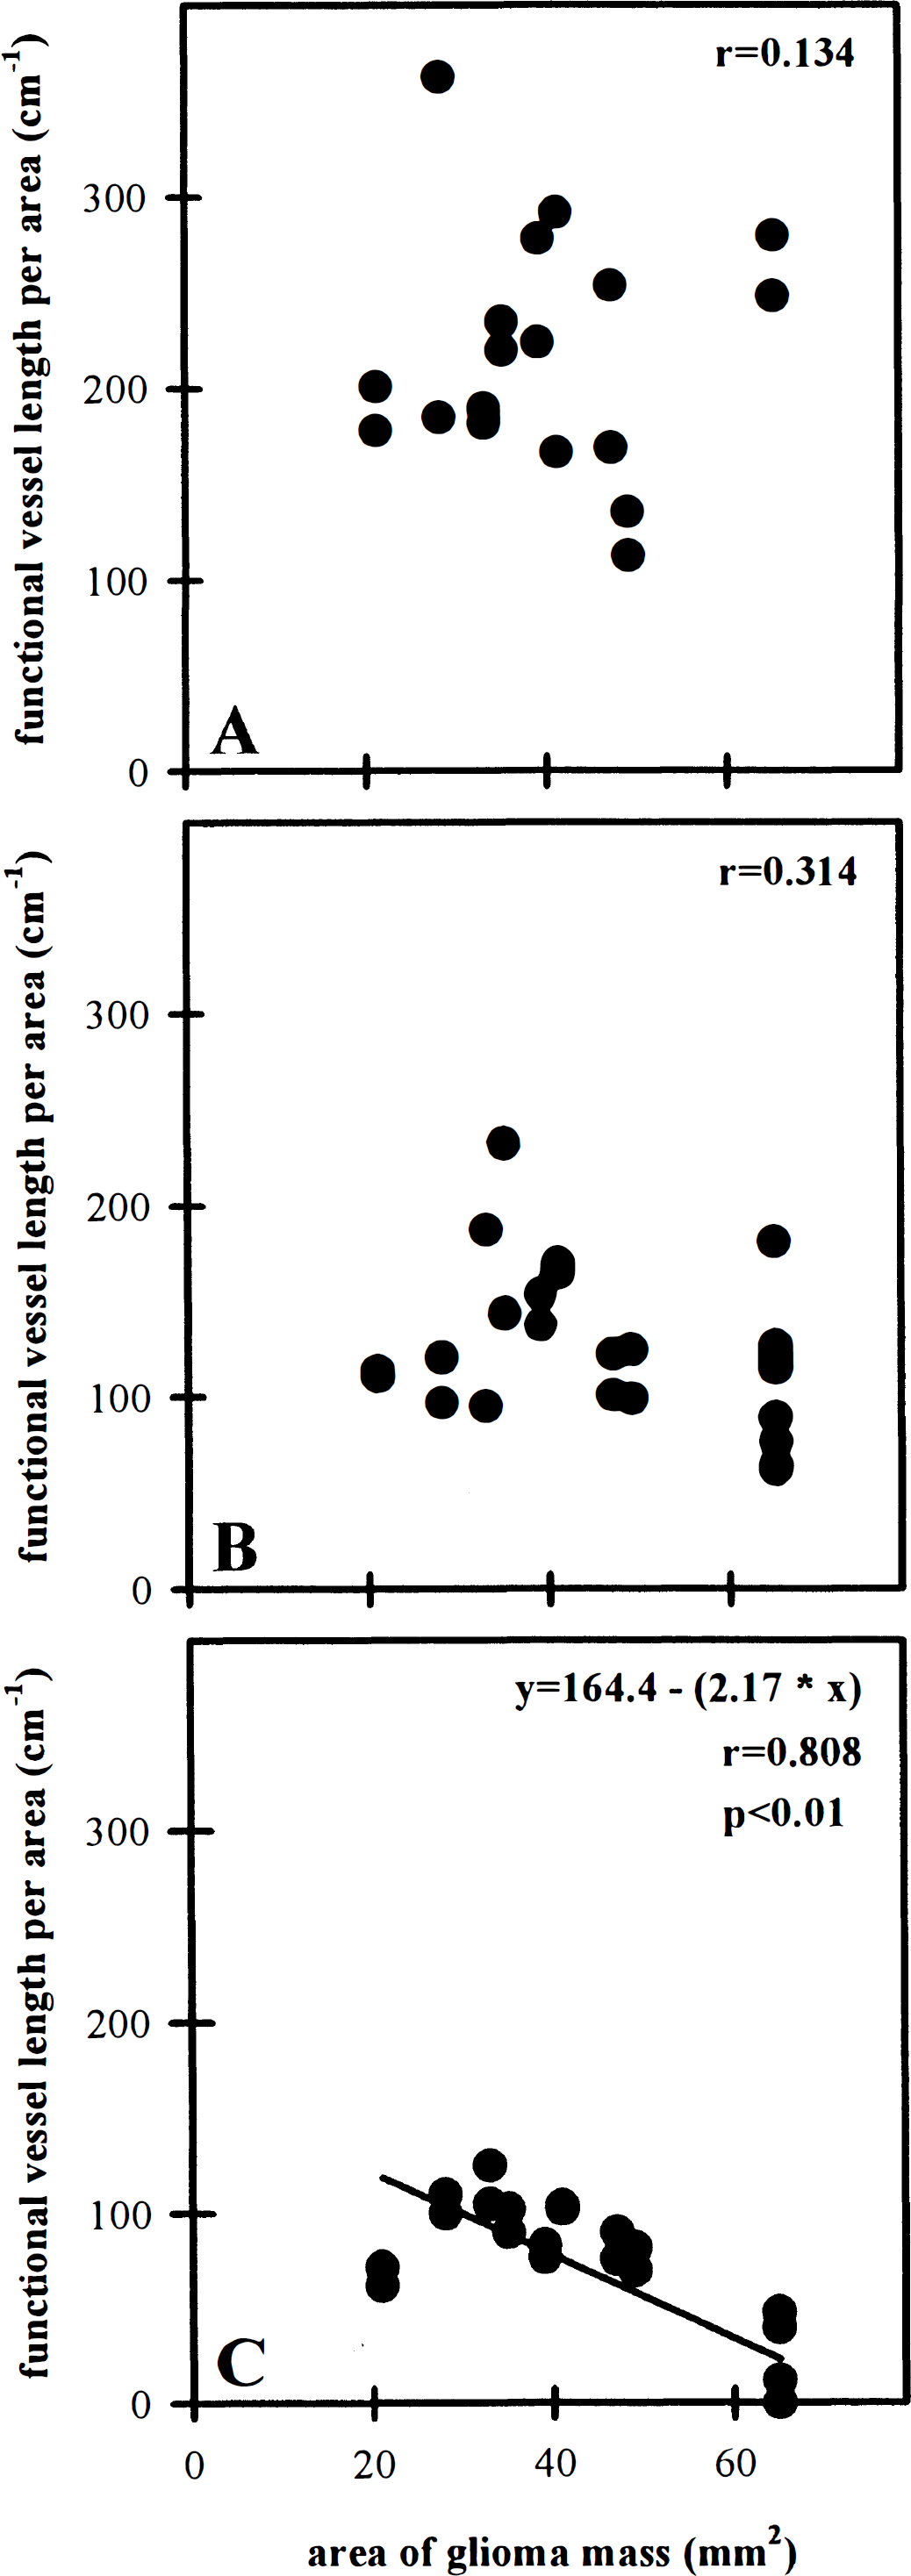
Relation between area covered by glioma mass and functional vessel length per area within peritumoral (
In the literature, three basic morphologic mechanisms of angiogenesis have been proposed: vascular sprouting, elongation of host vessels, and inosculation (i.e., anastomosis between preexisting host and tumor vessels) (Schoeffel, 1962; Ausprunk et al., 1975). Whereas the latter mechanism might be significant in the advanced stage of glioma vascularization, both vascular sprouting from preexisting host vessels and newly formed glioma vessels, as well as elongation of host vessels, may occur early in glioma growth. In fact, these mechanisms could be observed as soon as on day 2 after cell implantation. The glioma-induced sprouting during the following days was chaotic, multidirectional, and differed significantly from the classic—radially and unidirectional—sprouting, as described for muscular and corneal wound healing (Schoefl, 1962). The formation of peritumoral, multidirectionally growing microvascular networks thus could be interpreted as a consequence of this aberrant sprouting.
The process of glioma vascularization is thought to be mediated by angiogenic growth factors (e.g., acidic and basic fibroblast growth factor, vascular endothelial growth factor/vascular permeability factor [VEGF/VPF]). Hypoxia or nutritional deficiency have been identified as major stimuli for their release from the glioma mass (Ikeda et al., 1995; Shweiki et al., 1995). The finding of an angiogenic and microvascular gradient in the late vascular stage seems to be contrary to the finding that the expression of VEGF/VPF is particular abundant in glioma cells surrounding necrotic areas within the tumor center (Plate et al., 1994). This obvious spatial discrepancy between the release of angiogenic stimuli and the site of angiogenic activity might be best explained by an increased interstitial pressure in the tumor center during glioma growth and angiogenesis, resulting in a centrifugal pressure gradient and radial convective transport of angiogenic molecules to the glioma periphery (Jain and Baxter, 1988).
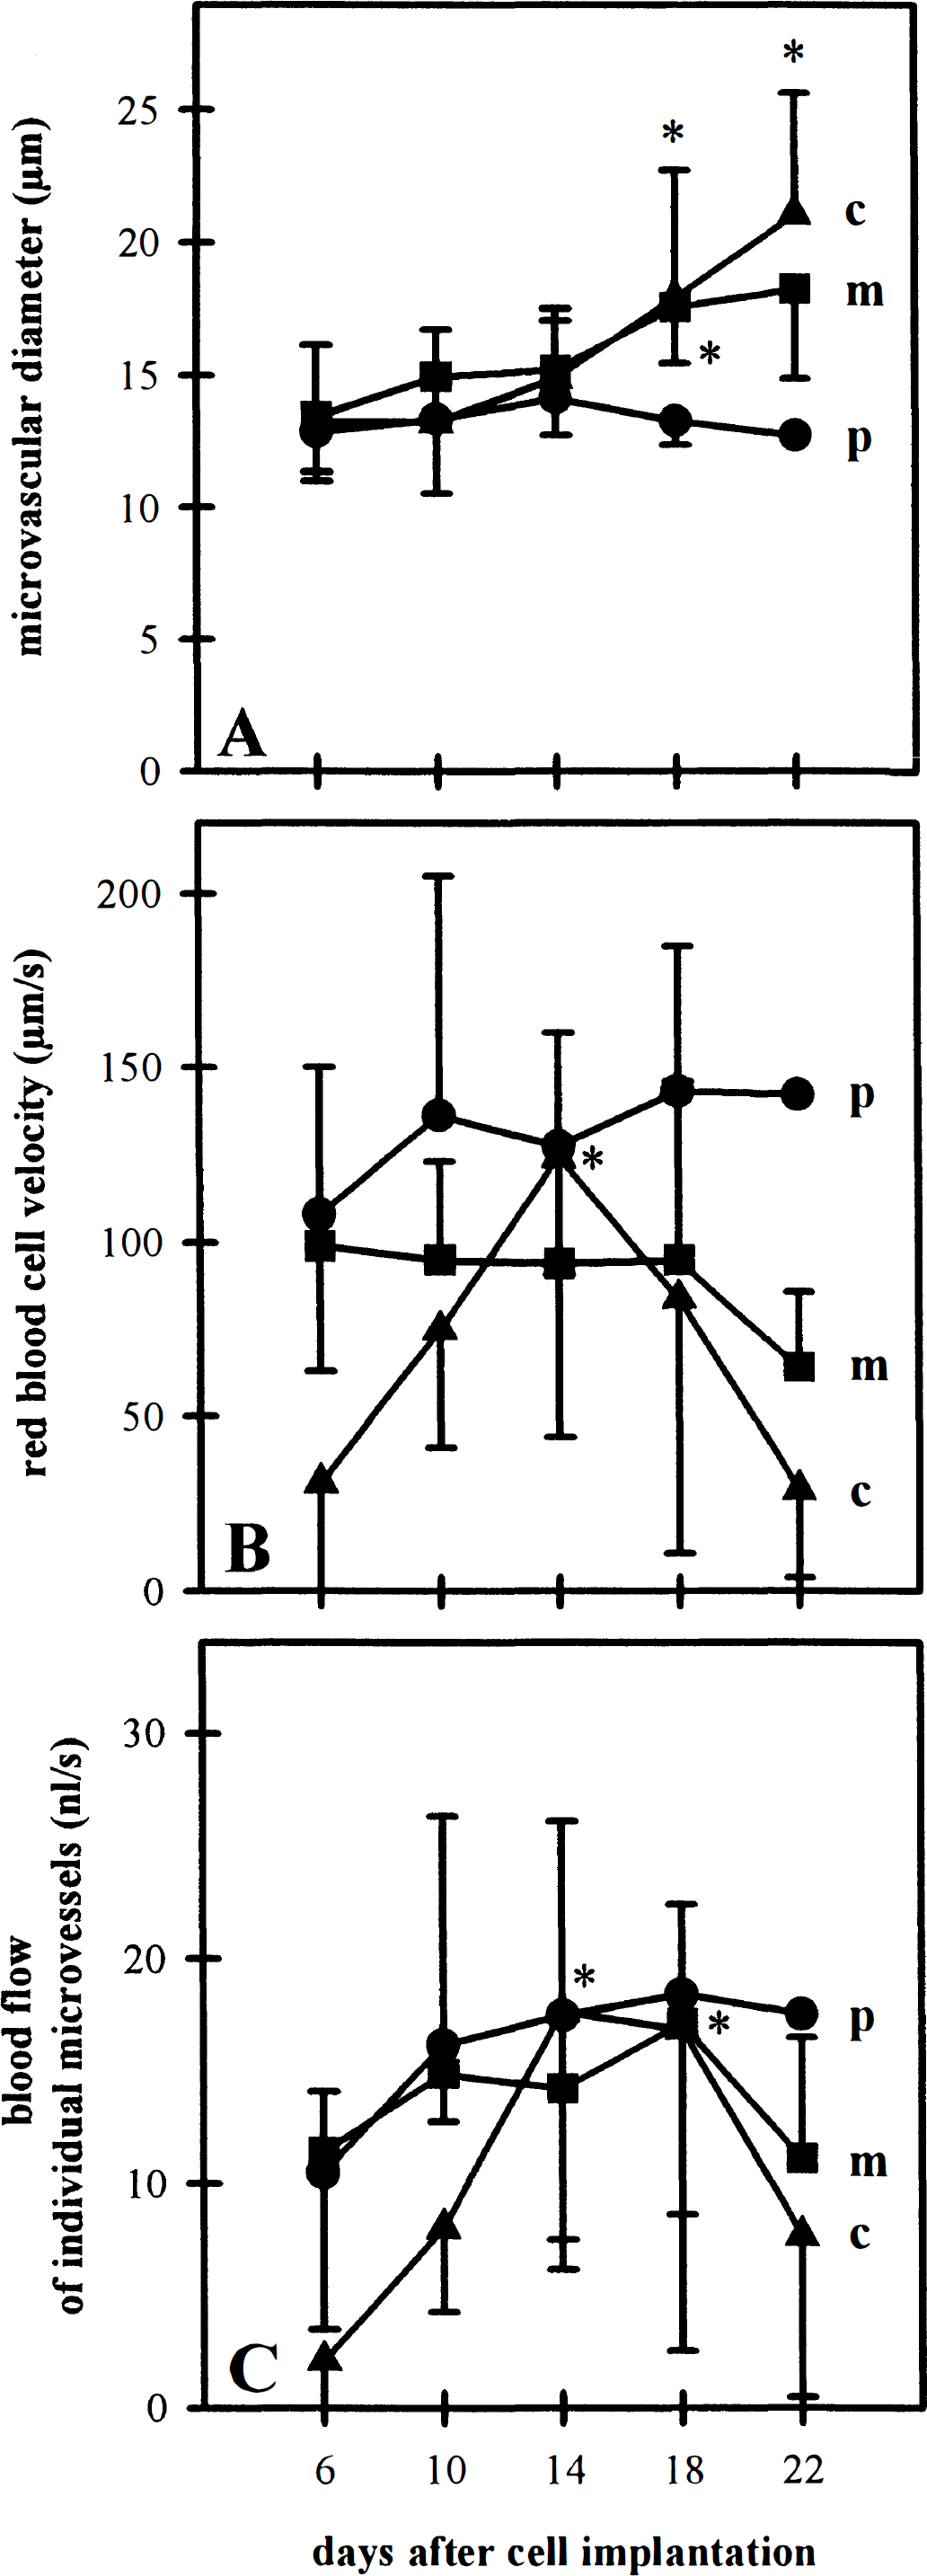
Microvessel diameter (
Characteristics of glioma microcirculation
According to a microcirculatory model by Intaglietta and Zweifach (1974), tissue perfusion Q (in mL/100 g/mm) is determined by the following equation:

where D represents mean vessel diameter; RBCV, mean red blood cell velocity; L, median vascular length (≈ functional vessel length per area); and S, vascular spacing (mean distance between microvessels). The number 6000 converts perfusion to milliliters per 100 g per minute. Thus, this equation suggests several potential mechanisms to maintain glioma blood flow, including a recruitment of unperfused microvessels, a dilation of individual microvessels, and an increase of red blood cell velocity. In fact, the current study identifies a widening of individual glioma vessels as the major mechanism to compensate for the progressive decrease of vessel length per area within the growing glioma tissue. The appearance of necrotic areas in the tumor center on day 22, however, suggests that this compensatory potential is only limited. As a consequence, progressive angiogenic deficits and perfusion failure might lead to localized areas of poor oxygenation, even within small gliomas (400 mm3). This is of clinical importance since a low P
Mechanisms of microvascular hyperpermeability
The formation of glioma-associated vasogenic edema is a major determinant of morbidity and mortality in glioma patients. This phenomenon has been attributed to an increased microvascular permeability after the secretion of VPF/VEGF by glioma cells (Strugar et al., 1995). Several ultrastructural examinations aimed at identifying the morphologic structures underlying this increased microvascular permeability. It is now well established that glioma vessels do not have blood–brain barrier characteristics (Stewart et al., 1991). Endothelial fenestrations, open intercellular junctions, and vesicular–vacuolar organelles have been discussed as the morphologic basis for the absence of a blood–glioma barrier (Deane and Lantos, 1981). The observed leakage of tracer molecules with a wide range of size (376<Mw<500,000) clearly confirms the absence of a blood–glioma barrier for the newly formed microvasculature. However, it cannot be concluded from the current experiments which of these morphologic structures are responsible for the leakage of the different test molecules. Nevertheless, individual extravasation kinetics might suggest distinct transport mechanisms for low and high molecular tracers. Thus, it might be hypothesized that leakage of small molecules is facilitated by intercellular gaps and fenestral diaphragms (Roberts and Palade, 1997), and that extravasation of circulating macromolecules takes place by vesicular–vacuolar organelles (Kohn et al., 1992).
In summary, the current study demonstrates that intravital microscopic study is a versatile technique to assess the complex relation of malignant glioma growth, vascularization, and microcirculation. In our understanding, the potentials and the advantages of the proposed model in the dorsal skinfold chamber preparation of nude mice by far outweigh its disadvantages. We propose that this model enables us to gain further insight into the basic mechanisms of glioma angiogenesis, as well as to develop and elucidate novel concepts of antivascular glioma therapy.
Footnotes
Acknowledgments
The authors thank Beate Wolf for excellent technical assistance and Professor Bleyl and his coworkers for their support.