
Abstract
The goal of this study was to determine the magnitude of “facilitated” amino acid transport across tumor and brain capillaries and to evaluate whether amino acid transporter expression is “upregulated” in tumor vessels compared to capillaries in contralateral brain tissue. Aminocyclopentane carboxylic acid (ACPC), a non-metabolized [14C]-labeled amino acid, and a reference molecule for passive vascular permeability, [67Ga]-gallium-diethylenetriaminepentaacetic acid (Ga-DTPA), were used in these studies. Two experimental rat gliomas were studied (C6 and RG2). Brain tissue was rapidly processed for double label quantitative autoradiography 10 minutes after intravenous injection of ACPC and Ga-DTPA. Parametric images of blood-to-brain transport (K1ACPC and K1Ga-DTPA, μL/min/g) produced from the autoradiograms and the histology were obtained from the same tissue section. These three images were registered in an image array processor; regions of interest in tumor and contralateral brain were defined on morphologic criteria (histology) and were transferred to the autoradiographic images to obtain mean values. The facilitated component of ACPC transport (∂KlACPC) was calculated from the K1ACPC and K1Ga-DTPA data, and paired comparisons between tumor and contralateral brain were performed. ACPC flux, K1ACPC, across normal brain capillaries (22.6 ± 8.1 μL/g/min) was >200-fold greater than that of Ga-DTPA (0.09 ± 0.04 μL/g/min), and this difference was largely (~90%) due to facilitated ACPC transport. Substantially higher K1ACPC values compared to corresponding K1DTPA values were also measured in C6 and RG2 gliomas. The ∂K1ACPC values for C6 glioma were more than twice that of contralateral brain cortex. K1ACPC and ∂K1ACPC values for RG2 gliomas was not significantly higher than that of contralateral cortex, although a ~2-fold difference in facilitated transport is obtained after normalization for differences in capillary surface area between RG2 tumors and contralateral cortex. K1ACPC, ∂K1ACPC, and K1DTPA were directly related to tumor cell density, were higher in regions of “impending” necrosis, and the tumor/contralateral brain ACPC radio-activity ratios (0 to 10 minutes) were very similar to that obtained with 0 to 60 minutes experiments. These results indicate that facilitated transport of ACPC is upregulated across C6 and RG2 glioma capillaries, and that tumors can induce upregulation of amino acid transporter expression in their supporting vasculature. They also suggest that early imaging (e.g., 0 to 20 minutes) with radiolabeled amino acids in a clinical setting may be optimal for defining brain tumors.
Keywords
Numerous amino acids have been synthesized with positron-emitting labels and used to image tumors. By far, the largest experience has been obtained with carbon-11 labeled methionine (Lilja et al., 1985; Ericson et al., 1985; Mosskin et al., 1987). With the exception of methionine and fluorotyrosine, there is little information available for other amino acids in human subjects with respect to the time course of uptake, the appearance of radiolabeled metabolites in blood and tissue, and the incorporation of label into protein. The interpretation and kinetic analysis of methionine (and most other amino acid) data is complicated by the rapid appearance of radiolabeled metabolites in blood and tissue, and because the rate of metabolism varies widely between patients (Hatazawa, et al., 1989; Ishiwata, et al., 1989). We have proposed and used non-naturally occurring amino acids, such as αaminoisobutyric acid (AIB) and 1-aminocyclopentane carboxylic acid (ACPC), for imaging brain tumors (Blasberg et al., 1981, 1983a, 1983b, 1984; Uehara et al., 1997). These amino acids were chosen because they are nonisomeric at the α-carbon (do not exist in optically active forms) and are not metabolized nor incorporated into protein in mammals (Noall et al., 1957; Oxender and Christensen, 1963). However, these amino acids are transported across brain and tumor cell membranes by stereospecific carrier systems (for reviews, see Guidotti et al., 1978; Shotwell et al., 1983; Saier et al., 1988).
In previous studies we used AIB and single-label quantitative autoradiographic techniques (QAR) to image and measure transport (K1) across brain and brain tumor blood vessels (Blasberg et al., 1980, 1981, 1983a, 1984). We considered the AIB transport measurements to reflect “passive” vascular permeability of the tumors, because the luminal surface of normal brain capillaries were known to be devoid of system “A” transporters (Betz and Goldstein, 1978) and AIB is predominately transported across cell membranes by the A system transporter (Oxender and Christensen, 1963; Christensen, 1990). In this study we performed similar experiments using [14C]-ACPC and gallium-diethylenetriaminepentaacetic acid ([67Ga]-DTPA). ACPC was selected because it has similar transport characteristics compared to methionine and is transported across cell membranes by both the L and A transport systems. In contrast to methionine, ACPC is not metabolized in mammals and the problems associated with imaging radiolabeled metabolites are avoided. To obtain corresponding measurements of passive vascular permeability, the [67Ga]-DTPA chelate was selected as a reference molecule. Double-label QAR experiments could be performed with this pair of radiolabeled tracers (Uehara et al., 1997), and the high spatial resolution autoradiography permits direct comparisons between ACPC transport and passive vascular permeability as measured by Ga-DTPA in specific tumor regions defined by morphologic characteristics seen in the corresponding histologic image. Two different experimental brain tumors (C6 and RG2) are compared in the rat; the C6 (Benda et al., 1968) and RG2 (Wechsler et al., 1972) cell lines are of glial origin.
The primary objective of this study was to determine the magnitude of “facilitated” ACPC transport across tumor and brain capillaries, and to compare these measurements in morphologically defined tumor regions. The secondary objective was to compare the ACPC K1 measurements (0 to 10 minutes) to our previously reported 0- to 60- minute measurements of apparent distribution volume (Uehara et al., 1997) in comparable groups of animals. This study reports convincing data which suggests that facilitated transport of ACPC is upregulated across C6 and RG2 glioma capillaries, and that 0- to 10- minute ACPC experiments yield tumor images similar to that observed in 60-minute experiments (Uehara et al., 1997).
METHODS AND MATERIALS
Cell culture
The C6 glioma cell line (Benda et al., 1968) was obtained from the Memorial Sloan-Kettering Cancer Center tissue culture bank; and RG2 (Wechsler et al., 1972) cells were provided by Daryl Bigner, Duke University. The C6 glioma cell line was grown as a monolayer in F-10 media with 17.5% fetal calf serum using T-150 flasks (Falcon; Becton Dickinson and Co., Lincoln Park, NJ). RG2 cells were grown as monolayers in minimal essential medium with 10% fetal calf serum and nonessential amino acids in T-150 flasks. The cultures were maintained in an incubator with 5% CO2, 80% humidity at 37°C. Cells were passaged each week or used for implantation after having become 90% confluent.
Tumor inoculation
Fifteen male rats weighing 230 to 270 g were studied: 7 Fisher 344 rats bearing RG2 gliomas, 8 Wistar-Furth rats bearing C6 gliomas. The rats were anesthetized with the gas mixture consisting of 5% of isoflurane, 65% of nitrous oxide, and 30% of oxygen and they were maintained with 1.5% isoflurane. Two percent Lidocaine gel was applied to the ears and the head was fixed to a stereotactic apparatus. After a midline scalp incision, a 2-mm burr hole was made 3 mm lateral from the sagittal suture and 1 mm posterior from the coronal suture. Then, stereotactically, a 25-gauge needle attached to a Hamilton syringe was inserted to 6 mm depth from the dura mater and 5.0 × 10⁵ tumor cells in 10 μL medium was injected into the right caudate nucleus over 5 minutes. After this procedure, the animals were placed in standard cages with normal feedings. The experimental protocol was approved by the Institutional Animal Care and Use Committee.
Isotope preparation
[67Ga]-DTPA was prepared by mixing [67Ga]-citrate (42 Ci/mmol) solution purchased commercially (Mallinckrodt Medical, Inc., Hicksville, NY) with one tenth volume of a 10−2 mol/L DTPA and 3.0 × 10⁻² mol/L CaCl2 saline solution and adjusted to pH 7.4. ACPC (1-[carboxyl-14C]-; 55 mCi/mmol) was purchased commercially (American Radiolabeled Chemicals, Inc., St. Louis, MO). [67Ga]-DTPA and [14C]-ACPC were assayed by high-performance liquid chromatography before use to confirm purity greater than 98%.
Animal preparation and study
Twelve days after tumor implantation, the animals were fasted for 12 hours followed by placement of femoral artery and vein catheters under gas anesthesia. The rats were immobilized by wrapping them with a loosely fitting plaster bandage and allowed to recover from anesthesia for at least 1 hour before study (Sokoloff et al., 1977). Body temperature was maintained at 37°C with a heat lamp, automatically controlled by a small rectal temperature probe. Just before intravenous injection of [14C]-ACPC (25 μCi in 0.5 mL saline solution), constant withdrawal of arterial blood was begun at a rate of 0.025 mL/min (Harvard Apparatus, Southnatick, MA). Five minutes after injection of [14C]-ACPC, [67Ga]-DTPA (5 mCi in a 0.5 mL saline solution) was injected intravenously. At 10 minutes (5 minutes after [67Ga]-DTPA injection) the rat was injected intravenously with a lethal dose of pentobarbital (150 mg/kg), decapitated, and a blood sample obtained. The brain was then rapidly extracted and frozen in liquid freon. The 10-minute blood sample and a measured fraction of the total blood withdrawn during the experiment were processed for measurements of whole blood and plasma radioactivity and hematocrit. The blood and plasma concentration-time integral (input function) was calculated as previously described (Gjedde, 1982).
Radioactivity assay
All blood and plasma samples were solubilized (Soluene-350), Packard Instrument Co., Inc., Meriden, CT) and assayed for radioactivity. Initially, [67Ga] radioactivity was measured in a 3-channel γ-counter (AutoGamma 5550 Spectrometer; Packard Instrument Co., Inc.) using narrow windows settings and decay correction. The samples were then stored at 4°C for 45 days to allow for [67Ga] decay (14 half-lives). A scintillant (Insta-Fluor; Packard Instrument Co., Inc.) was added and [14C] radioactivity was determined by liquid scintillation counting (Tri-Carb Liquid Scintillation Analyzer, Model 1600TR; Packard Instrument Co., Inc.) using external standard quench corrections.
Double-label QAR The tissue processing and autoradiographic techniques were described previously (Blasberg et al., 1980 and Uehara et al., 1997). Briefly, serial coronal sections of the brain were cut at 20 or 10 μm thickness at intervals of 480 μm in a cryomicrotome at -13°C. The 20-um sections were used for autoradiography and histology. This cryosectioning sequence was repeated five to eight times resulting in an axial sampling of 24 to 38 mm. [67Ga] autoradiographic standards were prepared from liver homogenates; the homogenates were uniformly mixed with known amounts of isotope, frozen, and cut 20-μm thick in the cryomicrotome. The radioactivity of each standard was measured. Sixteen [14C]-methylmethacrylate standards (Amersham Corp., Arlington Heights, IL), previously calibrated to brain tissue radioactivity over the range of 4.4 to 2354 nCi/g brain, were also used. The tissue sections and autoradiographic standards were exposed to x-ray film (SB-5; Kodak, Rochester, NY) over two different intervals to generate two separate images representing the tissue distribution of [67Ga]- and [14C]-radioactivity, respectively (Uehara et al., 1997). All sections used for autoradiographic exposure were subsequently fixed in acetone and stained with toluidine blue.
Autoradiographic image analysis Digitization and registration of corresponding images from the two autoradiograms and histology was performed using a CCD-72 series video camera (Dage-MTI Inc., Michigan City, IN), a microcomputer imaging system and MCID software (Imaging Research Inc., Ontario, Canada). The optical density of the standard images on x-ray film was measured and a standard curve that relates mean optical density to radioactivity, expressed as percent administered dose per gram tissue weight, was generated for each film. The same tissue section was used to generate each of the two corresponding autoradiographic images as well as the histologic image. Specific regions of interest (ROI) were defined on the histologic image based on morphologic criteria (tumor margin, intratumoral areas with comparatively high and low cell density, areas of impending necrosis, and areas of brain adjacent to tumor); the ROI were automatically transposed to the coregistered autoradiographic images to obtain measurements of mean tissue radioactivity, ±SD, and region area. Parametric images of the plasma clearance (influx) constant (K1) were color-coded to a range of values using MCID software.
Calculations
K1 (μL/min/g) of ACPC and Ga-DTPA was calculated from:
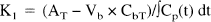
where AT is the total measured radioactivity (percent administered dose per gram tissue) at the end of the experiment, Vb is the tissue blood volume (mL/g tissue); CbT and CpT are the arterial blood and plasma concentrations (percent administered dose per milliliter blood or plasma) at the end of the experiment; and ∫Cp(t) dt is the plasma concentration—time integral (input function). The values of Vb for tumor and brain were obtained from previous studies (Blasberg, et al., 1983a; Nakagawa et al., 1988). ∫Cp(t) dt was calculated from the measurement of total radioactivity withdrawn during the experiment and knowledge of the rate of withdrawal and time of exposure (Gjedde, 1982). To avoid significant tissue-to-blood backflux of tracer during the experimental period, the experimental time was kept short (5 or 10 minutes). The basis for determining K1 from 0- to 10-minute experiments has been established [Ohno et al., 1978, Blasberg et al., 1983b], and represents an upper limit value.
To identify the facilitated component of ACPC transport across endothelial cells, ∂K1ACPC, the measured value of K1ACPC was corrected for passive diffusion through tumor endothelial cell pores (as measured with Ga-DTPA) and for passive diffusion of ACPC across the lipid bilayer membranes of the endothelial cells using the following relationship:
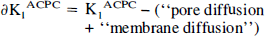
Pore diffusion corrects for the difference in aqueous diffusion between Ga-DTPA and ACPC; it assumes no difference in sterric restriction between these molecules due to pore size (unlikely for these small water soluble molecules [Nakagawa et al., 1987]):

where DACPC/DGa-DTPA is approximately 1.9 and can be estimated from the inverse ratio of the square roots of their molecular weights [(DACPC/DGa-DTPA) ~ (MWGa-DTPA)1/2/(MWACPC)1/2 (Davson and Danielli, 1943). Membrane diffusion can be calculated by a relationship that includes lipid solubility and aqueous diffusion:
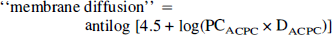
where the octanol/water partition coefficient is assumed to be a measure of lipid membrane solubility and D is the aqueous water diffusion constant at 37°C. This relationship was originally described by Davson and Danielli (1943), and later modified (Fenstermacher, 1983; Fenstermacher and Rapoport, 1984). The aqueous diffusion constant can be estimated from D ~ 10−4 (MW)1/2 cm2/sec (Davson and Danielli, 1943); DACPC is ~8.8 × 10⁻⁶ cm2/sec and DGa-DTPA is ~4.6 × 10⁻⁶ cm2/sec. The octanol/water partition coefficients of ACPC and DTPA have been measured: 6.7 × 10⁻³ (Smith, et al., 1987) and 1.3 ± 0.2 × 10⁻⁴ (Blasberg et al., 1983c), respectively. Membrane diffusion for ACPC was calculated to be 1.9 μL/min/g using Eq. 4, and it was assumed to be the same for both tumor and brain blood vessels. Similarly, membrane diffusion for Ga-DTPA was calculated to be 0.019 μL/min/g and was considered to be negligible with respect to that of ACPC. Thus, ∂K1ACPC can be calculated using Eq. 2 and is an approximation of the facilitated component of ACPC transport across brain and tumor capillaries.
Statistics
Comparisons between ROI mean values were analyzed by two statistical methods. A paired t-test was used for comparisons within individual animals (e.g., between tumor and normal brain), and a non-paired t-test was applied for comparisons between different sets of animals. Significant differences were determined at P<.05.
RESULTS
The autoradiographic images were registered with the corresponding histology and specific ROI were defined on morphologic criteria (tumor margin, intratumoral areas with comparatively high and low cell density, areas of impending necrosis, and areas of brain adjacent to tumor). Necrotic-appearing regions were very small or absent in most of the C6 and RG2 tumors, except for one large C6 tumor (Fig. 1). We separated the tumors into two different areas of the brain (cortical and subcortical), and our analysis of the data reflects this separation even when a single tumor occupies both brain areas. There were only a few meningeal extensions of the tumors in this series compared to that observed previously (Uehara et. al, 1997). This regional separation of tumor measurements was performed because the data and previous results indicated that the site and size of tumor growth can have a substantial effect on different physiologic measurements, such as blood flow and vascular permeability (Blasberg, et al., 1984).
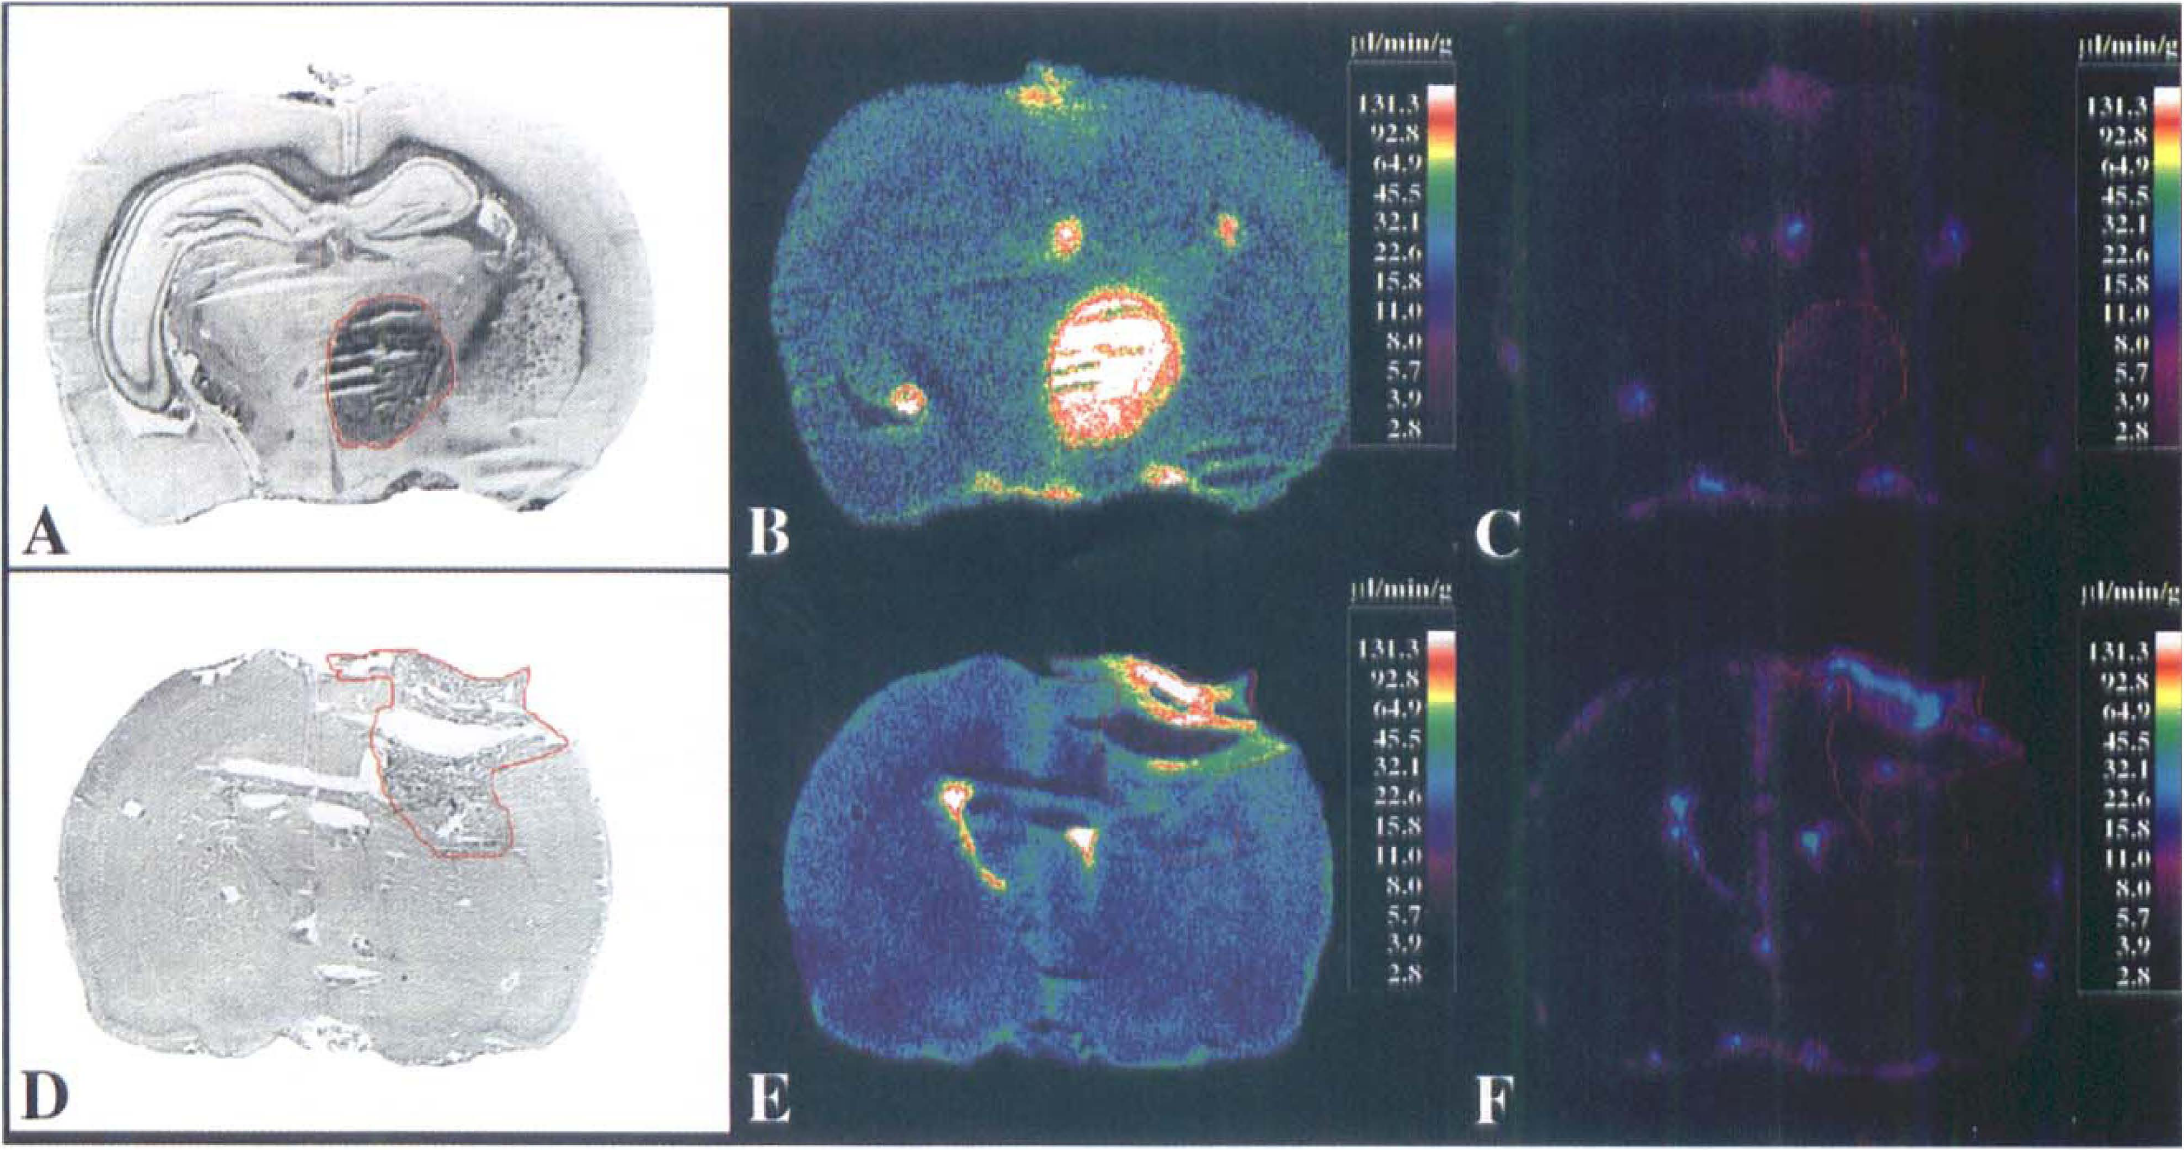
Histology and autoradiographic comparisons. Coronal sections through the brain of two rats containing a large C6 glioma (
ACPC influx (K1) across normal brain capillaries was >200-fold greater than that of Ga-DTPA (Table 1), and this difference was largely due to facilitated ACPC transport (∂K1ACPC; Eq 2). Substantially higher K1 values for ACPC compared to Ga-DTPA were also measured in C6 and RG2 gliomas. Of note is the substantially higher influx of ACPC across C6 tumor capillaries compared to contralateral brain capillaries, and this difference cannot be explained by differences in passive diffusion of ACPC through endothelial cell pores of tumor capillaries, as measured by Ga-DTPA. Based on the calculation of ∂K1ACPC (Eq 2), facilitated ACPC transport across C6 glioma capillaries is substantially greater than that across cortical or corpus callosum capillaries. The differences in ACPC transport across RG2 glioma compared to contralateral brain capillaries was marginal (significant only in comparison to corpus callosum). These differences are readily seen in the parametric images of ACPC and Ga-DTPA influx (K1) in C6 gliomas (Fig. 1 A–C), and less well visualized in RG2 gliomas (Fig. 1 D–F).
Comparison of ACPC and Ga-DTPA vascular transport in tumor and brain*
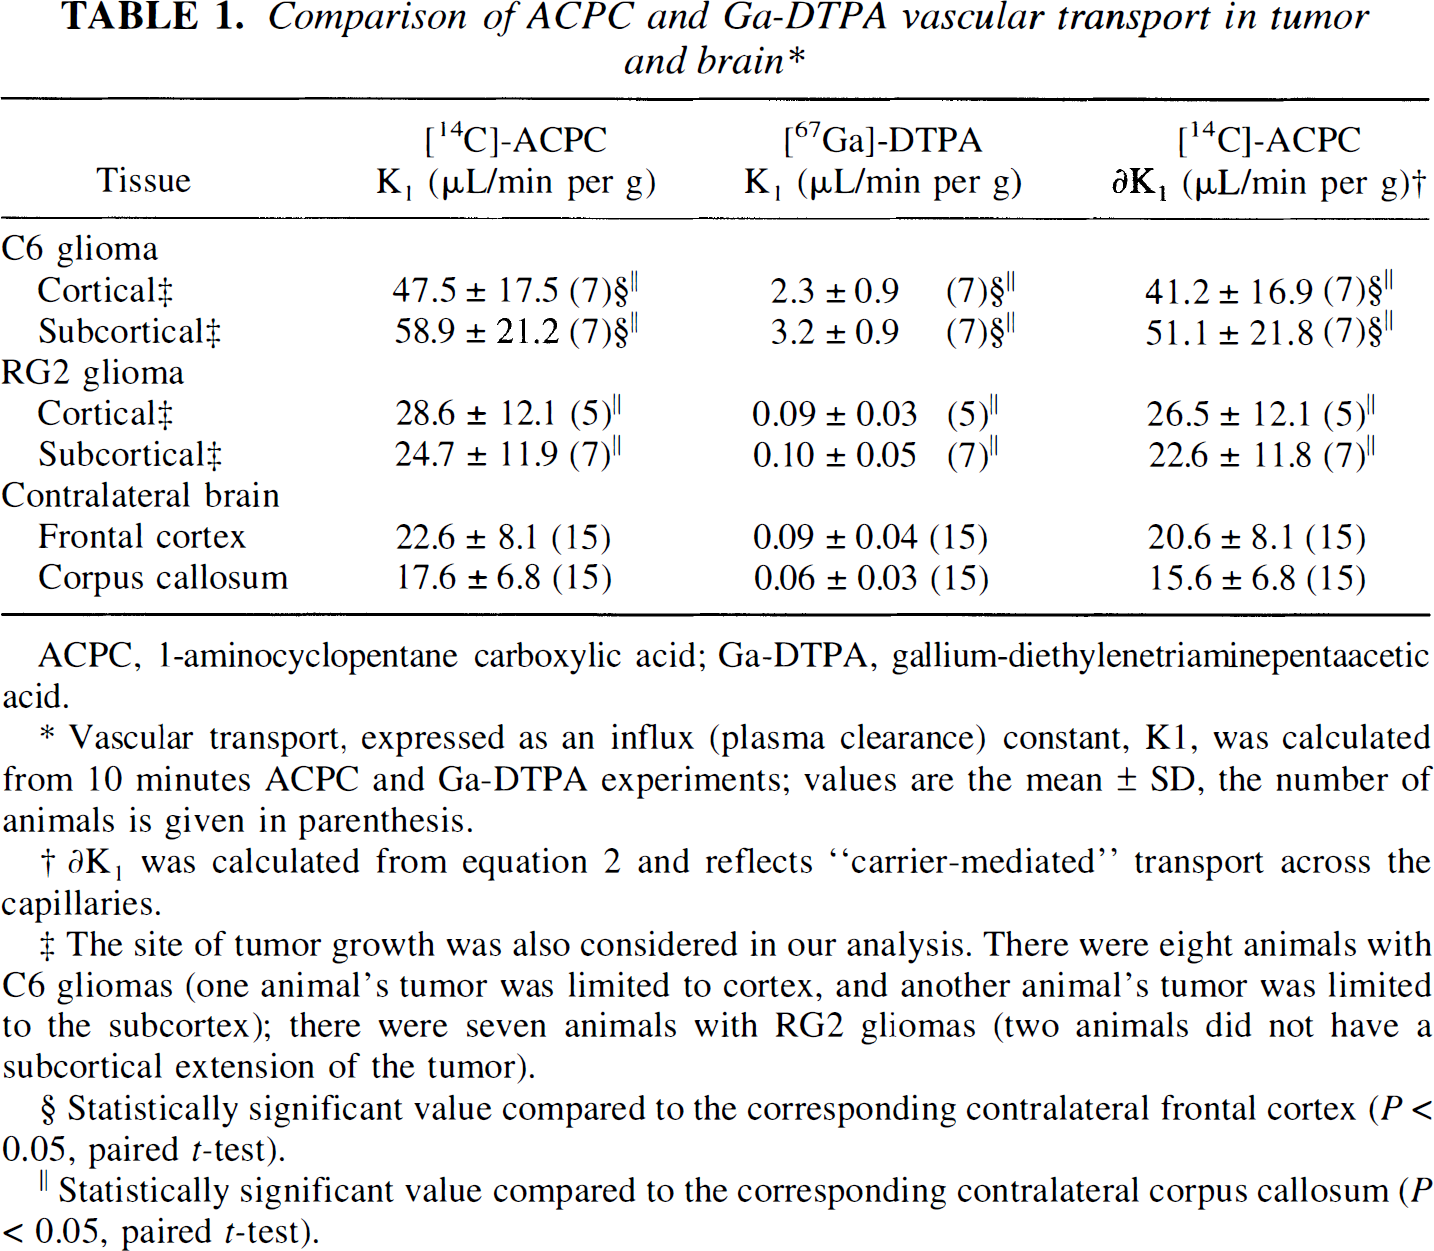
ACPC, 1-aminocyclopentane carboxylic acid; Ga-DTPA, gallium-diethylenetriaminepentaacetic acid.
Vascular transport, expressed as an influx (plasma clearance) constant, K1, was calculated from 10 minutes ACPC and Ga-DTPA experiments; values are the mean ± SD, the number of animals is given in parenthesisPRP topographies derived on a hemispheric basis.
∂K1 was calculated from equation 2 and reflects“carrier-mediated”transport across the capillaries.
The site of tumor growth was also considered in our analysis. There were eight animals with C6 gliomas (one animal's tumor was limited to cortex, and another animal's tumor was limited to the subcortex); there were seven animals with RG2 gliomas (two animals did not have a subcortical extension of the tumor)
Statistically significant value compared to the corresponding contralateral frontal cortex (P<0.05, paired t-test)
Statistically significant value compared to the corresponding contralateral corpus callosum(P<0.05, paired t-test).
K1 for ACPC was higher in high cell density regions and lower in low cell density regions of both C6 and RG2 gliomas; the morphologically identified region to mean tumor values are shown in Table 2. The tumor macroscopic margins of C6 tumors were well defined by the ACPC autoradiograms in 12 of 14 cortical and subcortical tumor areas when compared to the histology (Fig. 1A, Fig. 1B). In contrast, the tumor margins were less distinct in RG2 gliomas, and could be accurately identified in only two of five cortical and two of seven subcortical tumor regions identified on histology. Pale-staining tumor areas suggestive of impending tissue necrosis had values of K1 higher than the mean for both C6 and RG2 gliomas (Table 2).
Comparison of ACPC and Ga-DTPA uptake in morphologically distinct tumor regions*
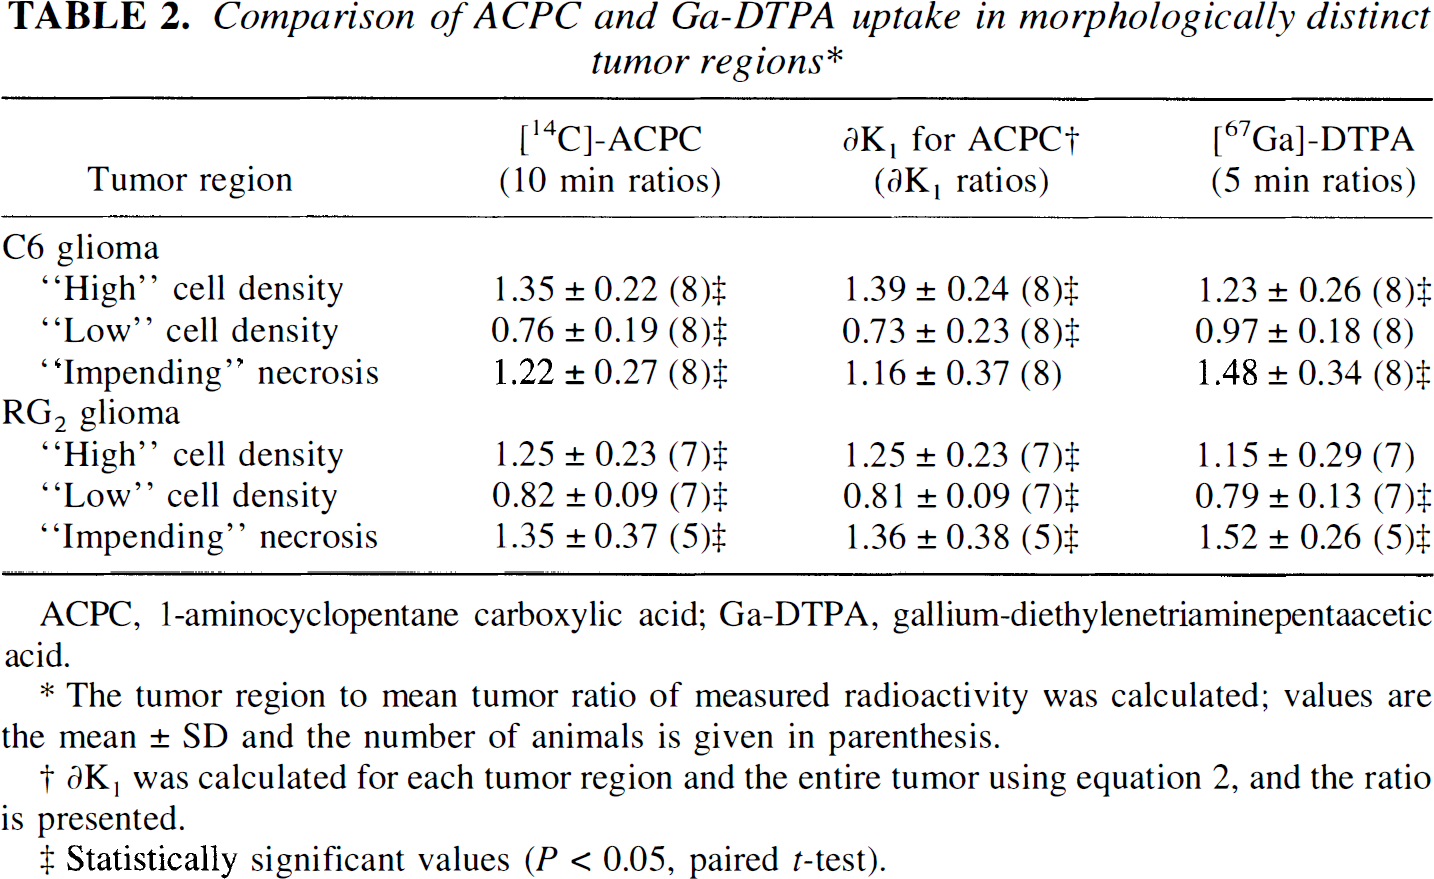
ACPC, 1-aminocyclopentane carboxylic acid; Ga-DTPA, gallium-diethylenetriaminepentaacetic acid.
The tumor region to mean tumor ratio of measured radioactivity was calculated; values are the mean ± SD and the number of animals is given in parenthesis.
∂K1 was calculated for each tumor region and the entire tumor using equation 2, and the ratio is presented.
Statistically significant values (P<0.05,pairedt-test).
The level of [14C]-ACPC and [67Ga]-Ga-DTPA radioactivity in tumor and brain tissue, expressed as a percent of injected dose per gram of tissue at time of imaging, is important for clinical imaging and is shown in Table 3. The tumor-to-contralateral brain (cortex) ratio is frequently used in the clinical assessment of brain tumors, and these ratios are shown in Table 4. For C6 gliomas, the tumor-to-contralateral cortex radioactivity ratio ranged between 1.4 and 4.4 for ACPC and from 1.8 and 5.2 for Ga-DTPA; for RG2 gliomas the corresponding range of ratios was much less (0.76 to 1.7 for ACPC and 0.80 to 4.0 for Ga-DTPA, respectively).
Comparison of measured tumor and contralateral brain activity (% dose/g)*
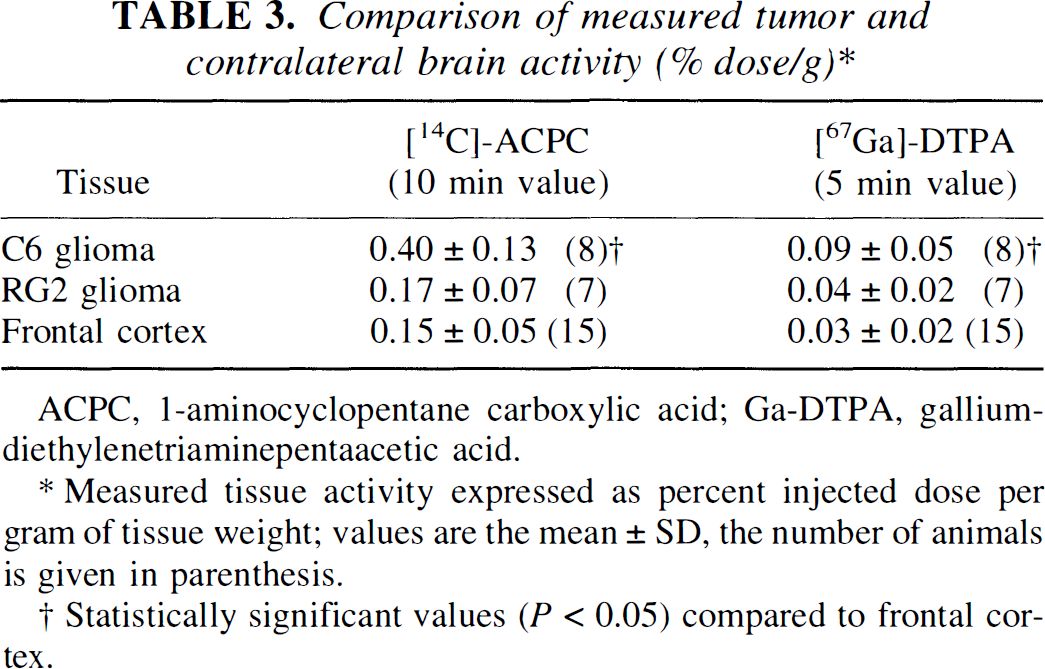
ACPC, 1-aminocyclopentane carboxylic acid; Ga-DTPA, gallium-diethylenetriaminepentaacetic acid.
Measured tissue activity expressed as percent injected dose per gram of tissue weight; values are the mean ± SD, the number of animals is given in parenthesis.
Statistically significant values (P<0.05) compared to frontal cortex.
Comparison of tumor and contralateral brain activity ratios*
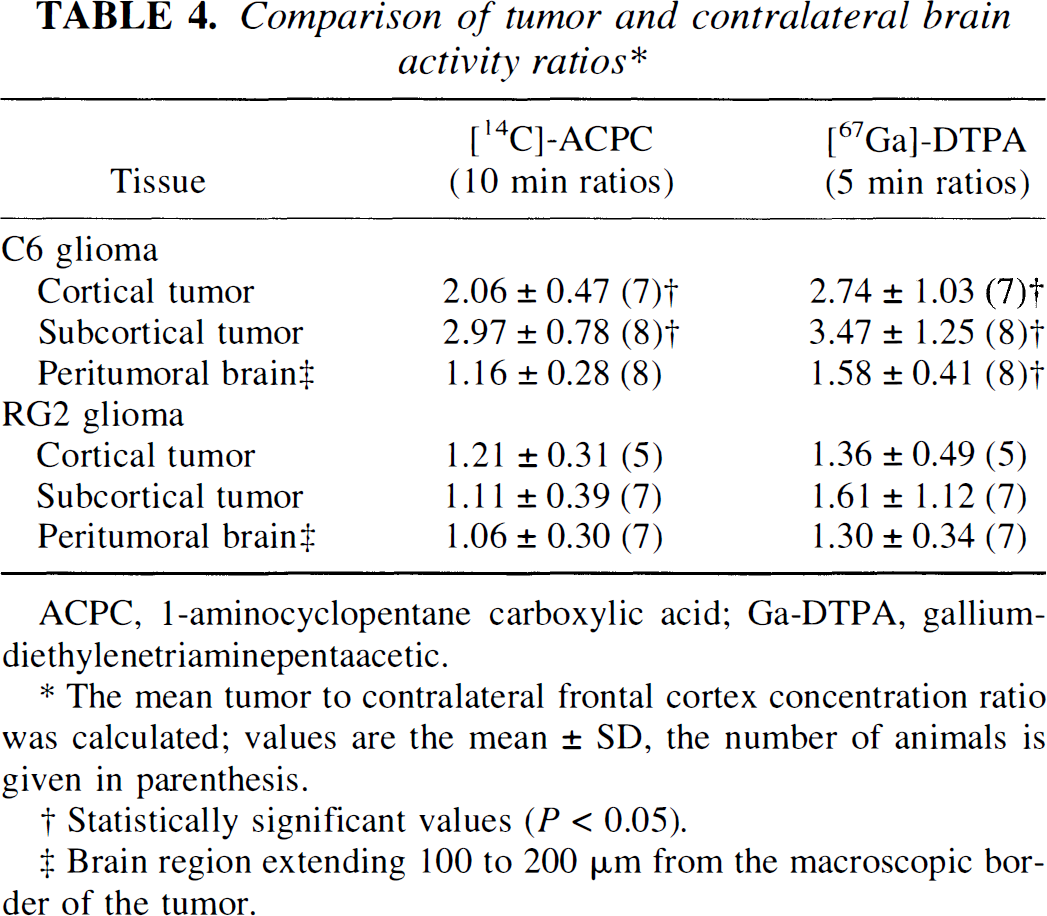
ACPC,1-aminocyclopentane carboxylic acid; Ga-DTPA, gallium-diethylenetriaminepentaacetic…
The mean tumor to contralateral frontal cortex concentration ratio was calculated; values are the mean ± SD, the number of animals is given in parenthesis.
Statistically significant values (P<0.05).
Brain region extending 100 to 200 μm from the macroscopic border of the tumor.
DISCUSSION
Normal brain capillaries are devoid of the A (small neutral amino acid) transport system on the luminal portion of their cell membranes, in contrast to the relatively high expression of the L (large neutral amino acid) transporter on both luminal and abluminal surfaces (Betz and Goldstein, 1978). This arrangement and polarity of amino acid transporters in normal brain capillaries may be somewhat different in brain tumor capillaries due to the disruption of the blood brain barrier and to the expression of vascular growth factors by the tumor (Gleadle and Ratcliffe, 1997). Our in vivo results with ACPC do not clarify whether the polarity of the A transporter is retained in tumor capillaries because ACPC accumulation could reflect bidirectional transport via the Na+-independent L transport system as well as transport by the Na+-dependent A transport system (Handlogten et al., 1988; Christensen, 1990).
Upregulation of ACPC transport across brain tumor capillaries
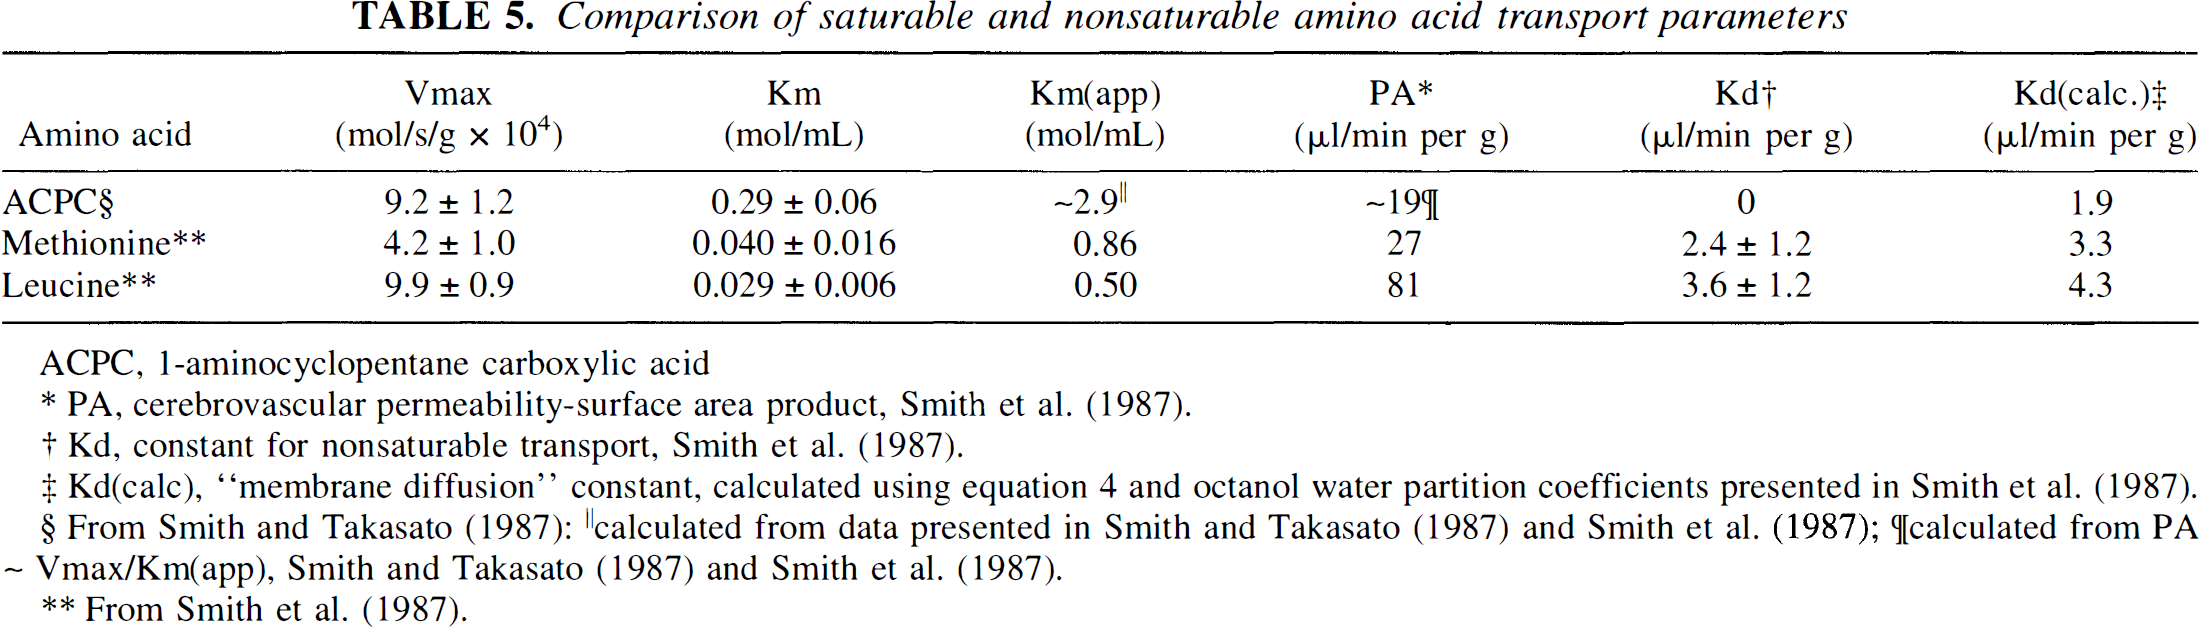
To assess the facilitated component of ACPC transport, ∂K1ACPC, across disrupted brain tumor capillaries, the measured (total) ACPC influx, K1ACPC, was corrected for passive diffusion through tumor endothelial cell pores (as measured with Ga-DTPA) and for passive diffusion of ACPC across the lipid bilayer membranes of the endothelial cells using the relationship described by Equation 2. The relationship between the permeability of natural membranes and substrate lipid solubility was originally described by Davson and Danielli (1943). This relationship has been slightly modified and tested for cerebral blood vessels (Fenstermacher, 1983; Fenstermacher and Rapoport, 1984). More recently, Fenstermacher (1988) refined the relationship to eliminate or reduce the effects of carrier-mediated transport, rapid metabolism, and plasma protein binding. An extensive assessment of the saturable and nonsaturable components of neutral amino acid flux across normal brain vessels has been performed by Smith et al (Smith, et al., 1987; Smith and Takasato, 1987). They showed that passive membrane diffusion (nonsaturable flux, Kd) for most neutral amino acids was small compared to the facilitated component of amino acid transport (saturable flux), even at normal plasma amino acid concentrations (Table 5). Their measured Kd values are similar to the membrane diffusion values calculated using Equation 4 [Kd(calc)]. The passive, membrane diffusion component of ACPC flux across normal brain capillaries is small [Kd(calc) ~ 1.9 μL/min/g], approximately 10% of the measured influx in normal cortex (K1ACPC in Table 1; PAACPC in Table 5).
Comparison of saturable and nonsaturable amino acid transport parameters
ACPC, 1-aminocyclopentane carboxylic acid
PA, cerebrovascular permeability-surface area product, Smith et al. (1987)
Kd, constant for nonsaturable transport,Smith et al.(1987).
Kd(calc), “membrane diffusion” constant, calculated using equation 4 and octanol water partition coefficients presented in Smith et al. (1987).
calculated from data presented in Smith and Takasato (1987) and Smith et al. (1987);
calculated from PA ~
Vmax/Km(app), Smith and Takasato (1987)
From Smith et al.(1987).
The K1 values of DTPA and AIB in normal cortex have also been measured (2.1 ± 0.1 and 0.024 ± 0.001 μL/min/g, respectively; Blasberg et al., 1983a), and can be compared to the values of membrane diffusion (1.0 and 0.019 μL/min/g, respectively) calculated using Equation 4.* The similarity between the measured K1 and calculated Kd(calc) values are consistent with the view that there are few or no pores in normal brain capillaries, little or no facilitated blood-to-brain transport of AIB across normal brain capillaries, and little or no expression of the A amino acid transporter on the luminal surface of normal brain capillaries. In the case of abnormal tumor vessels with increased vascular permeability, Ga-DTPA provides a direct measure of passive vascular permeability and can be used in the calculation of ∂K1ACPC (Eq 2). The calculation of ∂K1ACPC was possible in these studies because double-label experiments were performed and measurements of K1ACPC) and K1Ga-DTPA were determined from the same tissue sections in anatomically defined tissue regions using QAR and image registration techniques. Thus, ∂K1ACPC is considered to be a better approximation of the facilitated component of ACPC movement across both tumor and normal brain capillaries than the measured value of K1ACPC.
ACPC flux across C6 glioma vessels (K1ACPC) was significantly (two-fold) higher than that of normal brain and this difference was largely (87%) due to an increase in facilitated transport (∂K1ACPC), rather than to an increase in passive vascular permeability. This difference in facilitated transport is probably related to an upregulation of amino acid transporter expression and density in tumor endothelial cells (number of transporters per unit endothelial cell surface area) compared to that in cortex. Alternatively, a constitutive (functional) change in the amino acid transport systems of tumor endothelial cells has not been excluded by these studies and requires further evaluation. A less likely explanation for the differences in ∂K1ACPC between tumor and contralateral brain is a higher capillary density and surface area in C6 gliomas compared to cortex, with little or no difference in endothelial cell transporter density. No measurements of capillary density or capillary surface area have been reported for C6 gliomas.
Passive and facilitated ACPC flux were marginally higher in RG2 gliomas compared to that observed in contralateral brain when expressed in terms of tissue mass. However, measurements of RG2 brain tumor capillary density and surface area have been shown to be substantially less than that of normal rat gray matter [Schlageter et al., in press]. When ∂K1ACPC values are normalized to capillary surface area, the ∂K1ACPC ÷ capillary surface area ratio (proportional to vascular permeability, P) is approximately two-fold higher in RG2 brain tumors (~2.9 × 10⁻⁴ cm/min) compared to that in normal rat cortex (~1.4 × 10⁻⁴ cm/min). This calculation suggests that facilitated ACPC transport across RG2 tumor capillaries is also upregulated.
ACPC transport and morphologic characteristics of C6 and RG2 brain tumors
High and low cell density regions of both gliomas corresponded with high and low values of K1 and ∂K1ACPC for ACPC, similar to the Va measurements reported previously (Uehara, et al., 1997). A similar pattern of vascular permeability (K1 for DTPA) and tumor cell density was also noted. Pale staining areas that appeared to reflect impending necrosis on histology were observed in the larger C6 gliomas and much less often in RG2 tumors. These morphologically identified regions were previously shown to accumulate fluorodeoxyglucose to high levels (possibly related to enhanced glycolysis and anerobic metabolism), whereas corresponding measurements of Va for ACPC and K1 for Ga-DTPA showed little or no difference from the mean tumor value (Uehara, et al. 1997). In this study, K1 values for both ACPC and Ga-DTPA were significantly increased in pale staining tumor regions. We have recently shown that the transport rate (K1) of ACPC into C6 tumor cells in culture is increased several-fold when the cells are transferred from normoxic (20% O2) to hypoxic (5% and 2% O2) incubation conditions [Sasajima, et al., 1997]. These in vitro results and the in vivo results reported here suggest that both tumor cells and endothelial cells have the capacity to upregulate the expression of amino acid transporters in their cell membranes under adverse environmental conditions such as hypoxia and hyponutrician.
Passive vascular permeability
Passive vascular permeability measured with Ga-DTPA, K1Ga-DTPA, was low in the C6 gliomas (2 to 3 μL/min/g) and very low in the RG2 gliomas (0.1 μL/min/g). This observation was somewhat surprising when compared to the K1 values measured previously with AIB in C6 gliomas (Hiesiger et al., 1986) and RG2 gliomas (Groothuis, et al., 1983), and to the K1 values measured with radioiodinated albumin in RG2 gliomas [Nakagawa et al., 1987]. K1 for AIB was 16.0 ± 1.5 μL/min/g and 37 ± 10 μL/min/g in C6 and in RG2 gliomas, respectively; K1 for albumin was 2.36 ± 0.89 and 0.27 ± 0.19 μL/min/g in large and small RG2 gliomas, respectively. Radioiodinated albumin and AIB were considered to be markers of passive vascular permeability in these studies. In contrast to ACPC, AIB is primarily transported across cell membranes by the A system (Oxender and Christensen 1963), and previous studies using AIB as a marker of brain tumor vascular permeability (Groothuis, et al., 1983; Blasberg et al., 1983d, 1984; Hiesiger et al., 1986) assumed a polarity of the A transport system in tumor vessels similar to that described in normal brain vessels (Betz and Goldstein, 1978).
The differences between K1Ga-DTPA measured here and K1AIB measured previously in RG2 (Groothuis, et al., 1983) and C6 (Hiesiger et al., 1986) gliomas are difficult to resolve and may reflect changes in phenotype (passive vascular permeability) of the tumors that occurred during maintenance of these cell lines over a period of 10 or more years. This interpretation is supported by the substantial difference between K1Ga-DTPA reported here and K1albumin reported previously for RG2 gliomas (Nakagawa et al., 1987). In addition, the previously reported values of K1AIB and K1albumin for RG2 gliomas are consistent with the large interendothelial cell gaps in RG2 tumor vessels (Schlageter et al., in press). Namely, the magnitude of the interendothelial cell gaps (1.1 × 10⁻⁴ cm2/g tumor) and the magnitude of K1AIB and K1albumin in RG2 gliomas is consistent with passive diffusion of both AIB and albumin through endothelial cell pores.
Imaging brain tumors with radiolabeled amino acids
Animal experiments indicate that ACPC has better blood-brain barrier (BBB) transport characteristics for imaging tumors than methionine, although methionine is the amino acid currently being used in most nuclear medicine brain tumor imaging studies. Brain uptake index (Pardridge, 1977) and in situ brain perfusion (Smith and Takasato, 1987; Smith, et al., 1987) studies have shown that brain capillaries have a higher maximum transport rate (Vmax) for ACPC than methionine; Vmax for ACPC transport across normal brain capillaries is approximately twice that of methionine and similar to leucine (Table 5). In contrast, the affinity of methionine (and other large neutral amino acids) for the L transporter across the BBB is considerably greater (lower Km) than that of ACPC. The apparent Km [Km(app)] for amino acid transport across the BBB at physiologic (plasma) amino acid concentrations is some 10- to 20-fold greater than in the absence of plasma amino acids (Smith, et al., 1987; Table 5). One consequence of high affinity for the L transporter is that the endothelial transport system is nearly saturated under normal physiologic conditions (~96%; Smith, et al., 1987). Another point is that Km(app) for ACPC is also considerably greater than Km(app) for methionine and other large neutral amino acids (Table 5), and is greater than the summed plasma concentration (~1.0 μmol/mL) of high affinity (Cp/Km ≥ 1) neutral amino acids (Smith, et al., 1987). Therefore, ACPC transport will be less affected by fluctuations in plasma amino acids levels than methionine or leucine. As described by Smith and Takasato (1987), a five-fold increase or decrease in total plasma amino acid concentration will result in only a small change in the net transport rate of amino acid flux across the BBB; they estimate this change to be less than 15%.
Amino acid competition studies in tissue culture and in tissue slices have shown that ACPC has a higher affinity for the A transport system of tumor and brain cell membranes than methionine (Oxender and Christensen, 1963; Blasberg, 1968; Christensen, 1990). This difference in affinity for the A transport system is likely to result in a higher uptake of ACPC than methionine in tumor tissue because the A transporter is more highly expressed in transformed and malignant cells (Foster and Pardee, 1969; Isselbacher, 1972; Saier et al., 1982; Handlogten and Kilberg, 1988). These observations in tissue culture and animals are important because the higher affinity for the A carrier system in tumor cell membranes and the higher Vmax across endothelial cells provide the physiologic basis for imaging brain tumors with ACPC rather than with methionine or other amino acids. The absence of radiolabeled metabolites with ACPC is an additional advantage; 60 minutes after intravenous administration of [11C]-methionine, only 37% (range, 16 to 72%) of measured plasma radioactivity is parent methionine (Hatazawa et al., 1989; Ishiwata et al., 1989), and a corresponding variability of radiolabeled metabolites in tumor tissue could confound interpretation of the images.
Despite the advantages of ACPC compared to methionine described above, [11C]-methionine remains the radiolabeled amino acid most frequently used to image brain tumors. The incorporation of [11C]-amino acids into tumor protein is a frequently cited rationale for imaging tumors with methionine and other amino acids. However, this interpretation of [11C]-methionine tumor images is based largely on the results of animal studies (there have been no direct tissue assays in human subjects measuring or documenting incorporation of radioactivity into tumor protein). Contrary to some points of view, amino acid transport may be more important for tumor imaging in patients than amino acid incorporation into protein. This controversial suggestion is based on the results of several dynamic positron emission tomography studies using methionine (Roelcke et al., 1996), fluorophenylalanine (Miura et al., 1989; Ito et al., 1995), and fluorotyrosine (Wienhard, et al., 1991). These results suggest that the incorporation of radiolabeled amino acids (such as methionine) into brain and tumor protein is small, and not likely to substantially contribute to the tumor images in patient studies.
CONCLUSION
Our results suggest that facilitated transport of ACPC is upregulated across C6 and RG2 glioma capillaries. This represents a new observation and suggests that tumors can influence transporter expression in their supporting vasculature. However, the results do not define which amino acid transporter (e.g., A or L) is upregulated. Nevertheless, these initial results are a first step in furthering our understanding of functional changes that occur in brain tumor vasculature, and the potential significance of these changes for clinical imaging of brain tumors using radiolabeled amino acids.
Footnotes
Abbreviations used
*
Previously published octanol-water partition coefficients (Blasberg et al., 1983c) were used in this calculation.