
Abstract
The goal of this study was to evaluate the differences and define the advantages of imaging experimental brain tumors in rats with two nonmetabolized amino acids, 1-aminocyclopentane carboxylic (ACPC) acid and α-aminoisobutyric (AIB) acid compared with imaging with fluorodeoxyglucose (FDG) or the gallium-diethylenetriaminepentaacetic acid chelate (Ga-DTPA). 1-aminocyclopentane carboxylic acid, AIB, and FDG autoradiograms were obtained 60 minutes after intravenous injection to simulate positron emission tomography (PET) imaging, whereas the Ga-DTPA autoradiograms were obtained 5 or 10 minutes after injection to simulate gadolinium (Gd)-DTPA–enhanced magnetic resonance (MR) images. Three experimental tumors were studied (C6, RG2, and Walker 256) to provide a range of tumor types. Triple-label quantitative autoradiography was performed, and parametric images of the apparent distribution volume (Va, mL/g) for ACPC or AIB, relative glucose metabolism (R, μmol/100 g/min), vascular permeability to Ga-DTPA (K1, μL/min/g), and histology were obtained from the same tissue section. The four images were registered in an image array processor, and regions of interest in tumor and contralateral brain were defined on morphologic criteria (histology) and were transferred to the autoradiographic images. A comparative analysis of all measured values was performed. The location and morphologic characteristics of the tumor had an effect on the images and measurements of Va, R, and K1. Meningeal extensions of all three tumors consistently had the highest amino acid uptake (Va) and vascular permeability (K1) values, and subcortical portions of the tumors usually had the lowest values. Va and R (FDG) values generally were higher in tumor regions with high-cell density and lower in regions with low-cell density. Tumor areas identified as “impending” necrosis on morphologic criteria consistently had high R values, but little or no change in Va or K1. Tumor necrosis was seen consistently only in the larger Walker 256 tumors; low values of R and Va for AIB (less for ACPC) were measured in the necrotic-appearing regions, whereas K1 was not different from the mean tumor value. The highest correlations were observed between vascular permeability (K1 for Ga-DTPA) and Va for AIB in all three tumors; little or no correlation between vascular permeability and R was observed. The advantages of ACPC and AIB imaging were most convincingly demonstrated in C6 gliomas and in Walker 256 tumors. 1-aminocyclopentane was substantially better than FDG or Ga-DTPA for identifying tumor infiltration of adjacent brain tissue beyond the macroscopic border of the tumor; ACPC also may be useful for identifying low-grade tumors with an intact blood–brain barrier. Contrast-enhancing regions of the tumors were visualized more clearly with AIB than with FDG or Ga-DTPA; viable and necrotic-appearing tumor regions could be distinguished more readily with AIB than with FDG. [11C]-labeled ACPC and AIB are likely to have similar advantages for imaging human brain tumors with PET.
Keywords
[18F]-fluoro-2-deoxyglucose ([18F]-FDG) and [methyl-11C]-methionine are the most widely used radiopharmaceuticals to study and evaluate brain tumors with positron emission tomography (PET). It is reported extensively that the magnitude of [18F]-FDG and [11C]-methionine uptake by tumors corresponds to tumor grade (Di Chiro et al., 1982; Di Chiro et al., 1984; Lilja et al., 1985; Ericson et al., 1985; Mineura et al., 1986; Mosskin et al., 1987). These radiopharmaceuticals also have been used to identify radiation-induced tissue necrosis (Patronas et al., 1982; Di Chiro et al., 1988a; Lilja et al., 1989), response to therapy (Mineura et al., 1987; Mineura et al., 1988; Ogawa et al., 1988; Rozental et al., 1989), prognosis, and survival (Patronas et al., 1985). Methionine also has been shown to be better than FDG with respect to identifying low-grade brain tumors and tumors infiltrating beyond the margin of contrast enhancement (Lilja et al., 1985; Ericson et al., 1985; Mosskin et al., 1987).
In contrast to methionine and other naturally occurring amino acids, 1-aminocyclopentane carboxylic (ACPC) acid, and α-aminoisobutyric (AIB) acid are nonisomeric at the α-carbon (i.e., they do not exist in optically active forms); they are not metabolized or incorporated into protein in mammalian systems (Noall et al., 1957; Christensen, 1962). Therefore, problems associated with imaging radiolabeled metabolites are avoided. Both amino acids are transported across brain and tumor cell membranes by stereospecific carrier systems (Oxender and Christensen, 1963; Christensen, 1990). 1-aminocyclopentane carboxylic acid is transported predominantly across cell membranes by “L” carrier systems, although it has some affinity to the “A” carrier as well; AIB is transported predominantly across cell membranes by “A” carrier systems and has little or no affinity for the “L” system. The transport of ACPC across normal brain capillaries occurs by the “L” carrier system, whereas AIB is largely excluded from the brain because the “A” transport system is not expressed on the luminal surfaces of normal brain capillaries (Betz and Goldstein, 1978). Once across the blood–brain barrier, AIB can be accumulated to high levels (higher than ACPC or methionine) because of the presence of “A” transporters in tumor and brain cell membranes.
The objective of this study was to demonstrate the differences and advantages of imaging brain tumors with ACPC and AIB compared with imaging with FDG and gallium-diethylenetriaminepentaacetic acid (Ga-DTPA) in a preclinical animal study. Three different experimental brain tumors (C6, RG2, and Walker 256) were compared in the rat. The C6 (Benda et al., 1968) and RG2 (Wechsler et al., 1972) cell lines are of glial origin, whereas the Walker 256 carcinoma cell line is derived from a spontaneous breast tumor. ACPC, AIB, and FDG autoradiograms were obtained 60 minutes after intravenous injection to simulate PET imaging, whereas the Ga-DTPA autoradiograms were obtained 5 or 10 minutes after injection to simulate gadolinium-DTPA–enhanced magnetic resonance (MR) images. The Ga-DTPA chelate was included in this study because it is similar to the gadolinium (Gd)-DTPA chelate used for contrast enhancement of MR images, and because autoradiograms of [67Ga]-DTPA distribution in tumor and brain can be obtained to define passive blood–brain barrier disruption.
This study reports the first direct comparisons between amino acid accumulation, FDG metabolism, and vascular permeability in anatomically defined regions of brain tumors. This comparison was performed using triple-label quantitative autoradiographic techniques (see Appendix) combined with image registration to the corresponding histology.
METHODS AND MATERIALS
Cell culture
The C6 glioma (Benda et al., 1968) and Walker 256 carcinoma (Ushio et al., 1977) cell lines were obtained from the Memorial Sloan-Kettering Cancer Center (New York, NY, U.S.A.) tissue culture bank, and RG2 (Wechsler et al., 1972) cells were provided by Daryl Bigner, Duke University (Durham, NC, U.S.A.). The C6 glioma cell line was grown as monolayers in T-150 flasks (Falcon, Becton Dickinson and Co., Lincoln Park, NJ, U.S.A.) in minimal essential medium (MEM) media with 10% fetal calf serum. The Walker 256 cell line and the RG2 glioma were grown as monolayers in MEM with 10% fetal calf serum and nonessential amino acids. The cultures were maintained in an incubator with 5% carbon dioxide at 37°C.
Tumor inoculation
Thirty-nine male rats weighing 250 ± 20 g were studied: 11 Fisher 344 rats bearing RG2 gliomas (5 for AIB and 6 for ACPC studies), 14 Wistar-Furth rats bearing C6 gliomas (7 for each amino acid), and 14 Sprague-Dawley rats bearing Walker 256 tumors (7 for each amino acid). The animals were anesthetized with a gas mixture consisting of 5% isoflurane, 65% nitrous oxide, and 30% oxygen, and maintained with 1.5% isoflurane. A 2% lidocaine gel was applied to the ears, and the head was fixed in stereotactic apparatus. The skull was exposed by a midline scalp incision, and a 2-mm burr hole was made 3 mm laterally from sagittal suture, 1 mm posterior from coronal suture; a 25-gauge needle attached to a Hamilton syringe was inserted to a 6-mm depth from the dura mater into the right caudate nucleus under aseptic condition. Suspensions of each tumor cell line were prepared, and 5 × 10⁵ tumor cells in 10 μL MEM media were injected slowly over 3 minutes. After this procedure, the animals were placed in standard cages with normal feeding, weighed daily, and observed for signs and symptoms of intracranial tumor growth. The experimental protocol was approved by the Institutional Animal Care and Use Committee.
Magnetic resonance imaging
Magnetic resonance imaging was performed on day 11 or 12 after inoculation (1 day before the experiment) using a 4.7 Tesla scanner (General Electric CSI Systems, Waukesha, WI, U.S.A.) as described previously (Tjuvajev et al., 1993). The tumor-bearing rats were anesthetized intraperitoneally with a mixture of ketamine 60 mg/kg and acetylpromazine 2.5 mg/kg, and imaging was performed within 5 to 10 minutes of the Gd-DTPA injection.
Isotope preparation
[18F]-FDG was synthesized by the cyclotron/chemistry core at Memorial Sloan-Kettering Cancer Center by nucleophilic reaction using the modification described by Hamacher and Kothari (Hamacher et al., 1986; Kothari et al., 1992). [67Ga]-DTPA solution was prepared mixing [67Ga]-citrate (42 Ci/mmol) solution purchased commercially (Mallinckrodt Medical, Inc., Hicksville, NY, U.S.A.) with a 1/10 volume of a 10−2 mol/L cold DTPA and 3 × 10⁻³ mol/L calcium chloride saline solution and adjusted to a pH of 7.4. [14C]-AIB (α-[1-14C]; 55 mCi/mmol) and ACPC (1-[carboxyl-14C]-; 55 mCi/mmol) were purchased commercially (American Radiolabeled Chemicals, Inc., St. Louis, MO, U.S.A.). [67Ga]-DTPA, [14C]-AIB, and [14C]-ACPC were assayed by high-pressure liquid chromatography before use to confirm radiochemical purity greater than 98%.
Animal preparation and study
Twelve or 13 days after tumor inoculation, femoral artery and vein catheters were placed under gas anesthesia and aseptic conditions. The hind quarters were wrapped in plaster bandage up to midthorax, and the cast was taped to a lead brick to maintain comfortable restraint after recovery from anesthesia (Sokoloff et al., 1977). Arterial blood pressure was monitored, and body temperature was maintained at 37°C with a heat lamp that was controlled automatically by a small rectal temperature probe. The rats were allowed to recover from anesthesia for at least 1 hour before study. Continuous withdrawal of arterial blood at 0.025 mL/minute (Harvard Apparatus, Southnawtick, MA, U.S.A.) was initiated just before intravenous injection of a 1-mL saline solution containing 5 mCi of [18F]-FDG and 25 μCi of [14C]-labeled AIB or ACPC. At 50 or 55 minutes, a 1-mL saline solution containing 3 mCi of [67Ga]-DTPA was injected intravenously. At 60 minutes, arterial blood was sampled, the animal was killed by an overdose of intravenous pentobarbital (150 mg/kg), and the brain was extracted rapidly and frozen in liquid Freon. The 60-minute blood sample and a measured fraction of the total blood withdrawn during the experiment were processed for measurements of whole blood, plasma radioactivity, and hematocrit.
Radioactivity assay
All tissue, blood, and plasma samples were solubilized (Soluene-350, Packard Instrument Co., Inc., Meriden, CT, U.S.A.) and assayed for radioactivity. Initially, [18F] and [67Ga] radioactivity was measured in a 3-channel gamma-counter (AutoGamma 5550 Spectrometer, Packard Instrument Co., Inc., Meriden, CT, U.S.A.) using narrow windows settings, splash correction, and decay correction. After [18F] decay (24 hours, 13 half-lives), the samples were recounted to determine [67Ga] radioactivity alone. The samples were then stored at 4°C for 45 days to allow for [67Ga] decay (14 half-lives). A scintillant (Insta-Fluor, Packard Instrument Co., Inc.) was added and [14C] radioactivity was determined by liquid scintillation counting (Tri-Carb Liquid Scintillation Analyzer, Model 1600TR, Packard Instrument Co., Inc.) using external standard quench corrections.
Triple-Label Quantitative Autoradiography. The tissue processing and autoradiographic techniques were described previously (Blasberg et al., 1980; Blasberg et al., 1981). Briefly, 22 serial coronal sections were cut at 20- or 10-μm thickness at intervals of 480 μm in a cryomicrotome at −13°C. The 20-μm sections were used for autoradiography and histology. This cryosectioning sequence was repeated five to eight times, resulting in an axial sampling of 24 to 38 mm. [18F] and [67Ga] autoradiographic standards were prepared from liver homogenates; the homogenates were mixed uniformly with known amounts of isotope, frozen, and cut 20 μm thick in the cryomicrotome. The radioactivity concentration (nCi/g) of each standard was measured. Sixteen [14C]-methylmethacrylate standards (Amersham Corp., Arlington Heights, IL, U.S.A.), previously calibrated to brain tissue radioactivity over the range of 4.4 to 2354 nCi/g brain, also were used. The tissue sections and autoradiographic standards were exposed to x-ray film (SB-5, Kodak, Rochester, NY, U.S.A.) over three different intervals to generate three separate images representing the tissue distribution of [18F], [67Ga], and [14C] radioactivity, respectively. The principles and validation of the method for generating the autoradiograms is described in Appendix A. Single-label ([14C]-ACPC and [14C]-AIB) autoradiography also was performed.
One or two “test” cassettes containing a few typical tissue sections and standards were always prepared and developed before developing the film in cassettes containing the majority of tissue sections; this precaution ensured that the exposure time always was appropriate. For the first exposure a 2-mil thick mylar film (Labelon, Labelon Co., Canandaigua, NY, U.S.A.) was placed between the sections and x-ray film to absorb most of the [14C] and [67Ga] emissions, and the duration of exposure to generate [18F] images was only 40 to 90 minutes (Appendix A). After the first exposure, the autoradiographic sections were stored 24 hours in a cool, dry place to allow for complete [18F] decay (13 half-lives). The second exposure was performed over 24 to 30 hours, with interposition of a 1.5-mm thick mylar film to absorb more of the lower energy beta-emissions from [14C] and generate an image of [67Ga] distribution in the tissue (Appendix A). After the second exposure, the sections were stored in a cool, dry, nitrogen atmosphere for 45 days to allow complete decay of [67Ga] (14 half-lives). For the third exposure, no Mylar film was interposed, and the tissue sections were exposed directly to x-ray film for a period of 1 to 2 weeks. The resultant autoradiographic images were only caused by [14C] radioactivity in the tissue sections; this was confirmed by the absence of [18F] and [67Ga] standard images on the x-ray film. All sections used for autoradiographic exposure subsequently were fixed in acetone and stained with hematoxylin and eosin or toluidine blue.
Autoradiographic Image Analysis. Digitization and registration of corresponding images from the three autoradiograms and histology were performed using a charged-coupled-72 series video camera (Dage-MTI Inc., Michigan City, IN, U.S.A.), a microcomputer imaging system, and MCID software (Imaging Research Inc., Ontario, Canada). The optical density of the standard images on x-ray film was measured, and a standard curve that relates mean optical density to radioactivity, expressed as percent administered dose per gram tissue weight, was generated for each film. The same tissue section was used to generate each of the three corresponding autoradiographic images and the histologic image. The MCID software allowed us to draw regions of interest on the histologic image based on morphologic criteria, transpose those regions to the coregistered autoradiographic images, and obtain measurements of mean tissue radioactivity, ± standard deviation, and region area. Frequency distribution histograms of the individual pixel values demonstrated a normal distribution of values for “viable appearing” tumor (histograms not shown). Parametric images of the apparent volume of tissue distribution (Va), the lower-limit plasma clearance (influx) constant (K1), and relative glucose utilization (R) were color-coded to a range of values also were generated using MCID software.
Calculations
Va (mL/g) of ACPC and AIB was calculated from 60 minutes by:
K1 (μL/min/g) of Ga-DTPA was calculated from:

R of brain and tumor (Blasberg et al., 1981; Blasberg et al., 1986) was calculated because the “lumped constant” for tumor tissue in the operational equation of the deoxyglucose method (Sokoloff et al., 1977) is not known:
Statistics
Comparisons between region of interest mean values were analyzed by two statistical methods. A paired Student's t test was employed for comparisons within individual animals (e.g., between tumor and normal brain), and an unpaired Student's t test was applied for comparisons between different sets of animals. Significant differences were determined at P < 0.05.
Multiple (n = 21−176 measurements per each tumor region), small (0.07 mm2) intratumoral regional comparisons were performed between R for FDG, Va for AIB or ACPC, and K1 for DTPA. Correlation coefficients (r) were obtained by linear regression analysis of corresponding data sets, and its significance (z value) was calculated using following equation:
Correlations with z values greater than 1.96 were considered significant (P < 0.05); correlations with r values > 0.75 were considered “strong,” and correlations with r values 0.75 > 0.50 were considered “weak.“
RESULTS
All autoradiographic images were registered with the corresponding histology, and specific regions of interest were defined on morphologic criteria (tumor margin, intratumoral areas with comparatively “high” and “low” cell density, areas of “impending” and “apparent” necrosis, and areas of brain adjacent to tumor with infiltrating tumor cells). Necrotic-appearing tumor regions were minimal or absent in C6 and RG2 gliomas, whereas in the larger Walker 256 tumors necrotic-appearing areas were more substantial. The necrotic-appearing regions were excluded from the mean tumor “region of interest” analysis; all values presented in Table 1 refer to viable-appearing tumor. The site of tumor growth also was considered in our analysis. We separated the tumors into three different areas of the brain (meningeal, cortical, and subcortical), and our analysis of the data reflects this separation, even when a single tumor occupies two or three different brain areas. This separation was performed because the data and previous results indicated that the site of tumor growth can have a substantial effect on different physiologic measurements, such as blood flow and vascular permeability (Blasberg et al., 1984a; Blasberg et al., 1984b).
Comparison of ACPC, AIB, FDG, and Ga-DTPA uptake in tumor and brain
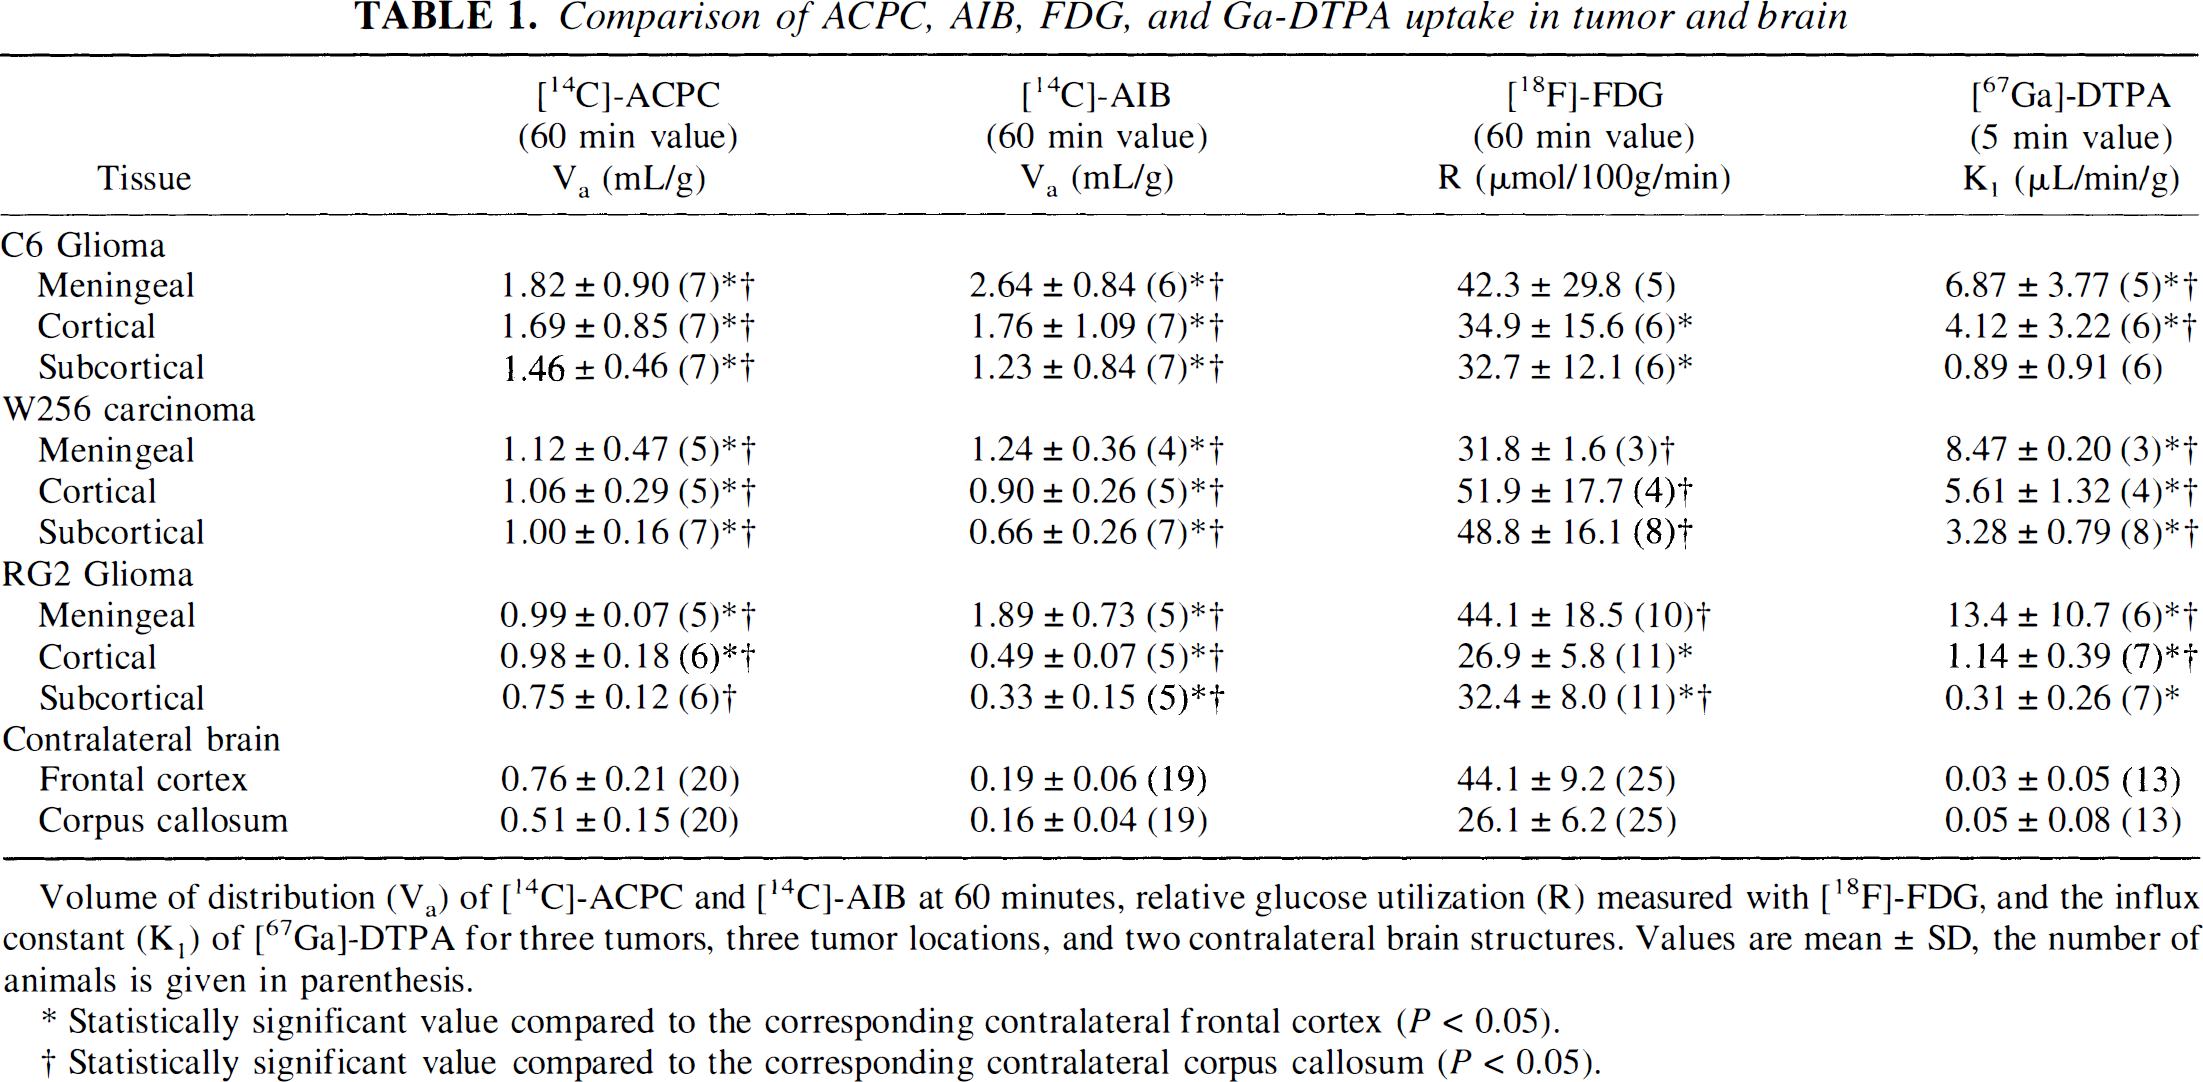
Volume of distribution (Va) of [14C]-ACPC and [14C]-AIB at 60 minutes, relative glucose utilization (R) measured with [18F]-FDG, and the influx constant (K1) of [67Ga]-DTPA for three tumors, three tumor locations, and two contralateral brain structures. Values are mean ± SD, the number of animals is given in parenthesis.
Statistically significant value compared to the corresponding contralateral frontal cortex (P < 0.05).
Statistically significant value compared to the corresponding contralateral corpus callosum (P < 0.05).
C6 Glioma
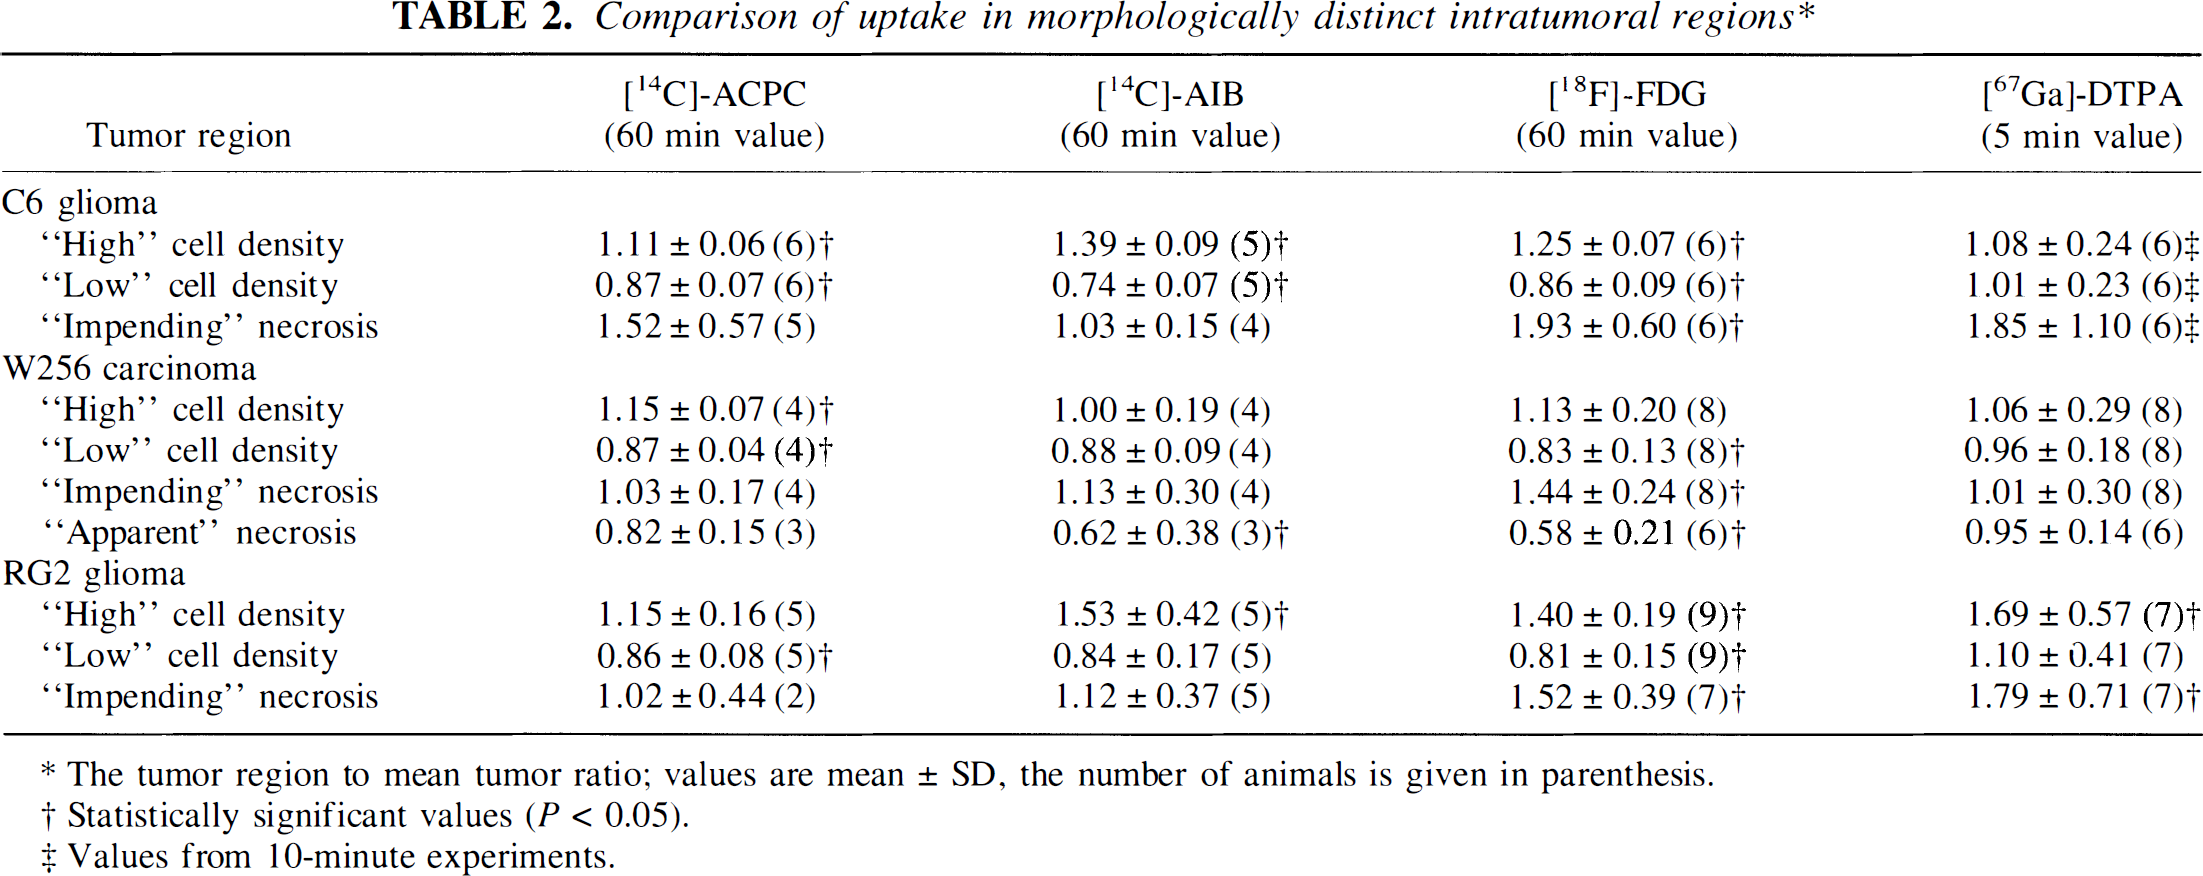
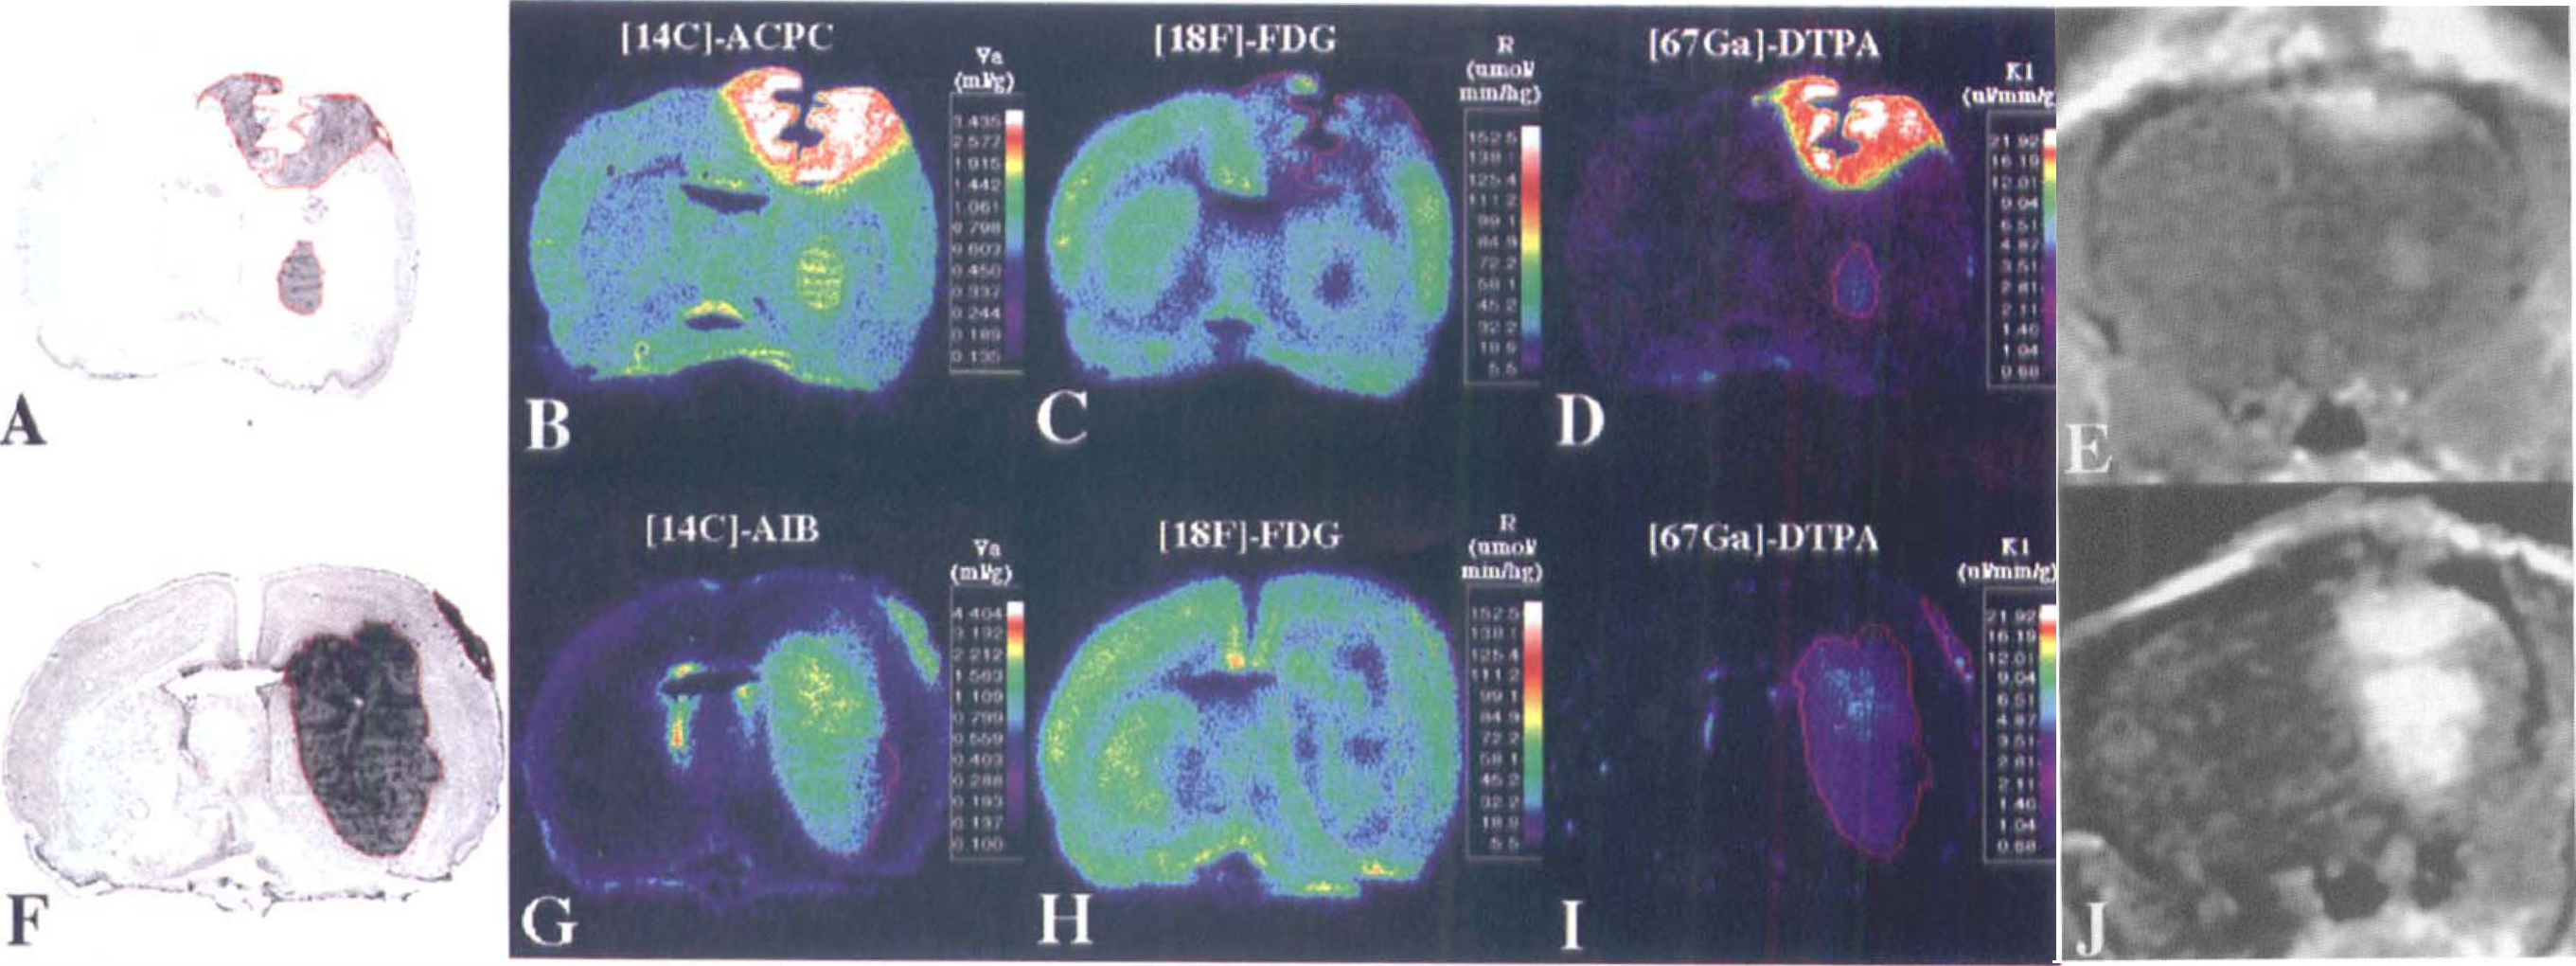
Va for ACPC was quite variable in C6 gliomas (range, 0.76–3.2 mL/g; Table 1); values were highest in the meningeal portion of the tumors and lowest in subcortical tumors. Va was higher in high cell density regions of the tumor and lower in low cell density regions of the tumor; the morphologically identified region to mean tumor values are shown in Table 2. The tumor macroscopic margins of C6 tumors were fairly well defined by the ACPC autoradiograms in 18 of the 21 tumor areas when compared with the histology (Figs. 1A and 1B). The margin of infiltrating tumor cells, beyond the macroscopic margin of the tumor, could be identified by ACPC in five of six infiltrating tumor locations identified on histology (e.g., region between the cortical and subcortical tumors in Figs. 2A and 2B). Pale-staining tumor areas suggestive of “impending” tissue necrosis had values of Va higher than the mean for each of the tumors (Figs. 2A and 2B; Table 2).
Comparison of uptake in morphologically distinct intratumoral regions*
The tumor region to mean tumor ratio; values are mean ± SD, the number of animals is given in parenthesis.
Statistically significant values (P < 0.05).
Values from 10-minute experiments.
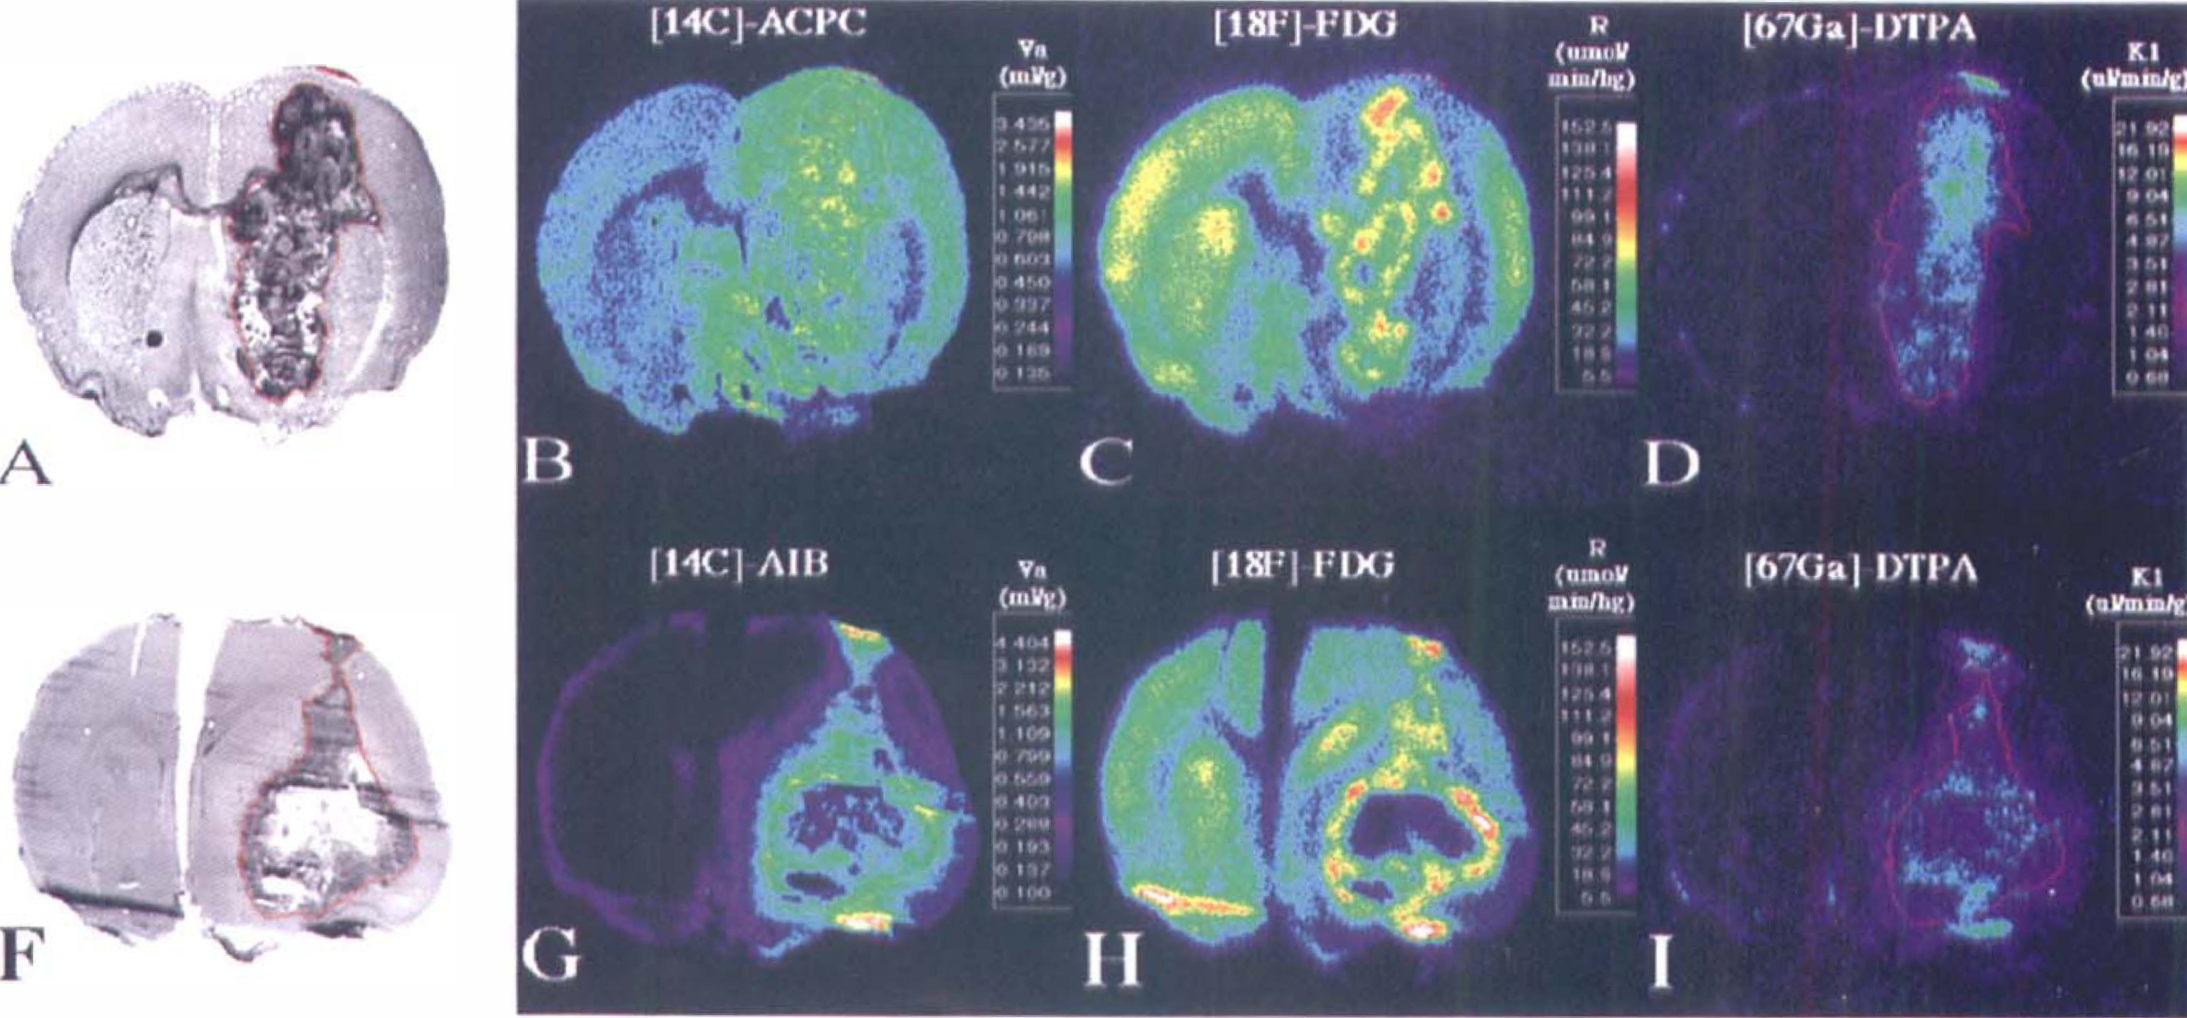
C6 glioma. Corresponding images from two C6 gliomas. From left to right are the toluidine blue stained histology (panels A and F) and parametric images of [14C]-1-aminocyclopentane carboxylic (ACPC) acid (panel B) and [14C]-α-aminoisobutyric (AIB) acid (panel G) apparent distribution volumes (apparent distribution volume [Va] at 60 minutes), relative glucose utilization (R) measured with [18F]-FDG (panels C and H), and the plasma clearance (influx) constant (vascular permeability [K1]) of [67Ga]-DTPA (panels D and I), plus the corresponding gadolinium-DTPA contrast-enhanced magnetic resonance image (panels E and J). The histology and parametric images for each animal were obtained from the same tissue section. The parametric images are color-coded to a range of values that are identical in Figures 1 through 3. The tumor outline (in red) was drawn on the histologic image and electronically transferred to the previously registered autoradiographic images.
C6 glioma (magnification view). Corresponding images from one cortical C6 glioma. The format of the figure is similar to that described in Figure 1. Note the pale-staining area in the center of the tumor that appears to reflect “ischemia” and “impending” necrosis on the histology (panel A). This area has high 1-aminocyclopentane carboxylic (ACPC) acid uptake (apparent distribution volume [Va]) and very high fluorodeoxyglucose (FDG) uptake (R) compared with other parts of the tumor (panels B and C, respectively), whereas passive vascular permeability (K1) as measured with Ga-DTPA, is relatively unaffected (panel D). Also note the presence of infiltrating tumor cells beyond the macroscopic margin of the tumor (panel A); infiltrating tumor cells are seen along the entire peritumoral margin, but are most dense along the lower right hand portion of the tumor. The ACPC uptake (Va) is increased significantly in the peritumoral infiltration zone compared with to more remote, noninfiltrated brain regions (panel B). The FDG (R) activity in the infiltrated peritumoral zone is depressed compared with more remote brain cortex (panel C), and there is little or no increase in passive vascular permeability (K1) of the peritumoral zone as measured with Ga-DTPA (Panel D).
Va for AIB also was quite variable (range, 0.30–4.2 mL/g); mean values were high in meningeal and low in subcortical portions of the tumor (Table 1). Va was significantly higher in high cell density regions and significantly lower in low cell density regions of the tumor (Table 2). Alpha-aminoisobutyric accumulation was not increased in pale-staining tumor areas (in contrast to ACPC). The tumor margins were well defined in the autoradiograms (Figs. 1F and 1G). The meningeal and ependymal surfaces of the brain and choroid plexus also showed AIB accumulation, as described previously (Blasberg et al., 1983b). Because AIB is not transported across normal brain capillaries, the tumor-to-contralateral brain ratios were considerably higher than those obtained with ACPC; values ranged between 2.1 and 19 (Table 3).
Comparison of mean tumor to contralateral brain ratios*
Mean tumor to contralateral frontal cortex concentration ratio; values are mean ± SD, the number of animals (n).
Statistically significant values (P < 0.05).
Values from 10-minute experiments.
Brain region extending 100 to 200 microns from the macroscopic border of the tumor.
R (FDG) values for C6 tumors were similar to those of normal brain structures, ranging mostly between grey and white matter (Table 1). The autoradiographic images demonstrated some heterogeneity of R within individual cortical and subcortical tumors (Figs. 1C and 1H). R values were consistently higher in high cell density regions and lower in low cell density tumor regions (Table 2). The areas of tumor with very high R values (Fig. 2C) usually were pale-staining and had the appearance of “impending” necrosis on histology (Fig. 2A; Table 2). The mean tumor-to-contralateral brain FDG ratios were considerably less than those observed with ACPC, AIB, and Ga-DTPA; the tumor-to-cortex ratios ranged from 0.45 to 0.97 (Table 3).
There was a reasonable correspondence between the Ga-DTPA autoradiographic images (Figs. 1D and 1I) and the Gd-DTPA contrast-enhanced MR images (Figs. 1E and 1J), given the rough approximation of the imaging planes in the two studies. Mean K1 for Ga-DTPA varied between meningeal, cortical, and subcortical tumor regions (Table 1). Measurements in normal brain regions were at or below the level of autoradiographic detection (∼0.7 μL/min/g). The autoradiographic images showed increased vascular permeability in meningeal and cortical tumor regions, whereas K1 for subcortical tumor varied in different animals (Figs. 1D and 1I). K1 values were not different in high and low cell density regions of the tumors (Table 2). K1 tended to be higher in pale-staining tumor regions, but the difference was not statistically significant (Table 2). The infiltrative zone of tumor had a small but significant increase in vascular permeability (K1) compared with contralateral cortex (Table 3).
Walker 256 carcinoma and RG2 gliomas
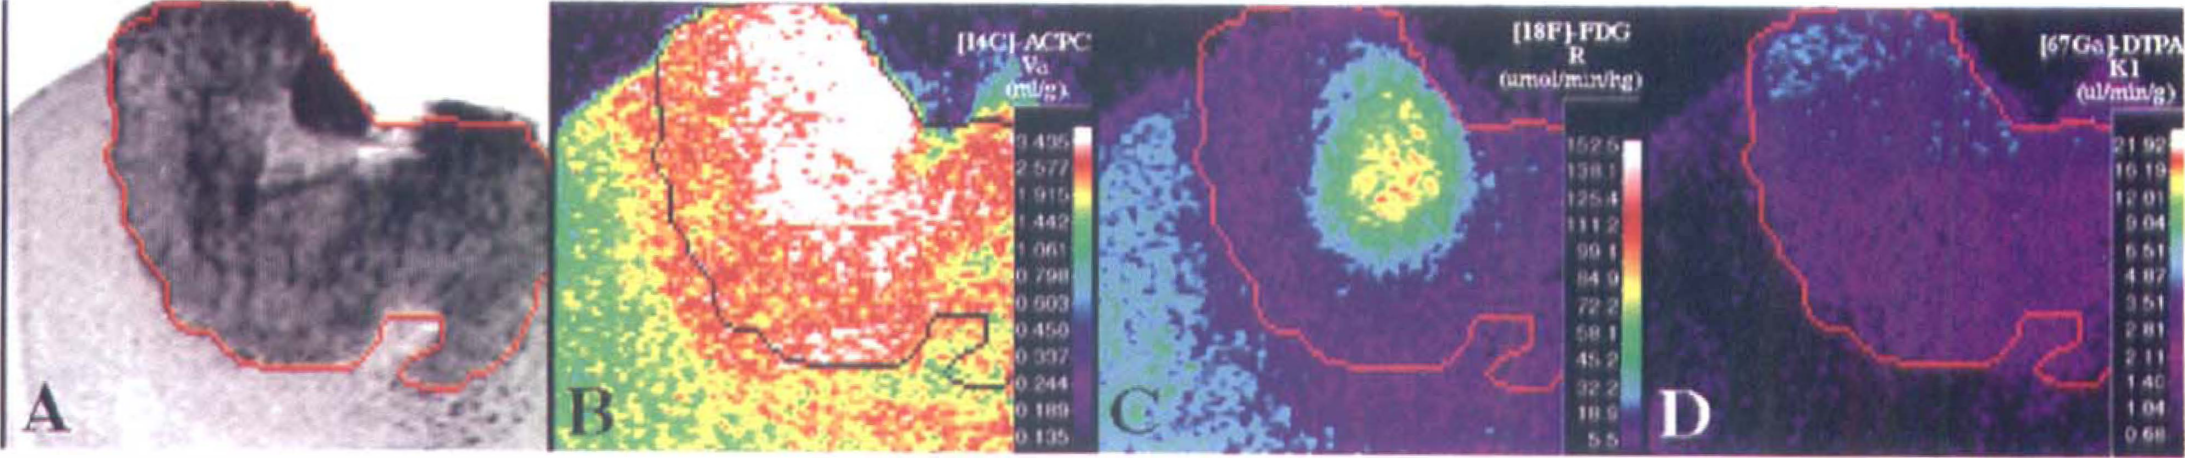
Va for ACPC in Walker 256 and RG2 tumors was similar in meningeal, cortical, and subcortical portions of each tumor, respectively (Figs. 3A and 3B; Table 1). Cell density influenced the magnitude of Va, despite the general morphologic uniformity of RG2 tumors compared with Walker 256 tumors (Table 2). Tumor areas with “impending” necrosis identified on the histologic section did not show any change in Va, whereas necrotic areas of Walker 256 tumors tended to have lower values of Va (Table 2). In five of seven animals with Walker 256 tumors, higher levels of ACPC uptake were observed in the macroscopic peritumoral brain area compared with the same structures in the contralateral hemisphere (Figs. 3A and 3B; Table 3). In many of these macroscopic peritumoral regions, there was no microscopic evidence of Walker 256 or inflammatory cell infiltration, although many appeared “edematous” on morphologic criteria (Fig. 3A). A clear demarcation between the macroscopic tumor margin and normal brain was observed in only 5 of 17 Walker 256 tumor regions; the tumor border could not be identified in most RG2 tumors.
Walker 256 carcinoma. Corresponding images from two intracerebral Walker 256 carcinomas. The format of the figure is similar to that described in Figure 1; no magnetic resonance imaging was performed on these animals.
Va for AIB in viable portions of Walker 256 tumors ranged from 0.51 mL/g in subcortical tumors to 1.7 mL/g in meningeal extensions of Walker 256 tumors; except for meningeal extensions, values were lower in RG2 tumors. There was considerably more variability in individual Walker 256 tumors (Figs. 3E and 3F) compared with RG2 tumors, and this variability was related more to the presence of necrotic-appearing regions and the higher vascular permeability of Walker 256 tumors (Figs. 3E and 3F; Tables 1 and 2). The variability in both Walker 256 and RG2 tumors was related somewhat to cell density, but did not seem to be related directly to areas of “impending” necrosis (Table 2).
Mean R values for viable appearing portions of Walker 256 tumors varied (Figs. 3C and 3H); except for the meningeal extensions of RG2 gliomas, R values were low (in the range of white matter; Table 1). Foci of high R values (>100 μmol/100g/min) were consistently seen in areas along the periphery of Walker 256 tumors (Figs. 3C and 3H). Foci of high R values also were observed within some (but not all) central tumor areas that were more lightly stained on the histologic section and appeared to represent areas of “impending” necrosis (Fig. 3C; Table 2). Areas of apparent necrosis on the histology were associated with very low R values (<20 μmol/100g/min) (Fig. 3H; Table 2). The mean tumor-to-contralateral brain FDG ratios in both Walker 256 and RG2 tumors were considerably less than those observed with ACPC, AIB, and Ga-DTPA (Table 3). The margins of Walker 256 tumors sometimes were well identified in the FDG autoradiograms, but not as sharply defined as in the AIB images. Identification of tumor margins in the FDG images was facilitated by a zone of hypometabolism (low FDG radioactivity) around the larger Walker 256 tumors (Figs. 3C and 3H).
Mean K1 for Ga-DTPA ranged from 1.6 to 8.7 μL/min/g in Walker 256 tumors (Figs. 3D and 3I); except for meningeal extensions, K1 values in RG2 tumors were very low (in 10 of 11 subcortical regions of RG2 tumors, mean K1 for Ga-DTPA was < 0.5 μL/min/g; Table 1). The vascular permeability differences in meningeal, cortical, and subcortical regions of the tumors were similar to those observed in C6 gliomas (Table 1). There was little or no difference in vascular permeability (K1) in high or low cell density tumor regions, nor in regions of impending necrosis (Table 2). In some of the larger Walker 256 tumors, increased vascular permeability extended 100 microns or more beyond the tumor margin into adjacent brain. This peritumoral area of increased vascular permeability to Ga-DTPA was always less than the peritumoral zone of increased Va for both ACPC (Figs. 3A, 3B, and 3D) and AIB (Figs. 3F, 3G, and 3I). Frankly necrotic Walker 256 tumor regions usually were associated with low or moderate K1 values, but these differences were not statistically significant (Table 2). The Walker 256 tumor-to-contralateral brain ratios were higher than the values obtained in C6 and RG2 gliomas (Table 3) and consistently higher than those obtained with Va for AIB.
Influence of vascular permeability on the distribution volume for AIB and ACPC and on relative glucose metabolism for FDG
The highest correlation between corresponding local (0.07 mm2) measurements of passive vascular permeability (K1 for Ga-DTPA) and amino acid uptake (Va) was obtained with AIB for each group of tumors (C6, RG2, and Walker 256; Fig. 4, panel A). Our results also indicate some relationship between Va for ACPC and K1 for Ga-DTPA at low levels of vascular permeability in the three tumors, (Fig. 4, panel B). For higher K1 values (>5 μL/min/g for C6 tumors and >3 μL/min/g for RG2 tumors), the magnitude of Va tends to reach a plateau (mean value 3.3 ± 0.4 mL/g for C6 tumors and 1.1 ± 0.2 mL/g for RG2 tumors), well above that for contralateral cortex (mean value 0.8 ± 0.2 mL/g). Local measurements of vascular permeability (K1 for Ga-DTPA) and tumor glucose utilization (R for FDG) in each group of tumors were related weakly in only 20% of tumors (data not shown).
The relationship between Va for AIB and R for FDG in C6, RG2, and Walker 256 tumors is also shown in Fig. 4 (Panel C). Similarly, the relationship between Va for ACPC and R for FDG is shown in Panel D (Fig. 4).
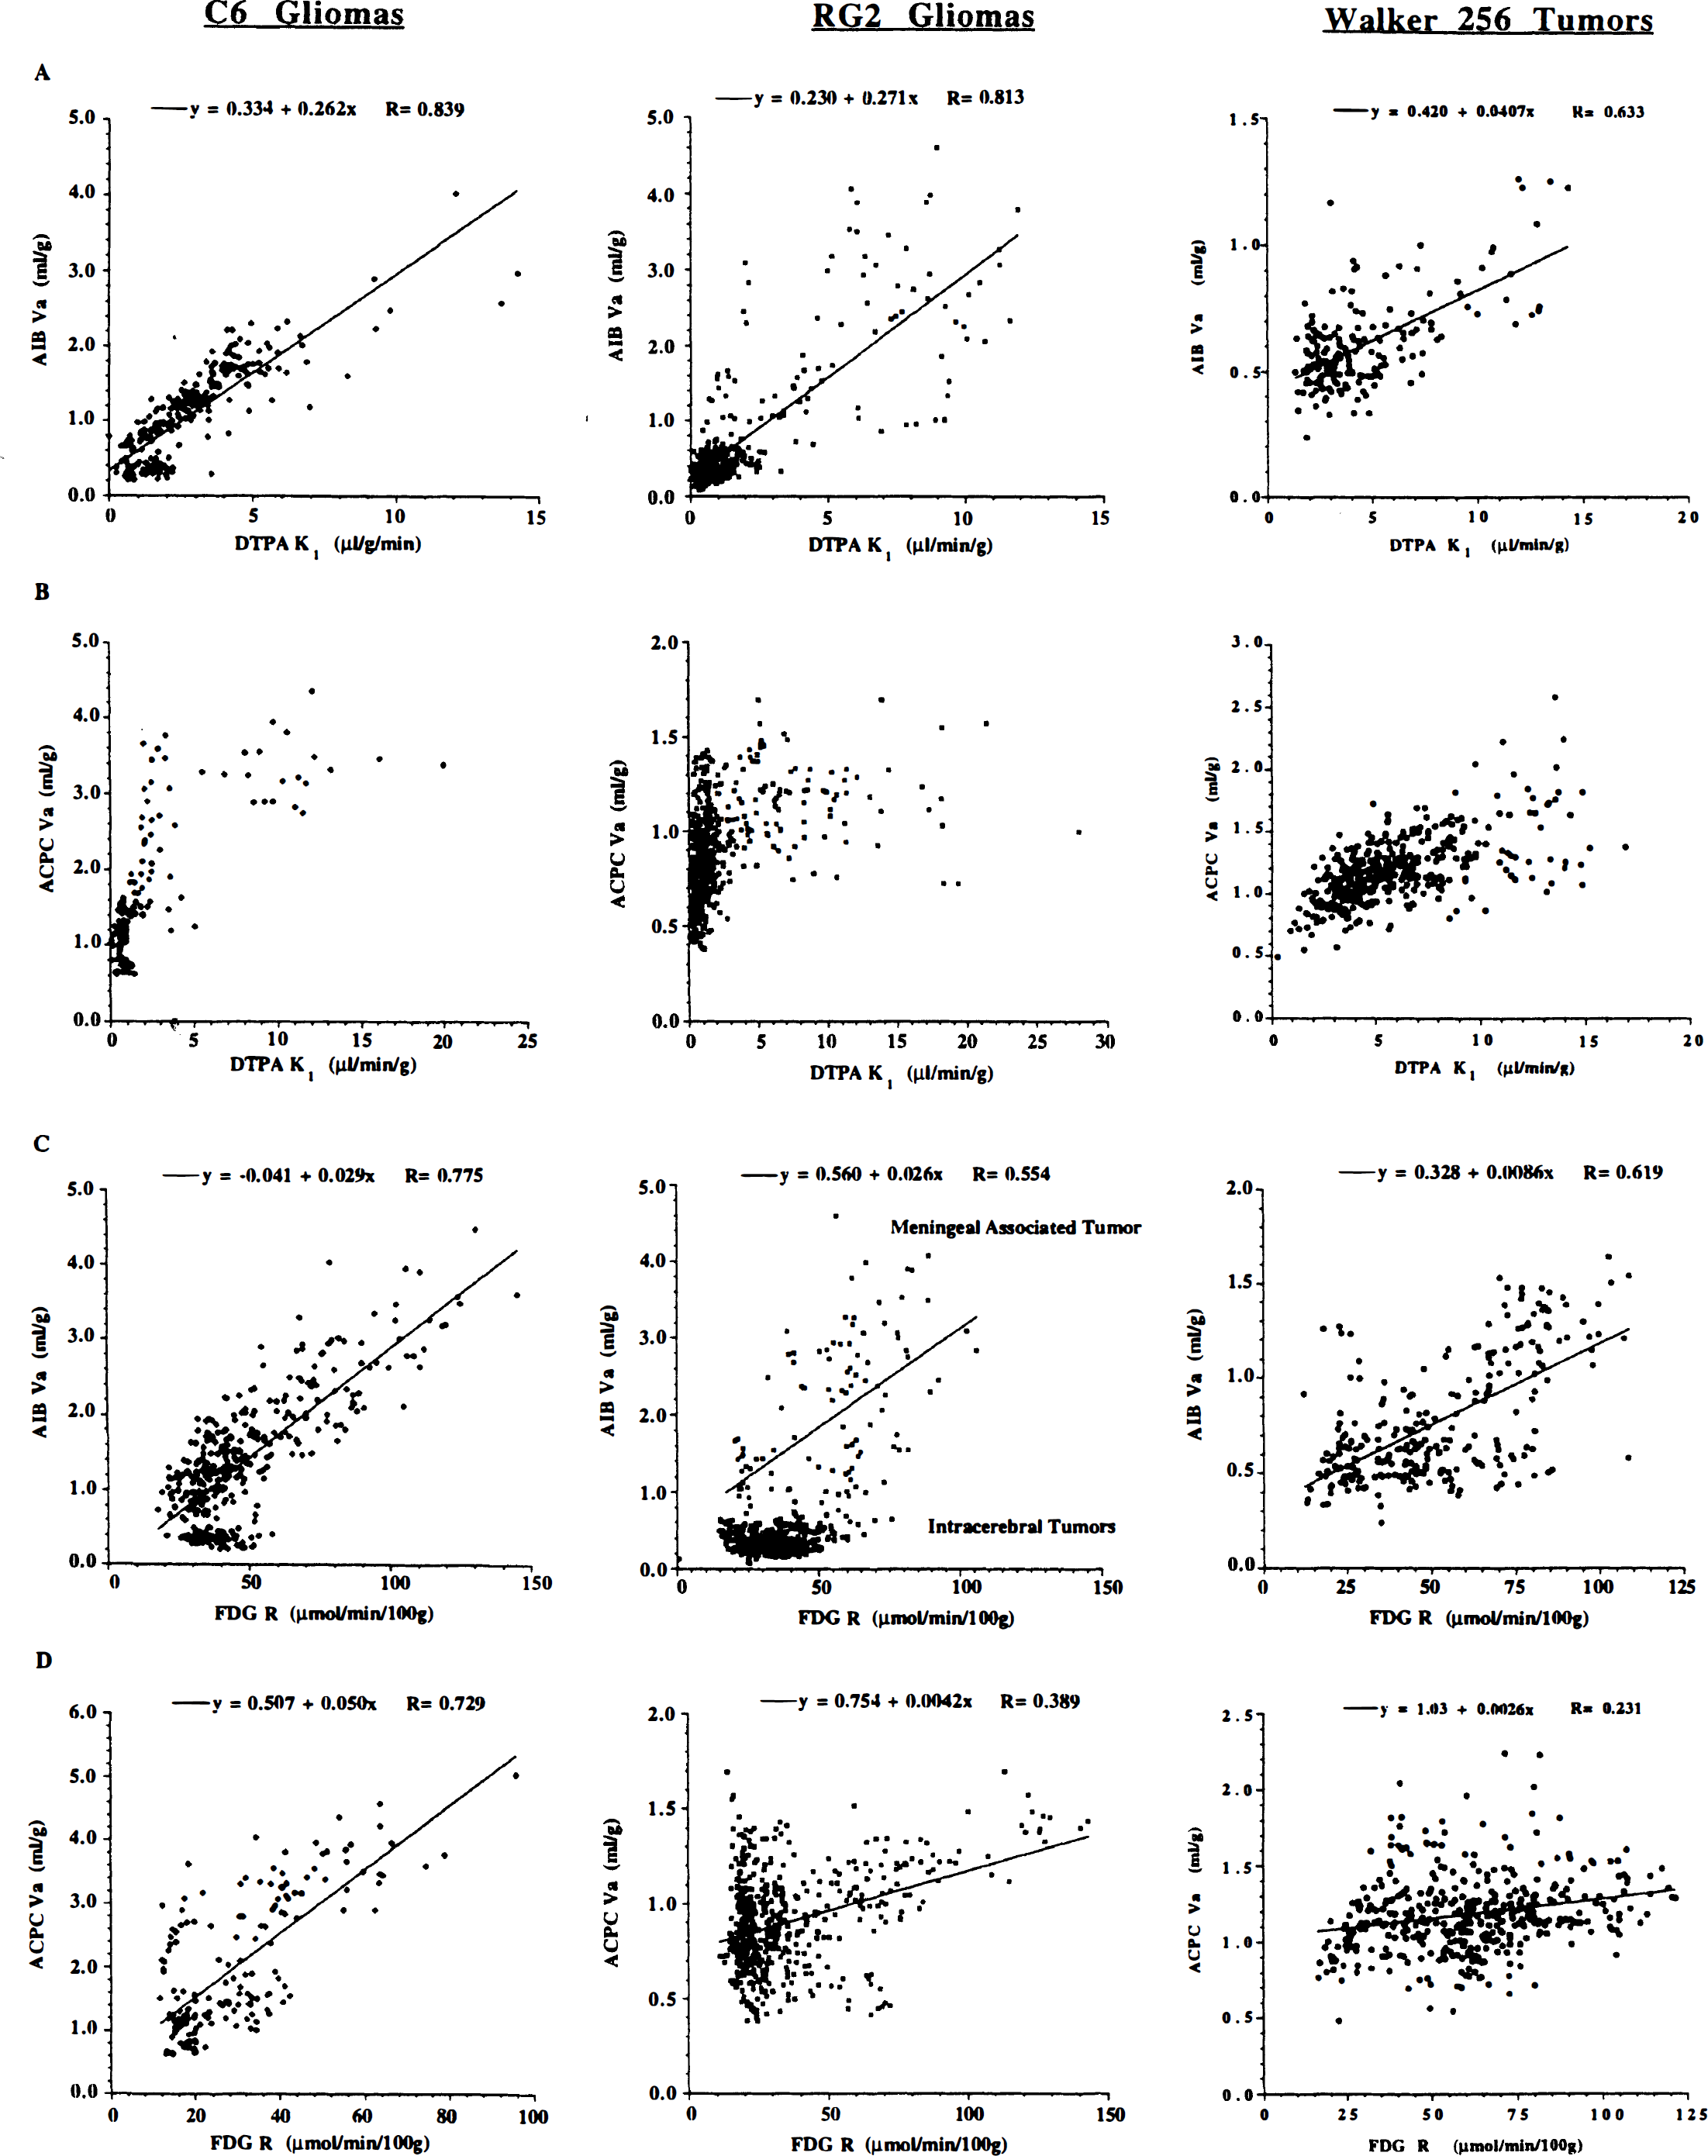
Intratumoral correlations. Multiple, local intratumoral measurements (0.07 mm2) were performed on the corresponding registered parametric images of apparent distribution volume (Va) for α-aminoisobutyric (AIB) acid or 1-aminocyclopentane carboxylic (ACPC) acid, R for fluorodeoxyglucose (FDG) and vascular permeability (K1) for gallium-diethylenetriaminepentaacetic acid (Ga-DTPA) (see Figs. 1–3), and the values are plotted graphically. All measurements were made in viable-appearing regions of the tumors and include areas of high and low cell density, “pale” areas suggestive of “impending necrosis,” but not necrotic-appearing tumor regions. The relationships between passive vascular permeability (K1 for Ga-DTPA) and Va for AIB (panel A) and Va for ACPC (panel B) are shown for all C6 gliomas, RG2 gliomas, and Walker 256 tumors. The relationships between relative glucose utilization (R for FDG) and Va for AIB permeability (K1 for Ga-DTPA) (panel C) and Va for ACPC (panel D) also are shown. Different symbols represent measurements from different tumors. The number of measurements varied from 21 to 176 in different meningeal and intraparenchymal tumor regions. The open symbols represent data from meningeal tumors; the closed symbols represent data from intraparenchymal (cortical and subcortical) tumors.
Radioactivity levels in tumor and brain
Radioactivity levels in tumor and brain tissue varied considerably (Table 4). The level of radioactivity (% dose injected/g tissue) depended on the radiopharmaceutical tracer FDG>ACPC>AIB≫Ga-DTPA.
Tissue uptake (% dose/g) of ACPC, AIB, FDG and Ga-DTPA*
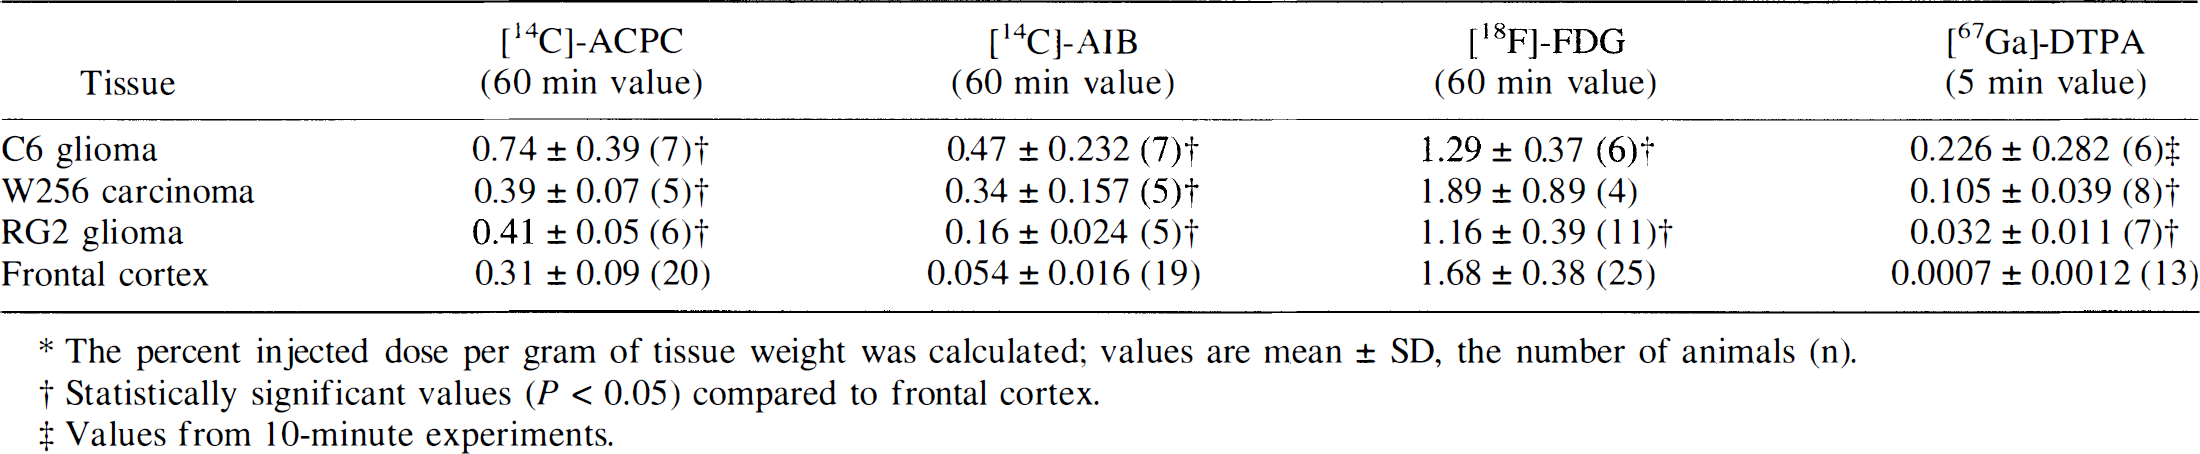
The percent injected dose per gram of tissue weight was calculated; values are mean ± SD, the number of animals (n).
Statistically significant values (P < 0.05) compared to frontal cortex.
Values from 10-minute experiments.
DISCUSSION
The design of the AIB and ACPC experiments was to focus on “late” imaging of amino acid accumulation, such that the measured tissue-to-plasma concentration ratio at 60 minutes (Va) would approximate the equilibrium tissue distribution space (Vd, mL/g). For low permeability tumor regions (K1 for Ga-DTPA < 5 μL/min/g), the measured Va for AIB is unlikely to approximate a true equilibrium Vd (Blasberg et al., 1983b). For the low vascular permeability tumors reported in the present study, the values of Va for AIB must be considered as lower limit estimates of Vd. Higher Va values for AIB would be expected in human tumors, where K1 values for Ga-DTPA have been reported in the range of 6 to 12 μL/min/g tumor for glioblastoma (Iannotti et al., 1987). Estimates of Vd for [11C]-AIB (and for [11C]-ACPC) in brain tumors could be obtained from dynamic PET imaging and blood sampling data using well-established tracer kinetic models and data analysis techniques, although such studies have yet to be performed in patients. Vascular permeability (K1 for Ga-DTPA) correlated best with Va for AIB in all three tumors. The biphasic profiles describing the relationship between K1 for Ga-DTPA and Va for ACPC suggest that there are phenotypic differences in ACPC accumulation within different tumors and tumor regions, and that these phenotypic differences correspond to differences in passive vascular permeability, as is measured with Ga-DTPA. Vascular permeability and tumor glucose utilization (R for FDG) were not related in more than 80% of C6, RG2, and Walker 256 tumors. A similar comparison between local measurements of vascular permeability and FDG uptake for human brain tumors has not been reported.
Amino acid accumulation
Amino acid transport by the sodium-dependent “A” carrier system results in a high intracellular-to-extracellular gradient, and this could be advantageous with respect to tumor imaging with both AIB and ACPC because of upregulation of this transporter by malignant cells. Despite the potential advantages of imaging tumors with [11C]-AIB, the results reported for tumors growing in systemic organs have not been consistently encouraging (Dunzendorfer et al., 1981; Schmall et al., 1982). In many cases, this was because of the high uptake of [11C]-AIB in adjacent tissue and surrounding organs. In the case of brain tumors, AIB uptake in adjacent brain tissue is limited by an intact blood–brain barrier and the absence of small neutral amino acid transporters on the luminal surface of brain endothelial cells (Betz and Goldstein, 1978). Alpha-aminoisobutyric acid (in comparison to ACPC, FDG, and Ga-DTPA) provided the clearest images of the three experimental tumors reported in the present study. The low background radioactivity in adjacent brain tissue is a substantial advantage in the assessment of whether all or part of a contrast-enhancing lesion represents recurrent viable tumor or tumor necrosis. These results suggest that the “viability” of contrast-enhancing tumor regions in patients may be assessed better with AIB than with FDG, although no [11C]-AIB PET studies of human brain tumors have been reported.
The accumulation of ACPC in brain slices and tumor cells in culture has been compared with other amino acids; it is less than that of AIB and more than methionine and other large neutral amino acids that have been used to image human brain tumors. The maximal rate of ACPC transport, Vmax, across normal brain capillaries by the “L” transporter is approximately twice that of methionine (Pardridge, 1977; Smith et al., 1987). 1-Aminocyclopentane carboxylic acid also was shown to have a higher affinity for the “A” transport system of endothelial cell membranes than methionine, based on amino acid competition studies. This is important because the “A” carrier system is expressed more highly in transformed and malignant cells (Foster and Pardee, 1969; Isselbacher, 1972; Saier et al., 1982; Handlogten and Kilberg, 1988) and provides the physiologic basis for imaging brain tumors with ACPC rather than with methionine or other amino acids.
Fluorodeoxyglucose accumulation
Despite the intratumoral correlations between local measurements of FDG (R) and amino acid uptake (Va) shown in Fig. 4 (Panels C and D), the FDG (R) images generally were disappointing, and this could not be related to the lower resolution of the [18F] autoradiograms compared to the [14C] autoradiograms. The ratio of tumor-to-brain radioactivity was consistently lower for FDG than for ACPC or AIB in C6 and RG2 tumors, and the tumor–brain interface could not be identified accurately in most cases. One reason for the comparatively low tumor-to-brain activity ratios for FDG is the high metabolic activity of normal brain structures of the fully conscious animals, particularly grey-matter structures surrounding or adjacent to the tumors. High metabolic activity in surrounding tissue also is a problem in the clinical interpretation of FDG-PET images of brain tumors, in contrast to lung or abdominal tumors where background metabolism usually is very low (Messa et al., 1992; Rege et al., 1993). It is widely appreciated that interpretation of FDG-PET brain tumor images often is problematic in assessing whether a contrast-enhancing lesion observed on magnetic resonance imaging or computed tomography is viable or necrotic, and image registration techniques frequently are applied to define the exact location of the contrast-enhancing region of the lesion on the FDG-PET image to assist in this assessment (Wahl et al., 1993). The FDG autoradiograms provided greater tumor–brain contrast with Walker 256 tumors, and the results presented in the present study are consistent with previously published studies using [14C]-deoxyglucose (Blasberg et al., 1986). A relative hypometabolism of brain tissue adjacent to Walker 256 tumors frequently extended several hundred microns beyond the tumor margins and appeared to be related to peritumoral edema, as has been observed in many human brain tumors. The variable pattern of FDG uptake in the three experimental tumors is similar to that observed clinically and is the reason given for defining tumor metabolism on the basis of “highest” or “peak” level of radioactivity within the tumor, rather than presenting a mean value for the entire tumor or for the “viable” portion of the tumor (DiChiro and Brooks, 1988b). Another reason given for presenting the “peak” FDG value is that this region (value) is considered to represent the most malignant portion of the tumor. As discussed in the following section, our data and that of others suggest that this may not be true and that “peak” FDG activity may reflect ischemic/hypoxic tumor regions with high anaerobic glycolysis.
Necrotic-appearing tumor regions generally were well visualized by low activity in the FDG autoradiograms. The contrast between viable and nonviable tumor regions generally was substantial in the larger necrotic regions of Walker 256 tumors, and frequently was amplified by a rim of hypermetabolism around the necrotic region. Focal tumor regions with high R values frequently corresponded to areas that appeared pale-staining and “ischemic/hypoxic” on histology. Ischemic brain tissue (low blood flow) has been shown in several experimental studies of stroke to be associated with high accumulation of deoxyglucose and FDG, suggesting an apparent uncoupling of flow and metabolism caused by an increase in anaerobic metabolism (Ginsberg et al., 1977), as well as in areas of “prenecrotic tumor (Kubota et al., 1994). A similar ischemic/hypoxic stimulation of FDG accumulation could be manifest in focal regions of the experimental brain tumors reported here, as well as in higher-grade human brain tumors where vascular hyperplasia and foci of necrosis frequently are identified. In vitro studies of FDG uptake in human cancer cell lines has shown that acute and chronic hypoxia results in increased FDG accumulation (Clavo et al., 1995). This increase in FDG uptake could reflect an increase in anaerobic glycolysis and an increase in the expression of the Glut-1 transporter. Focal ischemia/hypoxia also may account for the high uptake of FDG noted in some regions of high-grade brain tumors, especially in glioblastoma multiforme where necrotic and ischemic/hypoxic tumor regions are well documented. The correlation between tumor morphology and functional FDG imaging observed in our quantitative autoradiography studies (see following section), suggests that a similar relationship may exist in human brain tumors and could account in part for the relationship observed between the level of FDG uptake and grade of tumor. Additional complicating factors arise in the presence of granulation tissue associated with the tumor or when infiltrating viable macrophages and granulocytes are present because these cells also accumulate FDG to high levels (Kubota, et al., 1992).
Morphologic characteristics of C6, Walker 256, and RG2 brain tumors
The meningeal extensions of each of the three tumors (C6, Walker 256, and RG2) consistently had the highest vascular permeability (K1 for Ga-DTPA). This characteristic was observed in RG2 and Walker 256 tumors previously (Groothuis et al., 1983; Blasberg et al., 1984b) and probably reflects the higher permeability of the meningeal vessels feeding this extension of the tumor. Corresponding values of Va for AIB also were higher in the meningeal extensions of these three tumors, whereas Va for ACPC was not increased compared with the intraparenchymal portion of these tumors. R (FDG) tended to be slightly higher in the meningeal extensions of C6 and RG2 tumors, but this difference was not statistically significant.
For the cortical and subcortical portions of RG2 gliomas, vascular permeability (K1 for Ga-DTPA) was low (0.3 and 1.1 μL/min/g, respectively) compared with a previously published value of 37 ± 10 μL/min/g (Groothuis et al., 1983), where AIB was used as the vascular permeability tracer. This change in phenotype of RG2 gliomas is unusual, but also was observed to a lesser degree with Walker 256 (Blasberg et al., 1984b) and the C6 (Hiesiger et al., 1986) tumors. These differences may reflect changes in the tumor cell lines that occurred over a period of 10 or more years.
High and low cell density regions of all three tumors generally corresponded with high and low values of Va for ACPC and AIB and with high and low values of R (FDG). A relationship between tumor cellularity and the level of FDG accumulation in tumors also has been demonstrated (Herholz et al., 1993). In contrast, vascular permeability (K1 for DTPA) did not correlate with cell density in any of the tumor groups.
Pale-staining areas that appeared to reflect “impending” necrosis on histology were observed most frequently in the larger subcortical Walker 256 tumors, less frequently in C6 gliomas, and much less often in RG2 tumors. These morphologically identified regions generally had high R (FDG) values, whereas corresponding measurements of Va for ACPC and AIB and K1 for Ga-DTPA showed little or no difference from the mean tumor value Many of the focal tumor areas that appeared to reflect “impending” necrosis on histology had considerably higher R values than other more “viable” and densely cellular-appearing regions. Areas of frank necrosis were seen only in the larger Walker 256 tumors; a few small areas of apparent necrosis were observed in the C6 gliomas, and no areas of necrosis were seen in the RG2 tumors.
Implications for clinical imaging of brain tumors
Numerous amino acids have been synthesized with positron-emitting labels and used to image tumors. The largest number of studies have involved methionine (Lilja et al., 1985; Ericson et al., 1985; Hatazawa et al., 1989; Ishiwata et al., 1989). Methionine is rapidly taken up by brain and tumor, reaching tumor-to-brain concentration ratios of 1.9 to 4.8 in high-grade gliomas (n = 12) compared with a concentration ratio of 0.8 to 1.0 in low-grade gliomas 5 minutes after intravenous injection (Ericson et al., 1985; Lilja et al., 1985). However, interpretation and kinetic analysis of methionine (and most other amino acid) data are complicated by the rapid appearance of radiolabeled metabolites in blood and tissue, and because the rate of metabolism varies extensively between patients (Hatazawa et al., 1989; Ishiwata et al., 1989). Sixty minutes after intravenous administration, only 37% (range, 16–72%) of measured radioactivity in plasma is parent methionine, 45% (range, 13–74%) is in acid precipitable protein, and other radiolabeled metabolites account for 18% of measured radioactivity.
Despite the aforementioned advantages of ACPC and AIB imaging (higher affinity to the “A” transporter and the absence of confounding metabolites), methionine incorporation into tissue protein and lipid and RNA fractions (Ishiwata et al., 1993a) could be an advantage with respect to imaging brain tumors. This point of view is supported by many animal studies that have shown rapid incorporation of radiolabeled amino acids into proteins of brain and tumor tissue, including methionine (Ishiwata et al., 1993b), fluorophenylalanine (Kubota et al., 1996), and fluorotyrosine (Coenen et al., 1989). In human subjects, the PET imaging data are much less convincing. Measurements of amino acid incorporation into brain and tumor protein of patients is based solely on a kinetic analysis of time-activity data (no direct tissue assays for radiolabeled protein have been reported). Contrary to some points of view, amino acid transport may be more important for tumor imaging in patients than amino acid incorporation into protein; this conclusion is based on the results of several dynamic PET studies using methionine (Roelcke et al., 1996), fluorophenylalanine (Miura et al., 1989; Ito et al., 1995), and fluorotyrosine (Wienhard et al., 1991). These results suggest that the incorporation of radiolabeled amino acids (such as methionine) into brain and brain tumor protein is much less likely to affect the images in patient studies compared with that observed in animals with tumors.
[11C]-labeling of ACPC and AIB can be performed and PET imaging of human brain tumors is likely to provide tumor images that are based primarily on the presence and upregulation of amino acid transporters in tumor and endothelial cell membranes. ACPC and AIB, as specific substrates for amino acid transporters, have several advantages, as aforementioned. The interpretation of ACPC and AIB images and the analysis of time-activity data will be simplified and not influenced by the presence of radiolabeled metabolites. In the case of other radiolabeled amino acids, the presence and wide range of radiolabeled metabolites in blood and tissue at the time of imaging complicates the analysis and interpretation of the images, as well as any comparisons between different patients.
APPENDIX A
Triple-Label quantitative autoradiography
The method for triple-label quantitative autoradiography was developed as an extension of a double-label quantitative autoradiography method that was used previously for producing separate images of [111In] and [14C] radioactivity (Blasberg et al., 1980), and [131I] and [14C] radioactivity (Blasberg et al., 1981). The objective is to produce three separate autoradiographic images from the same tissue section, each representing the distribution of radioactivity in the tissue of one of the three different isotopes (e.g., [18F], [67Ga], and [14C]). The principles on which this approach is based include: 1) selecting the proper combination of radioisotopes (e.g., physical half-life, energy of particle emission); 2) administering different amounts of radioactivity (e.g., short-lived [18F], t½ = 110 minutes > medium-lived [67Ga], t½ = 78 hours ≫ long-lived [14C], t½ = 5730 years); 3) absorbing the lower energy emissions of the medium-lived and long-lived isotopes by interposition of mylar film between the tissue sections and x-ray film (Fig. 5); and 4) exposing the tissue sections for different time intervals to take advantage of the differences in physical half-life and administered radioactivity of the isotopes.
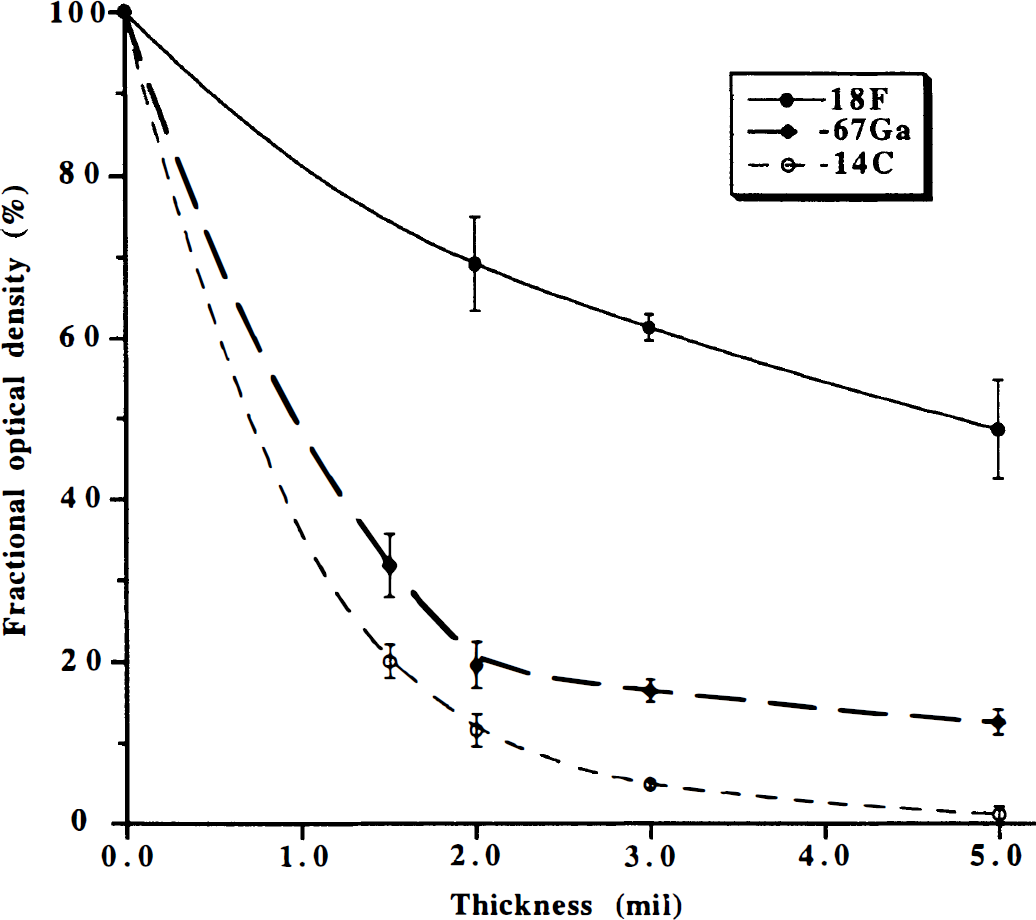
Triple-label quantitative autoradiography: mylar attenuation. Attenuation of [18F], [67Ga], and [14C] exposure of x-ray film by interposition of mylar film between standard tissue sections and SB-5 x-ray film (Kodak, Rochester, NY, U.S.A.) is shown. Attenuation, expressed as a fractional optical density, vs. mylar film thickness is plotted.
[18F]-FDG, [67Ga]-DTPA, and [14C]-ACPC or [14C]-AIB are ideally suited for triple-label quantitative autoradiography and facilitate a direct region of interest or pixel-to-pixel comparison of the resultant parametric images (R, K1 and Va, respectively) with the histology of the same tissue section. The effect of placing mylar film, ranging in thickness from 1.5 to 5.0 mm, between the tissue sections (autoradiographic standards) and x-ray film on optical density of the resultant image is shown for [18F], [67Ga], and [14C] in Figure 5. Mylar film 2.0 mm thick results in an 88% reduction in [14C] optical density and an 80% reduction in [67Ga] optical density, but only a 31% reduction in [18F] optical density, and was interposed between the sections and x-ray film during the first exposure. Mylar film 1.5 mm thick results in am 80% reduction in [14C] optical density and a 68% reduction in [67Ga] optical density, and was interposed between the sections (Fig. 5) and x-ray film during the second exposure after [18F] radioactivity had decayed away. The tissue sections were exposed directly to the x-ray film, without interposition of mylar, during the third exposure after [67Ga] and [18F] radioactivity had decayed away.
The 2.0-mm mylar film and short (45–60 minutes) x-ray exposure time limited the influence of the [67Ga] Auger electron emissions and the [14C] β-emissions on the first autoradiogram. The resultant images predominantly reflect [18F] radioactivity. This was confirmed by the absence of images from the [14C] standards on the film and only very faint images of the higher [67Ga] standards. The contribution of 67Ga to the initial autoradiogram was evaluated and found to be small in the “worst case” autoradiogram (Table 5). For the second exposure, after complete decay of [18F] radioactivity (confirmed by the absence of [18F] standard images on the film), a 1.5-mm mylar film and an 8- to 18-hour exposure time was used to obtain images that predominantly reflect [67Ga] radioactivity. Only faint images of the higher [14C] standards were observed on the film; the contribution of 14C to the second autoradiogram was evaluated and found to be negligible for the “worst case” autoradiogram (Table 5). For the third exposure, the resultant autoradiographic images were only due to [14C] radioactivity in the tissue sections because [18F] and [67Ga] radioactivity had completely decayed away; this was confirmed by the absence of [18F] and [67Ga] standard images.
Radioactivity contributing to each autoradiographic exposure: Worst case observations
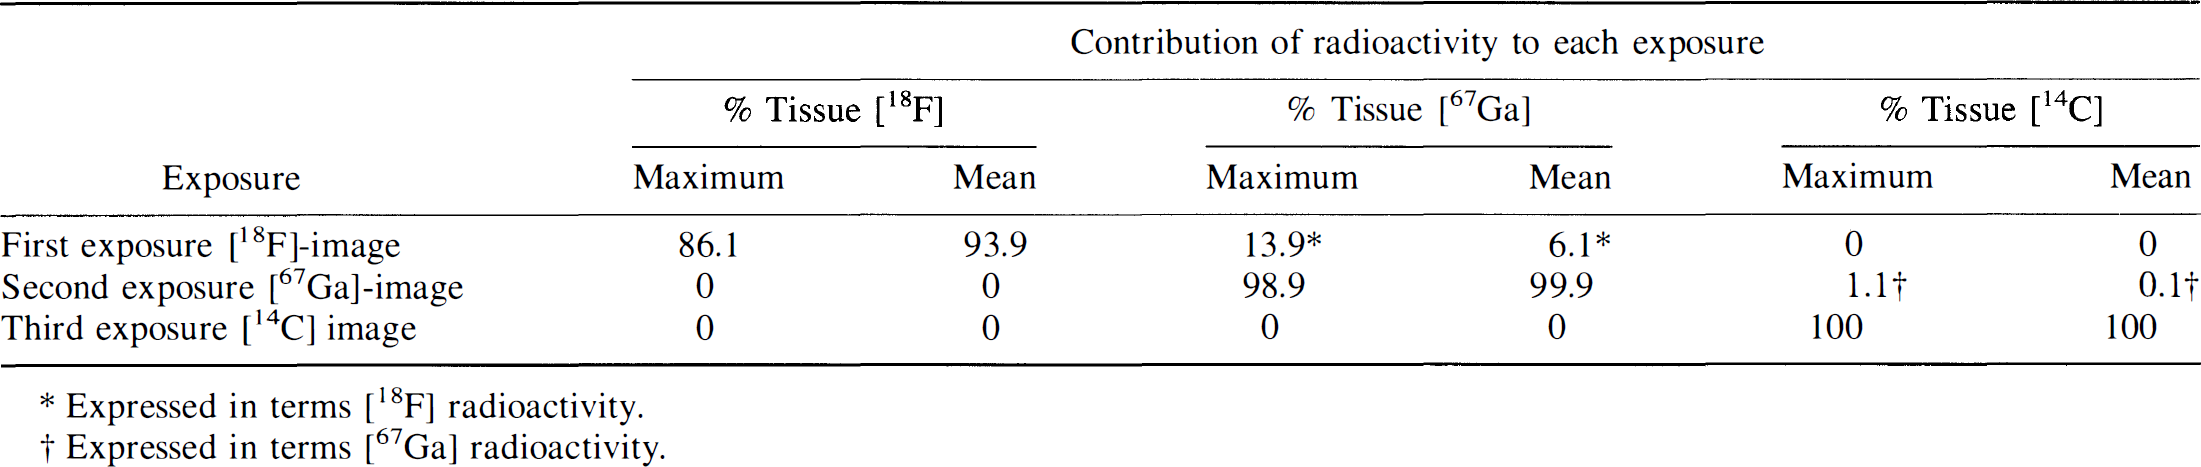
Expressed in terms [18F] radioactivity.
Expressed in terms [67Ga] radioactivity.