
Abstract
Tight homeostatic control of brain amino acids (AA) depends on transport by solute carrier family proteins expressed by the blood—brain barrier (BBB) microvascular endothelial cells (BMEC). To characterize the mouse BMEC transcriptome and probe culture-induced changes, microarray analyses of platelet endothelial cell adhesion molecule-1-positive (PECAM1+) endothelial cells (ppMBMECs) were compared with primary MBMECs (pMBMEC) cultured in the presence or absence of glial cells and with b.End5 endothelioma cell line. Selected cell marker and AA transporter mRNA levels were further verified by reverse transcription real-time PCR. Regardless of glial coculture, expression of a large subset of genes was strongly altered by a brief culture step. This is consistent with the known dependence of BMECs on in vivo interactions to maintain physiologic functions, for example, tight barrier formation, and their consequent dedifferentiation in culture. Seven (4F2hc, Lat1, Taut, Snat3, Snat5, Xpct, and Cat1) of nine AA transporter mRNAs highly expressed in freshly isolated ppMBMECs were strongly downregulated for all cultures and two (Snat2 and Eaat3) were variably regulated. In contrast, five AA transporter mRNAs with low expression in ppMBMECs, including y+Lat2, xCT, and Snat1, were upregulated by culture. We hypothesized that the AA transporters highly expressed in ppMBMECs and downregulated in culture have a major in vivo function for BBB transendothelial transport.
Keywords
Introduction
In most regions of the brain, unlike in the peripheral vasculature, specialized capillaries form a selective blood—brain barrier (BBB) between the plasma and the surrounding brain parenchyma. The BBB microvascular endothelial cells (BMECs) are associated with pericytes (embedded within the endothelial cell basement membrane), perivascular antigen-presenting cells, astrocytic endfeet (with an associated parenchymal basement membrane), and neurons. Together this intricate cellular matrix comprises the neurovascular unit. Uniquely among endothelium, BMECs express contiguous tight junctions (TJ) sealing the paracellular diffusion pathway to most solutes. Likewise, the lack of fenestrae and extremely low pinocytotic activity inhibits the BMEC transcellular passage of molecules. In addition, to supply the high central nervous system (CNS) metabolic needs, BMEC express specific plasma membrane transporters for nutrients into and toxic metabolites out of the CNS. Although, through expression of TJs, numerous transport, and other specialized proteins, BMECs form the barrier proper; they alone do not account for all of the unique CNS microvascular cell properties. Rather, interactions with the complex cellular and extracellular matrix influence BMEC morphology, biochemistry, and function resulting in an endothelium distinguishable from any other in the body (Engelhardt, 2003; Pardridge, 2005b).
Homeostatic brain interstitial fluid solute concentrations, which as for amino acids (AA) may differ significantly from plasma, are maintained in part by BMEC-regulated transendothelial transport. For AAs, tight control of brain availability is crucial because of involvement in a number of sensitive CNS pathways including neurotransmission and energy metabolism (Pardridge and Oldendorf, 1977). For example, the cerebrospinal fluid AA concentrations (with the exception of glutamine) are approximately 10-fold lower than in blood plasma (O'Kane and Hawkins, 2003). In general, AA movement across membranes is mediated by specialized transporter proteins belonging to several families of the solute carrier gene series (Slc). Throughout the body, Slc family transporters provide essential gatekeeping functions controlling uptake and efflux of physiologically crucial compounds (Hediger et al, 2004). Analogously to functions in kidney and gut epithelium, BBB transporters not only supply endogenous BMEC needs but are also key regulators of transendothelial fluxes participating in brain interstitial fluid homeostasis. Further, radiolabeled AAs are preferred tracers for intracranial tumor imaging by positron emission tomography (Lahoutte et al, 2004; Makrides et al, 2007). In addition, exploitation of carrier-mediated transporters such as AA transporters has been proposed as one promising avenue for therapeutics to reach CNS targets (Jones and Shusta, 2007; Ohtsuki and Terasaki, 2007; Pardridge, 2007). Therefore, identifying the BBB Slc transcriptome supports both understanding regulatory mechanisms as well as furthers key translational research (Neuwelt et al, 2008). Despite the molecular identification of a few BBB AA transporters, it is likely that several proteins potentially having an important in vivo function in BBB transendothelial AA transport have yet to be identified. However, the contributions of specific transporters to cellular housekeeping metabolism must be teased apart from functions in transendothelial transport.
One experimental approach for the study of normal and pathologic BBB physiology is the use of in vitro cell models. Models derived from mouse BMECs have the added advantages of being suitable for complementary in vivo/in vitro strategies and of the availability of specialized experimental techniques and tools, such as antibodies, microarrays, transgenic animal models. Indeed, in vitro mouse BBB models, for example, the primary mouse brain microvascular endothelial culture (pMBMEC) developed by Coisne et al (2005) or the immortalized mouse brain b.End5 endothelioma cell line (Rohnelt et al, 1997) have been applied to functional and other studies (Coisne et al, 2006; Lyck et al, 2003; Nottebaum et al, 2008). However, when removed from an in vivo context cultured BMECs rapidly dedifferentiate as indicated, for example, by loss of the characteristic in vivo BBB tight barrier (Couraud et al, 2003). Immortalization introduces further alterations in BBB phenotype. Conversely, identification of in vitro-specific changes in the BMEC transcriptome potentially reveals gene products with functions specific to the in vivo environment. Therefore, culture-induced decreases in AA transporter gene expression may reflect the diminished importance of transendothelial transport in vitro thereby highlighting possible transporter in vivo contributions in this capacity.
The aim of our study was to (1) determine the in vivo BMEC transcriptome, in particular for AA transporters, but also including several classes of genes whose products are important for differentiated BBB functions, that is, the TJ, ATP-binding cassette (ABC), and Slc family genes; and (2) catalogue culture-induced changes in gene expression. Therefore, we analyzed rapidly isolated and highly pure platelet endothelial cell adhesion molecule-1-positive (PECAM1+) mouse brain microvascular endothelial cells (ppMBMEC) by cDNA microarray. Furthermore, we described differences in gene expression induced by primary culture and in the immortalized b.End5 endothelioma. Finally, the differential mRNA expression for a selected set of genes focusing on AA transporters was assessed by reverse transcription quantitative real-time PCR (RT-qPCR).
Materials and methods
All animal procedures were performed in accordance with Swiss legislation on the protection of animals and approved by the appropriate governmental authorities (permission numbers 55/04, 104/04, and 4/05).
Preparation of Mouse Brain Microvascular Cells
Microvascular brain capillaries were isolated by the method of Coisne et al (2005) as follows: for each preparation cortices from ten 4-week-old female C57BL/6 mice (Charles River, L'Arbresle, France) were isolated and outer vessels and meninges were removed. Preparations were pooled and homogenized in Hank's balanced salt solution containing 10 mmol/L 4-(2-hydroxyethyl)-1-piperazineethanesulfonic acid, and 0.1% bovine serum albumin. The homogenate was mixed with 30% dextran and centrifuged at 3000g for 25 mins at 4°C. The pellet containing the vascular fraction was resuspended and filtered through a 60 μn nylon mesh. The capillary-enriched filtrate was digested in DNase I (10 mg/mL), TLCK (0.147 mg/mL), and collagenase/dispase (2 mg/mL) for 30 mins at 37°C. The digestion was stopped by an excess of wash buffer and filtered through a 20 μm nylon mesh. The crude cell preparation of freshly isolated mouse brain endothelial cells (crude EC fraction) was either further purified by anti-PECAM1 magnetic bead sorting (noncultured ppMBMEC) or plated on Transwell filters for culture alone (single-cultured pMBMEC) or coculture with primary glial cells (cocultured pMBMEC).
Culture of Isolated Brain Capillaries
After washing and centrifugation, the crude EC fraction was resuspended in 3 mL of media (Dulbecco's modified Eagle's medium, 20% fetal bovine serum, 2% sodium pyruvate, 2% essential AA, 50 μg/mL gentamycin, and 1 ng/mL basic fibroblast growth factor). For culture, 100 μL of the cell suspension was seeded per Transwell filter insert (pore size 0.4 μm; Corning Costar Corporation, Cambridge, MA, USA). After 24 h, red blood cells, cell debris, and nonadherent cells were removed by two washing steps. Cells that were further cultured for a total of 5 days without passaging and in the absence of glial cells constituted the single-cultured pMBMEC condition. For cocultured pMBMECs, 24 h after isolation filters seeded with pMBMEC were washed (as described above) and placed into dishes containing lower chamber wells that had been previously seeded with mouse brain primary glial cells (see ‘Preparation of primary glial cell cocultures’ below) and grown for an additional 4 days as described for single-cultured pMBMECs.
Preparation of Primary Glial Cell Cocultures
Glial cells were isolated from 2- to 3-day-old mice as previously described (Coisne et al, 2005) and cultured in the lower wells of Costar two-chamber Transwell system (Corning Costar Corporation) for 3 weeks. At 3 weeks, glial cell cultures consisted of approximately 85% astrocytes (Coisne et al, 2005) and were then used for coculturing with pMBMECs.
Preparation of PECAM1+-Purified Noncultured ppMBMECs
Freshly isolated MBMEC were immediately incubated with anti-PECAM1 antibody (Mec13.3)-coated sheep anti-rat IgG Dynabeads (Invitrogen Dynal AS; Invitrogen, LuBioScience GmbH, Lucerne, Switzerland) for 20 mins with mixing at 4°C in wash buffer (Hank's balanced salt solution, 10 mmol/L 4-(2-hydroxyethyl)-1-piperazineethanesulfonic acid, and 0.1% bovine serum albumin). Subsequently, beads were washed four times with wash buffer. For RNA isolation cells bound to beads were lysed by repeated trituration in 400 μL of RNAready kit lysis buffer (BioDiagnostik, University Bern, Bern, Switzerland) and lysates were collected separately from beads. To minimize RNA degradation and de novo RNA synthesis, from decapitation until RNA isolation (total time 5 to 6h), cell preparations were maintained at 4°C to 10°C (with the exception of the 30 mins 37°C collagenase digestion).
RNA Extractions
For microarray analyses endothelial RNA was isolated from three individual preparations from four MBMEC sources: (1) noncultured PECAM1-purified ppMBMEC; (2) single-cultured pMBMEC; (3) cocultured pMBMEC; and (4) b.End5 endothelioma cell line (Rohnelt et al, 1997). RNA extractions were performed using RNAready kit (BioDiagnostik) according to the manufacturer's protocol including an on-column DNase digestion. In addition, for quantitative real-time PCR (qPCR), RNA was prepared from total mouse brain homogenates and mouse brain glial cell cultures using the RNAeasy kit (Qiagen AG, Hombrechtikon, Switzerland). Quality and quantity of all isolated RNAs were determined with a NanoDrop ND 1000 (NanoDrop Technologies, Wilmington, DE, USA) and a Bioanalyzer 2100 (Agilent, Waldbronn, Germany). The RNA integrity numbers in all cases were from 8.7 to 9.7 indicating minimal RNA degradation (Schroeder et al, 2006).
Microarray Analysis
The Mouse Genome 430 2.0 Arrays (Affymetrix UK, High Wycombe, UK) were used to compare gene expression for triplicate samples of RNAs isolated from MBMEC preparations. The cDNA preparation and labeling and microarray hybridizations were performed by the Functional Genomics Center Zurich. Briefly, cDNAs were prepared by RT (WT-Ovation Pico System; NuGEN, San Carlos, CA, USA) according to the manufacturer's protocol from total isolated RNAs. Single-stranded cDNA quality and quantity was determined using NanoDrop ND 1000 and Bioanalyzer 2100. Fragmented and biotin-labeled single-stranded cDNA targets were generated with the FL-Ovation cDNA Biotin Module V2 (4200-12; NuGEN) according to the manufacturer's protocol.
Three GeneChip Mouse Genome 430 2.0 were used for microarray hybridization of each sample condition (i.e., noncultured, single-cultured, cocultured, cell-line). The biotin-labeled cDNA targets were mixed in 220 μL of Hybridization Mix (Affymetrix Inc.; P/N 9007200) containing Hybridization controls and Control Oligonucleotide B2 (Affymetrix Inc.; P/N 900454). Samples were hybridized to GeneChip arrays for 18 h at 45°C. Arrays were washed using Affymetrix Fluidics Station 450 FS450_0004 protocol. An Affymetrix GeneChip Scanner 3000 (Affymetrix Inc.) was used to measure fluorescent intensities emitted by labeled targets and signals were saved to a CEL file format. Microarray data (CEL, CHP, and RMA files) are available at GEO with the accession number GSE14375.
Microarray Data Processing
Quality control measures were performed before performing statistical analysis. Quality control included visual inspection, adequate scaling factors (between 1 and 3 for all samples), and appropriate numbers of present calls calculated by application of a signed-rank call algorithm. CEL file date were normalized using RMAExpress 0.5 (Robust Multichip Average) (Bolstad et al, 2003) and Custom CDF version 10 (Mm430_Mm_REFSEQ.cdf) (Dai et al, 2005). The RMAExpress options background-adjustment and quantile normalization were enabled. To exclude probe sets in the lower end of the signal range, which have large signal variation, a cutoff value was defined as the maximal signal value obtained from nonmurine Affymetrix-control probe sets multiplied by a factor of 1.2. In this data set, the cutoff value was log25.78. Probe sets with a signal below cutoff in every array of the corresponding comparison, as well as Affymetrix control probe sets (prefix of ‘AFFX’), were excluded from further analysis. To examine gene changes, we performed pair-wise significance analysis between each of the cultured MBMEC conditions (single-cultured, cocultured and cell-line) and the noncultured ppMBMECs, that is, three comparisons with three versus three arrays each. The Excel-plugin of SAM, version 2.23A was used with the parameters t-test and 100 random permutations (Tusher et al, 2001). In each comparison, between 8,000 and 10,000 probe sets had a q-value below 5%. For all genes scored, the fold change (FC) was calculated by dividing the values from the cultured (single-cultured, cocultured, cell-line) conditions by the value from the noncultured condition. In addition, the sets of genes with mean expression ≥ 2 FC increased or decreased for each of the cultured samples relative to noncultured MBMECs were identified.
Quantitative Real-Time PCR Analyses
Selected sets of genes were tested either using SYBR Green or TaqMan real-time RT-qPCR as indicated in the text. With the exception of 18S rRNA primers (Applied Biosystems, Life Technologies, Carlsbad, CA, USA) primer sequences are listed in Supplementary Table 1. For each gene, the negative control cDNAs produced without RT enzyme were assayed in parallel and a reference (s16 ribosomal protein mRNA for SYBR Green and 18S rRNA for TaqMan qPCR reactions) was included. For validation of the PECAM+1 MBMEC purification protocol, RNAs were analyzed by SYBR Green qPCR. For SYBR Green qPCR, RT was performed with SuperScript III First-Strand Synthesis System (Invitrogen) using random hexamers and qPCR was performed using the MESA GREEN qPCR MasterMix Plus (Eurogentec, Seraing, Belgium) according to the manufacturer's protocol. For confirmatory TaqMan qPCR analyses of the microarray experiments, pools were made by sample type from aliquots of the same noncultured, single-cultured, cocultured, and cell-line RNAs used for microarray. Reverse transcription of pooled RNA and RNA isolated from whole mouse brain and cultured mouse glial cells was performed with the TaqMan RT kit using random hexamers (Applied Biosystems). The cDNA was prepared from either 250 ng of total RNA (single-cultured, cell-line), 500 ng (total brain, glial cells), or 200 ng (cocultured, noncultured) of each pooled sample type. Quantitative real-time PCR (1 ng cDNA per reaction in triplicate) was performed according to the manufacturer's protocol using MicroAmp Fast Optical 96-Well Reaction Plates (Applied Biosystems). All qPCR reactions were performed using the Fast Real-Time PCR System 7500 (Applied Biosystems). Relative expression values were calculated according to the comparative ΔCT method (relative expression = 2−ΔCT, ΔCT value = average CT value of target—average CT value of endogenous reference). After determination that the efficiency of a representative set of 15 primer pairs (including 18S rRNA) was in the range of 1.7 to 2.1, the idealized primer efficiency value of 2 was used for all relative expression calculations. The standard deviation of the ΔCT value was calculated from the standard deviations (s) of the individual CT values (s1, s2) using the following formula: s =
Assessment of PECAM1+ ppMBMEC by qPCR
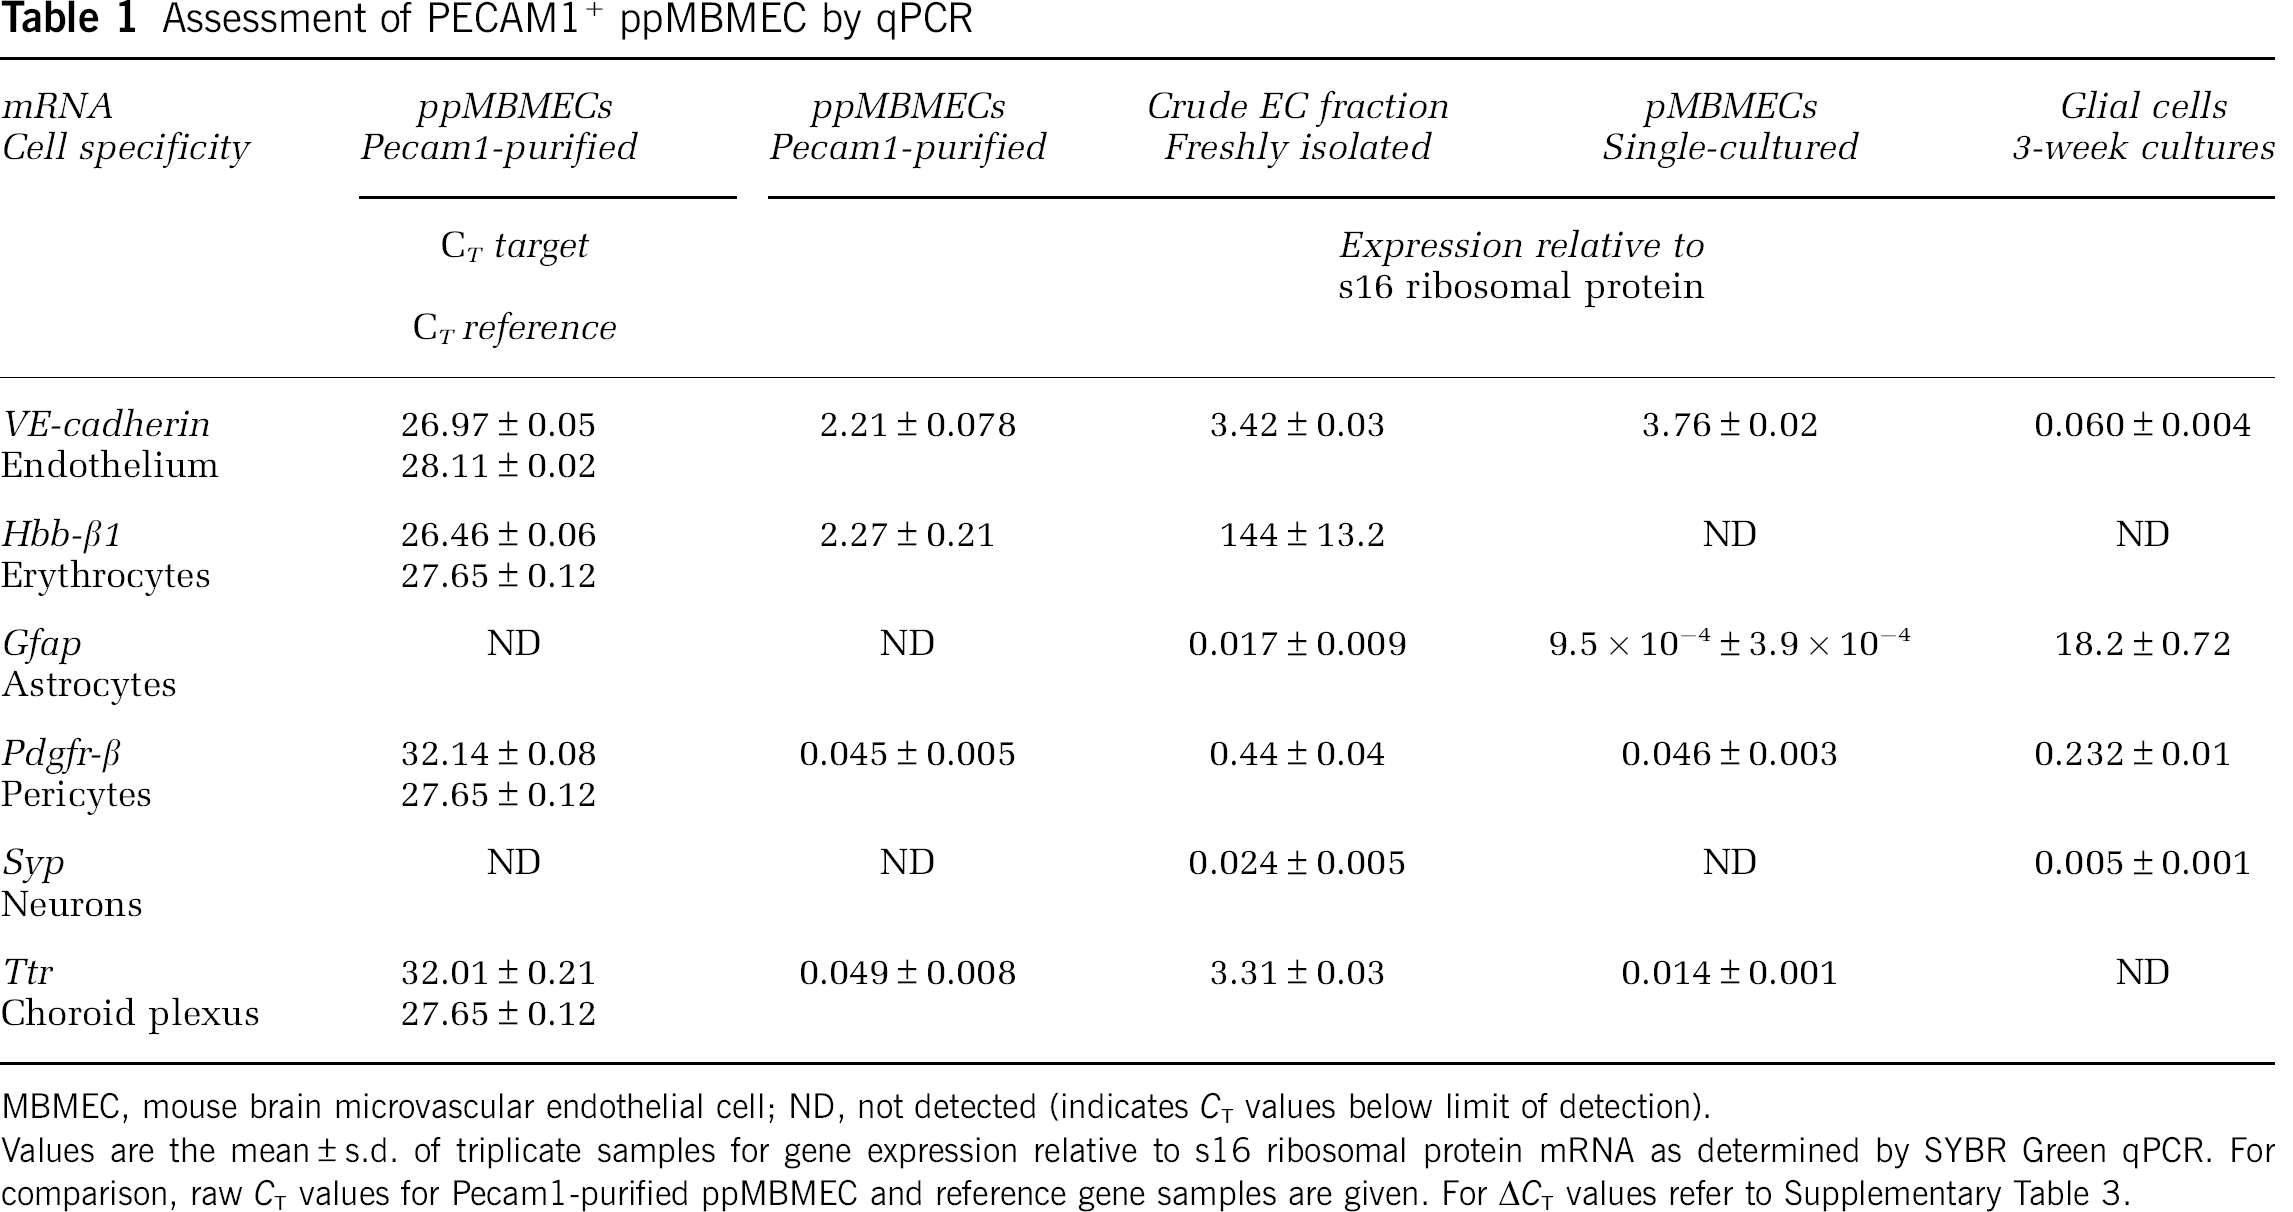
MBMEC, mouse brain microvascular endothelial cell; ND, not detected (indicates CT values below limit of detection).
Values are the mean ± s.d. of triplicate samples for gene expression relative to s16 ribosomal protein mRNA as determined by SYBR Green qPCR. For comparison, raw CT values for Pecam1-purified ppMBMEC and reference gene samples are given. For ΔCT values refer to Supplementary Table 3.
Statistical Analyses of Real-Time PCR (qPCR) Data
Statistical analyses of data from TaqMan qPCR reactions were calculated using one-way nonparametric analysis of variance followed by Dunnett multiple comparison tests, with the statistical significance set at P < 0.05.
Results
Freshly Isolated Mouse Brain Microvascular Endothelial Cells
To profile in vivo BBB gene expression, we rapidly isolated fresh PECAM1+ MBMECs (ppMBMEC) from a crude EC fraction consisting of short capillary fragments, single ECs, erythrocytes, and glial cells (Supplementary Figure 1A and 1B). The nature of the purified ppMBMECs was confirmed by immunostaining of the TJ protein, Claudin5 (CLDN5), and nuclear staining. The images shown indicate erythrocytes were depleted and at least 95% of nucleated cells were ECs (Supplementary Figure 1B–1D). In addition, RNA samples were tested by qPCR (SYBR Green, s16 ribosomal protein mRNA endogenous reference) for the presence of specific cell-type markers (Table 1). The erythrocyte-specific hemoglobin β-chain (Hbb-β1) mRNA was reduced 98%, whereas the EC marker vascular endothelial Cadherin (Ve Cadherin) (CD144) remained essentially unchanged in all MBMECs. Furthermore, in ppMBMECs, glial fibrillar acidic protein (Gfap), an astrocyte-specific marker, was below the limit of detection. And, the pericyte marker platelet-derived growth factor β-receptor (Pdgfr-β) was reduced 90%. This is a respectable decrease considering pericytes share a common basal membrane with ECs. The neuron-specific synaptophysin (Syp) expression already very low in the crude EC fraction was below the detection limit in both purified and cultured MBMECs. Finally, 99% of the choroid plexus epithelial cell marker transthyretin mRNAs were removed from ppMBMECs. Thus qPCR data confirmed the high degree of endothelial ppMBMECs purity observed by microscopy.
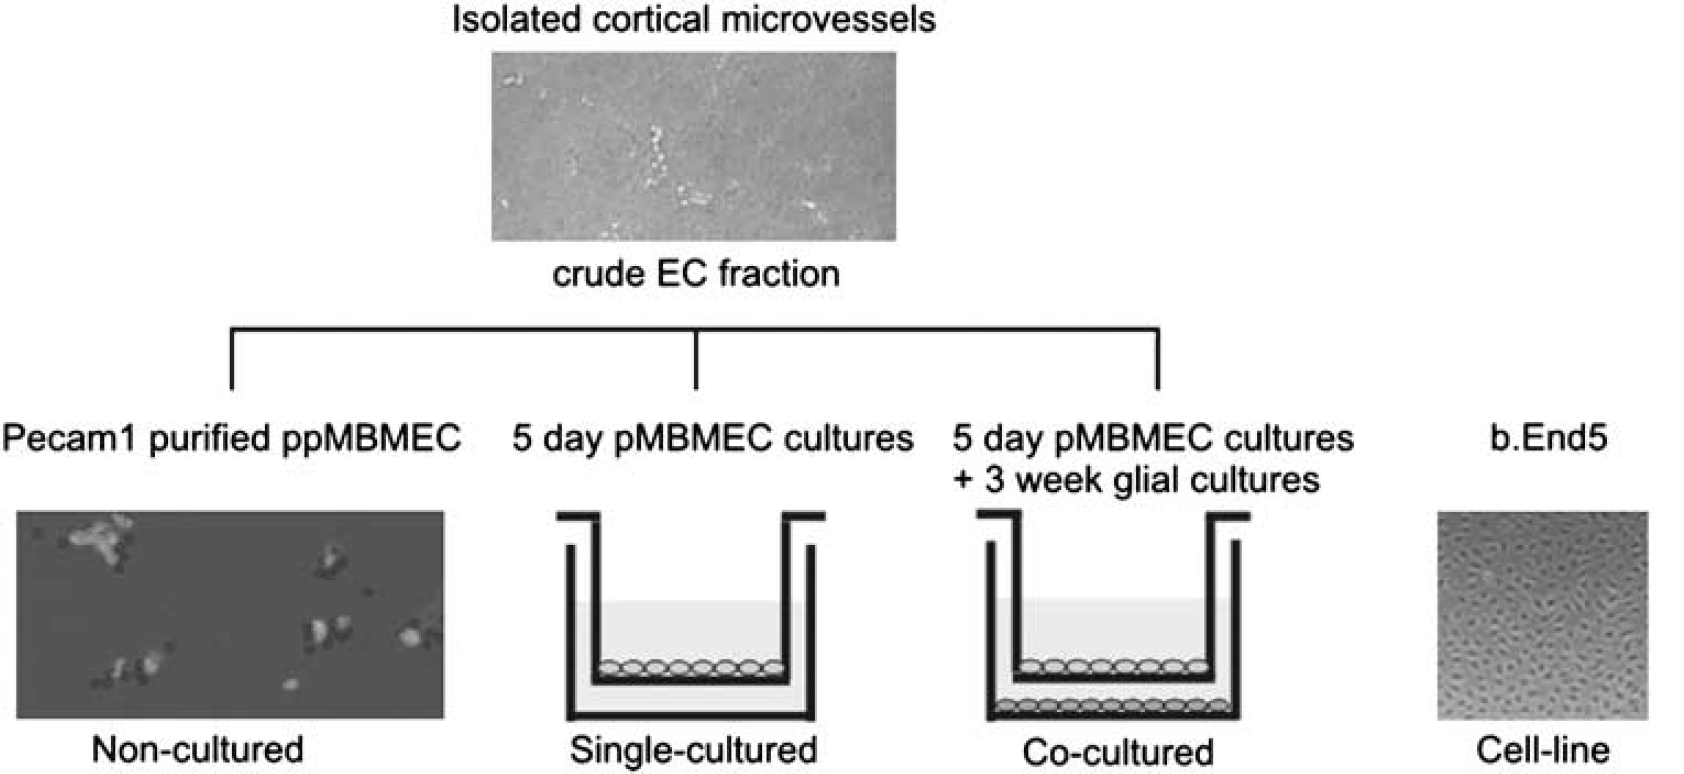
Mouse brain microvascular endothelial cell (MBMEC) RNAs tested by microarray and qPCR. A simple scheme outlining the source of each of the MBMEC RNA samples (i.e., noncultured, single-cultured, cocultured and cell-line) tested by Affymetrix microarray and by TaqMan qPCR.
MBMEC Gene Expression Changes in Culture
As diagrammed in Figure 1, gene expression was surveyed by Affymetrix cDNA microarray hybridizations (mouse array 430.2) from four sources of MBMECs: (1) PECAM1+-purified ppMBMECs (noncultured); (2) primary in vitro mouse BBB model, pMBMECs, (Coisne et al, 2005) cultured without passage either in the absence (single-cultured); or (3) noncontact presence of primary mouse brain glial cultures (cocultured); and (4) an in vitro BBB cell model, the immortalized mouse brain endothelioma b.End5 (cell-line) (Rohnelt et al, 1997). Selected gene expressions were verified by qPCR (TaqMan, 18S rRNA reference). Although, microarray values of the EC marker von Willebrand factor were 97% lower for the b.End5 cell-line compared with other MBMECs, Ve Cadherin, Pecam1, and intercellular adhesion molecule-2 were well above cutoff for all MBMECs (data not shown). Furthermore, qPCR confirmed enrichment of Ve Cadherin, Pecam1, and of the main BBB glucose transporter Glut1 mRNAs for all MBMECs relative to glial cultures and total brain. It also confirmed the negligible contamination of ppMBMECs by pericytes, astrocytes, and neurons (Table 2). Finally, individual gene expression values obtained by microarray hybridization correlated well with qPCR data (r2 = ~0.7; Supplementary Figure 2).
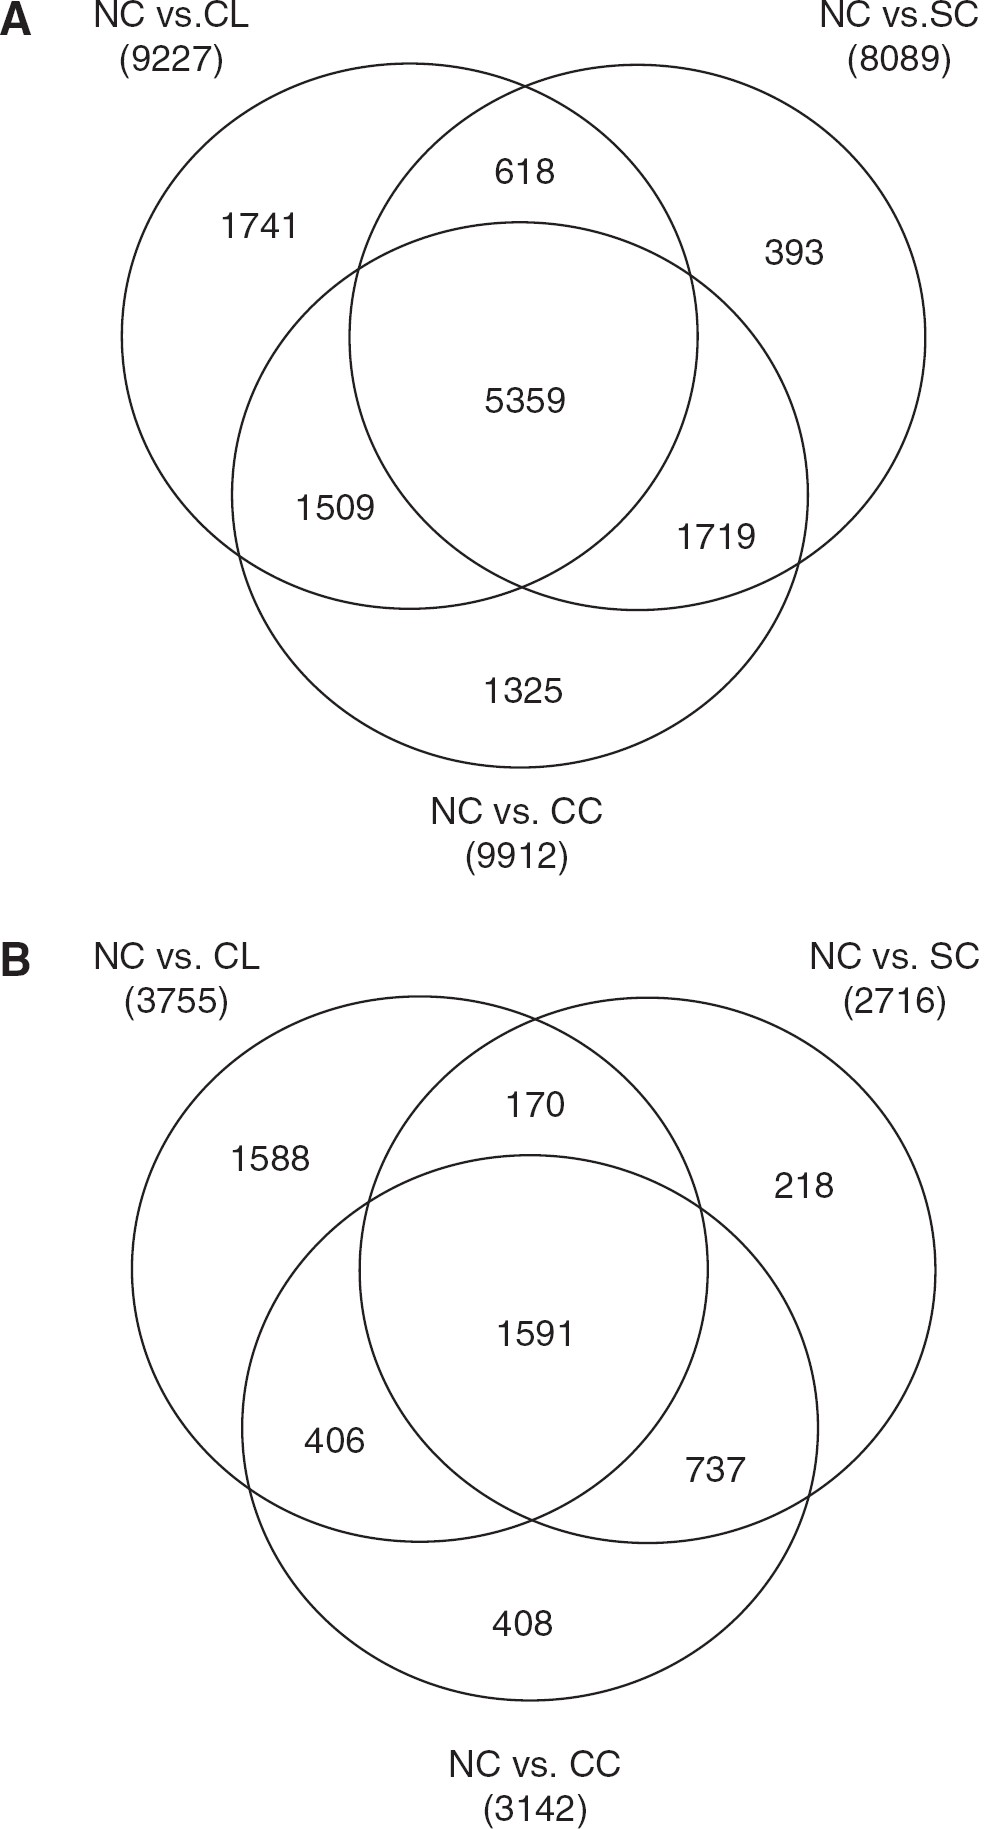
Changes in gene expression patterns for cultured relative to noncultured MBMECs. Venn diagrams of the pair-wise comparisons of mean gene expression as determined by microarray of noncultured (NC) ppMBMECs versus each cultured condition were constructed for single-cultured (SC), cocultured (CC), and cell-line (CD MBMECs. Shown are overlapping sets of SC, CC, and CL, respectively versus NC for: (
Expression of selected cell marker, TJ and ABC transporter mRNAs in MBMECs by qPCR
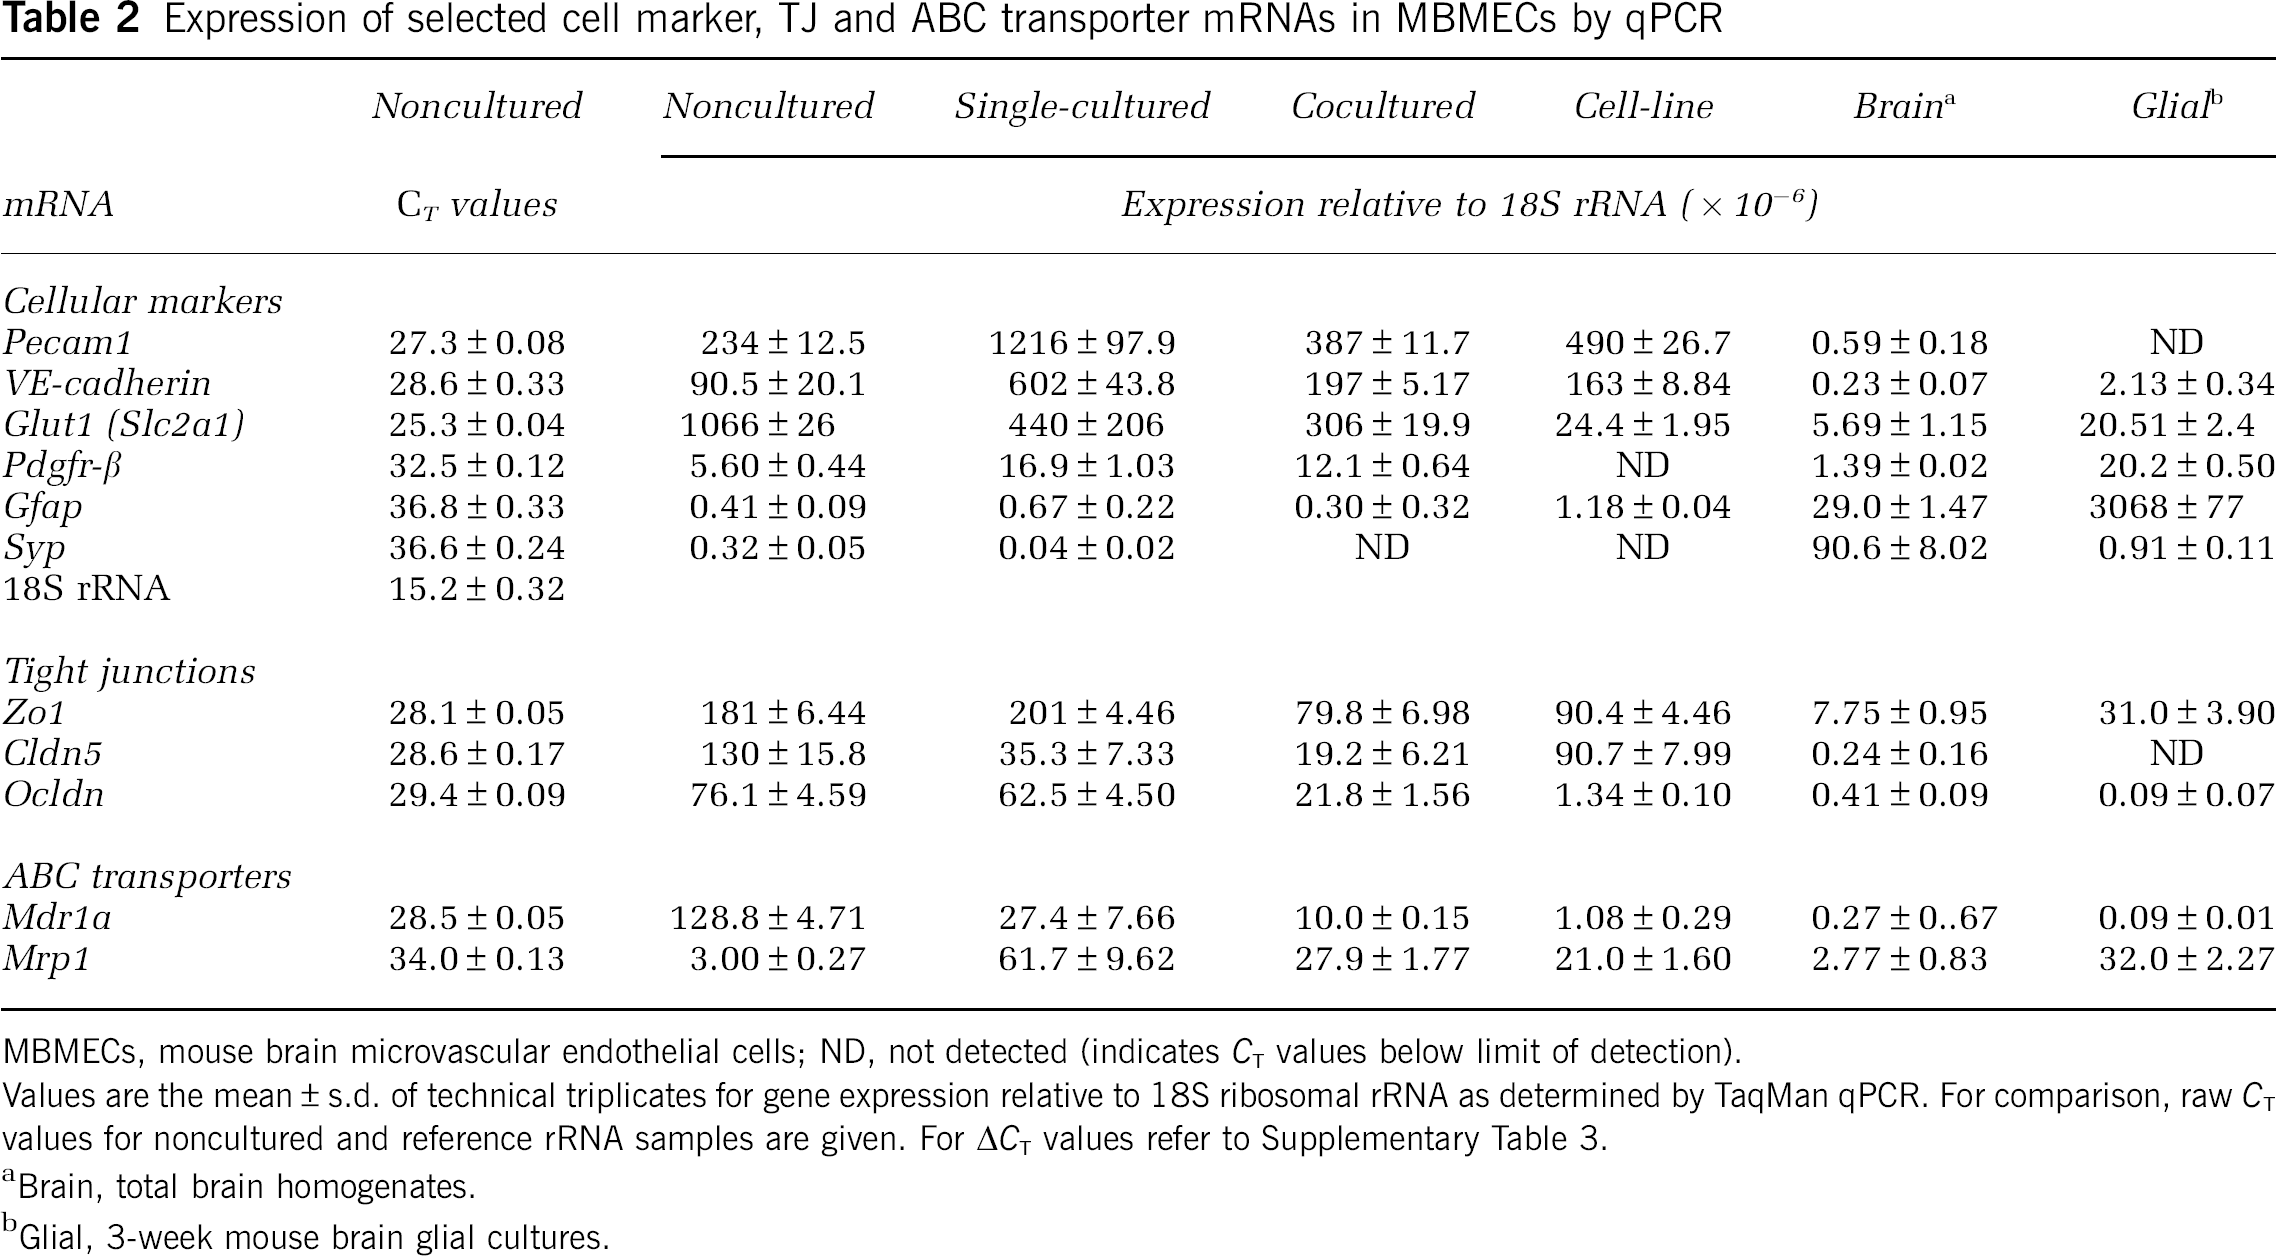
MBMECs, mouse brain microvascular endothelial cells; ND, not detected (indicates CT values below limit of detection).
Values are the mean ± s.d. of technical triplicates for gene expression relative to 18S ribosomal rRNA as determined by TaqMan qPCR. For comparison, raw CT values for noncultured and reference rRNA samples are given. For ΔCT values refer to Supplementary Table 3.
Brain, total brain homogenates.
Glial, 3-week mouse brain glial cultures.
A total of 15,100 out of 21,625 annotated genes surveyed by microarray met the criteria to be considered expressed (i.e., mean hybridization signal above cutoff) for at least one MBMEC condition. Pair-wise comparisons between the noncultured versus cultured (single-cultured, cocultured, cell-line) conditions revealed a large proportion of mRNAs that were significantly differentially expressed (q≤0.05) (84% of expressed mRNAs in at least one, and 35% under all culture conditions) (Figure 2A). Further, approximately a third of all transcripts were ≥ 2 FC) for at least one cultured condition, with almost two-thirds of these likewise altered in a second condition (Figure 2B). Overall, nearly equal proportions of genes were up- and downregulated for each individual culture condition versus noncultured ppMBMECs. Moreover more than half of these genes were regulated in the same direction for a second culture condition (data not shown). Coculture with glial cells has been reported to partially restore the differentiated phenotype of primary brain ECs (Coisne et al, 2005). However, only 5% (724) of all genes (or 2% of genes with ≥2 FC) were expressed differently between the two primary culture conditions (data not shown). Thus even a brief culture step strongly impacted the expression of a large subset of MBMEC genes in a similar manner whereas noncontact coculture for 4 days with glial cells did not generally restore the in vivo BBB transcriptome phenotype.
MBMEC Gene Expression for TJ and ABC Transporters
We then sought to understand the impact of culture on two important classes of genes expressed in vivo by differentiated BMECs, the TJ protein and ABC transporters. The microarray gene expression data showed significant expression for 10 of the 26 investigated TJ-associated protein genes (Supplementary Table 2). For noncultured ppMBMECs, the mean hybridization signals for the zona occludens (Zo1, Zo2), occludin (Ocldn), claudins (Cldn5, Cldn6, Cldn12), endothelial-cell-selective adhesion molecule (Esam), and junctional adhesion molecules (JamA, JamB, JamC) were above cutoff. Cldn5, Ocldn, and Zo1 were further assessed by qPCR with mRNA expression of Zo1 > Cldn5 > Ocldn (Table 2). In cocultured and cell-line but not in single-cultured samples Zo1 mRNA decreased ~50%. Whereas, Cldn5 levels were approximately 70% to 80% lower in single- and cocultured but not cell-line samples. Although Ocldn levels, which fell moderately in cocultured but not single-cultured, were strongly reduced in cell-line samples. Overall, b.End5 cell-line samples exhibited the greatest number and extent of downregulated TJ mRNAs (Supplementary Table 2).
Noncultured ppMBMEC expressed 26 ABC transporter genes above cutoff (Supplementary Table 2). The six with the highest mean signals were Abc1a1 (ABC), Abcb1a (MDR1a/Pgp), Abcc4 (MRP4), Abcd3 (PMP68), Abcg1 (WHITE), and Abcg2 (ABCP). Approximately one-third were changed in cultured conditions. Notably, by qPCR as well as by microarray, Mdr1a/Pgp mRNA was found strongly downregulated for all cultured conditions (Table 2; Supplementary Table 2). Meanwhile, we found ≥2-fold increases of several genes that were expressed in noncultured ppMBMECs at levels near cutoff (Abcb1b/MDR1b, Abcc1/MRP1), or below (Abcc3/MRP3). In particular, as opposed to Mdr1a, after culture Mrp1 mRNA increased to very high levels (Table 2; Supplementary Table 3).
Relative expression of Slc family AA transporter genes in MBMECs as determined by microarray
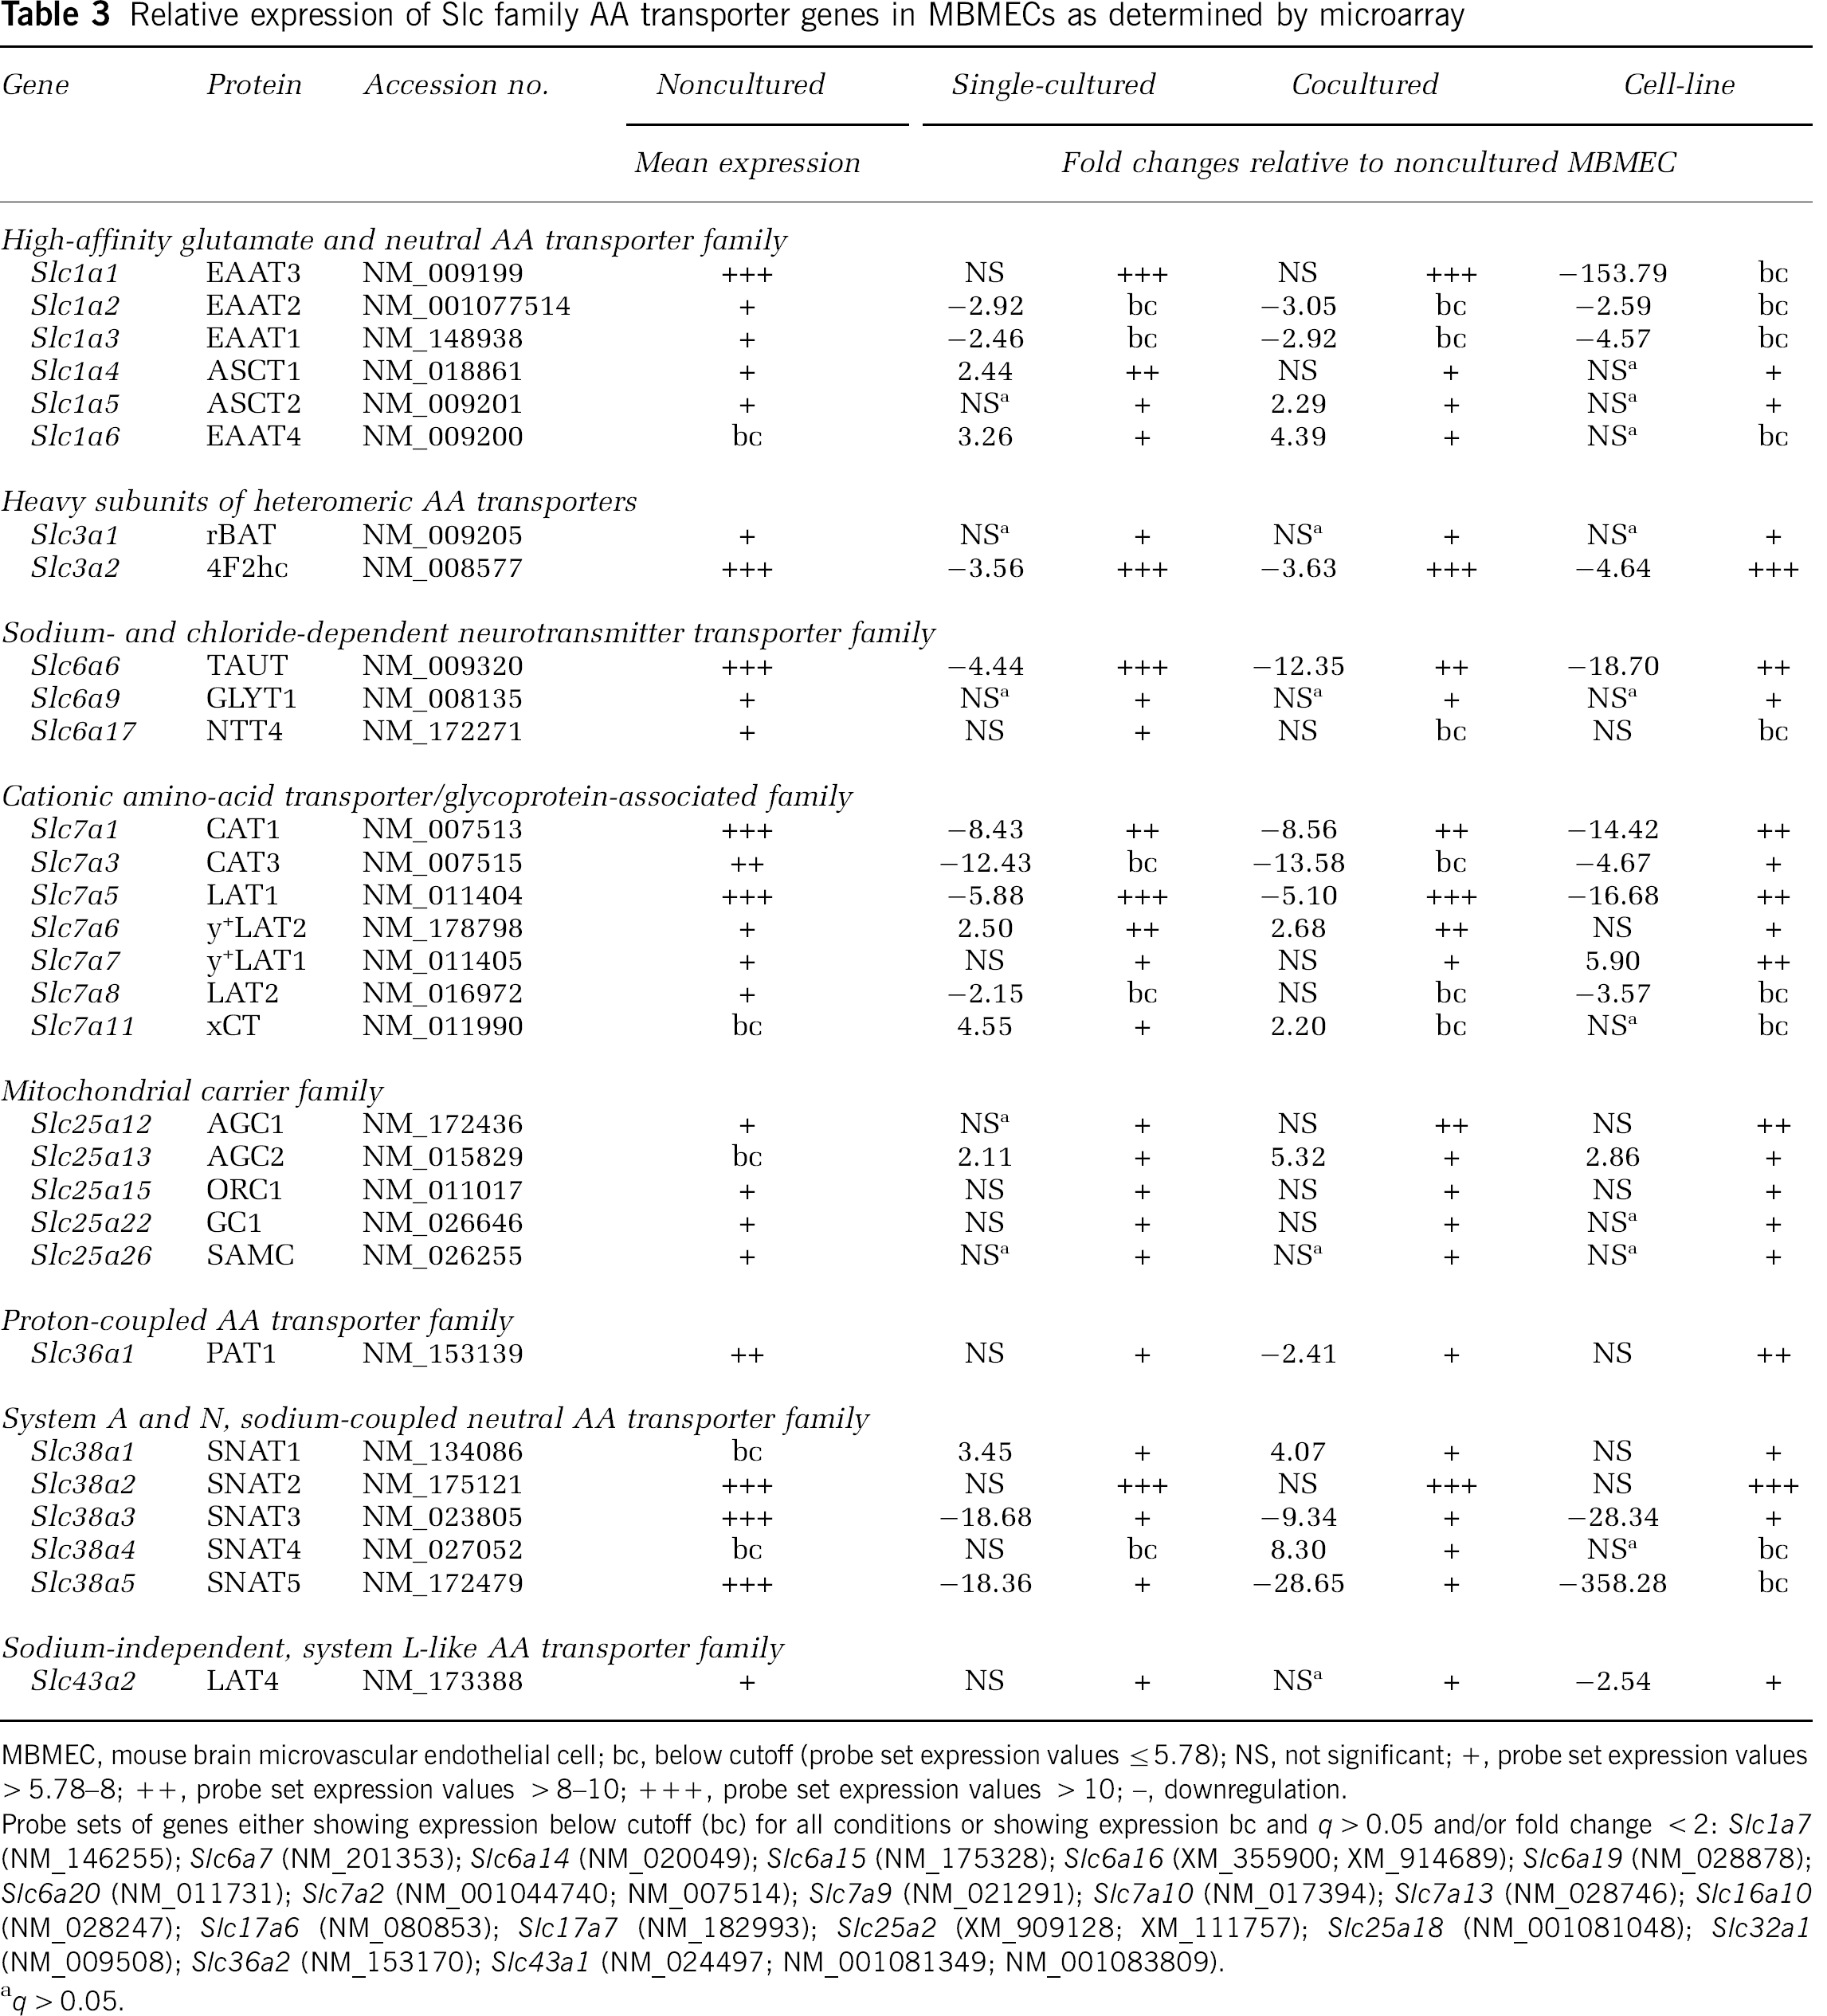
MBMEC, mouse brain microvascular endothelial cell; bc, below cutoff (probe set expression values ≤5.78); NS, not significant; +, probe set expression values ≤5.78–8; + +, probe set expression values >8–10; + + +, probe set expression values > 10; -, downregulation.
Probe sets of genes either showing expression below cutoff (bc) for all conditions or showing expression bc and q > 0.05 and/or fold change < 2: Slc1a7 (NM_146255); Slc6a7 (NM_201353); Slc6a14 (NM_020049); Slc6a15 (NM_175328); Slc6a1 6 (XM_355900; XM_914689); Slc6a19 (NM_028878); Slc6a20 (NM_011731); Slc7a2 (NM_001044740; NM_007514); Slc7a9 (NM_021291); Slc7a10 (NM_017394); Slc7a13 (NM_028746); Slc16a10 (NM_028247); Slc17a6 (NM_080853); Slc17a7 (NM_182993); Slc25a2 (XM_909128; XM_111757); Slc25a18 (NM_001081048); Slc32a1 (NM_009508); Slc36a2 (NM_153170); Slc43a1 (NM_024497; NM_001081349; NM_001083809).
q > 0.05.
AA Transporter Gene Expression Profiles in MBMECs
Including AA transporters, 167 genes belonging to Slc families were expressed above cutoff in one or more MBMEC samples (Table 3; Supplementary Table 2). Consistent with previous reports, Glut1 (Slc2a1), Mct1 (Slc16a1), Mct8/Xpct (Slc16a2), Oatp1a4 (Slco1a4), and Oatp1c1 (Slco1c1) genes were found highly expressed in noncultured ppMBMECs (Enerson and Drewes, 2006; Kamiie et al, 2008; Pardridge, 2005b; Roberts et al, 2008; Shusta et al, 2002). Of these, four (Mct1, Mct8, Oatp1a4, and Oatp1c1) were reduced for all cultured MBMECs. Strikingly, qPCR confirmed that b.End5 Glut1 expression was only ~2% of noncultured ppMBMEC mRNA levels (Table 2; Supplementary Table 3).
Almost half (31 out of 76) of annotated genes for known or putative AA transporters were expressed in one or more MBMEC condition (Table 3). Twenty AA transporters were selected for further testing by qPCR. In noncultured ppMBMECs, 4F2hc was the most prominently expressed mRNA at levels 5- to 10-fold higher than Lat1, Taut, Snat2, Snat5, Eaat3, and Cat1. Next 10- to 20-fold lower were Pat1, Lat4, y+Lat2, and Cat3. Some AA transporter mRNAs (Eaat1, Eaat 2, Eaat 4, y+Lat2, xCT, Snat1, Snat3, Lat3, and Eeg1) were more highly expressed (~2- to 400-fold) in glial cultures than in ppMBMECs (Figure 3; Supplementary Table 3). With a few exceptions, for all cultured MBMECs, 4F2hc, Lat1, Taut, Snat5, Cat1, Cat3, Pat1, Eaat1 (except versus cocultured), and Eaat2 (except versus single-cultured) were significantly (P≤0.05) downregulated compared with the noncultured ppMBMECs (Figures 3 and 4; Supplementary Table 3). Single- and coculture of MBMECs resulted in similar patterns of AA transporter expression; for both, Snat5 showed the greatest down- and Snat1 the highest upregulation. As for TJs and ABC transporters, b.End5 cell-line had a distinct AA transporter mRNA expression pattern. Notably, mRNAs for Eaat1, Eaat2, Eaat3, Eaat4, and Snat5 were below the limit of detection. Snat3 and Lat1 mRNA levels, already strongly decreased in primary cultures, were from 3- to 20-fold lower in b.End5 cell-line samples. Although unlike in primary cultures, Snat1 and y+Lat2 b.End5 expression did not increase above noncultured ppMBMEC levels (Figures 3 and 4; Supplementary Table 3). Taken together the data show that although the cell-line b.End5 gene expression deviated most from that of noncultured ppBMEC transcriptome patterns, even a brief culture step induced significant changes in the expression of many TJ, ABC, AA transporter and other Slc genes.
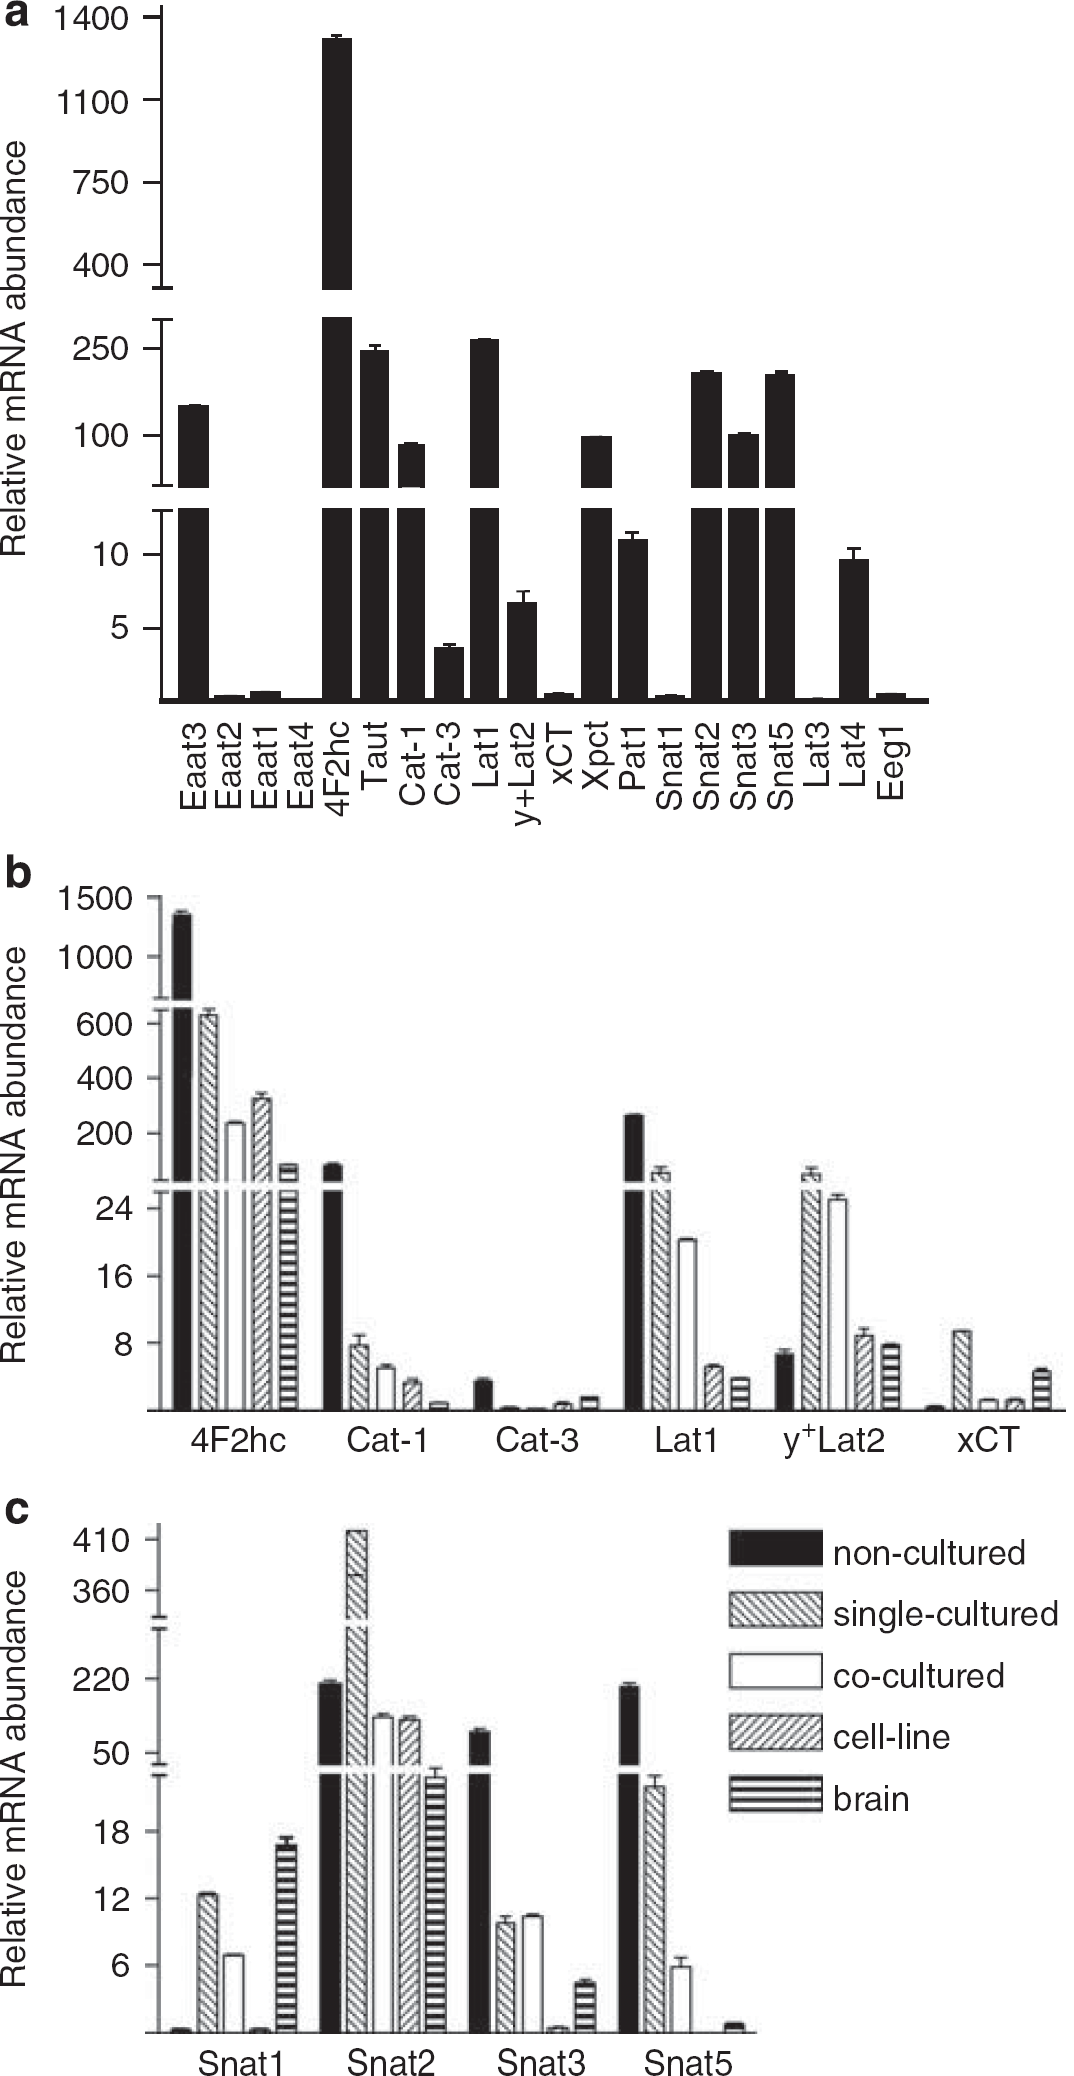
Assessment of AA transporter mRNA expression by qPCR. (
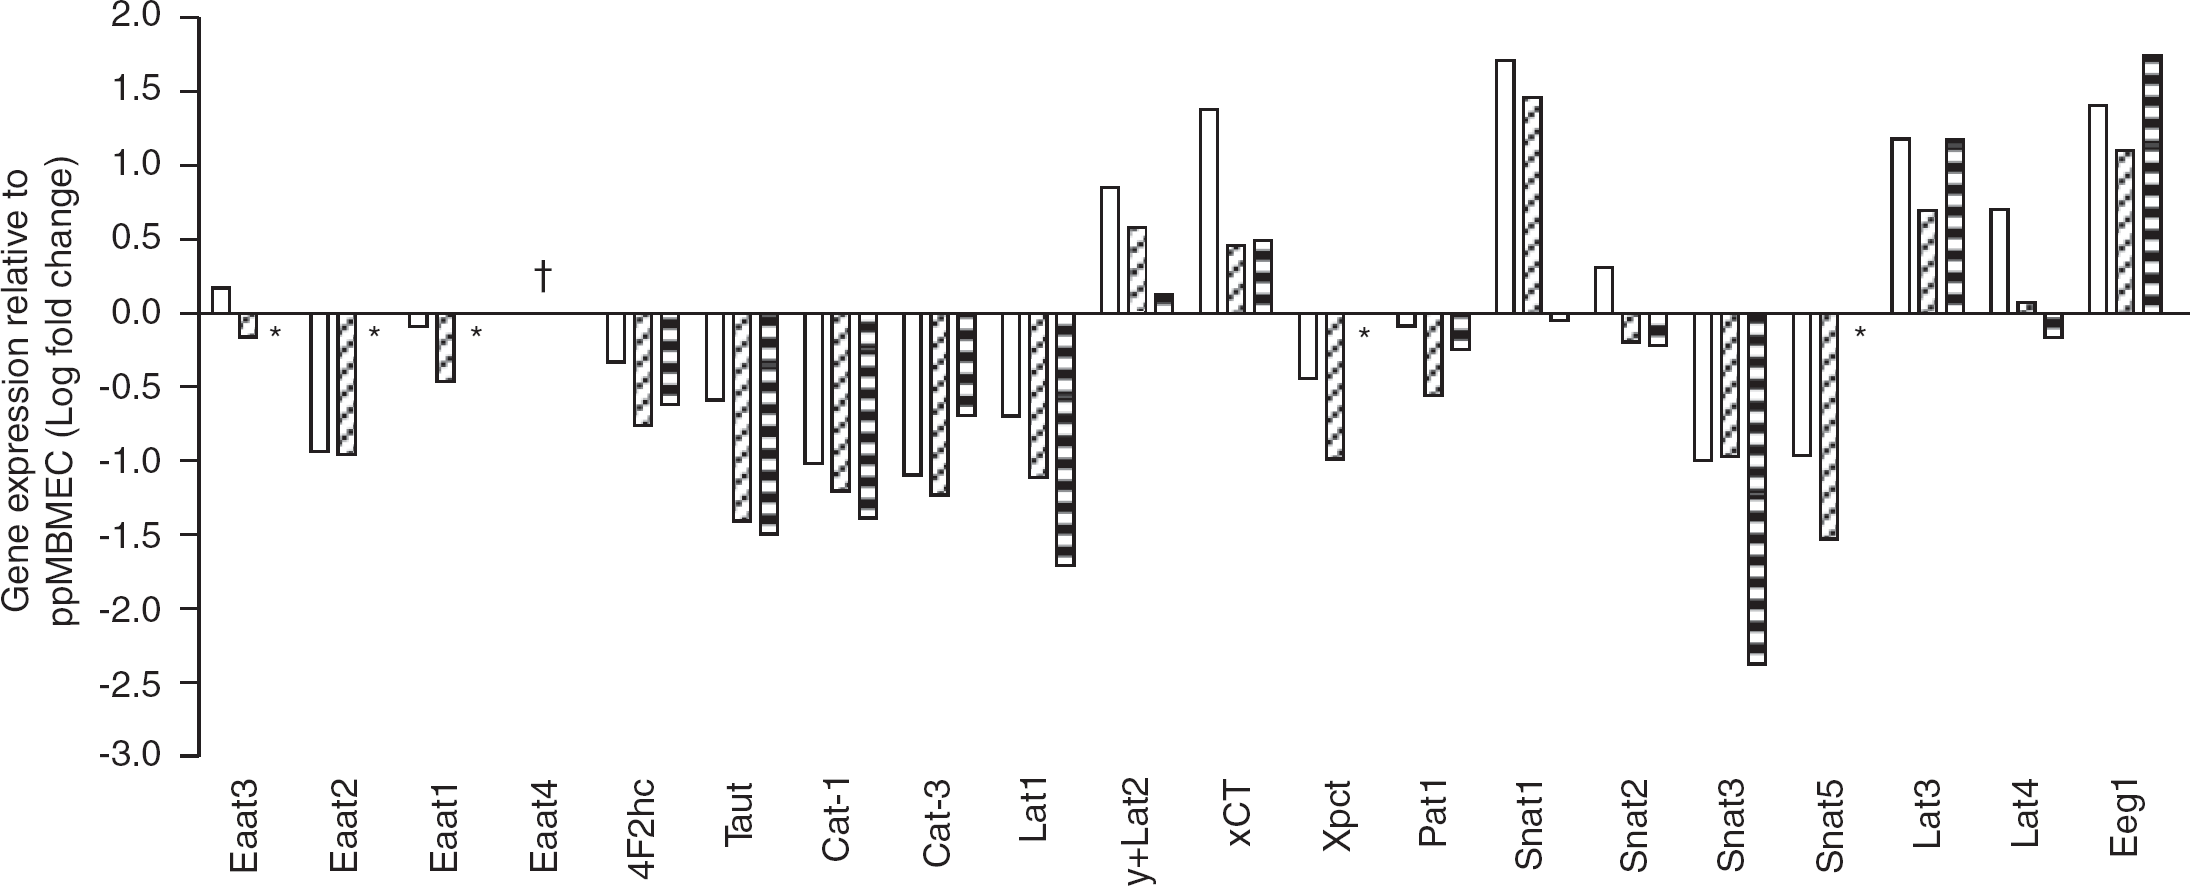
Fold changes in AA transporter genes expression by MBMEC cultures relative to noncultured ppMBMECs. Culture of MBMEC resulted in the downregulation of gene expression for the majority of the AA transporter genes tested. For each AA transporter gene, mRNA levels were measured by TaqMan qPCR relative to 18S rRNA. The fold change in gene expression relative to ppMBMEC by single-cultured (open), cocultured (diagonal hatched lines), and cell-line (horizontal hatched lines) samples was plotted as logio fold change. For ΔCT values refer to Supplementary Table 3. All pair-wise comparisons with ppMBMECs indicated statistically significant (one-way nonparametric analysis of variance followed by Dunnett multiple comparison tests, P≤0.05) differences in AA transporter mRNA expression except: (1) Eaat2, Lat3 in single-cultured; (2) Lat3, Lat4 in cocultured; and (3) Snat1, y+ Lat2 in cell-line. Key: *, not detected in cell-line (b.End5) samples; †, not detected in ppMBMECs. Abbreviations: MBMEC, mouse brain microvascular endothelial cell; ppMBMEC, PECAM1+ MBMEC.
Discussion
Characterizing in vivo BMEC gene expression is one of the first steps in understanding the mechanisms regulating BBB transendothelial transport (Neuwelt et al, 2008). To address this aim, we freshly isolated noncultured PECAM1+ ppMBMECs. Microscopy and qPCR data showed that we effectively prepared nearly pure ppMBMECs yielding high-quality RNA for microarray and qPCR analyses. In addition, we surveyed the impact of culture on the MBMEC transcriptome, finding a large proportion of the total transcriptome to be altered in a similar manner in all culture conditions. Although a main focus of this study was on defining AA transporter mRNA expression, we also investigated several classes of genes whose products serve essential physiologic BMEC functions, namely TJ, ABC, and total Slc family members.
In Vivo Versus In Vitro Expression of TJ and ABC Protein Genes
The in vivo control of transendothelial transport depends critically on BMEC expression of contiguous TJs to prevent the paracellular passage of most solutes. Furthermore, the physiologically tight barrier is rapidly compromised when BMECs from most species are cultured in vitro. Indeed, in vitro cultured BMECs generally show reduced tightness and require specific culture conditions to develop barrier properties. To examine the effect of culture, we surveyed expression of a subset of TJ-associated protein genes. Our microarray results showing high expression of Esam, Ocldn, and Cldn5 and low Cldn1 and Cldn3 levels (Table 2; Supplementary Table 2) in freshly isolated ppMBMECs are in agreement with a recent qPCR study reporting TJ mRNA expression in PECAM1+-isolated MBMEC (Ohtsuki et al, 2008). However, unlike Ohtsuki and co-workers, we detected Cldn12, which is hypothesized to account for the presence of morphologically normal TJs in CLDN5 knockout mice (Nitta et al, 2003), expressed well above cutoff in all MBMECs (Supplementary Table 2).
Overall, single- and cocultured pMBMECs TJ transcript levels were comparable possibly because the coculture was only for a short period and in noncontact mode. In addition, in vitro brain microvascular cultures have also been shown to respond to glial coculture with enhanced tight barrier function without increased TJ protein expression (Hamm et al, 2004). Further, TJs were altered to a greater extent for b.End5 cell-line than for either primary cultured pMBMECs. For example, Ocldn mRNA plummeted ~60-fold to very low levels in b.End5 but was less strongly impacted by primary culture. The function of OCLDN in tight barrier formation is unclear. For example, OCLDN knockout mice have normal TJs (Saitou et al, 2000) whereas in humans decreased OCLDN and CLDN3 levels have been implicated in glioma-induced BBB disruption (Wolburg et al, 2003; Ishihara et al, 2008). In summary, many investigated TJ-associated protein genes were downregulated in culture, consistent with the known reduction of tight BMEC cell—cell contacts in vitro, and possibly, as a consequence of a switch from differentiative to proliferative cellular conditions.
The energy-dependent efflux of many metabolites and drugs by ABC transporters is an essential BMEC physiologic function, which also contributes to the ‘BBB bottleneck’ in CNS drug delivery (Loscher and Potschka, 2005; Pardridge, 2005a). In the current study, 30 genes from the 7 ABC subfamilies were identified by microarray as present above cutoff in one or more MBMEC samples (Supplementary Table 2). The noncultured cohort included 16 out of the 17 genes identified as expressed in rat brain microvessels by serial analysis of gene expression (Enerson and Drewes, 2006). For example, noncultured ppMBMEC expressed Mrp1 mRNA consistent with the reported localization of MRP1 protein to luminal BMEC membranes (Soontornmalai et al, 2006). However, the sterol transporter Abc1, whose product is implicated in BBB regulation of β-amyloid, was among genes expressed above cutoff in noncultured ppMBMECs that was not found by serial analysis of gene expression (Akanuma et al, 2008). As for TJs, the cultured MBMEC (especially b.End5) ABC transporter gene expression profiles deviated from the in vivo transcriptome, particularly for some of the best-characterized members. For example, in b.End5 Pgp/Mdr1a and Mrp4 were reduced whereas Mdr1b and Mrp1 mRNAs were upregulated (Table 2; Supplementary Table 2). Taken together, the data suggest in vitro cell models may not necessarily faithfully replicate BBB in vivo ABC transporter substrate specificity and kinetics.
AA Transporter Expression: Implications for Transcellular Transport Functions
Microarray screening identified 25 AA transporters expressed in noncultured ppMBMECs. However, as AA transporters have various functions for the cells, their involvement in transendothelial transport must be distinguished from, for instance, their functions mainly supporting housekeeping cellular metabolism. Given that in vitro the proliferative cellular functions likely take precedence over differentiative ones (e.g., transendothelial transport), examining culture-induced changes may provide clues as to which transporters are central for each function. In this regard, Calabria and Shusta (2008) hypothesized a general decrease in critical BBB transendothelial vesicular transporter expression as a result of culture. We, too, identified decreasing expressions for particular Slc family members in cultured MBMECs (Figures 3 and 4; Supplementary Tables 2 and 3). For example, Slc22a8/Oct1 and many of the Slc21/Slco family members, a number of which also transport drugs, were found highly expressed in noncultured ppMBMECs and strongly depressed in vitro. In contrast, cultured MBMECs continued to express high mRNA levels for most transporters of essential cellular substrates such as nucleoside sugars (Slc35 family) and zinc (Slc30 family) (Supplementary Table 2).
Consistent with the known function of LAT1-4F2hc in BBB transendothelial transport, for example of radiolabeled AA positron emission tomography tracers (Lahoutte et al, 2004; Makrides et al, 2007), its gene expression was high in noncultured cells and strongly downregulated under all culture conditions. Further, using this logic, we hypothesize other transporters with high mRNA levels in non-cultured ppMBMECs and strongly reduced ones in vitro (CAT1, SNAT2, SNAT3, SNAT5, EAAT3, and TAUT) to mediate together with LAT1-4F2hc the bulk of transendothelial AA transport in vivo (Figures 3 and 4; Supplementary Table 3). Conversely, transporter mRNA upregulation in vitro (y+Lat2, Snat1, Snat2, xCT, Lat4, Lat3, and Eeg1) is postulated to be in response to increased cellular AA demands for growth. One caveat is the likelihood some transporters have dual functions in both transendothelial AA transport and in providing AAs for cellular metabolism. Therefore, transporters such as 4F2hc, LAT1, EAAT3, SNAT2, SNAT5 whose mRNAs remain at high levels as well as those with variably regulated gene expression in culture (EAAT3 and SNAT2) likely contribute to both processes.
A next step required for understanding mechanisms underlying AA transendothelial transport is the localization of transporters to luminal and/or abluminal BMEC membranes. One hypothesis is that the low brain interstitial fluid to plasma AA concentrations are maintained by active AA efflux driven by Na+-dependent transporters whose expression is restricted to abluminal BMEC membranes (O'Kane and Hawkins, 2003). With a more comprehensive picture of the full in vivo AA transporter transcriptome in place this hypothesis can be directly assessed. In this regard, preliminary data indicate the possible localization to luminal BMEC membranes for at least one of the Na+ symporters (data not shown).
Comparison of mRNA profiles of freshly isolated ppMBMECs with that of in vitro cultured ones identified > 5,000 genes changed for all cultured conditions highlighting the large-scale changes in transcription induced by even a short period in culture. Taken together, we propose that culturing BMECs outside their in vivo context results in (1) the development of expression profiles reflecting the new metabolic demands imposed by in vitro culture; and (2) the loss of differentiative cues, which further leads to a rapid downregulation in the cellular expression of gene products involved in many BBB-specific functions. By these criteria, we hypothesize that 4F2hc, LAT1, CAT1, SNAT2, SNAT3, SNAT5, EAAT3, and TAUT may represent main components of the BBB transendothelial AA transport machinery.
Footnotes
Acknowledgements
We thank Marzanna Kuenzli-Gontarczyk, Hubert Rehrauer, Andrea Patrignani, Ulrich Wagner, and Ralph Schlapbach (Functional Genomics Center Zurich) for their support of this project.
The authors declare no conflict of interest.
References
Supplementary Material
Please find the following supplemental material available below.
For Open Access articles published under a Creative Commons License, all supplemental material carries the same license as the article it is associated with.
For non-Open Access articles published, all supplemental material carries a non-exclusive license, and permission requests for re-use of supplemental material or any part of supplemental material shall be sent directly to the copyright owner as specified in the copyright notice associated with the article.