
Abstract
The lumped constant defined as the conversion factor between the net uptake of fluoro-2-deoxy-D-glucose (FDG) and glucose was calculated from global CMRglc and from positron emission tomography (PET) using FDG as tracer (CMRFDG). Fifteen healthy, normal volunteers (mean age 24 ± 4 years) were studied. Global CBF and CMRglc were measured with the Kety-Schmidt technique using 133Xe as tracer, and values were corrected for errors from incomplete diffusion equilibrium for inert gas tracer between brain tissue and cerebral venous blood. Measurements of CMRFDG were obtained with PET using the dynamic and single-scan methods and the K1–k3 model. Measurements with the Kety-Schmidt technique and PET-FDG were performed simultaneously. Global CBF was 47.1 ± 8.0 mL · 100 g−1 · min−1, and CMRglc was 22.8 ± 4.1 μmol · 100 g−1 · min−1. No difference in CMRFDG was found with the two methods (17.8 ± 1.6 and 18.2 ± 1.3 μmol · 100 g−1 · min−1, dynamic and single scan methods, respectively). Accordingly, the lumped constant ranged from 0.80 ± 0.16 to 0.82 ± 0.15, with a mean value of 0.81 ± 0.15. The mean ratio between phosphorylation of FDG and glucose (k3*/k3) was 0.39 ± 0.25. The discrepancy between the lumped constant determined in this study and previously obtained values can be explained partly by methodologic problems, and we conclude that most of the discrepancy results from previous overestimation of global CBF. Key Words: Positron emission tomography—18F-Fluro-deoxy-D-glucose—Lumped constant—Brain glucose metabolism.
Determination of the regional glucose metabolism using positron emission tomography (PET) with 18F-fluoro-deoxy-D-glucose (FDG) as the tracer is one of the most widely used PET methods for quantification of regional brain function in humans (Sokoloff et al., 1977, Reivich et al., 1979, Phelps et al., 1979). Since FDG and glucose differ with regard to transport across the blood–brain barrier and phosphorylation through the initial step in the glycolysis, FDG net uptake (CMRFDG) must be converted into glucose net uptake or CMRglc by the lumped constant (LC) (Sokoloff et al., 1977).
Using the Sokoloff three-compartment model, the LC can be described by the rate constants related to blood–brain barrier transport and phosphorylation of the two hexoses:

where K1 and K1* are unidirectional clearance from blood to brain of glucose and FDG, respectively, k2 and k2* are fractional clearance from brain to blood of glucose and FDG, respectively, and k3 and k3* are fractional phosphorylation coefficients of glucose and FDG by hexokinase through the initial step of glycolysis. The LC can be estimated, provided these parameters are measured or if a constant relation between them is assumed (Kuwabara et al., 1990, Holden et al., 1991). We have previously determined the ratio between unidirectional clearances for FDG and glucose (K1*/K1) in humans and found a mean value of 1.48, irrespective of blood glucose levels (Hasselbalch et al., 1996), but the phosphorylation ratio (k3*/k3) has not been determined in humans, and several assumptions must be made to calculate the LC from parameters obtained in a dynamic PET study (Kuwabara et al., 1990). Thus, although this approach is tempting because it allows for a pixel-by-pixel determination of the LC, it should be further validated by other approaches that are less dependent on the chosen model.
The LC can be determined more simply as the conversion factor between FDG and glucose brain net uptake. The LC has been calculated as the ratio between net extraction fractions of FDG and glucose measured during steady-state arterial concentrations of the two hexoses in rats (Sokoloff et al., 1977) and in humans (Reivich et al., 1985). Although this approach is simple, it requires highly accurate determination of the arteriovenous differences of FDG and glucose. The LC value of 0.52 determined in man by Reivich and coworkers was, as pointed out by the authors themselves, underestimated because of contamination of FDG with labeled mannose. So far, this is the only time that the LC has been measured in humans, and the aim of this study was twofold: 1) calculation of the LC by a global method, and 2) determination of the phosphorylation coefficient from the CMRFDG and global metabolic rate for glucose (CMRglc) values obtained in the current study together with a previously determined ratio of the transport coefficient. We chose to calculate the LC as the difference between CMRFDG and the “true” CMRglc, measured with the Kety-Schmidt technique and arteriovenous differences for glucose ((a – v)glc) (Kety and Schmidt, 1948). Provided reliable values for CMRglc are obtained with this technique, the value of the LC depends solely on the PET-FDG method employed, and we therefore compared CMRglc with CMRFDG estimated by different methods (i.e., dynamic and single-scan methods).
MATERIALS AND METHODS
Fifteen healthy subjects were studied. Informed consent was obtained after written information. The data presented in this report are derived from two separate studies, each of which were approved by the Central Ethical Committee. Data regarding glucose consumption during activation (Madsen et al., 1995) and data concerning the blood–brain barrier transport of FDG and glucose (Hasselbalch et al., 1996) have been published separately. Eight subjects (mean age 24 ± 4 years, five men, three women) were studied with uncovered and closed eyes, ears unplugged, and with moderate noise level. Seven subjects (25 ± 3 years, three men, four women) were studied with eyes covered, in dim light, and a low noise level. All subjects were carefully informed about procedures, and sham blood samples were taken before the measurements to familiarize the subjects to the experimental procedures.
Determination of CMRglc by the Kety-Schmidt technique
Global CBF was measured by the Kety-Schmidt technique (Kety and Schmidt, 1948) in the desaturation mode, using 133Xe as the flow tracer. Cerebral venous blood was sampled from a catheter inserted percutaneously low on the neck into the internal jugular vein. The catheter tip was advanced to the base of the skull, and the correct placement was verified as described elsewhere (Hasselbalch et al., 1994). Arterial blood was sampled from a catheter in the radial artery. Both catheters had the same dead space volume (0.75 mL). Measurements of global CBF were performed as previously described in detail (Madsen et al., 1993). In brief, the brain was saturated by an intravenous infusion of 133Xe dissolved in saline at a constant rate of approximately 15 MBq · min−1 for 30 minutes. A 1.5-mL dead space volume was drawn simultaneously from both catheters, immediately before 1 mL of blood was drawn into preweighed syringes. Blood samples were obtained at exact times, t = −2, −1, 0, 0.5, 1, 2, 3, 4, 6, 8, and 10 minutes, where t = 0 denotes the time when the Xe infusion was terminated and the CBF study was started. Also at time t = 0, the PET-FDG study was started, and the global CBF was thus measured during the first 10 minutes of the PET-FDG study. To avoid loss of 133Xe gas by diffusion, the syringes were reweighed immediately after each run and placed in sealed vials for counting in a well counter (COBRA 5003, Packard Instrument, Downers Grove, IL, U.S.A.). The measured CBF values were corrected for systematic overestimation of flow values caused by incomplete tracer washout at the end of the measuring period (Madsen et al., 1993). From time t = 0 to t = 25 minutes, six to eight paired samples of arterial and jugular venous blood were obtained for determinations of (a – v)glc. Global metabolic rate for glucose was calculated according to Fick's principle: CMRglc = CBF × (a – v)glc.
Determination of CMRFDG
We used the PC4096+ PET camera (General Electric Medical Systems, Milwaukee, WI, U.S.A.), yielding 15 consecutive slices with a slice thickness of 6.7 mm and a spatial resolution in the image plane of 6.7 mm. Slices were placed parallel to the canthomeatal line (which is a line through the lateral canthus of the eye and the external meatus of the ear) with midslice planes from approximately 10 to 103 mm above the canthomeatal line. With this position, only the brain stem and the small top convexity of the brain are not in the field of view. After placement of the subject in the scanner, a transmission scan used for attenuation correction was performed immediately before the activity scan. At time t = 0, 185 to 210 MBq FDG in 10 mL of saline was injected as a bolus over 20 seconds through an antecubital catheter followed by 5 to 10 mL of saline at the same infusion rate. One-milliliter blood samples were drawn simultaneously from the jugular vein and the radial artery at 10-second intervals from t = 0 to t = 3 minutes, at 20-second intervals from 3 to 5 minutes, at 1-minute intervals from 5 to 10 minutes, at 2-minute intervals from 10 to 20 minutes, and at 5-minute intervals for the rest of the scanning period. Dynamic scanning was started at t = 0 with the following scan sequence: 10 6-second scans (0 to 1 minutes), 3 20-second scans (1 to 2 minutes), 8 1-minute scans (2 to 10 minutes), 5 2-minute scans (10 to 20 minutes), 5 5-minute scans (20 to 45 minutes) in eight subjects, and 8 5-minute scans (20 to 60 minutes) in seven subjects. Cross-calibration between scanner and gamma counter was performed every week, and mean values for the period were used. The coefficient of variation of cross-calibration factors in the total period of PET-scanning was less than 4%. Global CMRglc was calculated from PET by two different methods: 1) dynamic method, and 2) single-scan method (autoradiographic method).
Dynamic method. Rate constants were calculated from 15 regions of interest (ROI), with each ROI containing a whole slice, and mean global values were obtained by weighting the 15 ROI with their area: Whole-slice ROI were defined by the 25% of maximal image activity threshold, and ROI were hand drawn accordingly. Correction for CSF space was performed by subtracting 2.5% from this area. This value was chosen because the total CSF volume (subarachnoid space plus ventricles) constitutes 2.5% of the total intracranial volume in a comparable section of the brain in young adults (Schwartz et al., 1985). Rate constants were estimated by a nonlinear least-square fitting procedure of brain and plasma time activity curves. k4* (dephosphorylation of FDG-6-phosphate) was considered negligible during the scanning period and therefore not included in the model. Tracer activity in brain vasculature was subtracted after plasma volume in the brain had been fitted as an additional parameter. The value for CMRFDG was calculated from (Cp/LC) (K1* k3*)/(k2* + k3*), where Cp is plasma glucose concentration, LC is the LC set to 1, and K1*, k2*, and k3* are the fitted rate constants of the deoxyglucose model (Huang et al., 1980).
Single-scan method (autoradiographic method). The CMRFDG was calculated by the single-scan method, as described by Sokoloff et al. (1977) and by Reivich et al. (1979). The last 5-minute scan in the dynamic sequence was used for calculation, that is, in eight subjects the final scans were obtained from 40 to 45 minutes after injection, and in seven subjects from 55 to 60 minutes. Whole-slice ROI (defined as described for the dynamic method) were used. The correction for nonmetabolized FDG in brain and for lag in equilibration of the tissue precursor pool behind the plasma (Sokoloff et al., 1977) were calculated using the rate constants obtained from the same whole-slice ROI as described earlier. Activity in the last scan used for the single-scan method was corrected for remaining tracer activity in the brain vasculature, assuming a mean cerebral blood volume of 3%.
Finally, we compared the dynamic whole-slice approach to a determination of rate constants in gray and white matter (six regions each at midlevel of brain). Mean gray and white matter rate constants were determined from weighted averages in these ROI as described earlier, and, subsequently, global rate constants and global CMRFDG were calculated assuming a 60:40 ratio between gray and white matter.
Calculation of the phosphorylation coefficient
The phosphorylation coefficient was determined from

where K1*, k2*, and k3* are the fitted rate constants of the deoxyglucose model, and K* is the net clearance of FDG equal to (K1* k3*)/(k2* + k3*) (Kuwabara et al., 1990), and

which combined yields
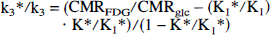
Values for CMRFDG, K*, and K1* were determined from the different PET-FDG methods described earlier, and (K1*/K1) was set to 1.48 (Hasselbalch et al., 1996).
Blood sample analysis
Blood samples for determination of plasma glucose concentrations were drawn into vials containing fluoride–ethylenediamine tetraacetic acid, stored on ice for 5 minutes, centrifuged, and analyzed in duplicate within 15 minutes on a Beckman Glucose Analyzer (Beckman Instruments, Fullerton, CA, U.S.A.). The FDG blood samples were immediately placed on ice and centrifuged, and 500 μL of plasma was taken for gamma counting (COBRA 5003, Packard Instrument, Downers Grove, IL, U.S.A.). The blood samples used in the PET-FDG and CBF measurements contained gamma activity from both 133Xe (decay T2 = 5.25 days) and 18F-FDG (decay T2 = 110 minutes). Energy windows were set around the energy peak of each tracer (133Xe = 70 to 90 keV, 18F = 461 to 561 keV), and spillover correction was applied. By extending the time interval from blood sampling to gamma counting of the blood samples, downspill from the 18F window to the 133Xe window decreased rapidly. The blood samples were counted continuously for the following 12 hours, and the optimal counting time was found to be 8 to 10 hours after injection, where the crosstalk correction from FDG into the 133Xe-window was small and no detectable diffusion of 133Xe from the vials had occurred. Cerebral (a – v)glc was calculated from glucose concentrations in arterial and venous plasma corrected to corresponding whole blood values, as described previously (Madsen et al., 1995).
RESULTS
In the 15 subjects studied, plasma glucose was 5.26 ± 0.61 mmol/L (mean ± SD). Global CBF was 47.1 ± 8.0 mL · 100 g−1 · min−1, (a – v)glc was 0.49 ± 0.06 mmol/L, and the resulting global CMRglc was 22.8 ± 4.1 μmol · 100 g−1 · min−1.
The FDG rate constants obtained with PET from whole-slice ROI are listed in Table 1 together with the resulting global net clearance (K*) and CMRFDG. The CMRFDG calculated from gray and white matter differed significantly from CMRFDG calculated from whole-slice ROI (16.5 ± 1.4 versus 17.8 ± 1.6, P < 0.0001).
Rate constants and CMRFDG determined from dynamic PET-FDG in 15 healthy subjects in a resting condition
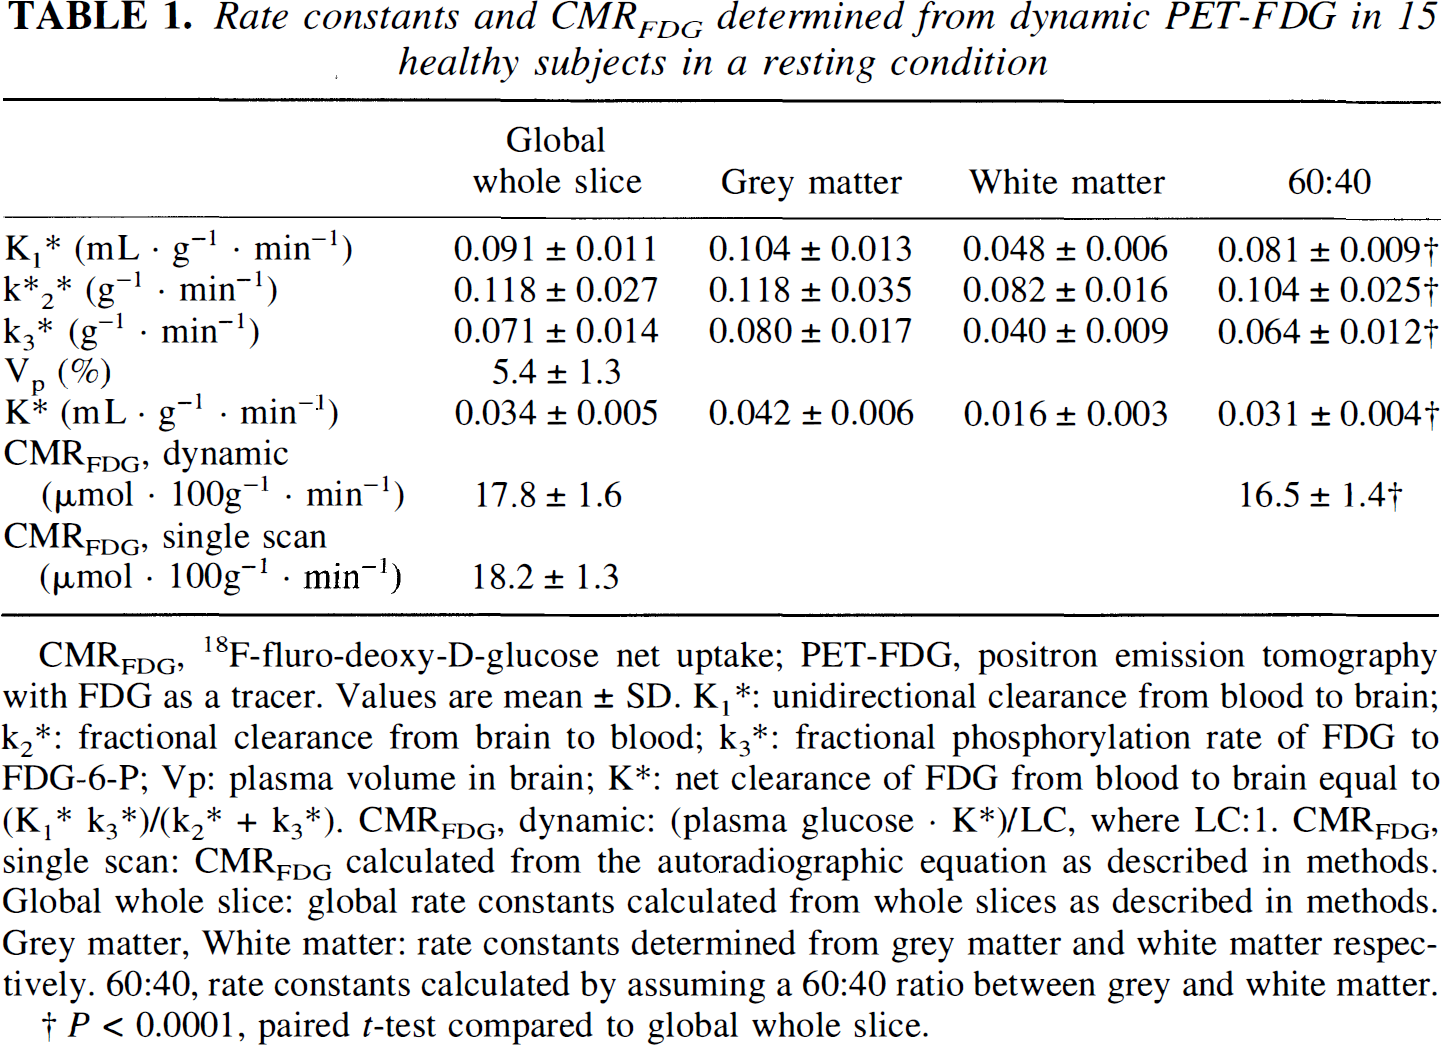
CMRFDG, 18F-fluro-deoxy-D-glucose net uptake; PET-FDG, positron emission tomography with FDG as a tracer. Values are mean ± SD. K1*: unidirectional clearance from blood to brain; k2*: fractional clearance from brain to blood; k3*: fractional phosphorylation rate of FDG to FDG-6-P; Vp: plasma volume in brain; K*: net clearance of FDG from blood to brain equal to (K1* k3*)/(k2* + k3*). CMRFDG, dynamic: (plasma glucose · K*)/LC, where LC:1. CMRFDG, single scan: CMRFDG calculated from the autoradiographic equation as described in methods. Global whole slice: global rate constants calculated from whole slices as described in methods. Grey matter, White matter: rate constants determined from grey matter and white matter respectively. 60:40, rate constants calculated by assuming a 60:40 ratio between grey and white matter.
P < 0.0001, paired t-test compared to global whole slice.
The LC calculated as the ratio between CMRFDG and CMRglc ranged from 0.81 to 0.82, depending on the applied PET method (Table 2). Since there was no significant difference between the two PET methods used, mean values also are listed. The mean phosphorylation ratio calculated from equation 4 was 0.39 ± 0.25 (Table 2). It was thus possible to calculate LC from equation 2 using constant values for K1*/K1 (1.48, Hasselbalch et al., 1996) and k3*/k3 (0.39, the current study), and obtain an average value for CMRglc almost identical to that obtained from Fick's principle (22.8 ± 4.1 versus 22.4 ± 1.5) (Table 2). The CMRglc calculated by this method differs substantially from CMRglc calculated by using a fixed LC value of 0.52 (Reivich et al., 1985) (22.4 ± 1.5 versus 35.0 ± 2.5, P < 0.00001).
Global metabolic rate of FDG and lumped constant in 15 healthy subjects in a resting condition
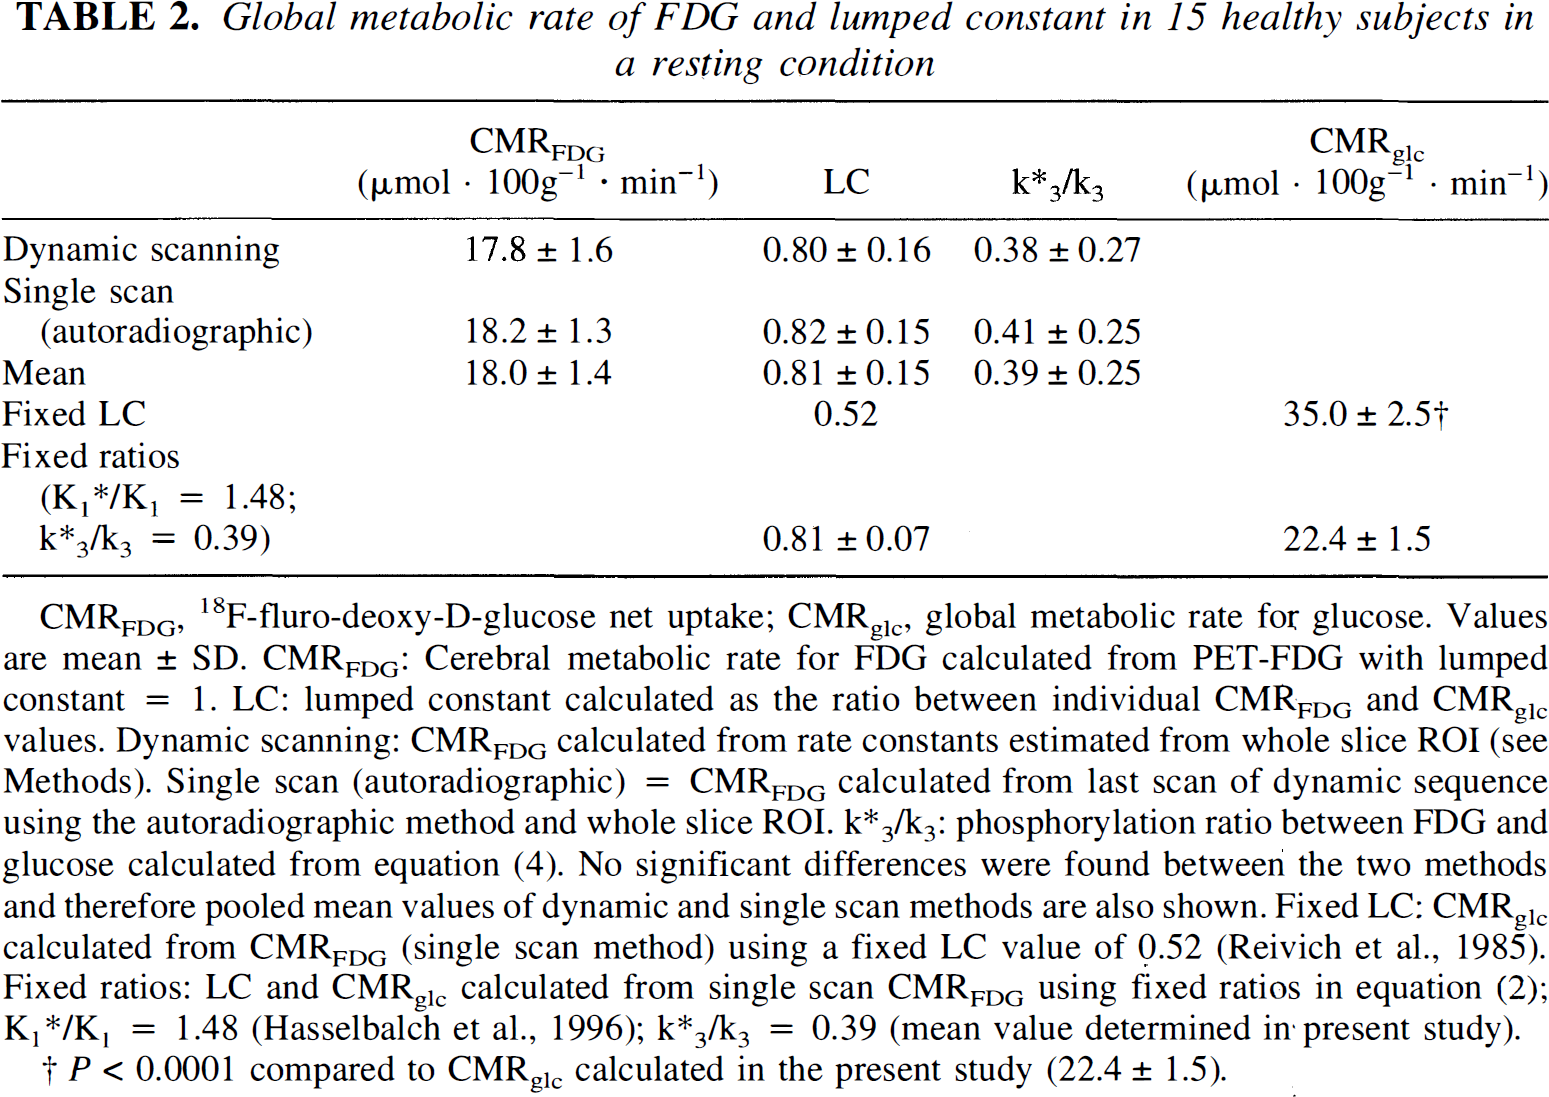
CMRFDG, 18F-fluro-deoxy-D-glucose net uptake; CMRglc, global metabolic rate for glucose. Values are mean ± SD. CMRFDG: Cerebral metabolic rate for FDG calculated from PET-FDG with lumped constant = 1. LC: lumped constant calculated as the ratio between individual CMRFDG and CMRglc values. Dynamic scanning: CMRFDG calculated from rate constants estimated from whole slice ROI (see Methods). Single scan (autoradiographic) = CMRFDG calculated from last scan of dynamic sequence using the autoradiographic method and whole slice ROI. k*3/k3: phosphorylation ratio between FDG and glucose calculated from equation (4). No significant differences were found between the two methods and therefore pooled mean values of dynamic and single scan methods are also shown. Fixed LC: CMRglc calculated from CMRFDG (single scan method) using a fixed LC value of 0.52 (Reivich et al., 1985). Fixed ratios: LC and CMRglc calculated from single scan CMRFDG using fixed ratios in equation (2); K1*/K1 = 1.48 (Hasselbalch et al., 1996); k*3/k3 = 0.39 (mean value determined in·present study).
P < 0.0001 compared to CMRglc calculated in the present study (22.4 ± 1.5).
DISCUSSION
Methodologic considerations
Determination of the LC from measurements of CMRglc performed simultaneously with the Kety-Schmidt technique and the PET-FDG technique is a straightforward procedure. The two methods do, however, differ with respect to the following: (1) the period of measurement, and (2) brain regions included in the global average measure for CMRglc are not necessarily completely identical with the two methodologies.
The Kety-Schmidt technique measures CBF over a time period of 10 minutes, whereas it takes 45 to 60 minutes to complete a study with the PET-FDG technique. However, the entire study was performed during conditions in which external stimuli were minimized. The entrapment of FDG in the brain is a function of the plasma activity that decreases with time, which diminish the effective time window of the PET-FDG scanning. It is therefore reasonable to assume that no significant changes in the rate of cerebral FDG uptake occurred during the PET study, or if changes occurred after termination of the Kety-Schmidt measurement, that they would not have caused any significant change in the calculated CMRFDG. Methodologic considerations regarding brain areas included in the global average values obtained with the Kety-Schmidt technique have been discussed in detail previously, and here it suffices to conclude that extracerebral contamination of internal jugular blood is small and that unilateral cerebral blood flow measured from one internal jugular vein represent global cerebral blood flow (Shenkin et al., 1948; Lassen, 1959; Madsen et al., 1993). However, one point needs further comments. In our setup with numerous blood samples, dead space in both the arterial and venous catheters was minimized (0.75 mL) to keep the total sampled blood volume as low as possible. Before each sample, 1.5 mL blood was drawn, but this volume may not have been be sufficient to completely flush the catheter from residual blood containing a higher concentration of 133Xe during the clearance of the tracer. This potential error affects both arterial and venous samples, thus diminishing the resulting error in estimation of CBF. The effect on CBF was calculated from two Kety-Schmidt experiments, one with high and one with low flow (59.5 and 37.1 mL, respectively). A contamination of 10%, 25%, and 50% blood from the previous sample resulted in an underestimation of CBF of 2%, 5%, and 10%, respectively, in both the high and low CBF example. It is unlikely that this contamination of 133Xe from the previous sample should lead to an underestimation of CBF by more than a small percentage because several blood samples for arteriovenous differences for FDG, glucose, lactate, and oxygen were obtained between each 133Xe sample, increasing the flushing volume to five to six times the dead space volume. We conclude that this possible error explains only a small part of the discrepancy between our CBF values and those previously reported (Scheinberg and Stead, 1949; Novack et al., 1953; Gottstein et al., 1963; Cohen et al., 1967; Takeshita et al., 1974).
The PET scanner used in the current study had an axial field of view of 10 cm, and only a small part of the brain was outside the field of view. Assuming that mean CMRFDG was the same outside as inside the field of view, the measured value is representative of the global value.
Almost identical values for CMRFDG were obtained with the whole-slice approach, regardless of the method used (dynamic or single scan). When global rate constants were determined from gray and white matter, a significant underestimation of CMRFDG was found (Table 1). This underestimation is most likely caused by inclusion of white matter in the gray matter ROI because of the limited spatial resolution of the PET-scanner. The single-scan method is not affected to the same degree by errors in rate constants (Sokoloff et al., 1977). Therefore the single-scan method may be more robust (coefficient of variation 7% compared with 9% for the dynamic methods), and for further analysis, we only looked at the single-scan method and the dynamic whole-slice method, which yielded almost identical results.
Absolute values for CMRFDG and CMRglc
The LC value obtained in the current study from simultaneous measurements of CMRFDG and CMRglc was higher than the previously calculated values of 0.42 to 0.60 (Phelps et al., 1979, Reivich et al., 1985, Brooks et al., 1987; Kuwabara et al., 1990). Differences in global FDG net clearance (K*) or CMRFDG only partly explain this difference. Brooks and coworkers obtained a CMRFDG value of 15.0 μmol · 100 g−1 · min−1 compared with 18.1 μmol · 100 g−1 · min−1 in the current study, whereas Reivich and coworkers obtained a global K* close to ours (0.30, calculated from mean gray and white matter rate constants assuming a 60:40 ratio between gray and white matter). Therefore, we cannot explain the large LC discrepancy by differences in CMRFDG. However, the higher LC value may derive from the use of different global average values for CMRglc applied in the calculation of the LC: the CMRglc value of 23 μmol · 100 g−1 · min−1 used in the current study is considerably lower than the value of 30 μmol · 100 g−1 · min−1, which has been used a standard global value for CMRglc, either for direct calculation of LC (Phelps et al., 1979; Brooks et al., 1987; Kuwabara et al., 1990) or for validation of obtained values for LC (Reivich et al., 1985). The global CMRglc value of 30 μmol · 100 g−1 · min−1 derived from previous studies using Fick's principle where global CBF was measured with the Kety-Schmidt technique, and subsequently multiplied with cerebral arteriovenous differences for glucose (Scheinberg and Stead, 1949; Novack et al., 1953; Gottstein et al., 1963; Cohen et al., 1967; Takeshita et al., 1974). However, despite the solid theoretical foundation of the Kety-Schmidt technique, the mean global CBF value of 53 mL · 100 g−1 · min−1 derived from these studies probably represents an overestimation of the true global CBF value (Lassen, 1959; Madsen et al., 1993). In the application of the Kety-Schmidt technique, diffusion equilibrium for inert gas tracer between the brain and cerebral venous blood is not reached. Only one of the five studies corrected for this nonequilibrium (Cohen et al., 1967), and as a consequence, the global values for CBF and CMRglc in the remaining four studies lead to an overestimation of the mean global value derived from these five studies (Scheinberg and Stead, 1949; Novack et al., 1953; Gottstein et al., 1963; Cohen et al., 1967; Takeshita et al., 1974). Several approaches to correct for this systematic overestimation have been developed (Lassen and Lane, 1961; Madsen et al., 1993). When values obtained with the Kety-Schmidt technique are corrected for errors caused by incomplete tracer equilibrium, CBF and CMRglc are 45 mL · 100 g−1 · min−1 and 25 μmol · 100 g−1 · min−1, respectively (Lassen and Lane, 1961; Cohen et al., 1967; Madsen et al., 1993). The CMRglc value that was obtained in the current study was close to the CMRglc values obtained in these studies. It is also similar to the CMRglc value obtained with 11C-labeled glucose by Blomqvist and others (1990). In conclusion, in calculations of the LC (Phelps et al., 1979; Brooks et al., 1987; Kuwabara et al., 1990), the applied value for CMRglc has probably been higher than the true CMRglc value, and consequently, the LC value would be underestimated, and this may account for most of the difference between the LC value in the current study and previously calculated LC values of 0.42 to 0.60 (Phelps et al., 1979; Brooks et al., 1987; Kuwabara et al., 1990).
In only one study, direct measurement of the LC has been attempted (Reivich et al., 1985). Reivich and colleagues calculated the LC as the ratio between net extraction fractions of FDG and glucose measured during steady-state arterial concentrations of the two hexoses. The LC value of 0.52 from this study is considerably lower than the current value. Part of this difference can be explained by a 15% to 20% impurity in the FDG used by Reivich and coworkers. This was calculated by the authors to represent a 12% to 16% underestimation of their LC, and, corrected for this impurity, the LC value should be 0.59 to 0.62. The purity of the FDG used in the current study was in the range of 95% to 99%, but impurity of FDG cannot account for the entire difference between the study of Reivich and colleagues (1985) and the current study. The most critical assumption of the method used by Reivich and coworkers states that no significant dephosphorylation of FDG occurs during the experiment (k4* = 0), but the effect of k4* on the calculation of LC by this method has not been validated. If dephosphorylation occurs, the net extraction fraction of FDG continues to decrease with time, and the method will underestimate LC. Both studies rely on accurate determinations of arteriovenous differences of glucose (and FDG in the study by Reivich and coworkers), but in the latter study, the extraction fractions for glucose and FDG with time are plotted and used for fitting an asymptotic value equal to LC. Variation in these extraction fractions therefore significantly affects the LC calculation, whereas in the current study, the arteriovenous differences for glucose are mean values obtained from six to eight samples, which tends to increase the accuracy. Other methodologic problems may explain the discrepancy, and further studies are needed to clarify this issue. However, both studies (Reivich et al., 1985; the current study) indicate that the LC is higher than 0.52. This is consistent with the observation by Frackowiak and others (1988), who calculated the LC from cerebral oxygen metabolism by assuming a molar ratio between oxygen and glucose metabolism of 5.6 (Lassen, 1959), and arrived at a LC value of 0.75. Crane and coworkers (1983) measured the FDG LC by the brain uptake index method in the pentobarbital-anesthetized rat and compared the observed value with a value predicted from measured kinetics of transport and metabolism of FDG and glucose. Although pentobarbital anesthesia affects the absolute values for transport and phosphorylation of FDG and glucose, it is unlikely that the transport and phosphorylation ratios are affected. The transport coefficient obtained by Crane and colleagues (FGD/glucose = 1.67 ± 0.07) was similar to that obtained in nonsedated healthy volunteers (1.48 ± 0.22, Hasselbalch et al., 1996), which speaks against a significant effect of pentobarbital on the transport ratio. The observed and predicted FDG LC values in the study of Crane and coworkers (1983) were 0.77 and 0.85, and thus in the same order of magnitude as the value obtained in the current study. In conclusion, the discrepancy between the LC determined in this study and previously obtained values can be partly explained by methodologic problems, and it is concluded that most of the discrepancy results from previous overestimation of global CBF, and subsequently, global CMRglc.
Kuwabara and associates (1990) and Holden and others (1991) have proposed that the LC can be determined regionally from dynamic PET data, assuming that the FDG/glucose blood–brain barrier transport ratio (K1*/K1) as well as the phosphorylation ratio (k3*/k3) are known and constant. In our study, we found a mean k3*/k3 ratio of 0.39. Although the SD was relatively large, the value is in the same order of magnitude as the previously reported value in rat brain of 0.55 (Crane et al., 1983). Equation 2, with fixed ratios of 1.48 (Hasselbalch et al., 1996) and 0.39 for K1*/K1 and k3*/k3, respectively, may generate reliable CMRglc values from PET-FDG as shown in the current study, but the exact value of the phosphorylation coefficient should be corroborated by future experiments, thus further validating the kinetic approach. Also notice that the method applies only to normal brain tissue because the phosphorylation coefficient has been shown to vary considerably between normal and pathologic brain tissue (Kapoor et al., 1989).