
Abstract
To determine the effect of insulin on regional cerebral blood flow (rCBF) and glucose metabolism (CMRglu), we performed quantitative dynamic PET scanning of labeled water (H215O) and deoxyglucose (18FDG) using two protocols in 10 diabetic men. In protocol A, to test reproducibility of the technique, insulin was infused at 1.5 mU·kg−1·min−1 twice (n = 5). In protocol B, low (0.3 mU·kg−1·min−1) and high (3 mU·kg−1·min−1) dose insulin was given on separate occasions (n = 5). Euglycemia (5 mmol/L) was maintained by glucose infusion. In protocol A, CMRglu was 6% higher during the first infusion, and catecholamines were also increased, indicating stress. Blood flow was not different. Changing free insulin levels from 20.5 ± 4.8 to 191 ± 44.5 mU/L (P < 0.001, low versus high dose, protocol B) did not alter total or regional CMRglu (whole brain 36.6 ± 4.0 versus 32.8 ± 6.2 μmol·100 g−1·min−1, P = 0.32) or CBF (41.7 ± 5.1 and 45.6 ± 9.7 mL·100 g−1·min−1, P = 0.4) or rCBF. In cerebellum, CMRglu was lower than in cortex and the ratio between rate constants for glucose uptake and phosphorylation (K1 and k3) was reversed. There are regional differences in cerebral metabolic capacity that may explain why cerebral cortex is more sensitive to hypoglycemia than cerebellum. Brain glucose metabolism is not sensitive to insulin concentration within the physiologic range. This suggests that intracerebral insulin receptors have a different role from those in the periphery.
Keywords
In many tissues of the body (and in particular in fat and muscle), insulin stimulates glucose uptake and phosphorylation. However the role of insulin in the metabolic processes of the brain remains unclear. Despite the presence of receptors for both insulin and insulin-like growth factor (IGF1) and their respective mRNAs (Kotzke et al., 1995; Kenner et al., 1995; Sable and Yeh, 1995), many studies have suggested insulin does not affect rates of cerebral glucose utilization or cerebral function. This view has been reinforced by recent data, using arteriovenous difference techniques to measure cerebral glucose uptake in vivo in man (Robinson et al., 1994). However, there are contrary data. Animal studies, often with insulin administered directly into the brain or ventricular system, have demonstrated effects of insulin on brain glucose metabolism (Grunstein et al., 1985; Steffens et al., 1988; Lucignani et al., 1987) and feeding behavior (Schwartz et al., 1992; Florant et al., 1991), and recent evidence from studies of hypoglycemia in human subjects have suggested that insulin may influence brain function (Kern et al., 1990, 1994a, 1994b). Most of the work seeking an effect of insulin directly on cerebral glucose metabolism, especially that done in man, has measured total brain glucose metabolism. Yet there is evidence for regional differences in the brain's metabolic capacity (Lucignani et al., 1987). There are also regional differences in the accessibility of neuronal tissue to circulating substances and in the density of insulin receptors expressed (Grunstein et al., 1985; Steffens et al., 1988). Thus it may be more relevant to examine the effects of insulin on cerebral metabolism regionally.
The question of insulin's effects on cerebral glucose metabolism and the possibility of regional differences within the brain is important both clinically and in the understanding of clinical research. In patients with diabetes mellitus, peripheral insulin levels fluctuate widely in response to their therapy. An effect of insulin on cerebral metabolism could then have clinical consequences. A syndrome of altered responses to hypoglycemia is recognized as a serious problem in the long-term management of insulin-dependent diabetes mellitus (IDDM) (Amiel et al., 1987, Rattarasarn et al., 1994). In this syndrome, the onset of symptomatic and protective responses to a falling blood glucose are delayed, occurring at a lower plasma glucose level than impairment of at least some cognitive functions (Maran et al., 1995). Regional differences in the metabolic capacity of the brain may underlie this phenomenon, and potential regional differences in insulin sensitivity of glucose metabolism could contribute to the effects of diabetes and its therapy on brain function during episodes of acute hypoglycemia. Furthermore, if circulating insulin levels affect cerebral function during hypoglycemia, as suggested by Kern and colleagues (1990, 1994a, 1994b), then there is a theoretical risk that the production of high peripheral insulin levels in the management of diabetes may affect cerebral function acutely during euglycemia and potentially in the long term also. A recent study in dogs has demonstrated that raising insulin levels in the cerebral circulation during hypoglycemia dramatically enhances counterregulatory responses (Davis et al., 1995), confirming earlier work comparing different degrees of hyperinsulinemia during matched hypoglycemia from the same group (Davis et al., 1992) with hypoglycemia in normal man, but these data are controversial (Kerr et al., 1991; Diamond et al., 1991; Mellman et al., 1992; Lui et al., 1991). Despite this controversy, most studies of the cognitive and other neurogenic responses to hypoglycemia use hyperinsulinemic hypoglycemic challenges, making an understanding of the role of insulin on regional cerebral glucose metabolism important in their interpretation.
Positron emission tomography (PET) creates images of radioisotopes collected in tissues. After injection of radiolabeled fluorodeoxyglucose (18FDG, a glucose tracer that is taken up and phosphorylated by the same pathways as glucose but which then remains in the phosphorylated state within the cell), both the disappearance of the label from arterial blood and its accumulation in brain tissue are measured by PET. From these data, estimates of rates of glucose uptake and metabolism can be made in different brain regions in human subjects in vivo (Huang et al., 1980). Using labeled water, PET scanning can also be used to provide quantitative information on regional cerebral blood flow (Raichle et al., 1983). For reasons that are not absolutely clear but which have been ascribed to subject unfamiliarity with the procedure, first scans tend to give slightly higher estimates of cerebral glucose metabolism than subsequent scans (Stapleton et al., 1997). The present study was therefore designed to investigate further the reproducibility of the techniques and the regional variations in cerebral blood flow and glucose metabolism in subjects with IDDM at euglycemia and to examine the effects of hyperinsulinemia on these measurements.
MATERIALS AND METHODS
Ten male subjects were recruited, five for each of two studies. These numbers of subjects were estimated to give 80% power (90% confidence) of detecting a 20% change in either blood flow or glucose uptake regionally within the brain, based on published regional estimates (∼10% variability) of these parameters (Bartlett et al., 1988). All subjects had insulin-dependent (Type 1) diabetes mellitus and were C-peptide negative on fasting and postprandial measurements. Subjects for protocol A (reproducibility study) were a mean age of 40.0 ± 13.3 years (mean ± SD), with a mean body mass index of 24.35 ± 3.08 kg/m2, and had a disease duration of 21.0 ± 6.4 years. One had background (simple) retinopathy and one had early peripheral neuropathy. For protocol B (effect of insulin), subjects were a mean age of 41.0 ± 7.9 years, a mean body mass index of 24.66 ± 1.68 kg/m2, with a disease duration of 24.8 ± 2.2 years, and one had background retinopathy. No subject had either persistent microalbuminuria nor an elevated plasma creatinine concentration. Measurements of regional cerebral blood flow and glucose metabolism were made by positron emission tomography (PET) scanning in each subject on two occasions, not less than 3 and not more than 6 weeks apart in two separate studies. For each subject, glycemic control was stable throughout the duration of the study. None had a recent history of hypoglycemia and none had a blood glucose recording less than 3.5 mmol/L on 4- to 7-point daily blood glucose monitoring profiles for the 72 hours before scanning. Magnetic resonance imaging (MRI) scans for anatomic detail were made on separate occasions, once in each subject. The study was approved by the ethics committees of the Guy's and St. Thomas' NHS Trust, and no adverse event was recorded in any individual undergoing the protocol. All subjects gave written informed consent.
Scanning protocol
Positron emission tomography scans were performed at the Clinical PET Centre, UMDS, St. Thomas' Hospital, London, England, using an ECAT 951R (Siemens/CTI, Knoxville, TN, U.S.A.) PET scanner. The scanner has an axial field of view of 10.8 cm, and 31 contiguous 3-mm-thick slices are acquired. The scanner has a spatial resolution of 6.2 mm transaxially and 4.5 mm axially. Smoothing of all images after reconstruction results in a spatial resolution of 8.5 mm both transaxially and axially.
Subjects were admitted to the Diabetes Day Centre the night before each PET scan and fasted from 10
At time t = 90 minutes (when glucose kinetics are approximating steady-state under clamp conditions), a dynamic 18FDG scan was performed to trace glucose entry and early metabolism by intravenously injecting 185 MBq activity in 5 mL for 30 seconds. Dynamic scanning of 23 frames of variable duration (6 at 30 seconds, 7 at 60 seconds, and 10 at 300 seconds) was begun 10 seconds before the injection of tracer and continued for 60 minutes. Arterial plasma glucose was maintained at 5 mmol/L and continuous on-line monitoring of label in arterial blood was performed as during the H215O scan but with a lower flow rate (2 mL/min) after the first 15 minutes of scanning. Timed 2-mL hand-drawn arterial blood samples were taken at 5-minute intervals, 1 mL for cross-calibration of the fluid analyzer data with a well counter, which is daily calibrated to the PET scanner, and 1 mL for the plasma glucose measurements used to control the glucose infusion rate. Samples for well counting were held on ice and subsequently centrifuged to separate the plasma fraction from whole blood, then accurately weighed for weight correction of counts. Additional arterial blood samples for later measurement of free insulin were collected at clamp time 0, and 0, 30, and 60 minutes into the 18FDG scan, and for counterregulatory hormones at study times 60, 90, 120, and 150 minutes.
At the end of the 18FDG scan, the insulin infusion was discontinued, the arterial line removed, and the patient given a subcutaneous dose of soluble insulin followed by a meal. The glucose infusion was discontinued once plasma glucose was consistently greater than 5.5 mmol/L. Monitoring continued until this glucose level was maintained without glucose infusion. The intravenous line was then withdrawn.
Before conducting second scans, the previous arterial cannulation site was inspected and the hand was reexamined for collateral circulation. Second scans were performed at the same time of day and under similar clamping conditions as the first.
Two to six weeks after the second PET scanning session, each subject underwent high-definition (256 × 256 pixels per plane) MRI brain-scanning (120 contiguous 1.2-mm slices Tl-weighted, collected on an angiographic protocol to maximize the gray to white matter contrast in these very thin slices, Phillips Gyroscan, Phillips, Hammersmith, England) for later coregistration of the PET images.
Protocol A: Reproducibility and regional variation of cerebral blood flow and glucose metabolism in insulin-dependent diabetic men
The study protocol was as described above. Each subject was studied with PET twice, 3 to 4 weeks apart. On each occasion, the insulin infusion dose was the same, 1.5 mU·kg−1·min−1.
Protocol B: Effect of insulin on regional cerebral blood flow and glucose metabolism in insulin-dependent diabetic men
The admission and overnight glycemic control periods were conducted exactly as in protocol A. Cannulation and scanning procedures were also identical. The only significant difference from protocol A was in the insulin infusion doses used during the two PET scans. In protocol B, different doses were used for the two scans. In random order, either 0.3 mU·kg−1·min−1 (low dose) followed at the second visit by 3.0 mU·kg−1·min−1 (high dose) or 3.0 mU·kg−1·min−1 (high dose) followed by 0.3 mU·kg−1·min−1 (low dose) was used, with the subject unaware of the infusion dosage.
Measurements and calculations
After collection and archiving of the data, the dynamic PET scans were registered into the same volumetric orientation as the MRI scan using a multiresolution voxel similarity approach with automated iterative processing, followed by visual corroboration of the resulting registration (Studholme et al., 1997). This process was performed initially on a time-summed static PET image, and the transformation then applied to each dynamic frame; in the case of movement during the scan (monitored and noted with reference to the laser grid), individual frames could be registered (although this was in fact only necessary for one frame in the entire study). An anatomic template of predefined regions of interest (ROI) was adapted to the individual anatomy of each subject on his MRI scan. The focus of the ROI in this study was the cortical gray matter over many different anatomic areas. Regions were placed and labeled in 28 separate cortical gyri on individual MRI planes, and regions appearing on more than one MRI plane were summed across those planes to create volumetric ROI (VOI) for that gyrus or structure. In addition to the cortical VOI, regions were defined in cerebellar gray matter, thalami, hippocampi, caudate, brainstem, and the area of the hypothalamus. The PET data coregistered in the VOI were analyzed.
The arterial tracer curve was calibrated against the timed well-counter data to bring the measurement into the same units and timescale as the scan data. During this preprocessing of the tracer activity curve, artifacts from sampling and flushing the line were removed by a simple editing process.
The water study of cerebral blood flow was analyzed using a nonlinear least squares fitting procedure applied to the arterial input function and the regional tracer time–activity curves, using the VOI and registration protocols as above. The technique for derivation of regional cerebral blood flow from H215O scans involves modification of the autoradiographic technique developed by Kety as described by Raichle et al. (1983), (Kety and Schmidt, 1948), whereby the tissue and arterial activities of a freely diffusible inert tracer are measured for a known time. The flow per unit weight of tissue can then be calculated by solving the following equation for f:
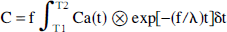
where
C = local number of counts per unit weight of tissue
Ca(t) = measured concentration of tracer in arterial blood over time
f = blood flow
T1, T2 are start and finish of scan times
λ = tracer partition coefficient from blood to brain 0.95 (Lammertsma et al 1990)
⊗ denotes a convolution
where C is local number of counts per unit weight of tissue, Ca(t) is measured concentration of tracer in arterial blood over time, f is blood flow, T1 and T2 are start and finish scan times, λ is tracer partition coefficient from blood to brain (0.95, Lammertsma et al., 1990), and ⊗ denotes a convolution.
Our analysis incorporated the further modifications described by Lammertsma et al. (1990), whereby corrections for delay (13.9 ± 2.57 seconds in our data) and dispersion (0.216 ± 0.085) of the arterial input function are derived from a whole brain ROI (generated from an autotrace of the cortical outline on the registered MRI) before generation of a lookup table relating PET counts to blood flow. This table is then used to convert the PET tracer uptake image into a parametric image of blood flow, onto which the VOI are projected to derive values for blood flow within them.
Data from the 18FDG study were analyzed to obtain the rate constants for glucose uptake (K1), glucose egress (k2), glucose phosphorylation (k3), and dephosphorylation (k4) as specified in the three-compartment model described by Sokoloff et al. (1977), modified by Phelps for use with FDG (Phelps et al., 1979), and using a lumped constant to relate the tracer to tracee behavior between 18FDG and natural glucose (Reivich et al., 1985). A nonlinear least squares fitting procedure (Nelder and Mead, 1965) was applied to the arterial input function (the arterial tracer curve) and the regional brain tracer time–activity curves. A term accounting for the tissue blood volume was also estimated in the model. The “global” metabolic rate for glucose in each ROI was calculated according to the following equation:
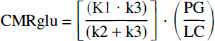
where PG is plasma glucose, and LC is a lumped constant of 0.52 (Reivich et al., 1985).
Of approximately 450 single defined regions per study, a small number (∼2%) could not be fitted using the described paradigm and standard estimates. Rather than attempting individual fitting with different initial estimates (and thus possibly introducing bias), these data were omitted from further analysis.
Plasma glucose was measured using a glucose oxidase method. Catecholamines were measured by high-pressure liquid chromatography with electrochemical detection (Macdonald and Lake, 1985) and cortisol (Cunnah et al., 1987), glucagon, growth hormone (Mazlan, 1989), and free insulin concentrations by radioimmunoassay (Hanning et al., 1985). Paired studies were measured in the same assay runs. The intra-assay variation for any assay was less than 10%.
Statistical analyses
Data are presented as mean ± SD. Each subject was paired with his own second study and the regional analyses subjected to normality testing and parametric processing (paired t testing; minitab, Minitab Inc., State College, PA, U.S.A.). Because ROI (as presented in the figures) are not truly independent variables within one brain area (e.g., cortex), the statistical analyses are performed on the grouped data for each of six larger regions as in Table 2. For multiple comparisons (e.g., cerebral blood flow across several brain regions), differences were first sought by one-way analysis of variance, before t tests were applied to pairwise comparisons. Fit accuracy (residual sum of squares, RSS) and variance of the data were checked before making comparisons between the parameters derived from the fitting processes. These data, along with covariance of k values one to another, are discussed in the appendix.
‘First study’ effect on counter regulatory hormone profiles
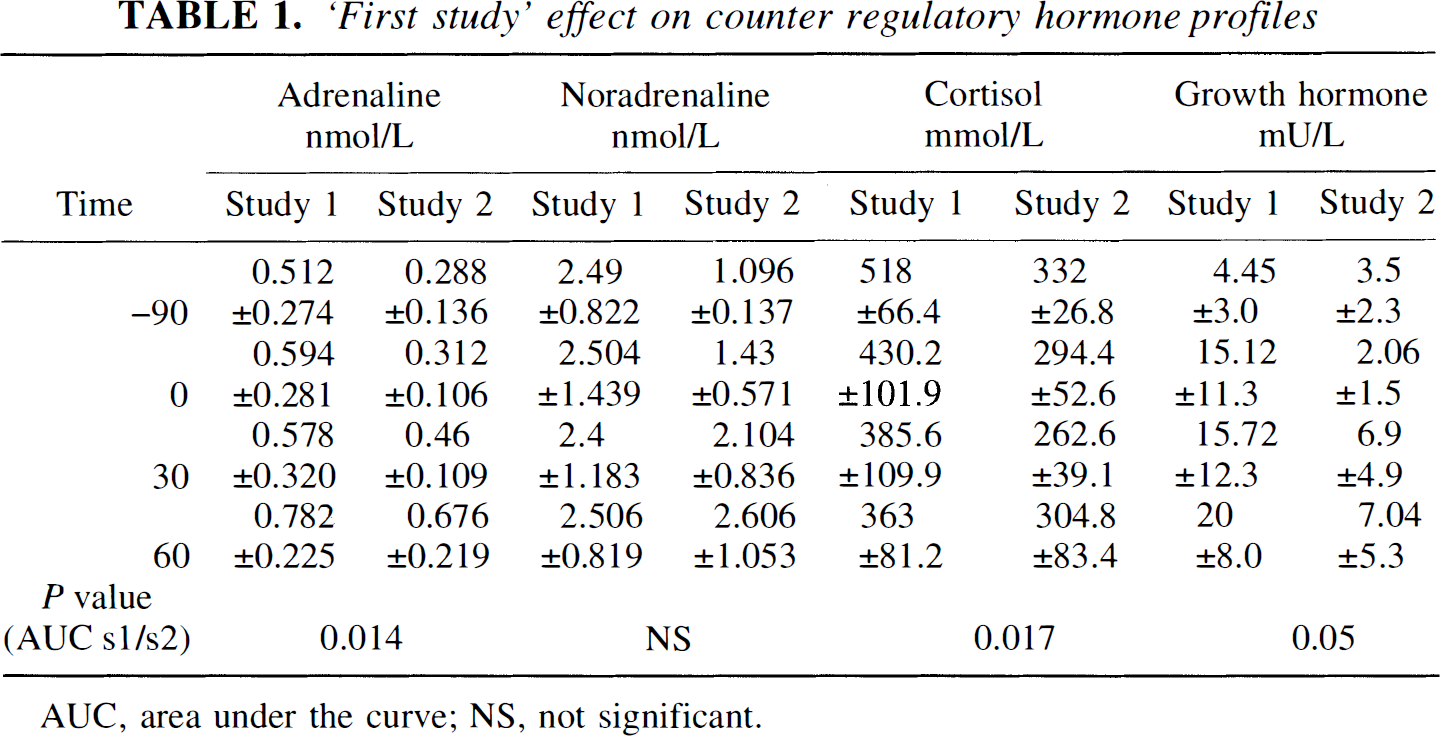
AUC, area under the curve; NS, not significant.
RESULTS
Protocol A: Reproducibility and regional variations in cerebral blood flow and glucose metabolism in diabetic man
During euglycemic clamping, free plasma insulin was 96.1 ± 31.4 mU/mL at steady state in first scans and 99.3 ± 45.3 mU/mL in second scans, P = 0.44. Arterial plasma glucose was maintained throughout at 4.98 ± 0.04 and 4.99 ± 0.03 mmol/L, in first and second scans, respectively, P = 0.2. Glucose infusion rates during the 90 minutes of H215O and 18FDG PET scanning were 4.75 ± 0.87 mg/kg per minute and 4.84 ± 1.62 mg/kg per minute, respectively, P = 0.88. In first scans, catecholamine levels were high at baseline and remained elevated throughout (Table 1). In second scans, levels rose slightly as scanning proceeded but did not achieve the levels of first scans (Table 1). Glucagon, cortisol, and growth hormone levels did not rise significantly during scanning, but were consistently higher in scan 1 than scan 2 (see Table 1).
Mean (+SD) intraindividual differences in regional cerebral blood flow and cmrglu (Protocol A)
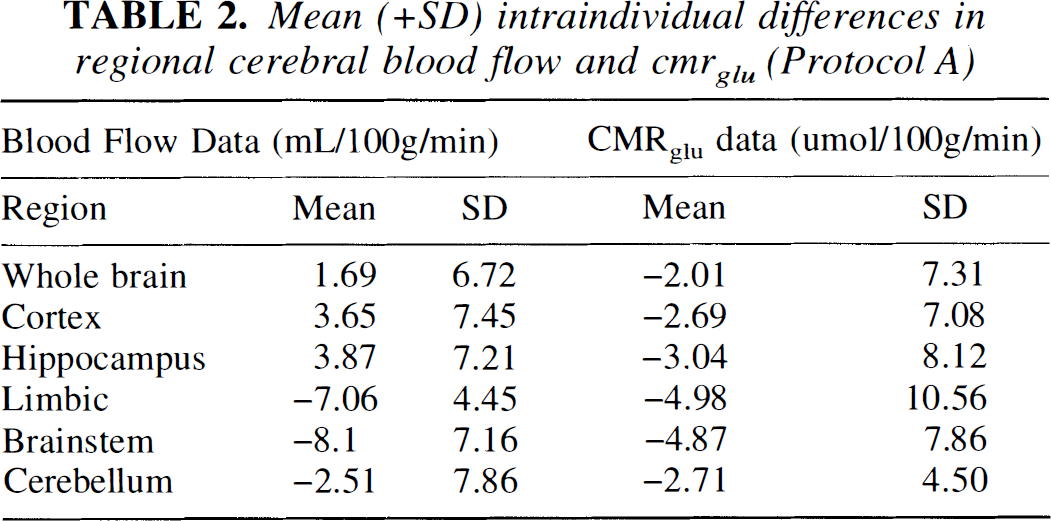
Total cerebral blood flow was not significantly different between first and second scans (47.4 ± 5.4 mL·100 g−1·min−1 first scans versus 47.1 ± 6.8 mL·100 g−1·min−1 in second scans, P = 0.94). The intraindividual variation of blood flow is best described by the mean of differences between the two scans rather than the difference of means, which describes the interindividual variation. The former is shown in Table 2, and confirms that the intraindividual variation of this technique is also low. Brain blood flow in individual regions of interest at the two insulin levels are shown in Fig. 1, lower panel. When blood flow was calculated for major brain regions by summation of the relevant ROI data, there were no significant differences between first and second scans but flow was significantly slower in the brainstem than in the cortex or cerebellum on both occasions (first scans, brain stem 41.7 ± 4.6 versus cortex 47.5 ± 7.3 mL·100 g−1·min−1, P = 0.06 and cerebellum 50.2 ± 4.9 mL·100 g−1·min−1, P = 0.001; second scans, brainstem 39.9 ± 7.8 versus cortex 48.1 ± 9.3 mL·100 g−1·min−1, P = 0.03 and versus cerebellum 46.9 ± 10.9 mL·100 g−1·min−1, P = 0.02).
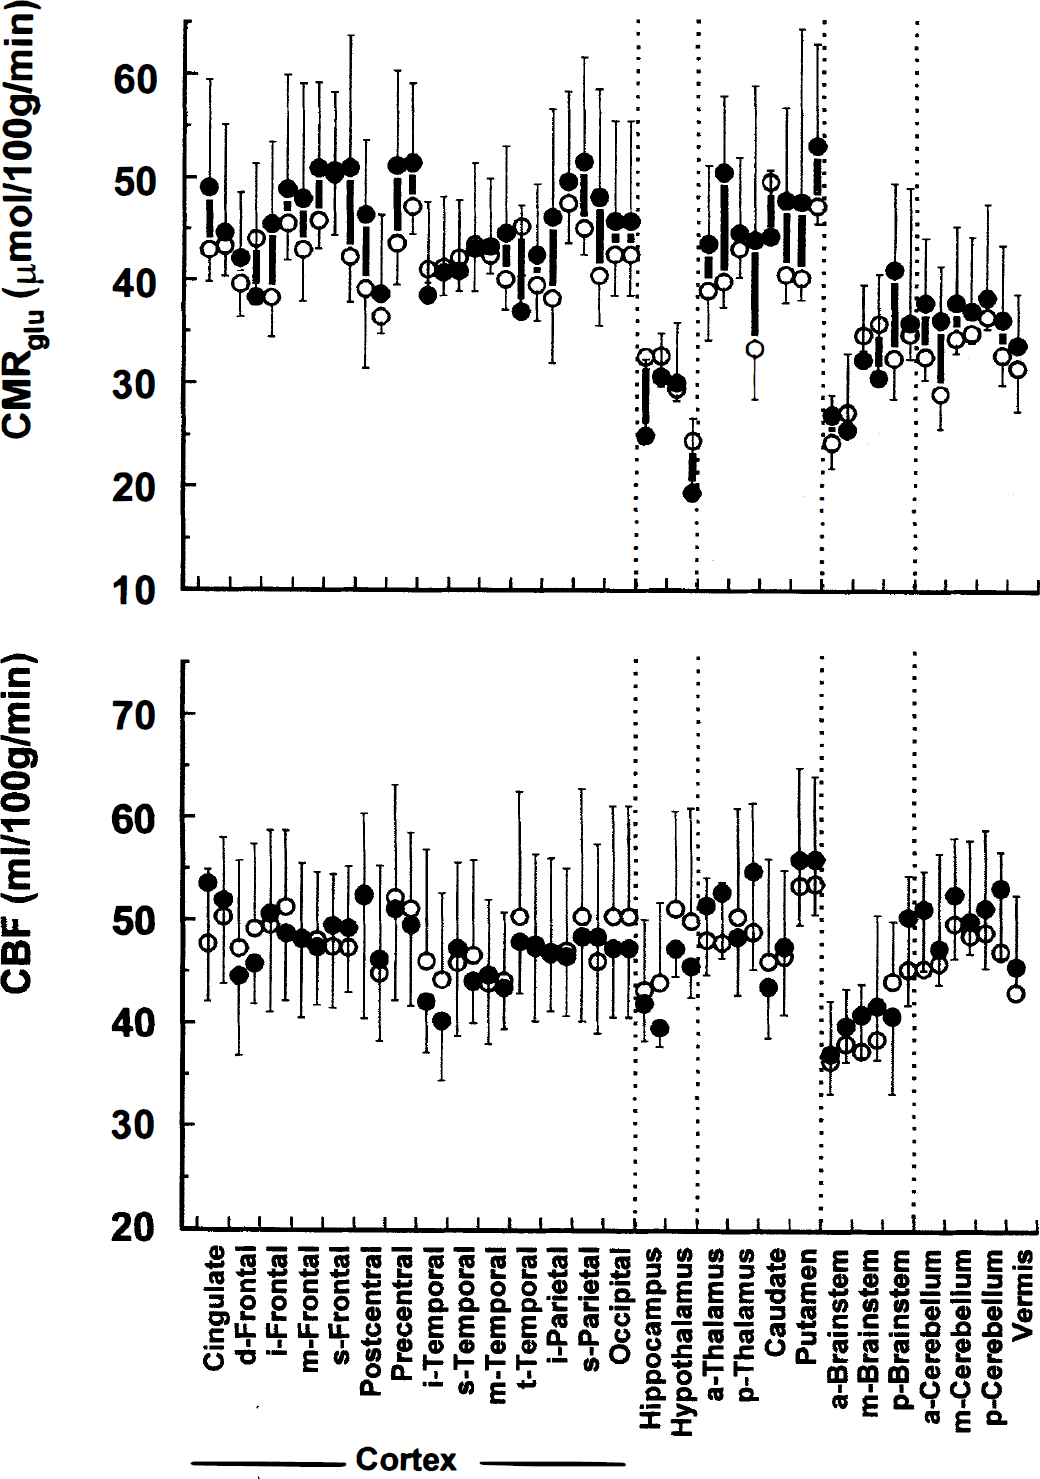
Reproducibility of regional cerebral metabolic rate for glucose (top panel) and cerebral blood flow (lower panel) at 1.5 mU·kg−1·min−1 insulin infusion in men with insulin-dependent diabetes mellitus (IDDM). Data are shown as means ± SD. Solid circles, first scans; open circles, second scans. Solid bars connect readings from individual brain volumes of interest. Brain volumes of interest are shown on the x axis for each named region divided into right and left (right first). (a, anterior; i, inferior; m, middle; p, posterior; s, superior; t, transverse.)
Cerebral metabolic rate for glucose (CMRglu) across the whole brain was slightly higher in first scans (41.9 ± 7.4 versus 39.4 ± 3.2 μmol·100 g−1·min−1) than in second scans, for summed whole brain regions (P = 0.59), representing approximately a 6% change. This was consistent across all regions of interest (Fig. 1, upper panel), but did not achieve significance even when summed regions of interest were calculated (see below). In both sets of scans, however, CMRglu was consistently lower in cerebellar regions than in cerebral cortex: summed CMRglu for frontal cortex 45.0 ± 8 μmol·100 g−1·min−1 first scans and 42.8 ± 4.4 μmol·100 g−1·min−1 second scans (P = 0.44) versus CMRglu across the cerebellum 36.6 ± 7.6 and 33.4 ± 3.0 μmol·100 g−1·min−1 (P = 0.20). The difference between the values in the cortex and cerebellum was significant in each study, P = 0.05 for first scans and 0.01 for second scans. The intraindividual variation of the CMRglu calculation is shown in Table 2.
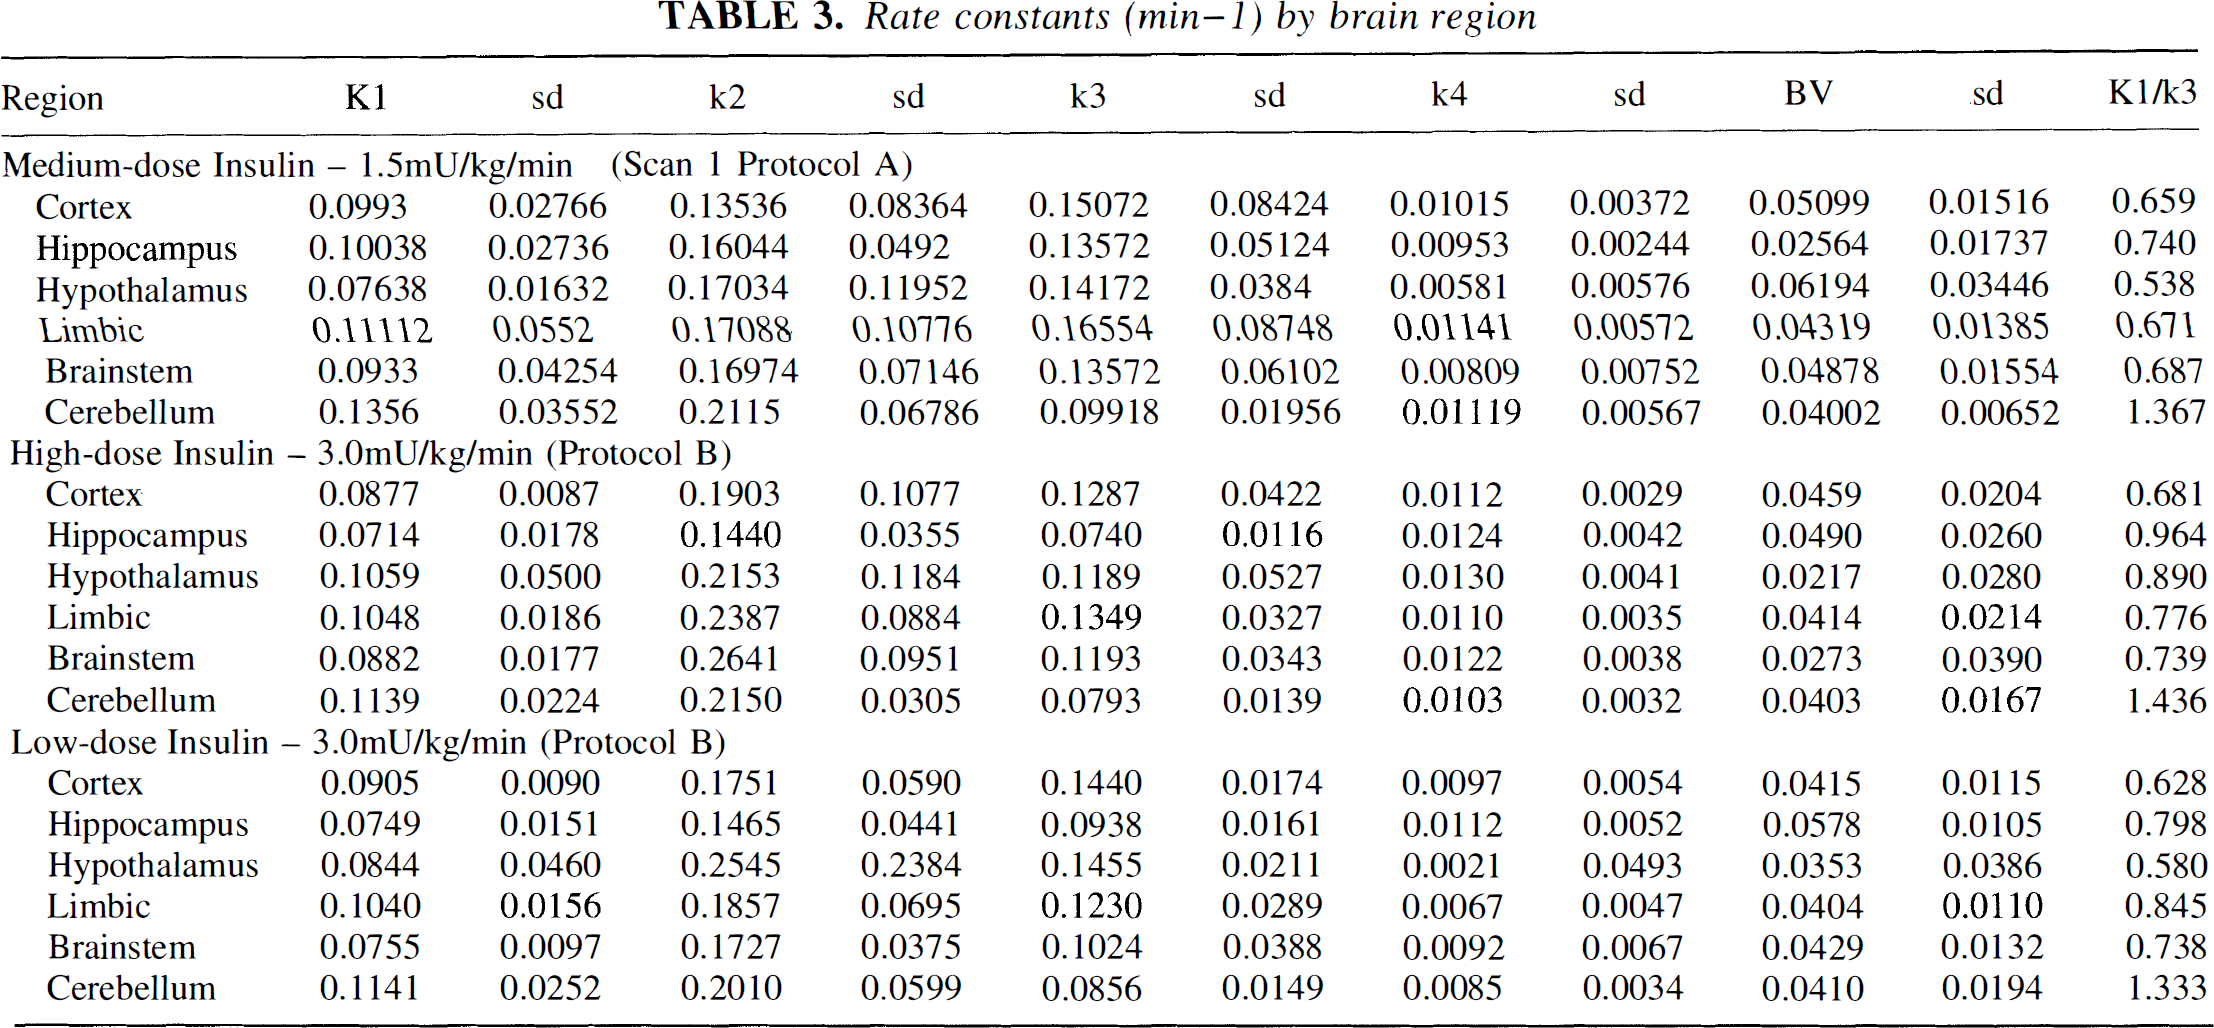
As shown in Table 3, rate constants were also different between cortex and cerebellum. K1 was lower in the cerebral cortex by a factor of 0.658 whereas k3 was higher by a factor of 1.367. The ratio between K1 and k3 was therefore reversed in the cerebellum (Fig. 2). This finding was consistent in the second scans.
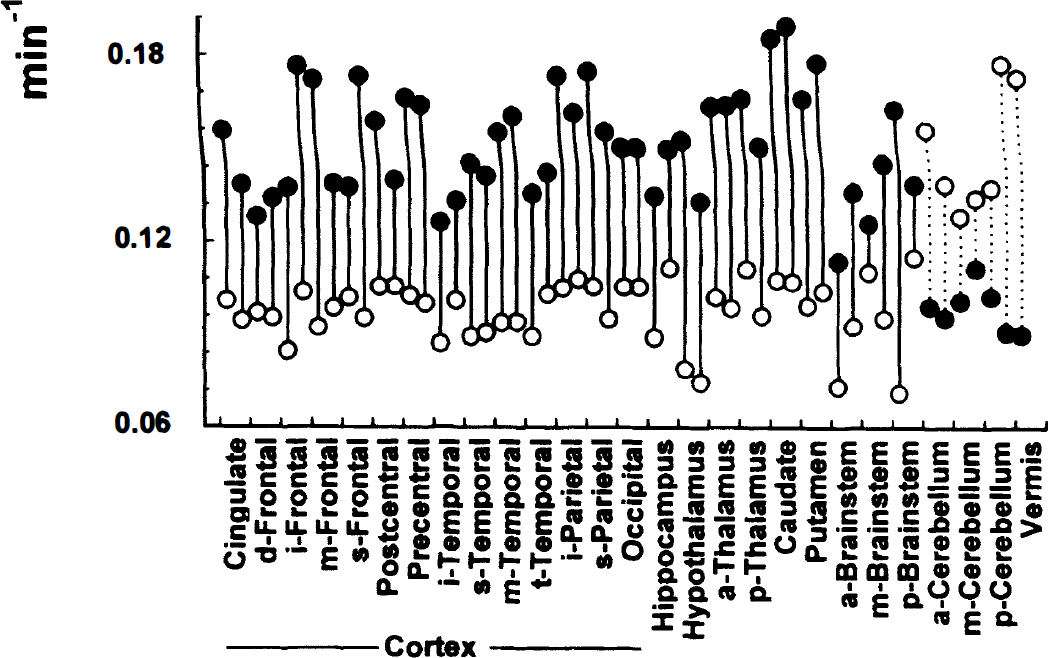
Rate constants for glucose entry (K1, open circles) and glucose phosphorylation (k3, solid circles) during euglycemia and 1.5 mU·kg−1·min−1 insulin infusion. Bars connect data points in one brain volume of interest. Other symbols and x axis as in Fig. 1.
Protocol B: The effect of insulin on regional cerebral blood flow and glucose metabolism in diabetic subjects
Free plasma insulin was elevated from 16.7 ± 5.82 mU/L at baseline to 20.5 ± 7.7 mU/mL during the 0.3 mU·kg−1·min−1 infusion and from 26.0 ± 18.6 at baseline to 191.0 ± 38.3 mU/mL during the 3.0 mU·kg−1·min−1 infusion, P < 0.0001. Arterial plasma glucose levels were maintained at 5.05 ± 0.04 and 5.11 ± 0.05 mmol/L throughout each study, P = 0.2. Glucose infusion rates required to maintain euglycemia during the 90 minutes of the 18FDG scans were 1.65 ± 0.88 mg/kg per minute during low-dose and 7.09 ± 1.17 mg/kg per minute during high-dose insulin infusion, P < 0.0001. Catecholamine, glucagon, and growth hormone levels did not rise significantly in either study, although cortisol levels fell slowly over time, in normal diurnal rhythm.
Total brain blood flow was not significantly different between the two levels of insulin, 41.7 ± 5.3 mL·100 g−1·min−1 low-dose versus 45.6 ± 6.3 mL·100 g−1·min−1 high-dose insulin infusion, P = 0.4. Brain blood flow in individual regions of interest at the two insulin levels are shown in Fig. 3, bottom panel, and although there were differences between regions, insulin had no significant effect on any brain blood flow measure. When blood flow was calculated for major brain regions by summation of the relevant ROI data, there were no significant differences between the two studies: cortex, 41.1 ± 5.5 mL·100 g−1·min−1 (low dose) versus 45.1 ± 9.0 mL·100 g−1·min−1 (high dose), P = 0.36; cerebellum, 43.9 ± 2.8 mL·100 g−1·min−1 (low dose) versus 48.8 ± 10.2 mL·100 g−1·min−1 (high dose), P = 0.45.
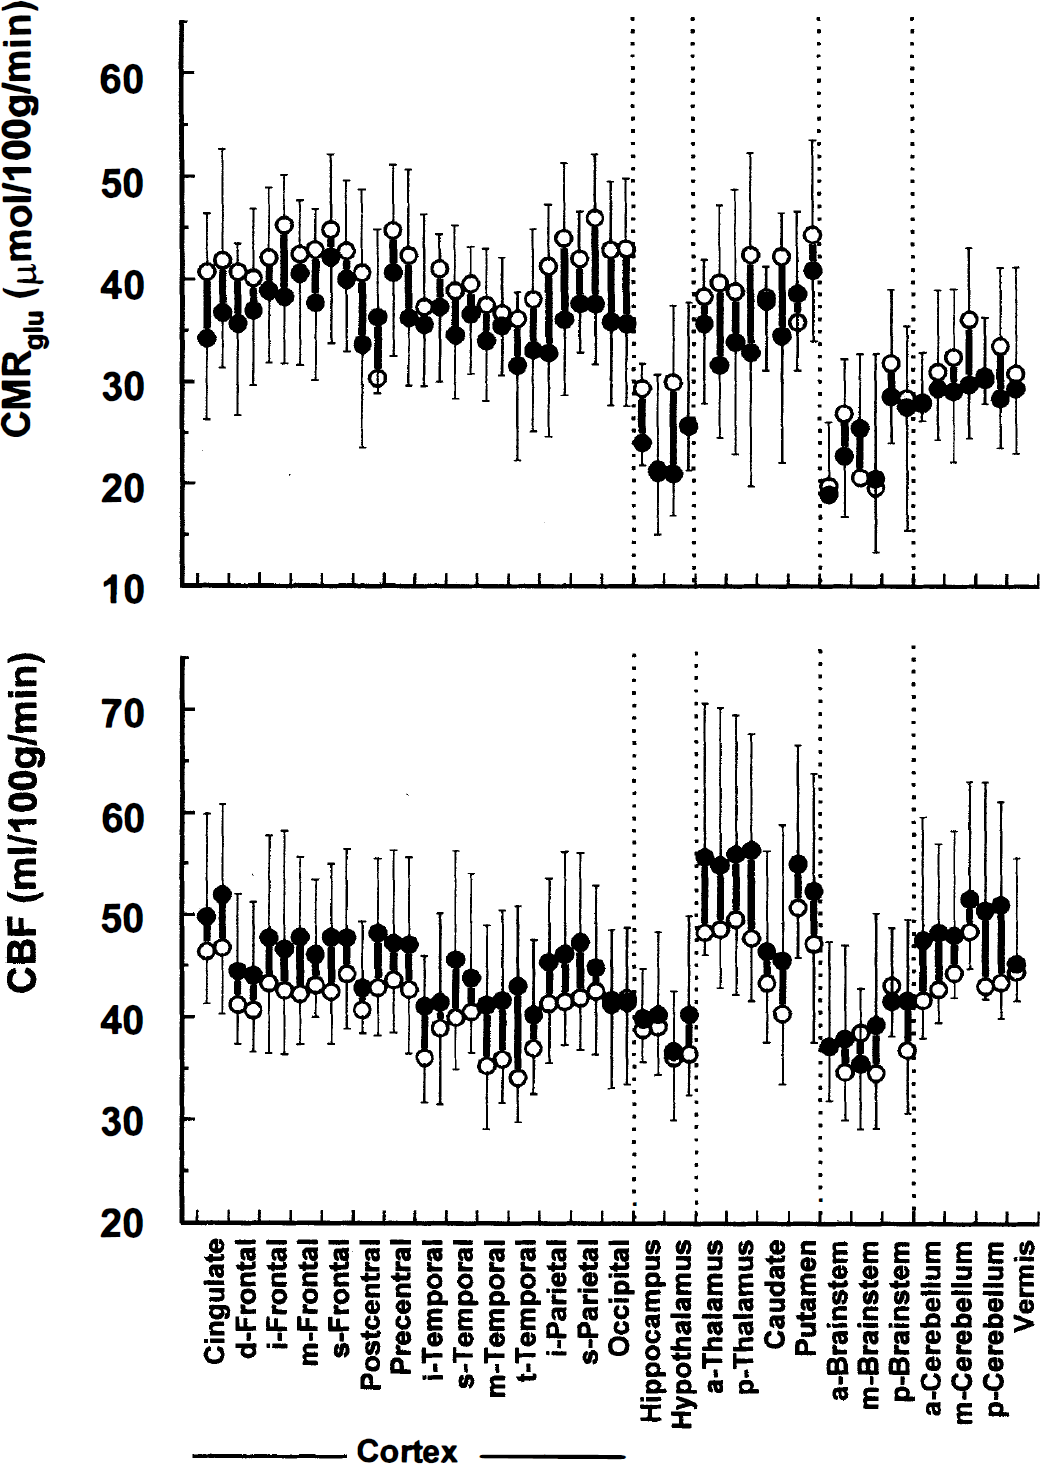
Effect of insulin on regional cerebral metabolic rate for glucose (top panel) and cerebral blood flow (lower panel) in men with IDDM. Open circles are from low-dose insulin infusion (0.3 mU·kg−1·min−1) and solid circles from high-dose infusion (3 mU·kg−1·min−1).
Cerebral metabolic rate for glucose across the whole brain was not different between the two studies (36.6 ± 4.4 versus 32.8 ± 5.6 μmol·100 g−1·min−1, low- versus high-dose infusion, P = 0.32). To be certain that the “practice effect” of lower CMRglu in second scans was not concealing a minor insulin effect, we also performed the analysis after increasing values for all data from second studies by 6%. This gave us estimates of 38.3 ± 5.3 μmol·100 g−1·min−1 and 33.7 ± 4.6 μmol·100 g−1·min−1 for the low- and high-dose insulin studies, respectively, P = 0.2. CMRglu for individual regions of interest are shown in Fig. 3, upper panel. Although there is variation between regions, there were no significant differences between CMRglu at the two insulin levels in any given region. When CMRglu of major brain regions was determined by summation of ROI within them, insulin had no appreciable effect: CMRglu for the cortical gyri was 40.8 ± 5.4 μmol·100 g−1·min−1 low-dose versus 36.5 ± 6.7 μmol·100 g−1·min−1 high-dose insulin infusion, P = 0.3, whereas CMRglu across the cerebellum was lower at 31.7 ± 6.6 μmol·100 g−1·min−1 low-dose and 29.1 ± 4.3 μmol·100 g−1·min−1 high-dose insulin, P = 0.6. At both low- and high-dose insulin, the cortical CMRglu was significantly higher than the cerebellar values, P = 0.040 for low-dose and 0.011 for high-dose insulin infusion.
The individual rate constants for cerebral glucose uptake and metabolism were similarly unaffected by hyperinsulinemia, but the same relationships between rate constants in the different brain regions were noted (see Table 3).
Rate constants (min–1) by brain region
DISCUSSION
Debate about the role of insulin in cerebral glucose metabolism has not been resolved. Although early data suggest that insulin does not affect glucose metabolism in brain tissues (e.g., Goodner and Berrie, 1977; Horn et al., 1984; Brooks et al., 1986), the demonstration of insulin receptors and insulin receptor mRNA in neuronal tissue raises the question of their functional significance (Kotzke et al., 1995; Kenner et al., 1995; Sable and Yeh, 1995). In vitro data suggest that insulin may alter neuronal metabolism, there is evidence that insulin can penetrate the blood brain barrier and enter the brain (Steffens et al., 1988), and recent animal studies using autoradiography demonstrated regional variations in insulin uptake and insulin-enhanced glucose metabolism (Lucignani et al., 1987). Quantitative study, however, of rate constants for glucose transport (Namba et al., 1987) in rats suggests that the overall effect of this in terms of brain spatial distribution of glucose is small (∼10%) compared with insulin-sensitive tissues, even at a high insulin dose. Recent human studies examining whole brain uptake by an arteriovenous difference technique failed to find any evidence for an effect of insulin in humans in vivo (Robinson et al., 1994), but studies of evoked potentials during hypoglycemia induced by different types of insulins found differences in the magnitude of hypoglycemia-associated abnormalities (Kern et al., 1990, 1994a, 1994b). The authors suggested that these differences may relate to different intracerebral insulin concentrations subsequent to different physical properties of the insulins, implying that insulin does affect at least some cerebral functions in man. This has clinical implications in view of suggestions that different insulin preparations may affect hypoglycemic responses differently (reviewed in Amiel, 1995). Furthermore, although the evidence for an effect of insulin on counterregulatory responses to hypoglycemia in man is controversial (Kerr et al., 1991; Diamond et al., 1991; Lui et al., 1991; Davis et al., 1993; Mellman et al., 1992), a recent study using selective catheterization to elevate cerebral blood insulin levels during hypoglycemia in dogs suggests that insulin may affect brain behavior in hypoglycemia (Davis et al., 1995). The question is of more than academic interest, because of the possibility that hyperinsulinemia may affect brain function in diabetic patients both acutely, as in response to hypoglycemia, or chronically. To date, most studies of the effects of insulin on brain glucose metabolism either have been in animals or have examined whole brain (Hertz et al., 1981; Grill et al., 1990). Studies in non–insulin-dependent diabetic subjects have been done and showed little effect of insulin, but these subjects were probably obese and likely to have been systemically insulin resistant (Eastman et al., 1990). Blood flow was not examined. We therefore set out to look for effects of insulin on regional brain glucose metabolism, using 18FDG PET and euglycemic insulin clamp techniques to control blood glucose and insulin levels in normal-weight male subjects with stable IDDM. Because brain function is effectively glucose dependent and the brain stores negligible quantities of glucose, blood flow supplying the brain's glucose needs is critical to normal brain function; we examined this also in our studies. Our data support the hypothesis that, despite an abundance of insulin receptors, insulin in physiologic or therapeutic quantities has no appreciable effect on 18FDG metabolism in any brain region.
Our initial study was performed to test the reproducibility of the techniques. Our data confirmed previous studies, with a low intraindividual variation in estimates of CMRglu and blood flow. The magnitude of interindividual variation in blood flow was slightly lower than recent similar studies, perhaps reflecting the close subject matching (Ohta et al., 1996), but of the same order of magnitude. Retrospectively, using these data to recalculate our power, we find that the original figures for CMRglu and blood flow are broadly confirmed; regionally we would expect to detect between 12% and 25% changes in either of these parameters. Individual rate constants show varying degrees of codependence (see Appendix), making variability somewhat higher than global terms such as CMRglu. As a result, the differences we would expect to detect in these (90%) are respectively higher; 30% to 40% in K1 and k3, and up to 80% in k2. These figures are large but smaller than would occur with this study design in insulin-sensitive tissues such as muscle. They explain why the small trends seen in our data (e.g., the order effect) do not reach significance; however, clinically significant changes in insulin sensitivity should not have been missed.
The finding of an order effect related to anxiety in repeated studies has been described previously (Stapleton et al., 1997). However, Bartlett et al. (1988) associated lower CMRglu with stress, assessed by questionnaire and physiologic responses such as pulse rate. In our study, first estimates of CMRglu were approximately 6% higher than second runs, but with no change in regional blood flow, and this was associated with relatively high catecholamine levels on the first occasion. To our knowledge, this has not previously been examined. Our data would therefore support the suggestion that stress is associated with increased CMRglu. One possible explanation for these apparent discrepancies may lie in the fact that the earlier study was also seeking a diurnal variation in CMRglu and performed repeat scans at different times of day. Morning CMRglu was lower than that of the afternoon. Our studies were all done at approximately the same time of day and elimination of such confounding variables may have given the different result. In any event, all the effects (order and time of day) are relatively small. Because of the radiation doses involved, it is not practical to eliminate the order effect by repeated studies. Randomization of studies is therefore particularly important and power calculations taking into account a potential variation in results are essential in study design. In our second study, examining the effects of different levels of hyperinsulinemia, reducing the calculated CMRglu of all second studies by 6% did not influence outcome.
Positron emisson tomography allows the study of blood flow and glucose metabolic rate in specific brain regions. It does however have limitations and one of these is the resolution of the technique as currently available. Recent work has located the most dense concentration of insulin receptors in the hypothalamus, hippocampus, olfactory lobes, and cerebellum. The hypothalamus is also of particular interest in view of recent data supporting its role as the putative glucose sensor—that part of the brain that recognizes a falling glucose supply (Borg et al., 1995), probably as a falling rate of intracellular metabolism (Borg et al., 1997), and triggers the counterregulatory responses. We have found no evidence to support the suggestion that glucose metabolism in the area of the hypothalamus is affected by insulin. The resolution of the PET scan is not really adequate to examine so small an area as an hypothalamic nucleus, and PET data from the region of the hypothalamus is particularly prone to partial volume effects. Hoffman et al. (1979) states that partial volume effects will be significant for objects of less than twice the full width at half maximum of the scanner. However, although some studies have suggested an effect of insulin is localized to this particular area of the brain (Lucignani et al., 1987), others have evidence of a more widespread phenomenon (Grunstein et al., 1985), including the cerebral motor cortex, albeit reporting unexpectedly a fall in the rate of regional cerebral glucose metabolism. Furthermore, the data from Germany (Kern et al., 1990, 1994a, 1994b) suggest a more extensive insulin effect on cerebral function (and by implication metabolism), including the cerebral cortex and brain stem. These can be easily isolated and visualized with PET, and we can be confident that insulin does not affect metabolic action in these areas of human brain. In this conclusion we would concur with Eastman et al. (1990), although for a different insulin range and in a different set of subjects. However, unlike them we do not see any significant change in k4 as a result of insulin infusion. Indeed, considering the changes to the arterial time–activity curves of the 18FDG tracer (as a result of increased peripheral glucose uptake in the presence of higher insulin doses), the net result in terms of cerebral glucose metabolism is negligible.
This is the first demonstration in man that the cerebellum has different glucose kinetics from more rostral areas of brain, although it is consistent with earlier published data from animals (Sokoloff et al., 1977). Studies in rats have described a higher rate of tissue glucose extraction from blood in the cerebellum and shown that the cerebellum has a higher rate of glucose influx to glucose utilization (La Manna and Harik, 1985). This is compatible with the relatively high K1 in our human data. Our data suggest that, although at euglycemia glucose uptake rather than phosphorylation is the rate-limiting step in rostral brain regions (the rate of the former being about 50% the rate of the latter, Cremer et al., 1981), this may not be the case in the cerebellum. Furthermore, if the cerebellum is more efficient in extracting glucose from the circulation, one might expect cerebellar functions to be more resistant to hypoglycemia, when glucose transport becomes the rate-limiting step. This is supported both by animal studies and the available human data. The mechanism of increased cerebellar efficiency for glucose uptake is not known. It is possible that the cerebellum or the endothelium of the cerebellar circulation expresses more glucose transporters than the cerebral cortex. It is also possible that the microcirculation of the cerebellum is different. There is evidence that the volume of distribution of
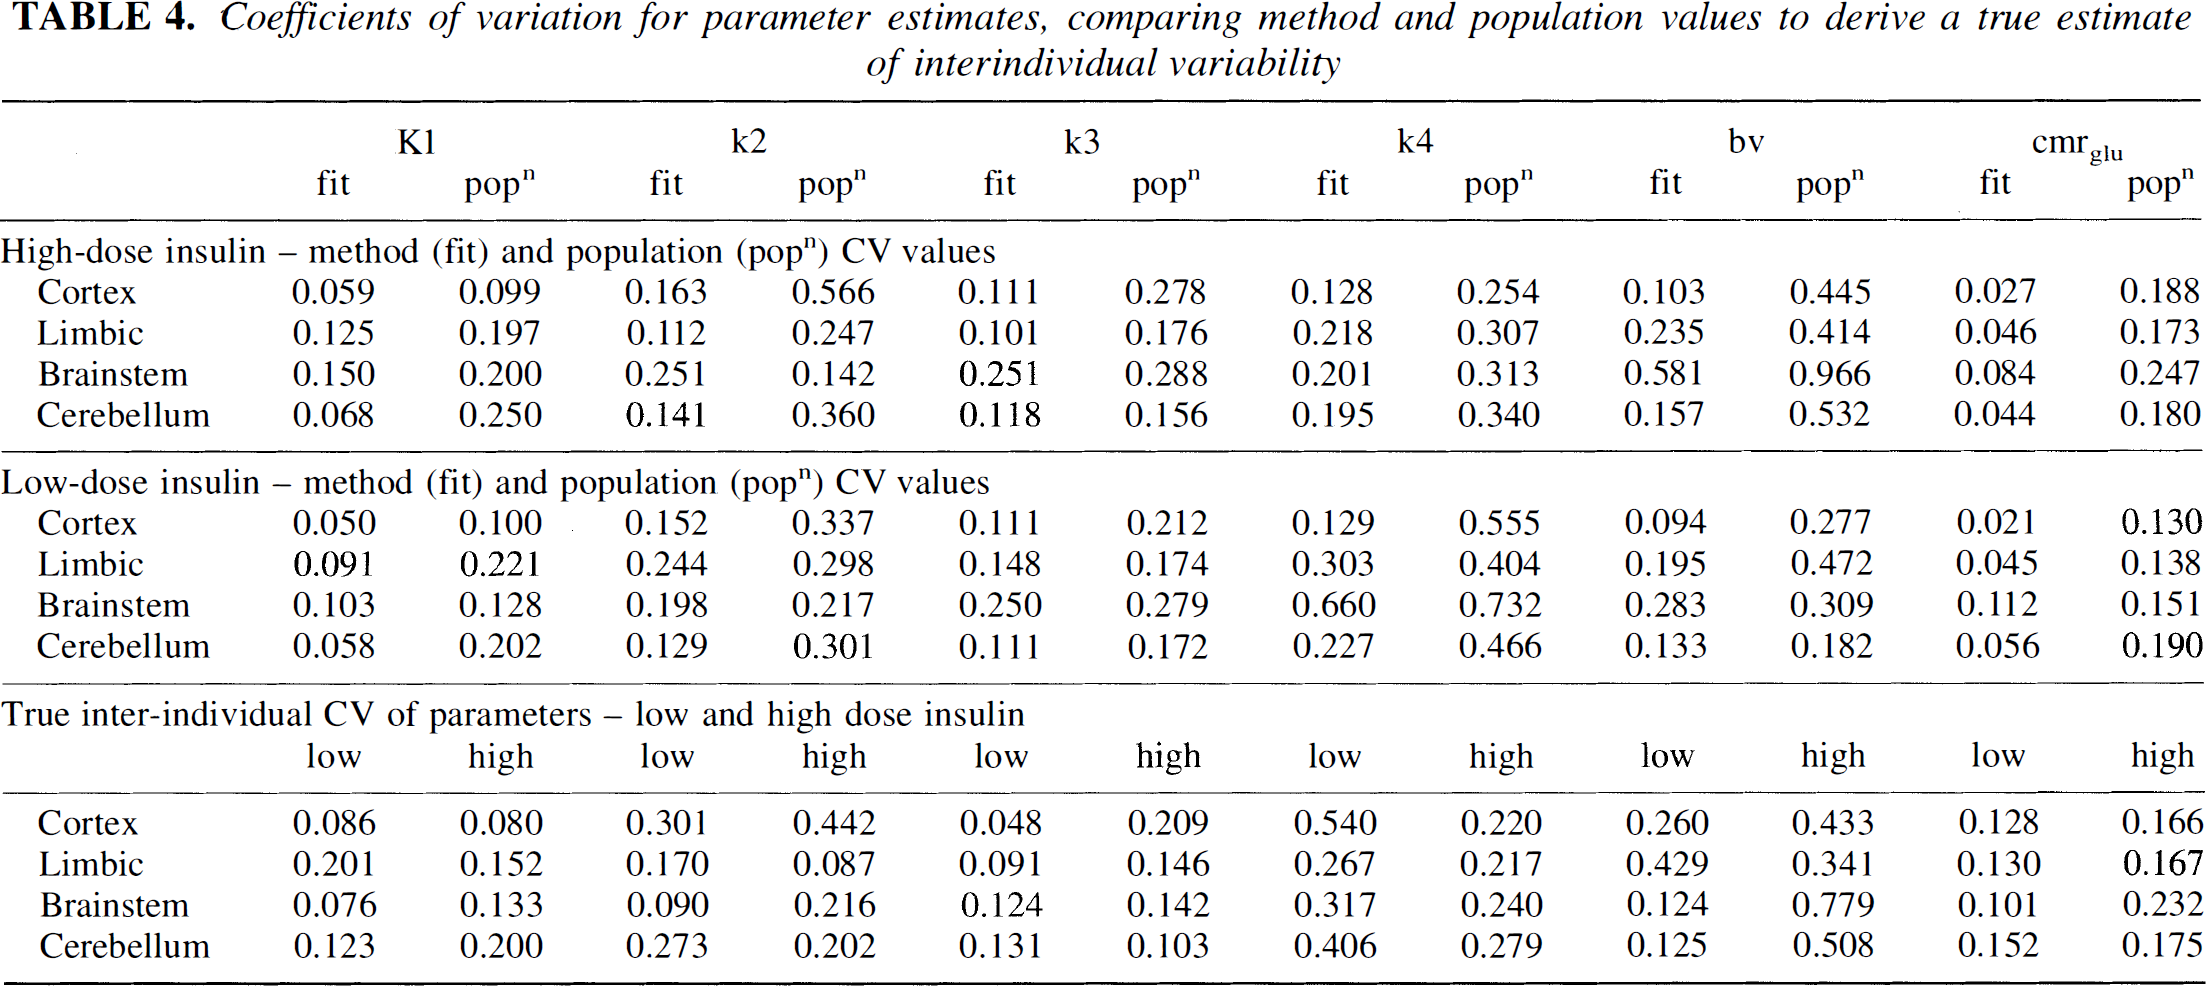
Coefficients of variation for parameter estimates, comparing method and population values to derive a true estimate of interindividual variability
In conclusion, our data find no detectable effects of physiologic levels of circulating insulin on glucose uptake in man in any brain region studied. This is consistent with earlier studies of whole brain, and shows that hyperinsulinemic clamping can be used in conjunction with positron emission tomography to study regional brain metabolism in man. We find a first-order effect of repeated studies, whereby CMRglu increases with raised catecholamine levels, but the effect is small. There are regional differences in brain glucose metabolic capacity that may explain regional differences in the sensitivity of brain tissue to hypoglycemia. These differences may in future be exploited to devise ways of protecting brain metabolism and function during hypoglycemia as experienced by insulin and sulfonylurea treatment of diabetes mellitus.
APPENDIX
Coefficients of variation and correlation coefficients for the three-compartment FDG model
The compartmental model used to derive the rate constant parameters from the dynamic PET data consisted of three compartments linked by the standard rate constants K1, k2, k3, and k4 as described by Phelps et al. (cited in Carson, 1986) An additional term, tissue blood volume, was included in the model to account for the contribution from the plasma radioactivity to tissue PET counts. A weighted least squares fitting procedure was performed using the downhill simplex method (Nelder and Mead, 1965), and terminated when the sum of squares varied by < 0.0001 over 1 iteration. The weighting used during the fitting procedure was 1/s2, where s2 is equal to (measurement value)/(measurement duration)2, i.e., it is proportional to the variance of the measurement appropriately scaled for the frame duration. The residual sum of squares (RSS) was determined for each individual fit, and in each protocol for each region comparisons were made of the RSS errors from each scan to ensure that there were no systematic differences in the parameter estimates arising solely from the fitting procedure. In no case was a significant difference in RSS value seen from one scan to another, for the full range of insulin concentration used in the study, despite the fact that higher systemic insulin concentrations result in faster disappearance of the FDG from plasma.
There is debate as to the optimal model for the analysis of 18FDG data such as these. The contribution of k4 to the overall results is debatable, particularly for a scan duration of 60 minutes. Alternative models omit k4 entirely or substitute a fitted value with a constant population value. Analysis of our data with these alternate models, although resulting in numerically different values for the rate constants, does not alter any of the conclusions presented in this manuscript The data presented here therefore reflect the most widely accepted model.
Standard errors (SE) were estimated for individual ROI fits using the methods described by Carson (1986) and were converted to coefficients of variation (CVfit = SE/estimated parameter value). There is little published data with which to compare these values; however, they are similar to CV quoted by Carson (1986) for a similar analysis (i.e., 0.12, 0.25, 0.16, and 0.13 for K1, k2, k3, and k4, respectively). CV were also calculated for each ROI over the study population (CVpop = sample standard deviation/sample mean) for comparison. Both sets of CV are shown in Table 4. The sample CV values are all higher than the CVfit values. The extra variation, which is attributed to the true intersubject variability, independent of method, is also shown (lowest panel). This was evaluated using the following equation:
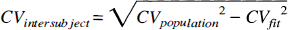
where CVfit is a mean for each region.
Correlation coefficient matrices (not shown) demonstrate a large positive correlation between K1 and k2 despite the rapid early time frames used in the dynamic acquisition. There is also some positive correlation between k3 and k2 and between k3 and k4.