
Abstract
The authors recently developed a primate thromboembolic stroke model. To characterize the primate model, the authors determined serial changes in cerebral blood flow (CBF) and the relation between CBF and cerebral metabolic rate of glucose (CMRglc) using high-resolution positron emission tomography. Thromboembolic stroke was produced in male cynomolgus monkeys (n = 4). Acute obstruction of the left middle cerebral artery was achieved by injecting an autologous blood clot into the left internal carotid artery. Cerebral blood flow was measured with [15O]H2O before and 1, 2, 4, 6, and 24 hours after embolization. CMRglc was measured with 2-[18F]fluoro-2-deoxy-D-glucose ([18F]FDG) 24 hours after embolization. Lesion size and location 24 hours after embolization was determined by the 2,3,5-triphenyltetrazolium chloride (TTC) staining method. The results are summarized as follows: (1) 1 hour after embolization, CBF in the temporal cortex and the basal ganglia decreased to < 40% of the contralateral values. In these regions, regarded as an ischemic core, CBF decreased further with time and CMRglc at 24 hours also decreased. Infarcted lesions as indicated by being unstained with TTC were consistently observed in these regions. (2) In the parietal cortex and several regions surrounding the ischemic core, CBF was >40% of the contralateral values 1 hour after embolization and recovered gradually with time (ischemic penumbra). In these regions, CMRglc at 24 hours increased compared with that in the contralateral regions, indicating an uncoupling of CBF and CMRglc. No obvious TTC-unstained lesions were detected in these regions. The authors demonstrated a gradual recovery of reduced CBF, an elevated CMRglc and a CBF-CMRglc uncoupling in the penumbra regions of the primate model. Positron emission tomography investigations using this model will provide better understanding of the pathophysiology of thromboembolic stroke in humans.
Keywords
Recently, recommendations for standards regarding preclinical neuroprotective and restorative drug development were proposed by the Stroke Therapy Academic Industry Roundtable (1999). They emphasized a great need for studies in primate models of ischemia, in addition to those in small animal models. Nonhuman primates are considered to be the most suitable animals for an experimental stroke model, because their neurologic functions and cerebrovascular anatomy have been well characterized and proven to be similar to those of humans.
Several primate models of focal cerebral ischemia were developed by occluding cerebral arteries through ligation, clipping, or inflation of a cuff (Hudgins and Garcia, 1970; Crowell et al., 1981; Spetzler and Selman, 1980; Del Zoppo et al., 1986), or by embolizing cerebral arteries with silicon spheres or silicon bars (Molinari et al., 1974; Bremer et al., 1975). Pathophysiologic changes observed in these models in which the cerebral artery was occluded with artificial materials, however, seem to be considerably different from those in atherothrombotic or thromboembolic stroke in humans. Xie et al. (1988) reported a primate stroke model induced by autologous clot embolism. Recently, the authors also developed a primate thromboembolic stroke model using an autologous blood clot (Kito et al., 2001). Preliminary results in the authors' primate model indicated that the model was relevant to human thromboembolic stroke in terms of the neurologic dysfunction and histopathologic neuronal damage.
Various circulatory, biochemical, and molecular disturbances contribute to the progression of ischemic neuronal damage (Chopp, 1993; Heiss and Graf, 1994). Positron emission tomography (PET) allows researchers to noninvasively and three-dimensionally evaluate these parameters in the brain, and to do so repeatedly in the same individual. Among these parameters, cerebral blood flow (CBF) and cerebral metabolic rate of glucose (CMRglc) have been studied both in humans (Heiss and Podreka, 1993; Baron, 1996; Heiss and Graf, 1997; Heiss, 2000) and experimental animals (De Lay et al., 1988; Pappata et al., 1993; Heiss et al., 1994; Heiss and Graf, 1997, Heiss, 2000). Measurements of these basic parameters are particularly important in the acute phase of cerebral ischemia to predict the progression of ischemic neuronal damage. Acute circulatory and metabolic changes within 24 hours after arterial occlusion, however, have not been well investigated especially in humans and nonhuman primates. Studies of changes in CBF and CMRglc in the primate stroke model would help establish therapeutic strategies for human stroke.
In this study, the authors serially determined acute changes in CBF and evaluated the relation between CBF and CMRglc in the primate model of thromboembolic stroke using a high-resolution PET to characterize the thromboembolic stroke model.
MATERIALS AND METHODS
Animal preparation
The authors used 5 male cynomolgus monkeys weighing 3.5 to 3.8 kg. All procedures involving animals were approved by the animal care and use committees of the National Cardiovascular Center and were performed in accordance with standards published by the National Research Council (Guide for the Care and Use of Laboratory Animals) and the National Institutes of Health Policy on Human Care and Use of Laboratory Animals. In accordance with these standards, every effort was made to ensure that the subjects were free from pain and discomfort. The principal investigator and the primate handling staff were present for all procedures. Monkeys were housed in cages larger than 63 × 76 × 76 cm and maintained on a 12-hour light/dark cycle (lights on at 8 o'clock in the morning).
The authors used a primate model of thromboembolic stroke (Kito et al., 2001). Briefly, the animals were anesthetized by sevoflurane inhalation and artificially ventilated. The anesthetic state was maintained using 0.5% to 2.0% sevoflurane delivered in a N2O:O2 (70%:30%) gas mixture during the preparatory procedure. Animals were implanted with an indwelling catheter in the left internal carotid artery. The catheter was filled with a heparin solution and passed subcutaneously in the neck toward the mid-dorsal region. Animals were allowed to recover from anesthesia and their behavior was observed before embolization to ensure that they had no neurologic deficit as a result of the operation. Two days after the operation, a single autologous blood clot was injected into the internal carotid artery through the carotid catheter under light sevoflurane anesthesia.
Positron emission tomography studies
Positron emission tomography studies were performed using a multislice PET scanner (ECAT EXACT HR/47; Siemens/CTI, Knoxville, TN, U.S.A.) (Wienhard et al., 1994). The spatial resolution at the center of the field of view was 3.7 mm inplane at full width at half maximum and 4.1 mm axially.
Each monkey was anesthetized by sevoflurane inhalation and then artificially ventilated. The anesthetic state was maintained during the experiment using 0.5% to 2.0% sevoflurane delivered in a N2O:O2 (70%:30%) gas mixture. Catheters were introduced into the femoral artery and vein. The anesthetized animal was mounted on a custom-made stereotaxic instrument in a supine position and the head was restrained. Brain position was standardized with the aid of laser beams. Body temperature was monitored and maintained at approximately 37°C. The arterial catheter was used for continuous blood pressure monitoring and blood gas analyses were performed before each PET scan.
Values of CBF and CMRglc were determined using 15O-labeled water (15O-H2O) and 2-[18F]fluoro-2-deoxy-D-glucose (18F-FDG), respectively, according to the methods described in detail previously (Kuge et al., 2000). Briefly, 15O-H2O (370 to 481 MBq/monkey) was administered through the right venous catheter. Dynamic PET scanning (six 5-second, three 10-second, and three 20-second frames) was initiated at the time of 15O-H2O injection. 18F-FDG (113 to 152 MBq/monkey) also was administered through the venous catheter. Positron emission tomography scanning for 20 minutes was initiated 40 minutes after the 18F-FDG injection.
Study protocol and TTC staining
In each monkey, CBF measurements were performed, once before (baseline CBF) and five times after the clot injection. Baseline CBF was determined subsequent to implanting the catheter in the internal carotid artery. After the PET scanning, animals were allowed to recover from anesthesia and placed in their home cages. Two days after the baseline CBF measurement, embolization was performed under light sevoflurane anesthesia. Animals were allowed to recover from anesthesia and any induced neurologic deficits were confirmed. One monkey that showed no neurologic deficits was excluded from the study. The other monkeys were anesthetized again by sevoflurane inhalation and prepared for the PET measurements. Cerebral blood flow was determined 1, 2, 4, and 6 hours after the embolization. Animals then were allowed to recover from anesthesia and placed in their home cages. Twenty-four hours after the embolization, each monkey was anesthetized again and CBF was determined.
Immediately after the last CBF measurement at 24 hours, 18F-FDG was injected and CMRglc was measured. After completion of the CMRglc measurement, the brain was perfused with ice-cold saline and the animal was killed by exsanguination under pentobarbital anesthesia. The brain was quickly removed and the blood clot located in the M1 portion of the left middle cerebral artery (MCA) was confirmed by inspection. The brain was sectioned coronally at 3-mm intervals and incubated in a 1% solution of 2,3,5-triphenyltetrazolium chloride (TTC) at 37°C for vital staining (Kito et al., 2001). Areas not stained red with TTC were considered to be lesioned.
Data analysis
The PET images were reconstructed according to a standard filtered back-projection procedure using a Hanning filter. The CBF images were calculated based on a diffusible autoradiographic method (Sakurada et al., 1978). The CMRglc images were calculated according to an autoradiographic method (Phelps et al., 1979) adapting the values of 0.102 mL g−1 min−1, 0.130, 0.062, and 0.0068 min−1 for K1, k2, k3, and k4, respectively, and the value of 0.42 for the lumped constant.
A total of 18 circular regions of interest (ROIs, 10 mm in diameter) were determined for 3 coronal brain slices of baseline CBF images from the striatum to the thalamus level (Fig. 1). Regions of interest were superimposed on the CBF and CMRglc images obtained after embolization. Asymmetry indices (AIs), defined as the ratios of values for ROI in the left hemisphere to those for the contralateral homologous ROI, were used to exclude the effects associated with variations in levels of anesthesia.
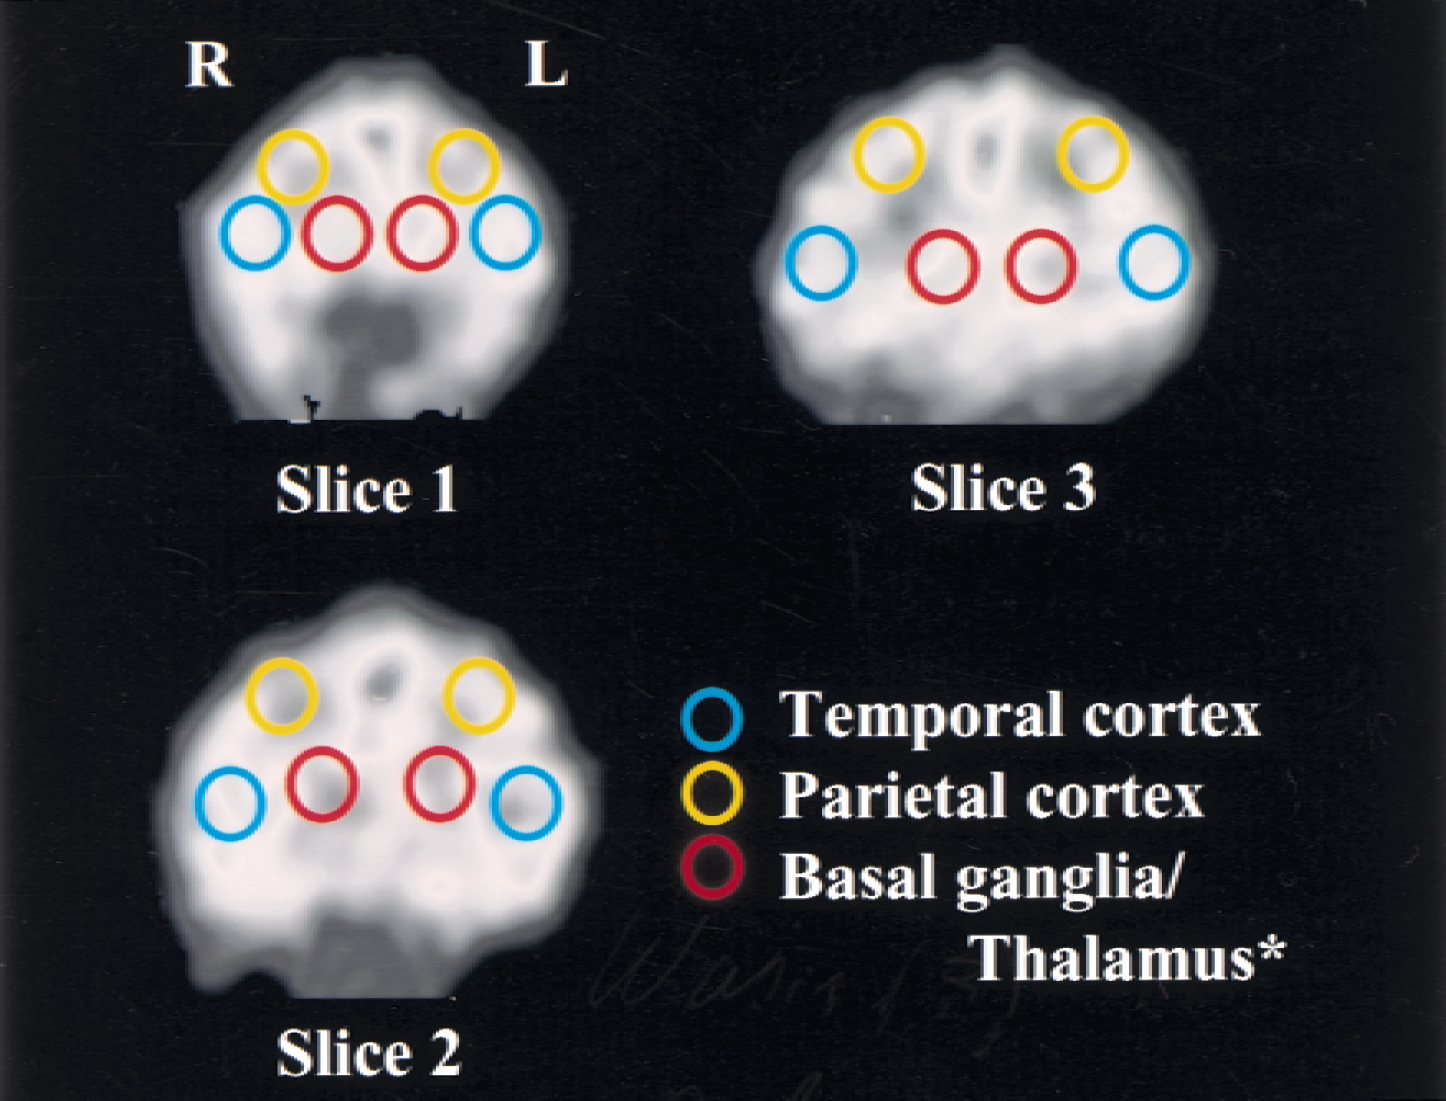
Example of regions of interest (ROIs, 10 mm in diameter) placed on three coronal images from the striatum to the thalamus level. Slices are approximately 23 (slice 1), 32 (slice 2), and 41 (slice 3) mm from the frontal pole. *Slice 1 and 2 primarily contain basal ganglia and slice 3 primarily contains thalamus.
Data are expressed as the mean ± SD for four animals, unless otherwise noted. The significance of differences in sequential changes of each physiologic parameter and in those of AIs for CBF was assessed using a repeated-measures one-way analysis of variance (ANOVA) and a Fischer's PLSD post hoc test. A two-way ANOVA was used to assess the significance of differences in the baseline CBF values (laterality and image slices), in the CMRglc values (laterality and image slices), and in the AIs 24 hours after embolization (CBF to CMRglc and image slices). A two-tailed probability value <0.05 was considered significant.
RESULTS
Physiologic parameters
During the experimental period, mean blood pressure, blood gases, blood sugar, and body temperature were within the normal range, with some changes in Paco2 (Table1).
Time course of physiologic parameters
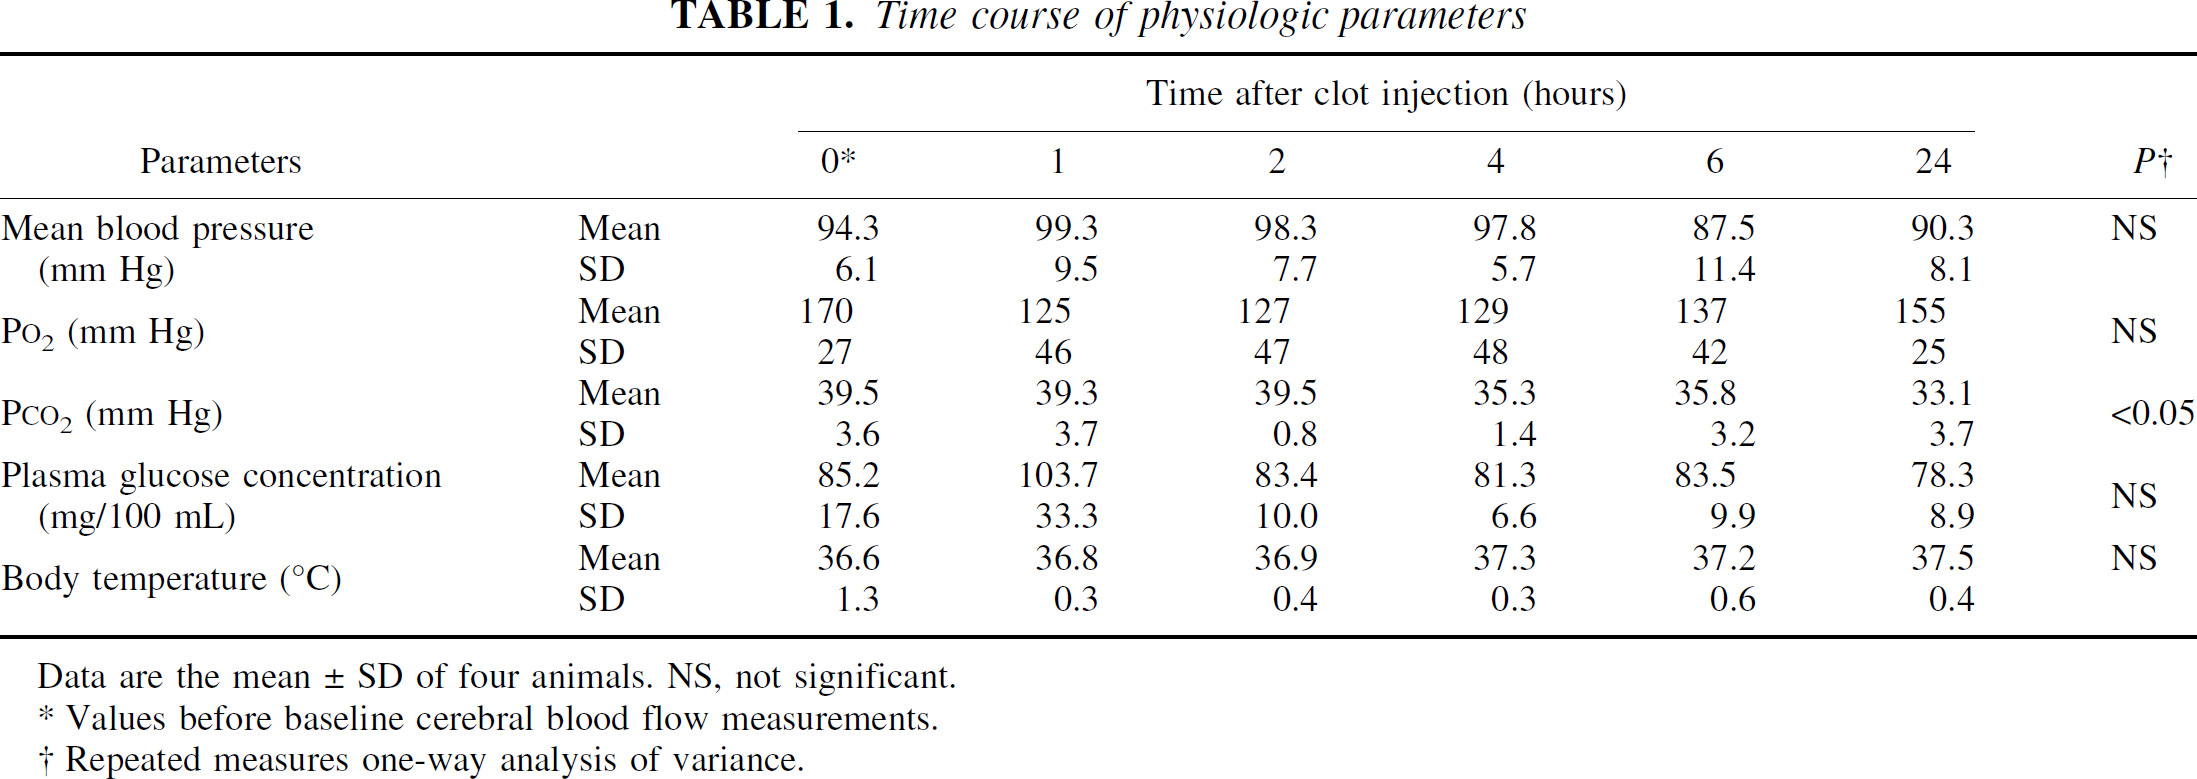
Data are the mean ± SD of four animals. NS, not significant.
Values before baseline cerebral blood flow measurements.
Repeated measures one-way analysis of variance.
Cerebral blood flow
Before the clot injection, no obvious side-to-side differences were observed in the CBF images (Figs. 2 and 4). The CBF values were 34 to 39 and 36 to 42 mL 100 g−1 min−1 for the left and right temporal cortex, 28 to 30 and 30 to 33 mL 100 g−1 min−1 for the left and right parietal cortex, and 32 to 35 and 32 to 36 mL 100 g−1 min−1 for the left and right subcortical regions, respectively. There were no significant side-to-side differences in these regions.
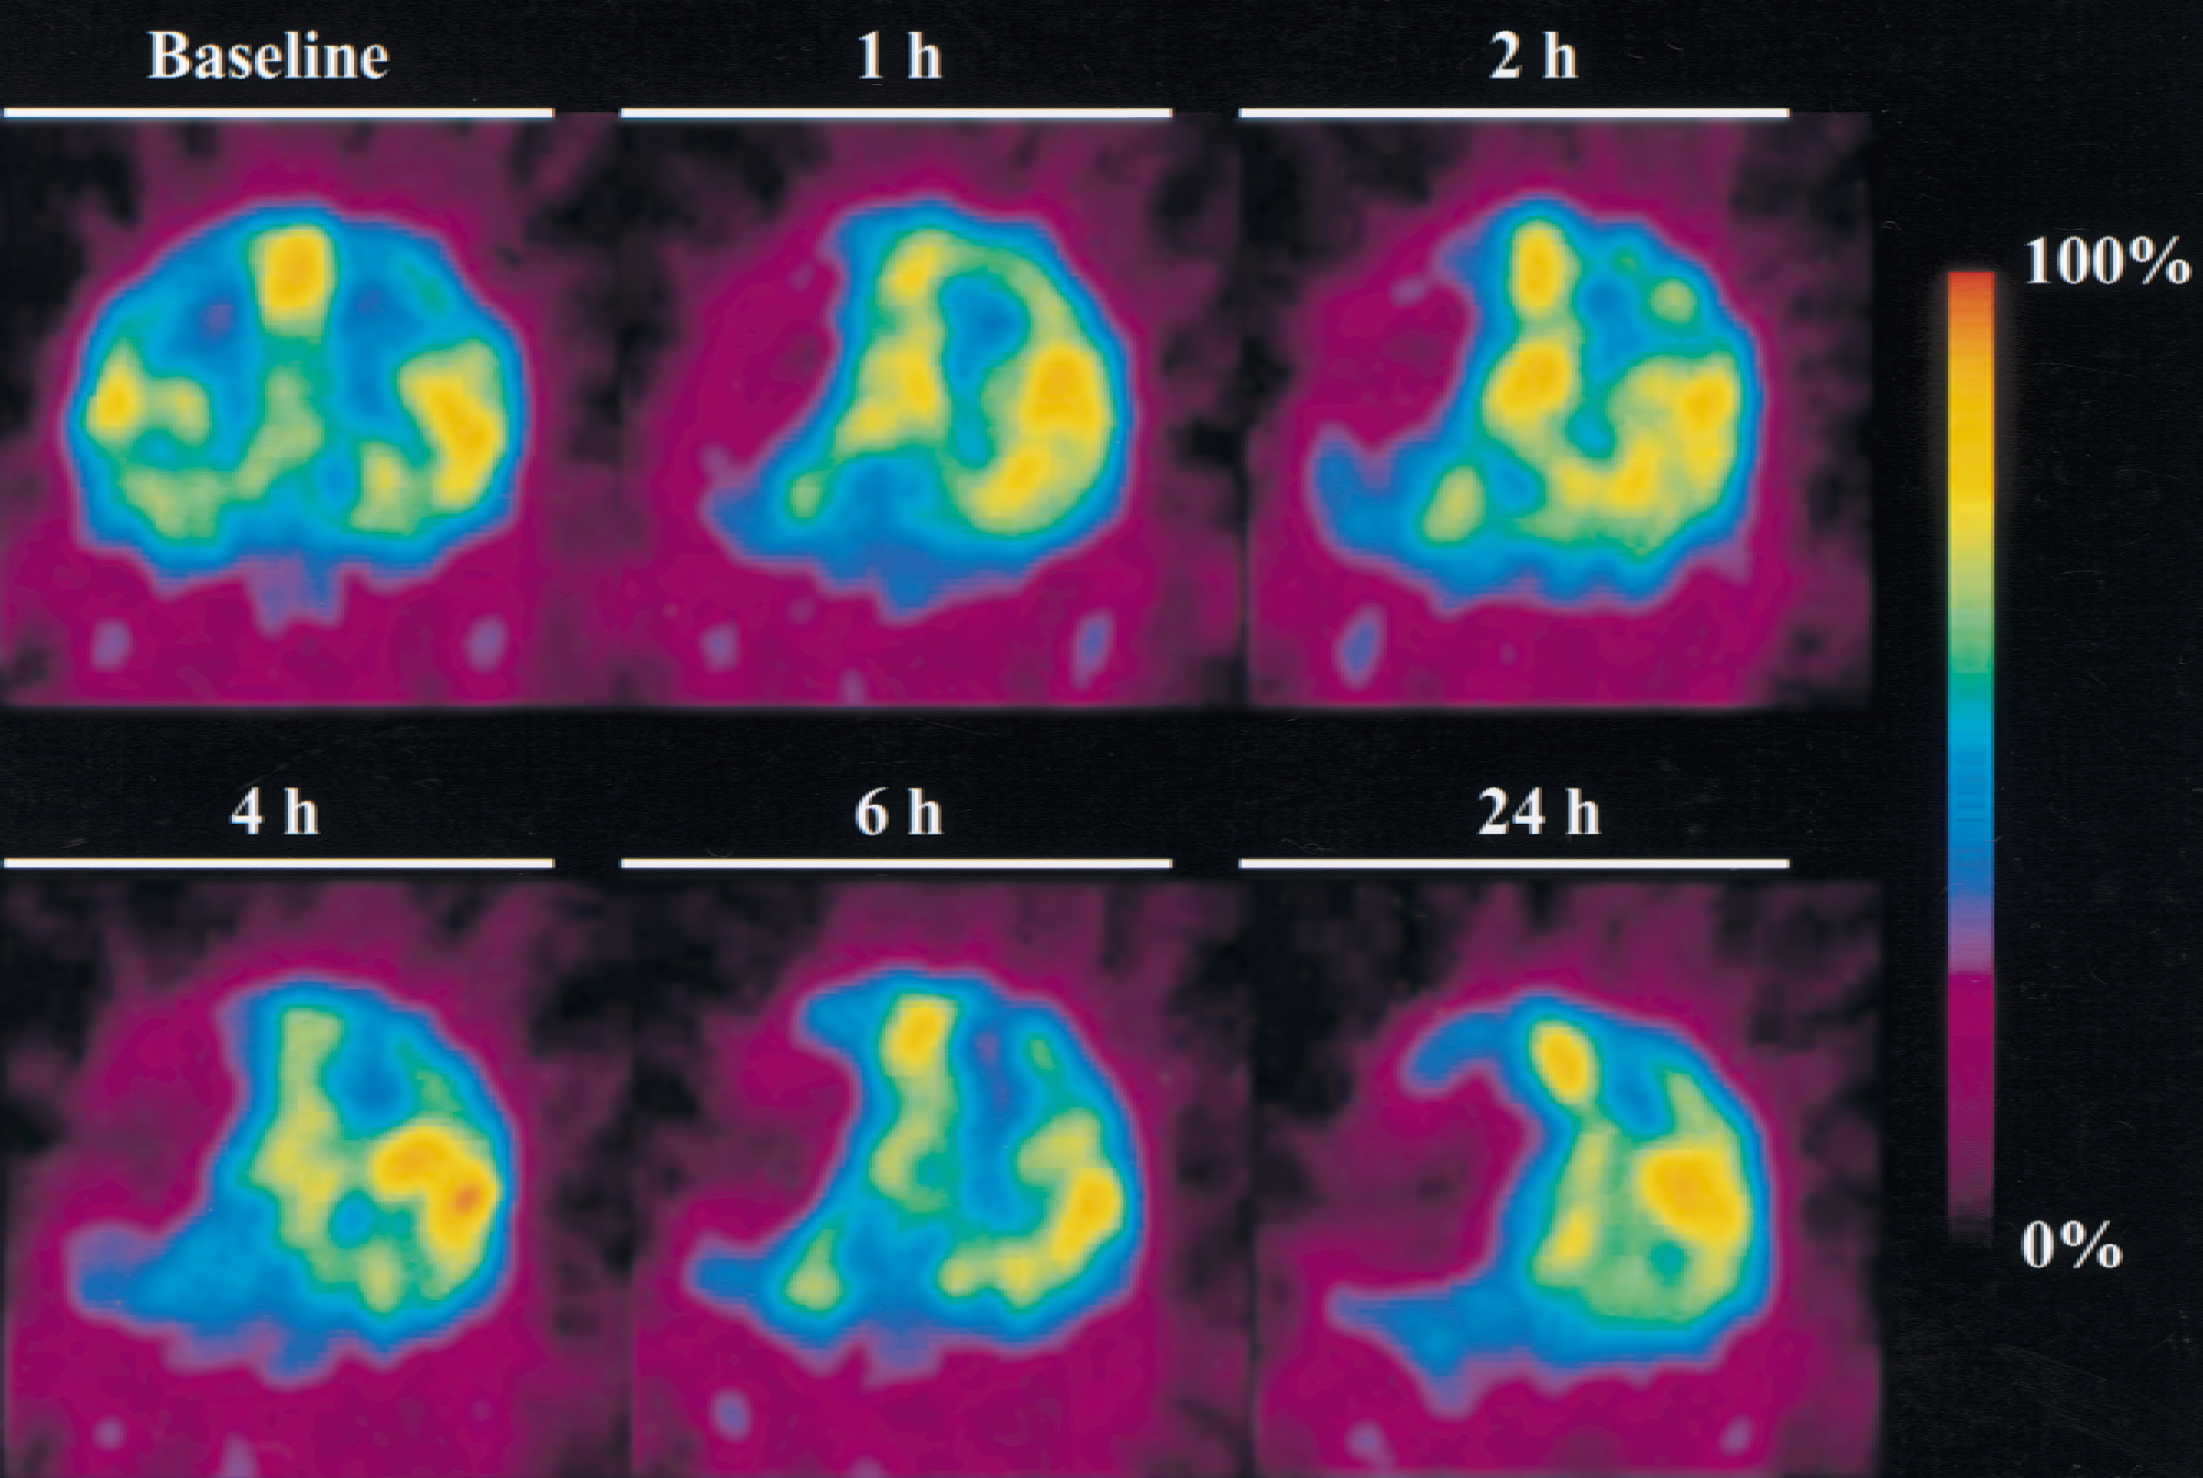
Representative images of time courses of cerebral blood flow (CBF) changes for a coronal slice at the striatum level (approximately 32 mm from the frontal pole). Cerebral blood flow was measured before (baseline) and 1, 2, 4, 6, and 24 hours after embolization. The maximum CBF value in each positron emission tomography measurement was indicated as 100%.
After the clot injection, a marked hypoperfusion developed throughout the MCA territory (Fig. 2). Figure 3 shows serial changes in the AIs for CBF. One hour after the clot injection, the AIs in the temporal cortex decreased to 0.22 to 0.38, which were significantly less than those for baseline CBF (P < 0.0001; AI at baseline vs. AI at 1 hour). Subsequently, the AIs in these regions decreased gradually to 0.14 to 0.18 twenty-four hours after the clot injection. In the basal ganglia of slices 1 and 2, CBF was significantly reduced after embolization (P < 0.0001; AI at baseline vs. AI at 1 hour). The AIs in these regions were 0.34 to 0.46 at 1 to 6 hours, which decreased further to 0.22 to 0.25 twenty-four hours after the clot injection. In the thalamus of slice 3, no significant changes in the AIs were observed during the experimental period of 24 hours, except for the significantly but slightly higher AI observed at 6 hours after embolization. The AIs in the parietal cortex were 0.43 to 0.51 one hour after the clot injection, which were significantly less than those for baseline CBF (P < 0.0001; AI at baseline vs. AI at 1 hour). Subsequently, the AIs in the parietal cortex increased gradually to 0.57 to 0.65 twenty-four hours after the clot injection (Fig. 3).
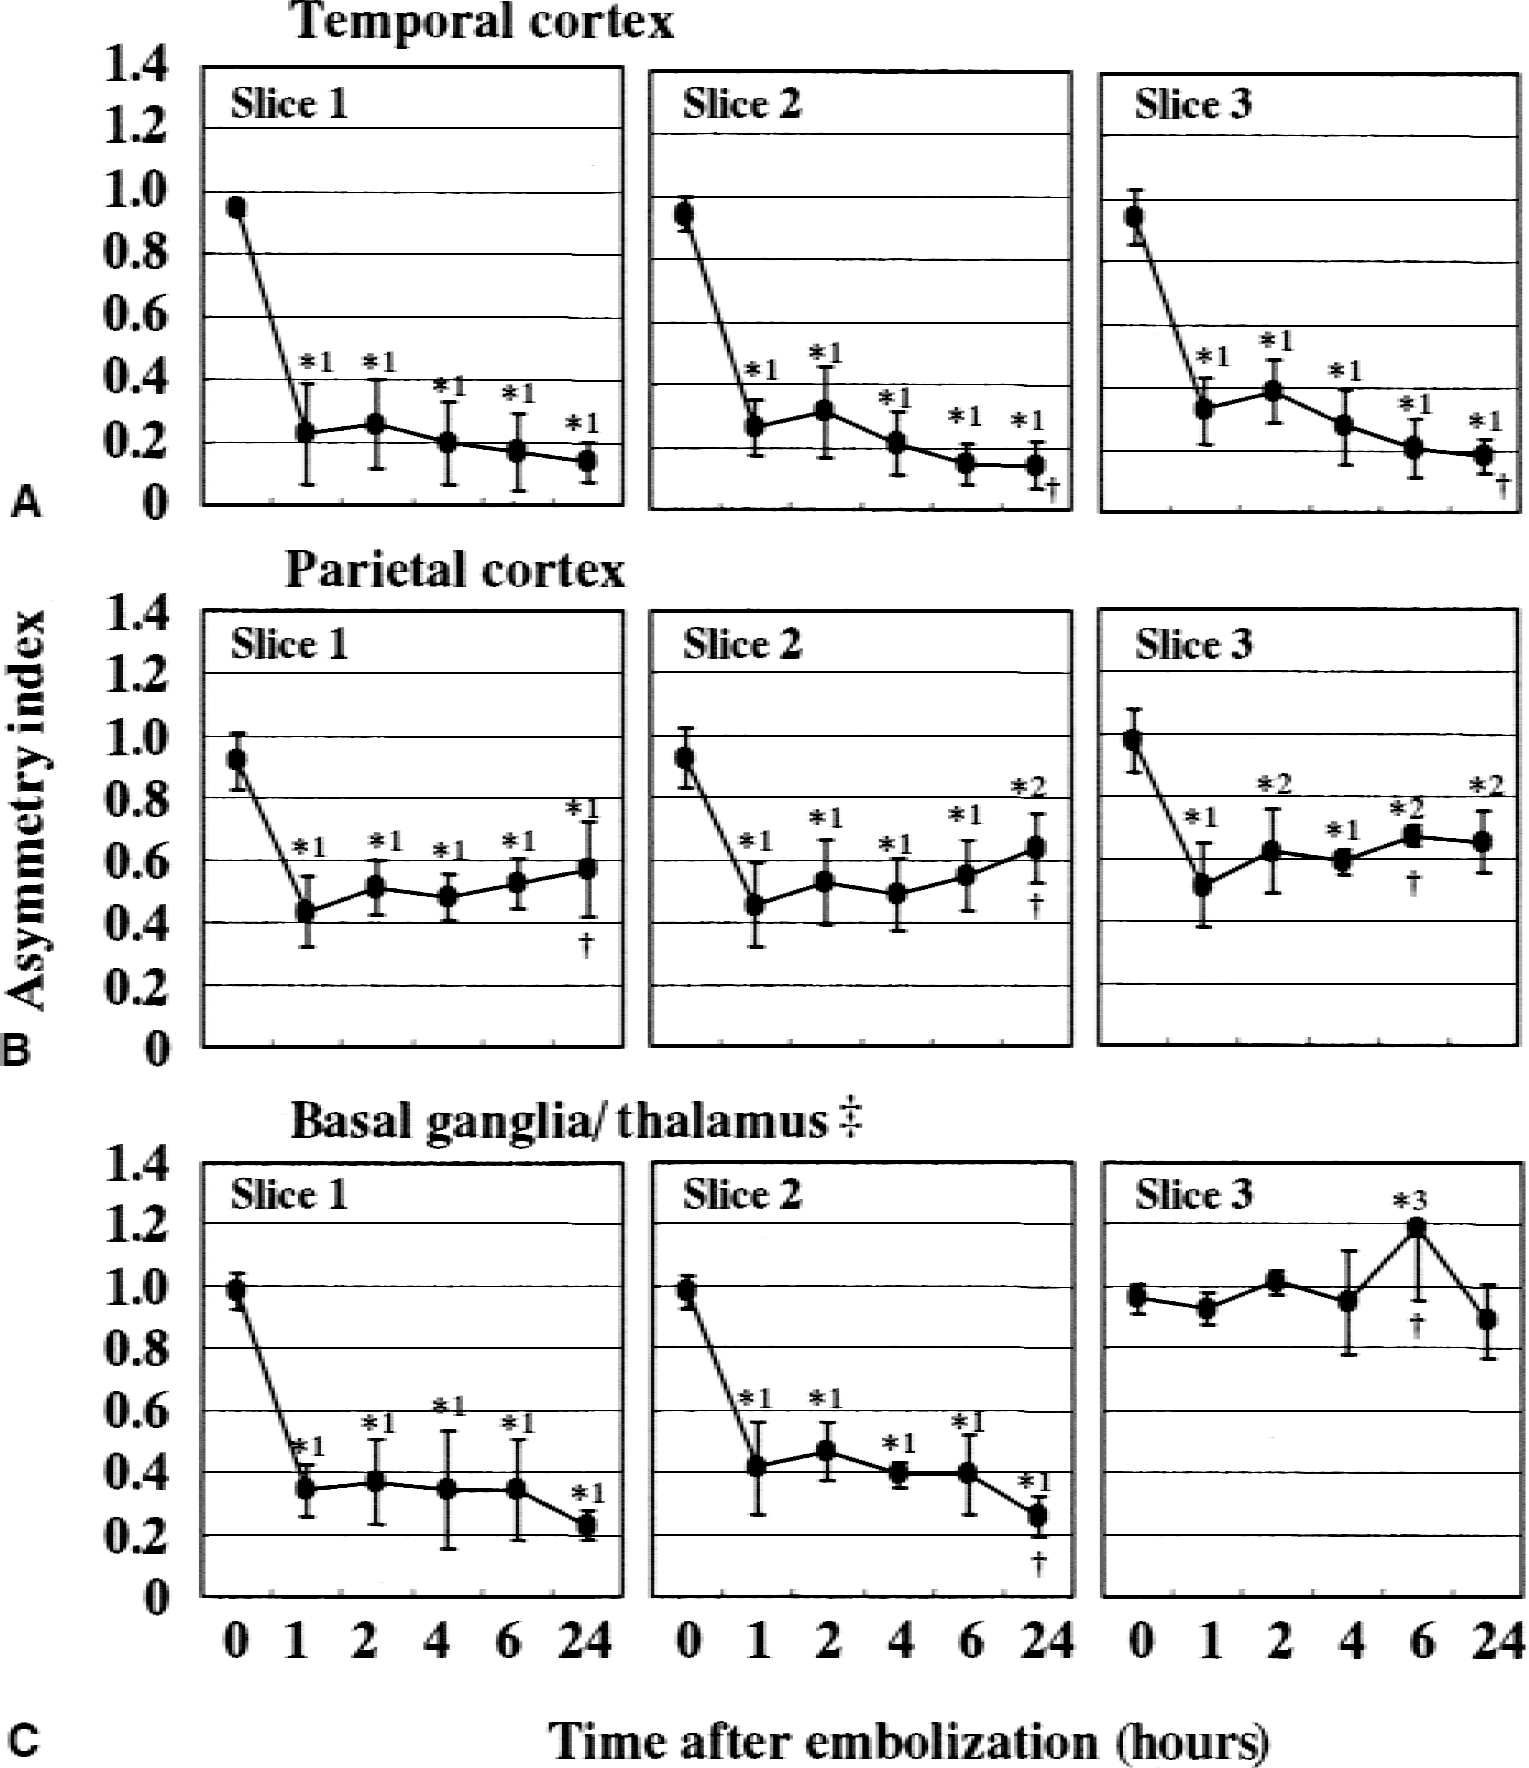
Time course of asymmetry indices (AIs) for cerebral blood flow (CBF) in various regions of interest. Data are the mean ± SD of four animals. Regions of interest are shown in Fig. 1. Asymmetry indices for baseline CBF are shown as 0-h values. ‡Slice 1 and 2 primarily contain basal ganglia and slice 3 primarily contains thalamus. *Significantly different from the AI for the baseline CBF (1: P < 0.0001, 2: P < 0.001, 3: P < 0.05). †Significantly different from the AI for the CBF 1 hour after embolization (P < 0.
Cerebral metabolic rate of glucose
Twenty-four hours after the ischemic insult, CMRglc was significantly reduced in most of the ipsilateral temporal cortex (P < 0.0001) and the basal ganglia (P < 0.0001) compared with the contralateral regions (Figs. 4 and 5, Table 2). The AIs were 0.34 to 0.53 and 0.38 to 0.39 for the temporal cortex and the basal ganglia, respectively. In the ipsilateral parietal cortex, CMRglc significantly increased compared with that in the contralateral regions (P < 0.05), with AIs of 1.17 to 1.35 (Figs. 4 and 5, Table 2).
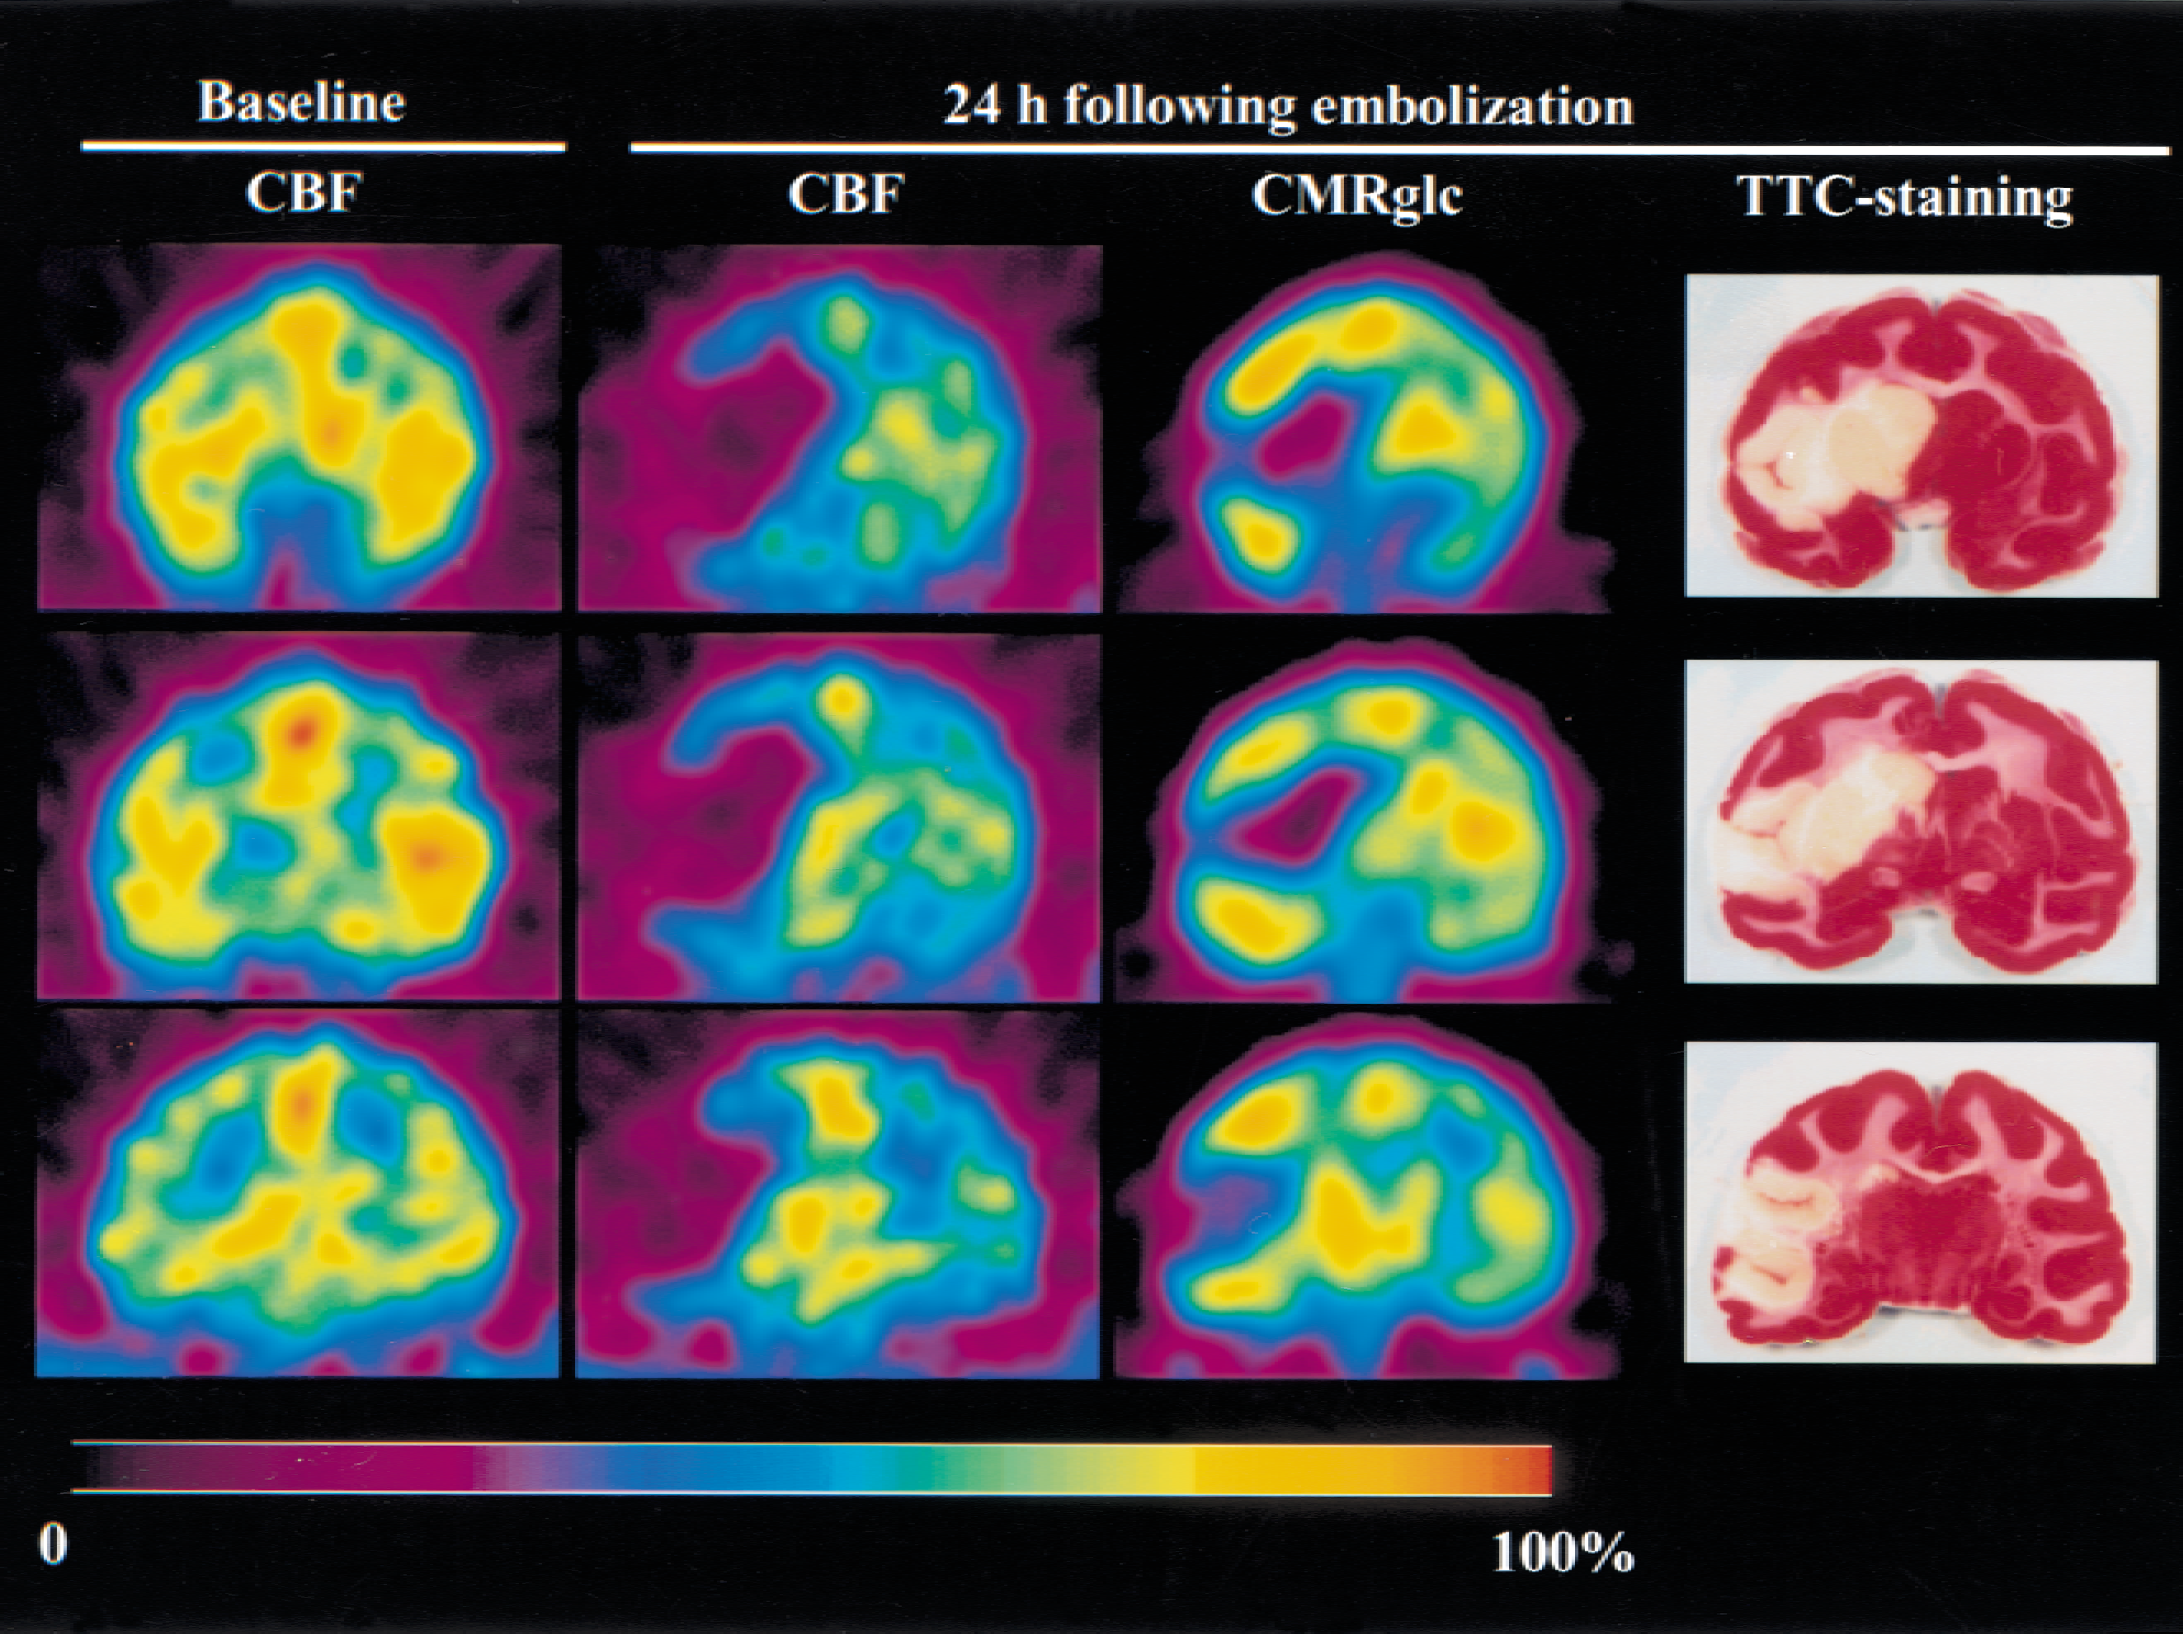
Representative images of cerebral blood flow (CBF), cerebral metabolic rate of glucose (CMRglc), and 2,3,5-triphenyltetrazolium chloride (TTC) staining for three coronal slices from the striatum to the thalamus level. Slices are approximately 23 (slice 1), 32 (slice 2), and 41 (slice 3) mm from the frontal pole.
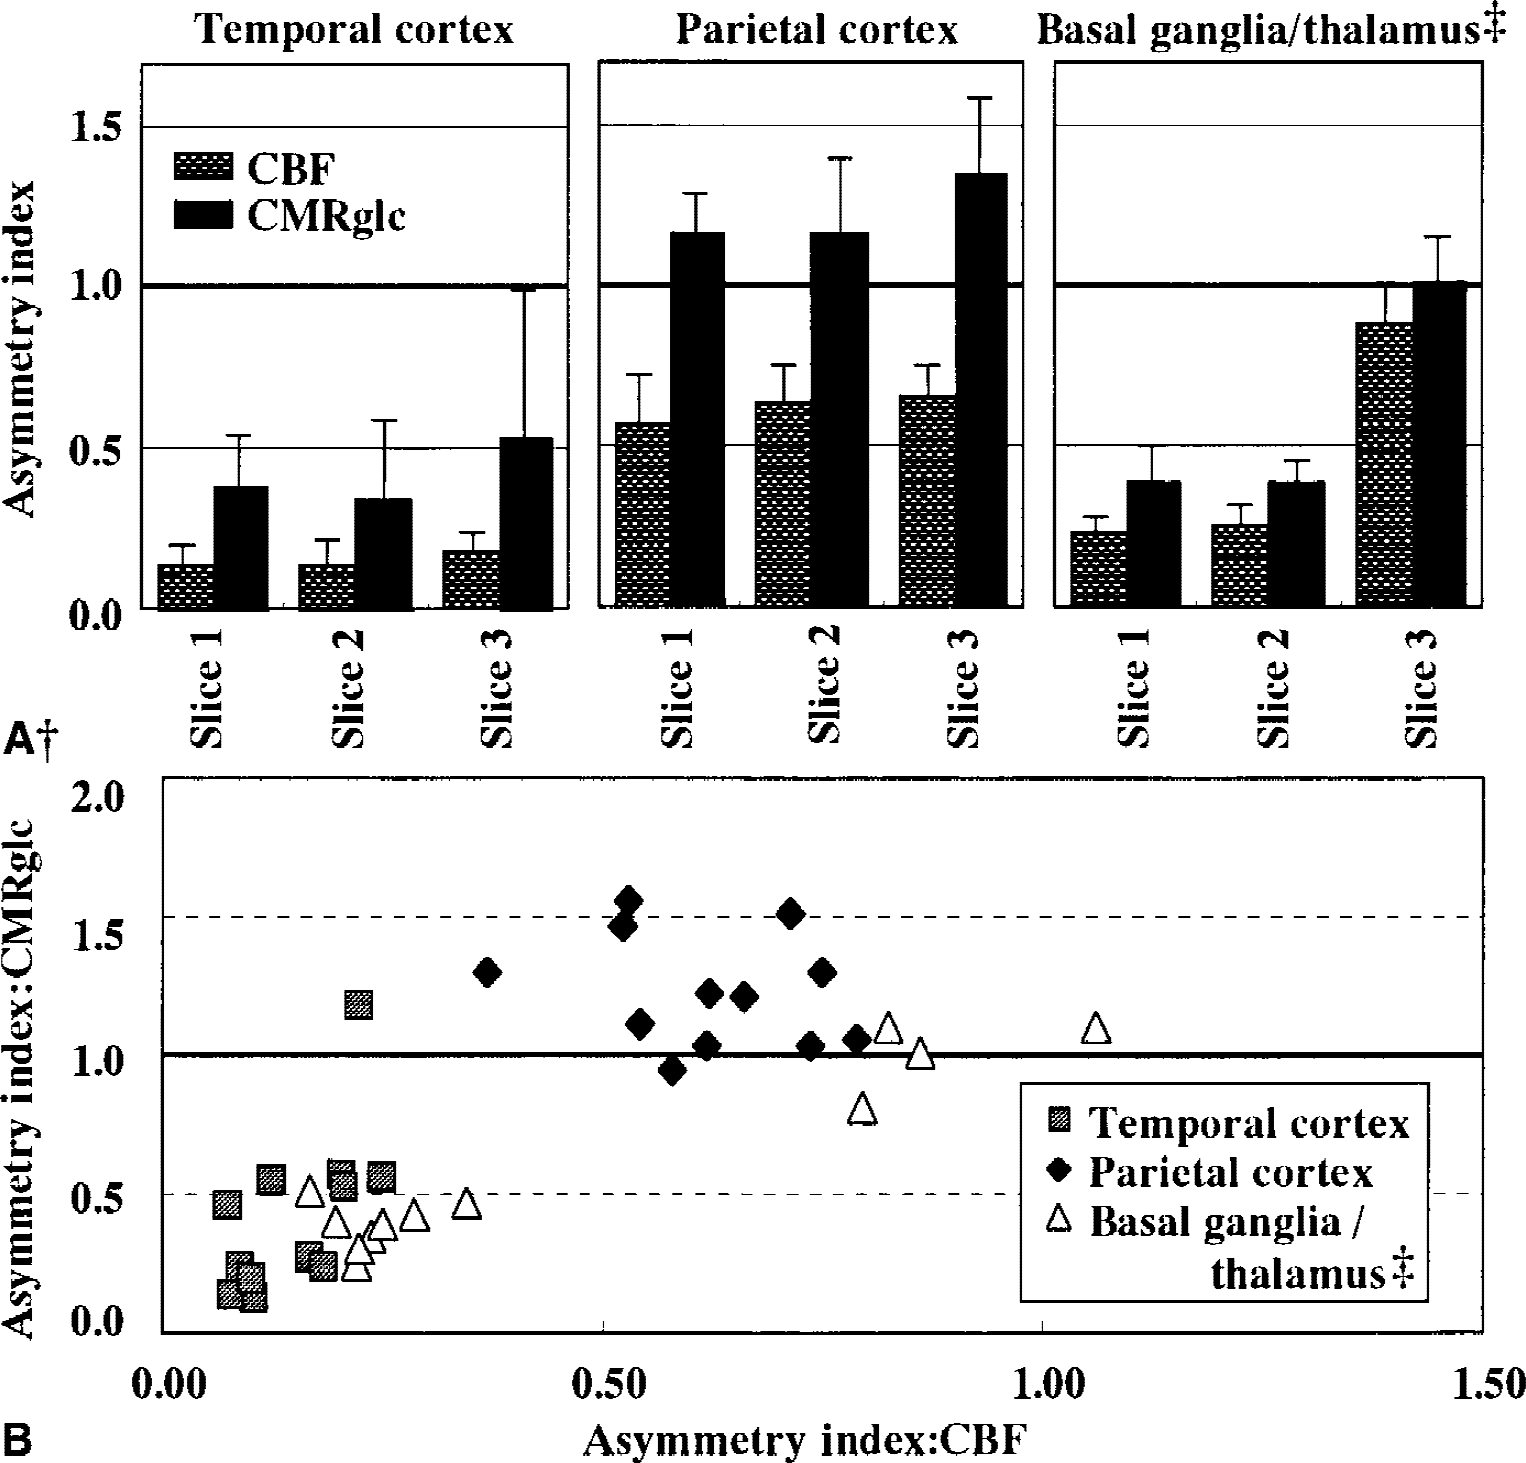
Asymmetry indices (AIs) for
Values of CMRglc and their asymmetry indices 24 hours after embolization
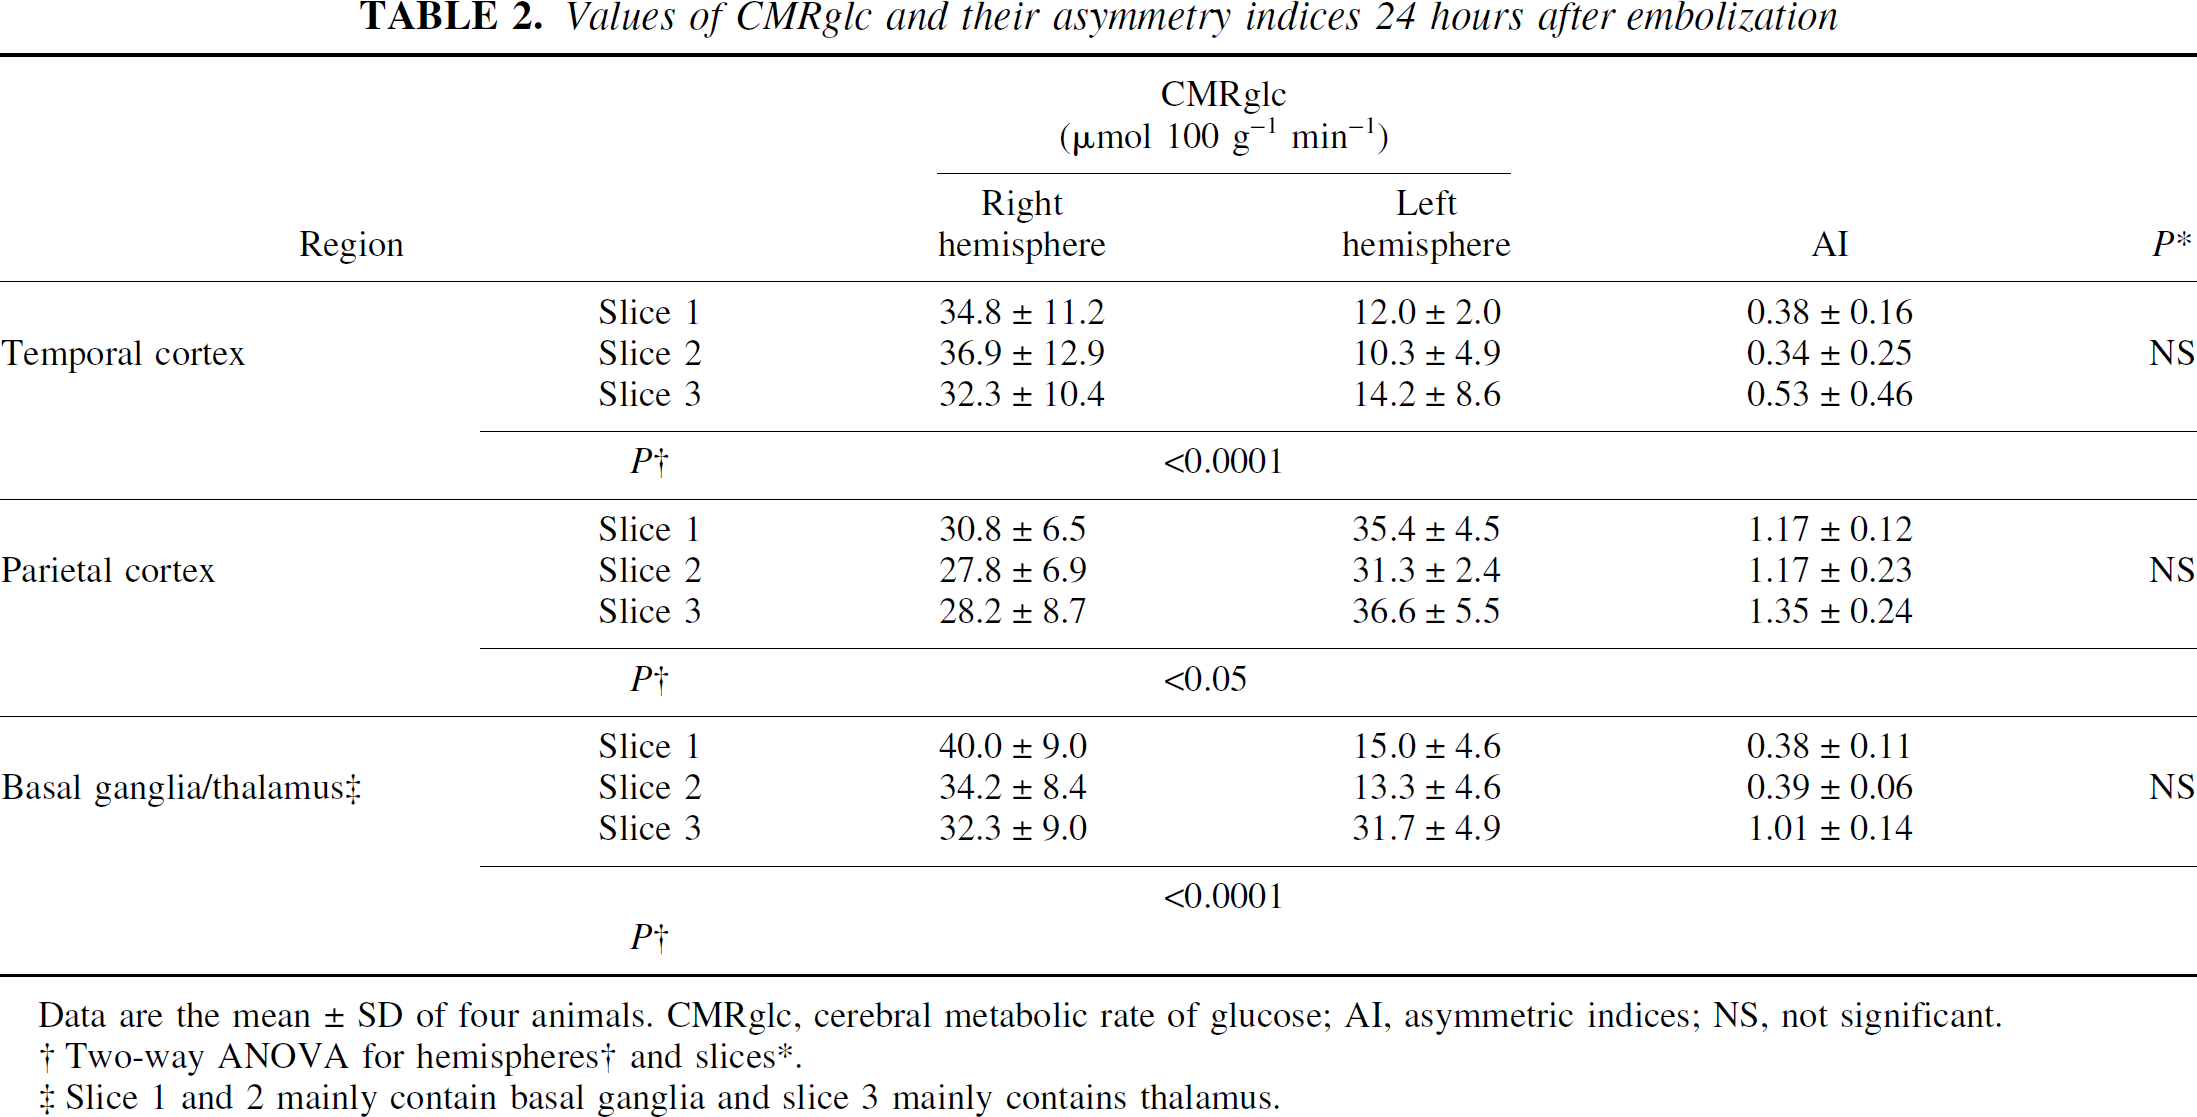
Data are the mean±SD of four animals. CMRglc, cerebral metabolic rate of glucose; AI, asymmetric indices; NS, not significant.
Two-way ANOVA for hemispheres† and slices*.
Slice 1 and 2 mainly contain basal ganglia and slice 3 mainly contains thalamus.
CBF-CMRglc relation
Twenty-four hours after embolization, AIs for CBF were <0.25 in the temporal cortex and the basal ganglia (Figs. 3 and 5A). In these regions, AIs for CMRglc also significantly decreased (Fig. 5A, Table 2). In the parietal cortex, AIs for CBF were significantly decreased, whereas those for CMRglc increased (Fig. 5A). The difference in AI between CBF and CMRglc in the parietal cortex was statistically significant (P < 0.0001). Figure 5B shows the relation between AI for CBF and that for CMRglc in various regions of interest. In the regions where CBF was severely impaired (AI < 0.4), most of the AIs for CMRglc were also reduced. In the regions where CBF was moderately reduced (0.4 < AI < 0.8), CMRglc increased and most of the AIs for CMRglc were greater than 1.0.
TTC staining
Figure 4 shows representative images of TTC-stained tissue specimens. All monkeys developed infarcted lesions as indicated by being unstained with TTC in the left MCA territory. Lesions were detected predominantly in the temporal cortex and the basal ganglia, including the insula cortex, superior temporal gyrus, caudate, globus pallidus, and putamen. No obvious lesions were observed in the parietal cortex aside from those observed around the pre- and postcentral gyrus and supramarginal gyrus.
DISCUSSION
The results of this study can be summarized as follows: (1) one hour after embolization, CBF in the temporal cortex and the basal ganglia decreased to <40% of the contralateral values. In these regions, regarded as an ischemic core, CBF decreased further with time and at 24 hours CMRglc also decreased. TTC-unstained lesions were consistently observed in these regions. (2) In the parietal cortex and several regions surrounding the ischemic core, CBF was >40% of the contralateral values 1 hour after embolization and recovered gradually during the course of the experiment (ischemic penumbra). In these regions, CMRglc at 24 hours increased compared with that in the contralateral regions, showing the uncoupling of CBF and CMRglc. No obvious TTC-unstained lesions were detected in these regions.
In the temporal cortex (slices 1 to 3) and the basal ganglia of slices 1 and 2, CBF decreased to less than approximately 40% of contralateral values 1 hour after embolization (Fig. 3). Most of these regions became infarcted 24 hours after embolization, suggesting these regions for an ischemic core. In the parietal cortex (slices 1 to 3), CBF was relatively preserved (>40% of contralateral values, Fig. 3) with no obvious TTC-unstained lesions at 24 hours. Thus, flow thresholds for the infarct development were considered to be approximately 12 to 15 mL 100 g−1 min−1 (approximately 40% of contralateral values) in the primate model of permanent occlusion. The flow thresholds for infarct development have been extensively studied in experimental animals and humans (Heiss and Graf, 1997). Jones et al. (1981) reported that large infarcts developed with residual flow less than 10 to 12 mL 100 g−1 min−1 for 2 to 3 hours of temporary occlusion or less than 17 to 18 mL 100 g−1 min−1 for permanent occlusion in awake monkeys using a hydrogen clearance technique and a snare occlusion method of the MCA. Yonas et al. (1988, 1990) demonstrated with a Xe-CT method that CBF less than 8 to 10 mL 100 g−1 min−1 for 6 hours or shorter periods results in infarcts in the involved region using anesthetized baboons with selective occlusion of the lateral striate arteries by electro-coagulation. The thresholds found in the current study are consistent with those in the literature (Jones et al.,1981; Yonas et al., 1988, 1990). In several studies of permanent (Tenjin et al., 1992; Pappata et al., 1993; Touzani et al., 1995; Takamatsu et al., 2000) and temporary (Young et al., 1996; Touzani et al., 1997; Takamatsu et al., 2000) occlusions of the MCA in nonhuman primates, acute changes in hemodynamics and oxygen metabolism were observed by PET. In a baboon model of the MCA occlusion with microvascular clips (Pappata et al., 1993; Touzani et al., 1995), the hemispheric CBF in the occluded side was 40% to 70% of that in the contralateral side within several hours after the occlusion. However, in monkey models with snare ligature (Tenjin et al., 1992) or microvascular clips (Takamatsu et al., 2000), the CBF in the ischemic core was less than 40% of that in the contralateral hemisphere in the acute phase up to several hours after the occlusion. The acute reduction in CBF observed in the current study was slightly severe compared with those reported by Pappata et al. (1993) and Touzani et al. (1995), but was consistent with those reported by Tenjin et al. (1992) and Takamatsu et al. (2000). This discrepancy may be partially attributed to the differences in the species, anesthesia, occlusion method, and ROIs used in each study.
This study demonstrated an elevated glucose metabolism and an uncoupling of flow and glucose metabolism in several regions surrounding the ischemic core (CBF: 40% to 80% of contralateral values; Figs. 4 and 5, Table 2), which was confined to the ipsilateral cortex and was most prominent at the anterior and posterior parietal cortices. In other studies, an elevated glucose metabolism and an uncoupling of flow and metabolism were observed in the arterial borderzone during several hours of acute ischemia (Ginsberg et al., 1977, Tanaka et al., 1985; Hasegawa et al., 1990; Back et al., 1995) and were regarded as factors contributing to infarct development (Tanaka et al., 1985; Back et al., 1995). However, these results were obtained primarily from experiments in rodents and cats. In primates, the relation between CBF and CMRglc and its contribution to infarct development are still unclear. In this study, the elevated glucose metabolism and uncoupling of flow and metabolism were observed 24 hours after the embolization. These observations indicate that CBF is inadequate relative to the metabolic energy demand of viable tissue (Heiss and Graf, 1997). The uncoupling of flow and metabolism may indicate the relatively long time window for the eventual recovery of tissue in the primates (Touzani et al., 1995; Heiss and Graf, 1997). It is also notable that CBF was relatively preserved and recovered gradually during the course of the experiment in the regions where the uncoupling was observed (Fig. 3). Therapeutic strategies affecting pathologic biochemical mechanisms in the process of ischemic cell damage are necessary after CBF has been at least partially restored by collateral perfusion, spontaneous reperfusion, or therapeutic intervention (Heiss and Graf, 1997).
The mechanisms underlying the elevated glucose metabolism and the process of uncoupling of flow and metabolism are incompletely understood. Anaerobic glycolysis and spreading depression are proposed as factors contributing to elevated glucose metabolism in early stages (Ginsberg et al., 1977; Shinohara et al., 1979; Tanaka et al., 1985; Hasegawa et al., 1990; Back et al., 1995; Kuge et al., 2000). Postischemic seizures may be another explanation for the elevated glucose metabolism (Reith et al., 1997). In humans, elevated glucose metabolism was observed not only during acute ischemic stages, but also during subacute stages. Invasion by macrophages may contribute to the elevated glucose metabolism in subacute stages (Heiss and Herholz, 1994).
It has been suggested that the 2-deoxyglucose model may produce erroneous values of CMRglc when CBF falls to less than 10 mL 100 g−1 min−1 (Tanaka et al., 1985), because depletion of tissue glucose alters the lumped constant of the operational equation for local glucose utilization (Phelps et al., 1979; Sokoloff et al., 1977). The alterations of CMRglc values because of the altered lumped constant, however, are relatively small (approximately 8% at CBF of 5 mL 100 g−1 min−1) (Tanaka et al., 1985). Consequently, it seems to be possible to properly evaluate the results herein even with the CMRglc values calculated without correction for the altered lumped constant. In particular, the elevated CMRglc observed in this study is obviously true, because such alterations of lumped constants result in the underestimation of CMRglc (Tanaka et al., 1985; Hasegawa et al., 1990; Back et al., 1995).
>These PET experiments were performed under sevoflurane anesthesia, a volatile anesthetic with a low blood gas partition coefficient. Yoshikawa et al. (1997) measured CBF in monkeys under 1.5% and 3.0% sevoflurane anesthesia and found that the mean CBF was 32.8 ± 7.5 and 30.6 ± 5.7 mL 100 g−1 min−1, respectively. It also has been reported that sevoflurane decreased CMRglc in rats (Lenz et al., 1998). The authors' baseline CBF was consistent with those reported by Yoshikawa et al. (1997), and the CBF and CMRglc values appear to be physiologically appropriate under mild hyperventilation and a low dose sevoflurane anesthesia.
In the current study, the authors did not determine detailed neurologic outcome of the animals. The global neurologic state 24 hours after embolization, however, was similar to or slightly better than that reported in the authors' previous paper (Kito at al., 2001).
The authors demonstrated serial changes in CBF, an elevated glucose metabolism, and a CBF-CMRglc uncoupling in a primate model of thromboembolic stroke using high-resolution PET. To the best of their knowledge, this is the first report demonstrating the elevated glucose metabolism and CBF-CMRglc uncoupling in primate models of ischemic stroke. Positron emission tomography investigations of this model provide better understanding of the pathophysiology of human ischemic stroke than did studies with stroke models in small animals and will help establish therapeutic strategies for acute stroke patients, although further studies (including reperfusion and thrombolysis study with this primate model) are needed to confirm its relevance as a model for drug development studies.
Footnotes
Acknowledgment
The authors thank Mr. Norimasa Ejima for his technical assistance.