
Abstract
The acute and delayed effects of anoxia on synaptic transmission and long-term potentiation (LTP) were examined in the CA1 region of rat hippocampal slices. Oxygen deprivation for 20 minutes completely but reversibly depressed excitatory postsynaptic potentials mediated by both N-methyl-
Excessive or sustained activation of N-methyl-
The NMDAR are involved not only in delayed neuronal toxicity, but also in the induction of long-term potentiation (LTP) in the CA1 hippocampal region (Collingridge et al., 1983). However, untimely activation of NMDAR either by perfusion of low-magnesium solutions (Coan et al., 1989) or weak tetanic stimuli (Huang et al., 1992) diminishes the ability of a strong tetanus to evoke lasting synaptic enhancement. Additionally, low concentrations of NMDA or agonists at NMDAR inhibit LTP (Izumi et al., 1992b). The inhibitory effects of NMDA on LTP are blocked by NOS inhibitors and hemoglobin (Izumi et al., 1992c), suggesting that NO released by low-level NMDAR activation plays a key role in the inhibition (Zorumski and Izumi 1993). Consistent with this, administration of NO releasers inhibits LTP induction when a tetanus is delivered more than 1 hour after drug washout (Izumi and Zorumski, 1993).
These observations suggest that NMDAR-mediated neurotoxicity and NMDAR-mediated LTP inhibition share common features, and that there may be pathologic conditions in which activation of NMDAR impairs neuronal function in the absence of neurodegeneration. During hypoxia or ischemia, endogenous excitatory amino acids (EAA) are released extracellularly (Hegstad et al., 1996; Lobner and Lipton, 1993; Rothman, 1983). Ultimately, these EAA participate in a cascade of events leading to neuronal death. However, brief bouts of hypoxia may produce changes in EAA levels or EAA receptor function that could alter mechanisms involved in synaptic plasticity, either before or in the absence of substantial neuronal damage. Consistent with this view, brief episodes of brain hypoxia and ischemia have been reported to impair learning and memory in the absence of significant neuronal loss (Ando et al., 1987). This raises the possibility that the increases in extracellular EAA interfere with processes required for memory formation, perhaps through altered NMDAR function. Because LTP is a cellular mechanism believed to be involved in certain types of memory, we examine the effects of oxygen deprivation on synaptic transmission and LTP generation in the CA1 region of rat hippocampal slices.
MATERIALS AND METHODS
Slices from 76 male albino rats (postnatal day 30 ± 2, body weight 99.5 ± 22.4 g) were prepared from the septal half of the hippocampus using standard techniques (Zorumski et al., 1996). Rats were anesthetized with halothane and decapitated. The hippocampus was quickly dissected into gassed (95% oxygen–5% carbon dioxide) artificial cerebrospinal fluid (ACSF) containing (in millimolars): 124 NaCl, 5 KCl, 2 CaCl2, 22 NaHCO3, 1.25 NaH2PO4, 2 MgSO4, and 10 glucose at a cold temperature (4° to 6°C). Transverse slices (500-μm thick) were cut with a Campden vibratome (Campden Instruments Ltd, Sileby, Loughborough, U.K.). After recovery for at least 1 hour at 30°C in an incubation chamber, each slice was submerged in a constant flow (2 mL/min) recording chamber and maintained at 30°C during the course of the experiment. During periods of oxygen deprivation, the bath solution was changed to one of the same composition as the control ACSF but gassed with 95% nitrogen and 5% carbon dioxide.
Extracellular recordings were obtained from the apical dendritic layer of the CA1 region using 5 to 10 mΩ glass electrodes filled with 2 mol/L NaCl. Evoked synaptic responses were elicited with 0.1- to 0.2-millisecond constant current pulses through a bipolar electrode placed in the Schaffer collateral–commissural pathway. Excitatory postsynaptic potentials (EPSP) were monitored by applying single test pulses every minute at an intensity sufficient to evoke 50% to 60% of the maximal EPSP amplitude based on control input–output curves. The EPSP monitoring was interrupted 20 and 90 minutes after reoxygenation, and 20 and 60 minutes after tetanic stimulation to obtain complete input–output curves. The protocol for LTP induction consisted of a single electrical tetanus for 1 second at 100 Hz with the same intensity of stimulus used to monitor EPSP. The degree of synaptic enhancement reported in the text was measured as the change in the EPSP slope at the 50% point on the EPSP input–output curve 60 minutes after tetanic stimulation compared with the value obtained 10 to 20 minutes before the tetanus. Values in the text represent means ± SD. Only a single slice from each hippocampus was used for each group of experiments. The Mann-Whitney U test and Student's t test were used for comparisons between groups.
For histologic assessment, some slices were fixed in 1% paraformaldehyde and 1.5% glutaraldehyde overnight, embedded in araldite, cut into 1-μm sections, and stained with methylene blue and azure II (Izumi et al., 1996).
6,7-Dinitroquinoxaline-2,3-dione (DNQX) and 2-amino-5,6-dihydro-6-methyl-4H-1,3-thiazine were purchased from Tocris Cookson (St. Louis, MO, U.S.A.), and 7-nitroindazole (7-NIA) was obtained from Research Biochemicals International, Inc. (Natick, MA, U.S.A.). Other chemicals were obtained from Sigma Chemical Co. (St. Louis, MO, U.S.A.). Nifedipine and DNQX were dissolved in ethanol (20 mmol/L) and NaOH (30 mmol/L), respectively.
RESULTS
The EPSP mediated by non-NMDAR were depressed completely by 20 minutes' substitution of nitrogen for oxygen in ACSF. However, during the 20-minute period of oxygen deprivation, hypoxic injury potentials (Fairchild et al., 1988, Rader and Lanthorn, 1989; Wallis et al., 1992) were not observed and reoxygenation was accompanied by full restoration of EPSP to baseline levels within 20 minutes. After reoxygenation, EPSP remained stable for at least 100 minutes (EPSP changes after 90 minutes of reoxygenation: −0.6 ± 7.8%, N = 5). The failure to observe hypoxic depolarization and the full recovery of EPSP after reoxygenation indicate that the initial synaptic depression did not result from irreversible neuronal damage. Furthermore, 20 minutes of oxygen deprivation did not produce either acute (N = 3) or delayed histologic neurodegeneration 90 minutes after the insult (N = 4) in the CA1 region of hippocampal slices (Fig. 1).
Histologic appearance of hippocampal slices during and after oxygen deprivation. The photomicrographs depict the appearance of the CA1 region of hippocampal slices during 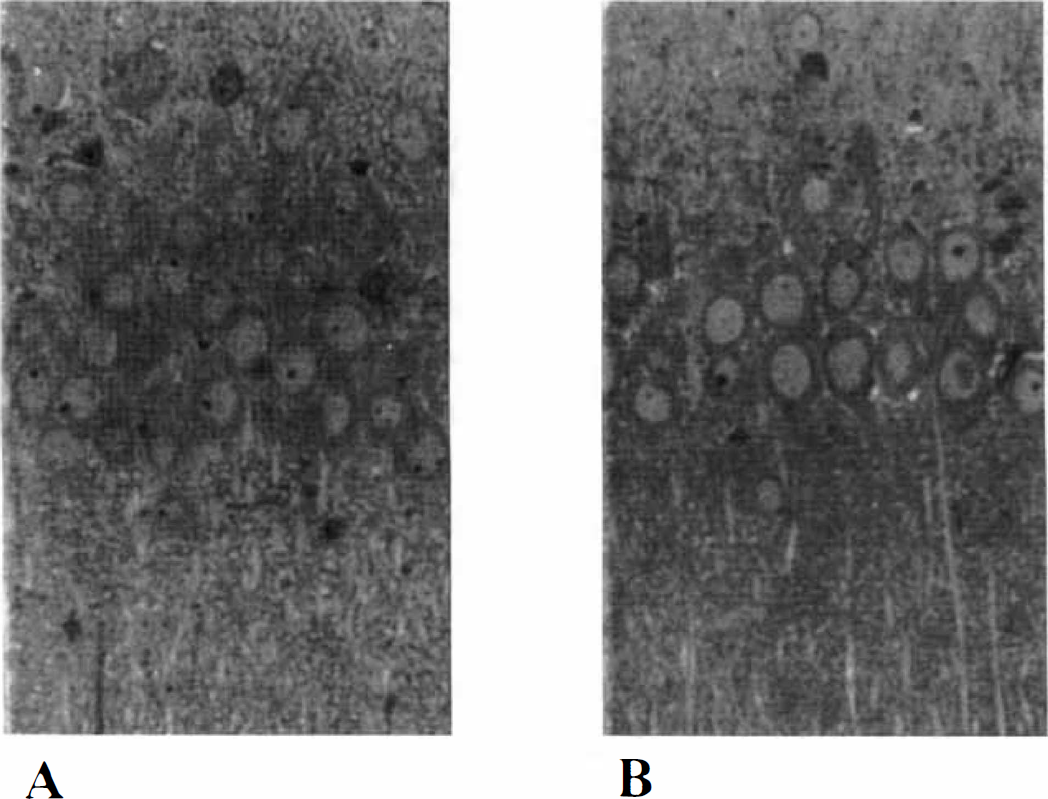
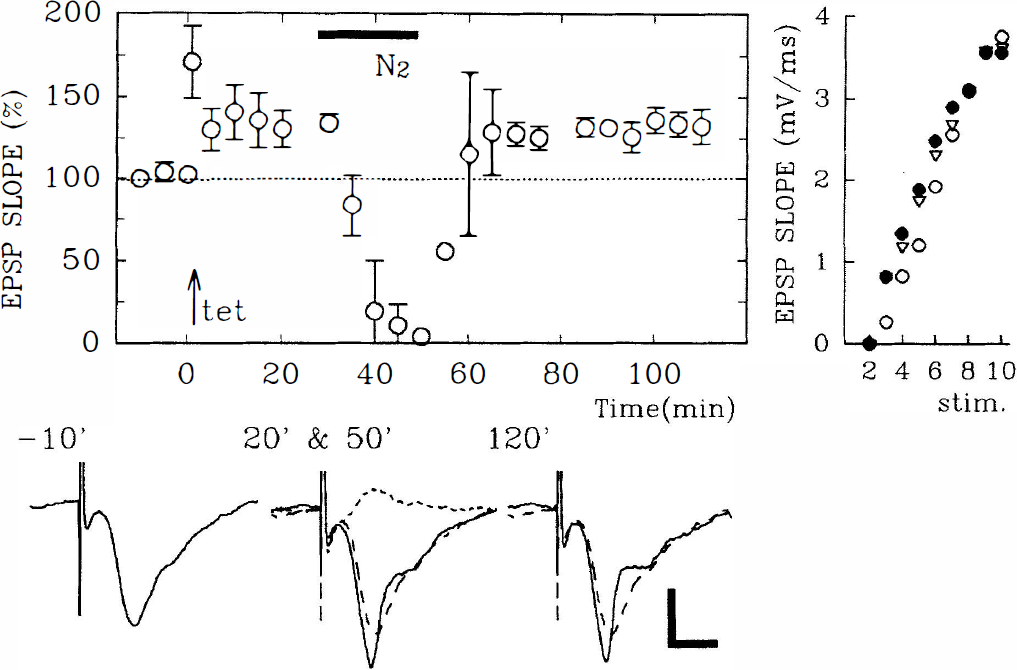
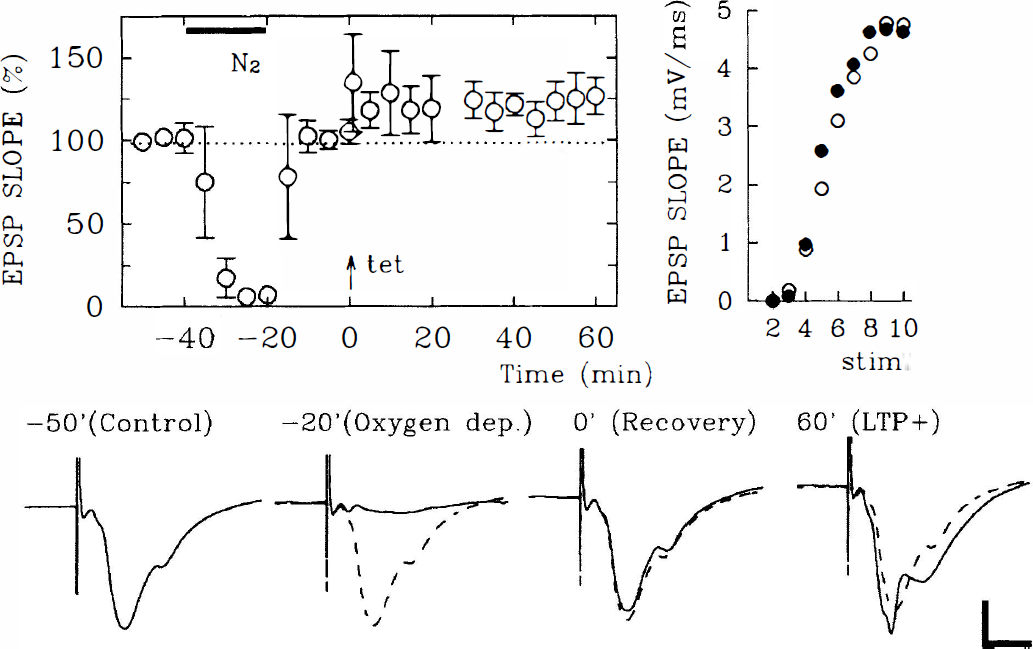
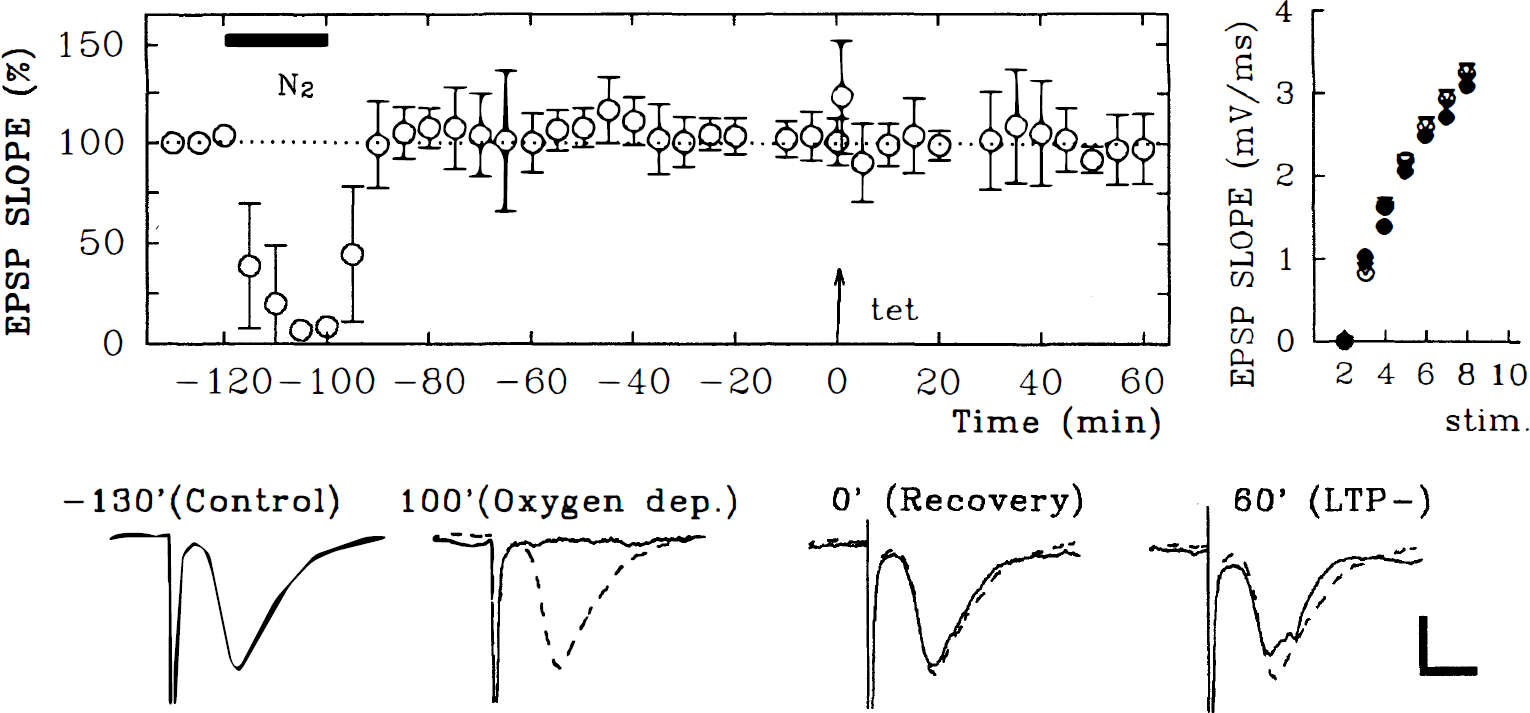
To examine the effects of hypoxia on LTP, nitrogen was substituted for oxygen for 20 minutes at various times before or after the delivery of tetanic stimulation. As reported previously (Arai et al. 1990), oxygen deprivation immediately after tetanic stimulation inhibits LTP (Fig. 2; change in EPSP slope 60 minutes after tetanus: +4.0 ± 3.2%, N = 4). However, oxygen deprivation for 20 minutes starting 30 minutes after tetanic stimulation did not alter previously established LTP (Fig. 3; change in EPSP slope before and 60 minutes after oxygen deprivation: +26.1 ± 7.8 %, +26.1 ± 3.9%, respectively, N = 4). When administered 20 minutes before the delivery of tetanic stimulation, oxygen deprivation failed to block LTP induction completely (Fig. 4; changes in EPSP slope 60 minutes after tetanus: +22.9 ± 4.9%, N = 7), although the degree of potentiation was less than control values obtained in slices not exposed to oxygen deprivation (control LTP: +44.9 ± 28.0% change in EPSP slope, N = 8, P < 0.05). In contrast, LTP was inhibited completely when tetanic stimulation was delivered 100 minutes after reoxygenation (Fig. 5; changes in EPSP slope: +5.1 ± 9.8%, N = 5).
Long-term potentiation (LTP) inhibition by oxygen deprivation immediately after tetanic stimulation. The left graph shows the time course of change (± SD) in excitatory postsynaptic potential (EPSP) slope in slices treated with oxygen deprivation for 20 minutes (denoted as N2, filled bar) immediately after tetanic stimulation. Tetanic stimulation (100 Hz × 1 second) was delivered in all figures at time 0 indicated by an arrow (↑). The traces below the graph show representative EPSP obtained before (left) and 20 minutes (middle) and 60 minutes (right) after tetanic stimulation. Numbers on each trace denote the time that representative EPSP were obtained. Dashed traces in all figures are the initial baseline responses for comparison. Calibration bar: 5 milliseconds, 1 mV. The right graph shows the input–output curves for EPSP slopes obtained before (open circles) and 60 minutes after tetanic stimulation (filled circles) from a single slice. Effects of oxygen deprivation on the maintenance of LTP. The left graph shows the time course of EPSP slope change in slices treated with 20 minutes of oxygen deprivation (filled bar) administered 30 minutes after tetanic stimulation (↑). The traces below the graph show representative EPSP obtained before (left) and 20 minutes (middle) and 120 minutes (right) after tetanic stimulation. A dotted trace in the middle depicts EPSP during oxygen deprivation. Numbers on each trace denote the time that EPSP were obtained. Dashed traces show the initial baseline responses for comparison. Calibration bar: 5 milliseconds, 1 mV. The right graph shows the input–output curves for EPSP slopes obtained before (open circles) and 20 minutes (triangles) and 120 minutes after tetanic stimulation (filled circles) from a single slice. Effects of oxygen deprivation before tetanic stimulation on LTP induction. The left graph shows the time course of changes in EPSP slope in slices treated with 20 minutes of oxygen deprivation (filled bar) 30 minutes before tetanic stimulation (↑). The traces below the graph show representative EPSP obtained before (left) and during (second) oxygen deprivation and before (third) and 60 minutes (right) after tetanic stimulation. Numbers on each trace denote the time that EPSP were obtained. Dashed traces show the initial baseline responses for comparison. Calibration bar: 5 milliseconds, 1 mV. The right graph shows the input–output curves for EPSP slopes obtained before oxygen deprivation (open circles) and 60 minutes after tetanic stimulation (filled circles) from a single slice. LTP inhibition by oxygen deprivation applied 100 minutes before tetanic stimulation. The left graph shows the time course of change in EPSP slope in slices treated with 20 minutes of oxygen deprivation (filled bar). Tetanic stimulation (↑) delivered 100 minutes after oxygen deprivation failed to induce LTP. The traces below the graph show representative EPSP obtained before (left) and during (second) oxygen deprivation and before (third) and 60 minutes (right) after tetanic stimulation. Numbers on each trace denote the time that EPSP were obtained. Dashed traces show the initial baseline responses for comparison. Calibration bar: 5 milliseconds, 1 mV. The right graph shows the input–output curves for EPSP slopes obtained before (open circles), 20 minutes after oxygen deprivation (open triangles), 10 minutes before (filled triangles) and 60 minutes after tetanic stimulation (filled circles) from a single slice. Notice that the maximal responses, as well as the threshold, are not altered.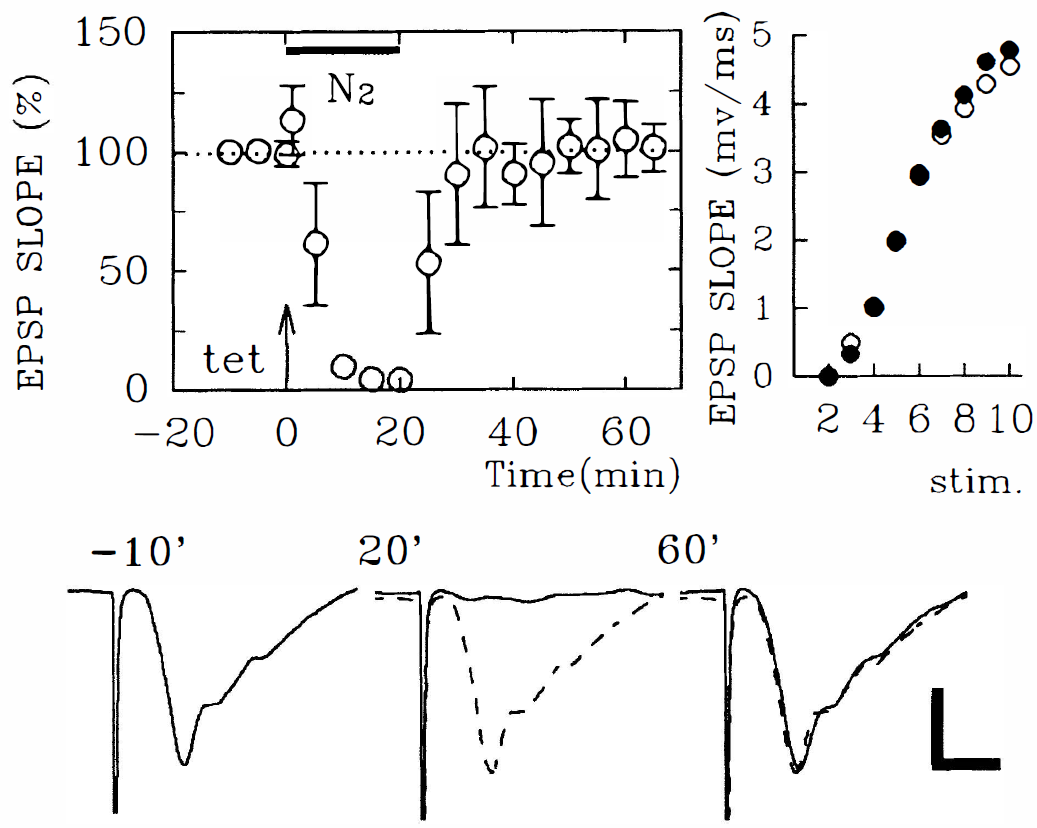
These results suggest that oxygen deprivation alters LTP induction in at least two ways: (1) an acute inhibition occurring during the period immediately after the tetanus, and (2) a delayed inhibition occurring more than 30 minutes after the end of oxygen deprivation. Previously, Arai and others (1990) found that the inhibition of LTP by oxygen deprivation immediately after theta-burst stimulation was blocked by 1,3-dipropyl-8-cyclopentylxanthine (DPCPX), an adenosine A1 receptor antagonist. However, we observed that delayed LTP inhibition was not blocked by DPCPX. In the presence of 200 nmol/L DPCPX, oxygen deprivation for 20 minutes produced only partial depression of EPSP, suggesting that adenosine release during hypoxic conditions contributes to acute synaptic depression (Fig. 6). Despite the preservation of EPSP during oxygen deprivation, EPSP did not recover fully after reoxygenation (EPSP changes 90 minutes after reoxygenation compared with initial values: −35.5 ± 11.3%, N = 4, P < 0.001 compared with control recovery). Furthermore, LTP could not be induced by tetanic stimulation delivered 100 minutes after reoxygenation (Fig. 6; EPSP changes: −2.5 ± 16.8%, N = 4). Thus, it appears that delayed hypoxic LTP inhibition is not mediated by activation of adenosine A1 receptors, and differs from acute hypoxic LTP inhibition (Arai et al., 1990).
Because activation of NMDAR is critical for LTP induction in the CA1 region (Collingridge et al., 1983), we examined whether modulation of NMDAR by oxygen deprivation participates in delayed LTP inhibition. The NMDAR-mediated EPSP (NMDAR-EPSP) were monitored in the presence of 30 μmol/L DNQX, an antagonist of non-NMDAR, and 0.1 mmol/L magnesium. Similar to non–NMDAR-mediated EPSP, NMDAR-EPSP were depressed completely by oxygen deprivation. During reoxygenation, the recovery of NMDAR-EPSP was promptly followed by a transient rebound potentiation lasting 20 minutes or less. Subsequently, NMDAR-EPSP returned to control levels (Fig. 7A; NMDAR-EPSP changes 60 minutes after oxygen deprivation: +4.2 ± 13.8 %, N = 7).
The delayed inhibition of LTP by oxygen deprivation is not mediated by activation of adenosine A1 receptors. In the presence of 200 nmol/L DPCPX (1,3-dipropyl-8-cyclopentylxanthine), a potent antagonist of adenosine A1 receptors (open thin bar), oxygen deprivation for 20 minutes (filled bar) only partially depressed EPSP. Despite this preservation of EPSP during oxygen deprivation, the recovered EPSP showed gradual fading after reoxygenation. Furthermore, LTP was not induced by tetanic stimulation delivered 100 minutes after reoxygenation. The traces depictEPSP obtained at the times indicated on each wave. The dashed traces are the initial baseline responses. Calibration bar: 5 milliseconds, 1 mV. Changes in N-methyl-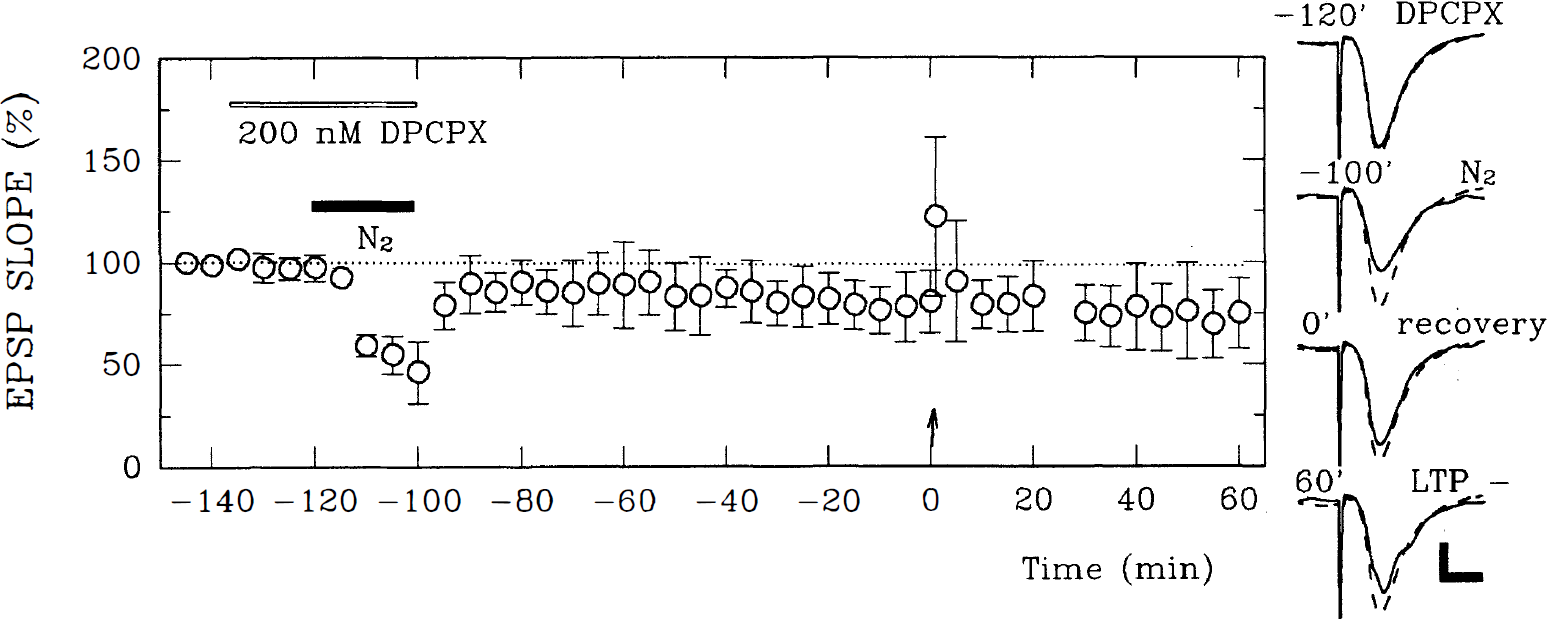
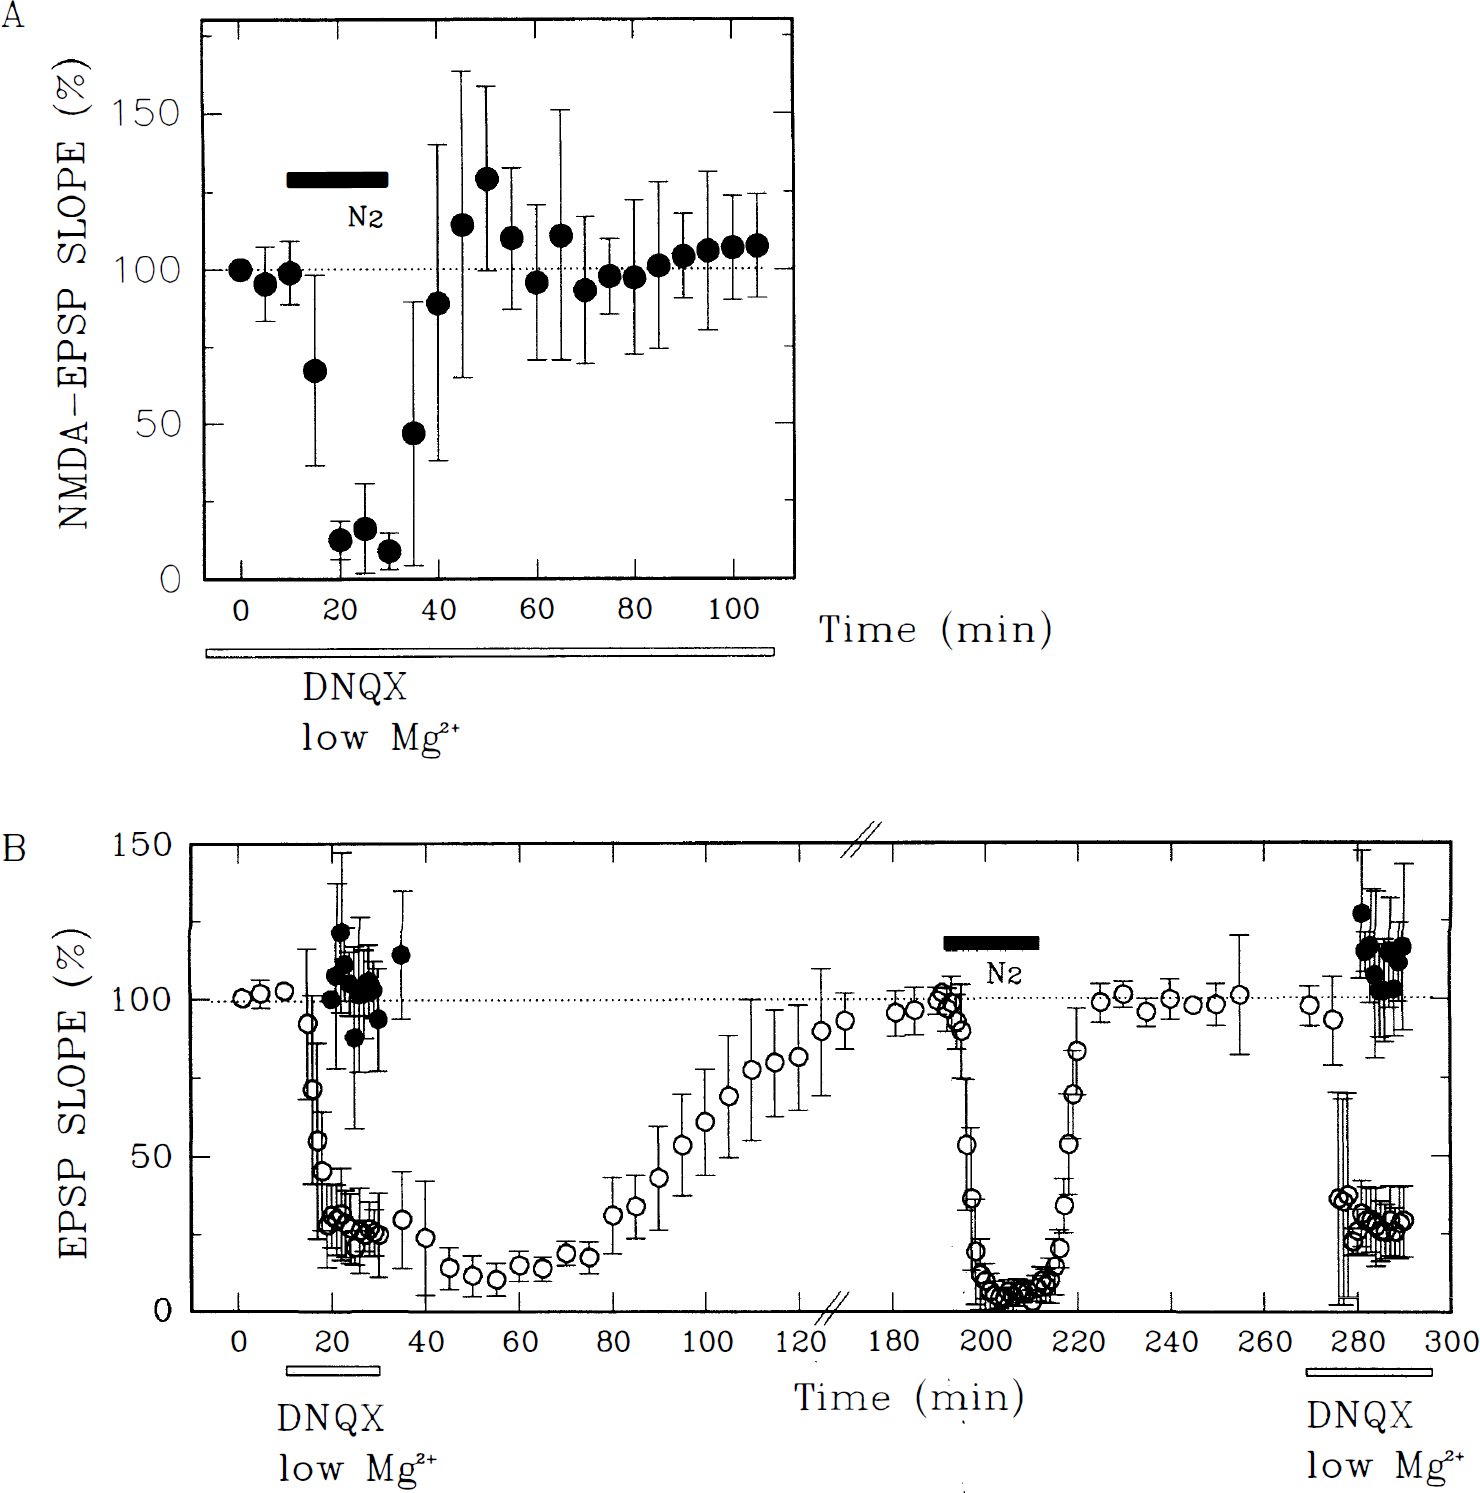
Because oxygen deprivation in the presence of DNQX and low magnesium may produce changes that differ from hypoxic exposure in control media, a second set of experiments was performed to examine whether oxygen deprivation in the standard control media containing 2 mmol/L magnesium alters NMDAR-EPSP (Fig. 7B). After recording stable non–NMDAR-EPSP in control ACSF, the bath solution was switched to one containing 30 μmol/L DNQX and 0.1 mmol/L magnesium to allow study of isolated NMDAR-EPSP. The bath then was switched back to control solution until non–NMDAR-EPSP recovered to baseline. Slices then were oxygen-deprived for 20 minutes in control ACSF followed by reoxygenation for 20 minutes. The ACSF was changed back to the solution with DNQX and a low magnesium content to reexamine NMDAR-EPSP. In these experiments, no significant change in NMDAR-EPSP was detected (Fig. 7B; changes in non–NMDAR-EPSP: −1.0 ± 6.7%; changes in NMDAR-EPSP: −12.7 ± 10.6%, N = 5). It thus seems unlikely that the delayed inhibition of LTP results from sustained suppression of NMDAR.
The transient increase in NMDAR-EPSP during reoxygenation suggests that excessive or untimely activation of NMDAR might contribute to the delayed inhibition of LTP. Administration of 100 μmol/L Effects of APV on delayed hypoxic LTP inhibition. The graph shows the time course of change in EPSP (mean ± SD) and effects of 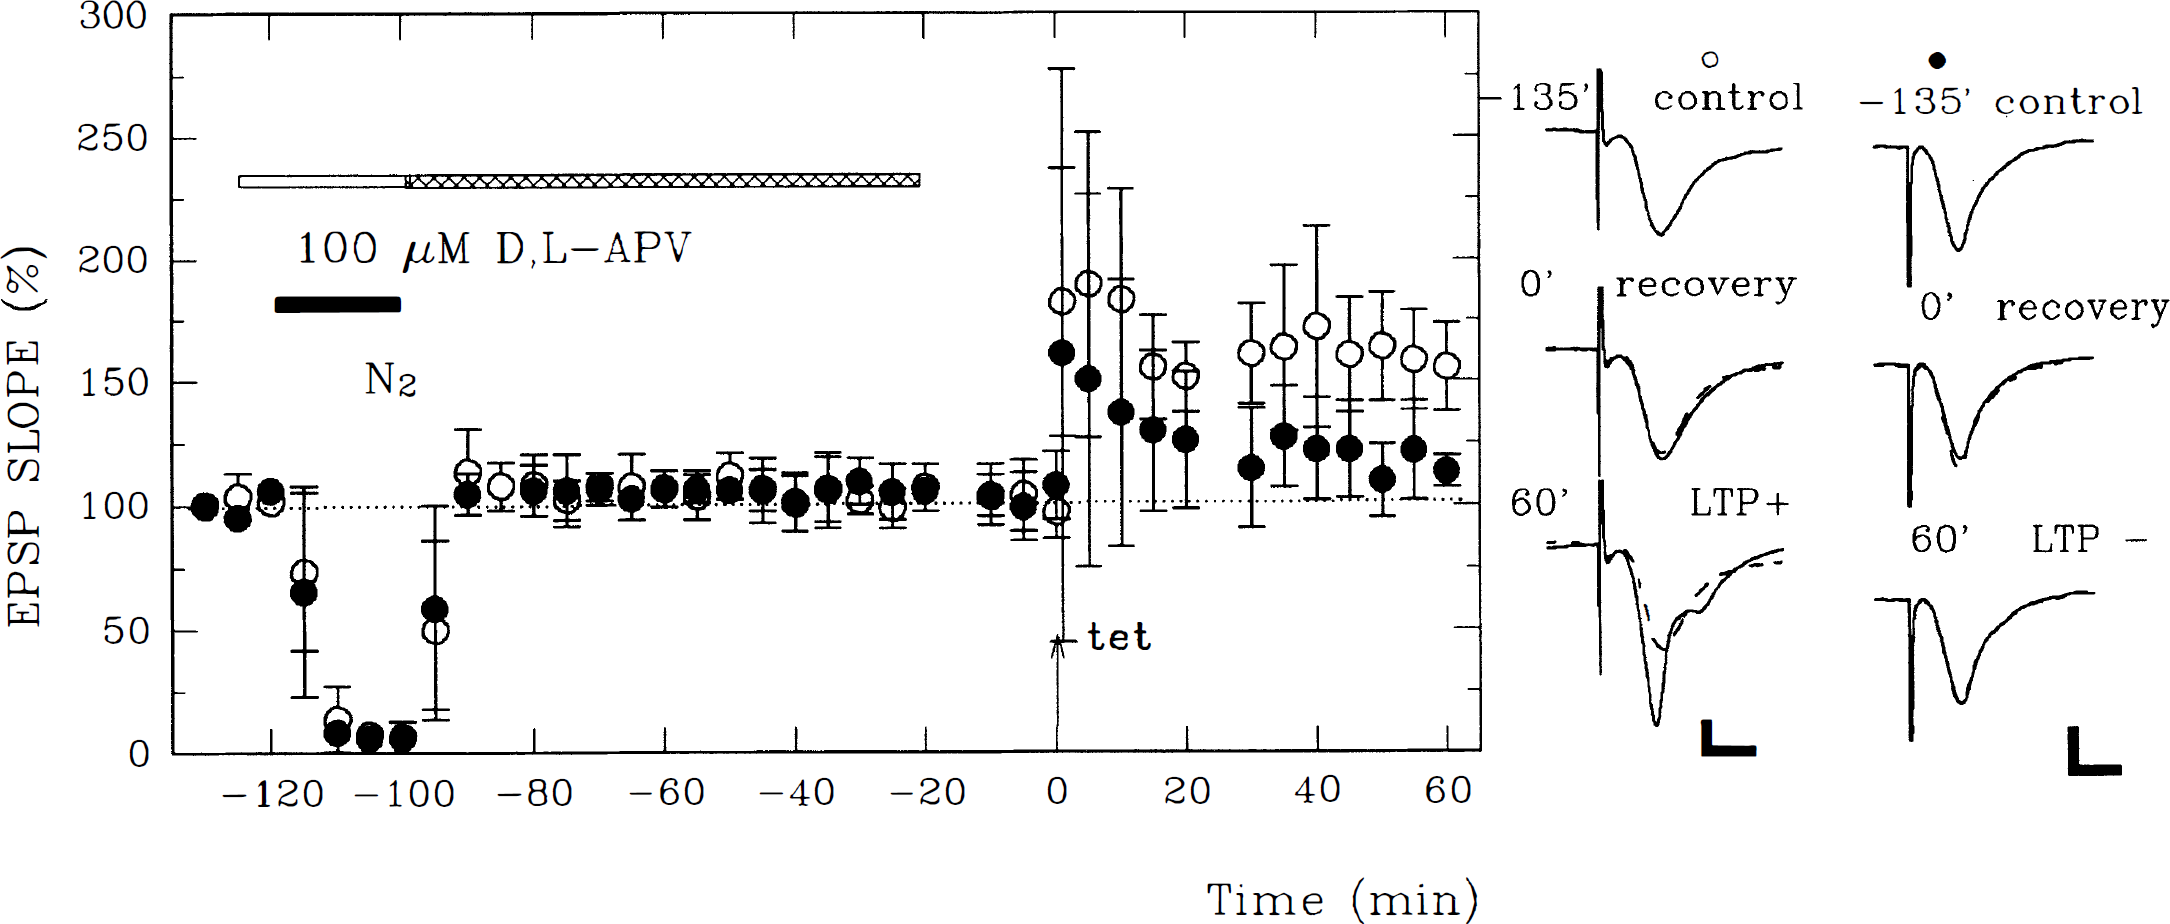
Since LTP induction was not blocked completely when tetanic stimulation was delivered within 30 minutes after reoxygenation, the inhibitory effect of NMDAR activation appears to require time to mature after oxygen deprivation. To examine the possibility that the harmful effects of NMDAR activation occur after reoxygenation, APV was administered immediately after, rather than during, oxygen deprivation. When APV was administered only during the recovery period, tetanic stimulation induced a short-term potentiation that faded to baseline within 60 minutes (Fig. 8; changes in EPSP slope: +4.3 ± 6.7%, N = 4). The failure to observe LTP when APV was administered only during reoxygenation did not result from failure to remove the drug because control slices exposed to APV for a similar period exhibited robust synaptic enhancement (+43.7 ± 7.6% change in EPSP slope, N = 3). These results indicate that the untimely NMDAR activation responsible for delayed LTP inhibition occurs during the period of hypoxia, although the subsequent biological events appear to occur more slowly.
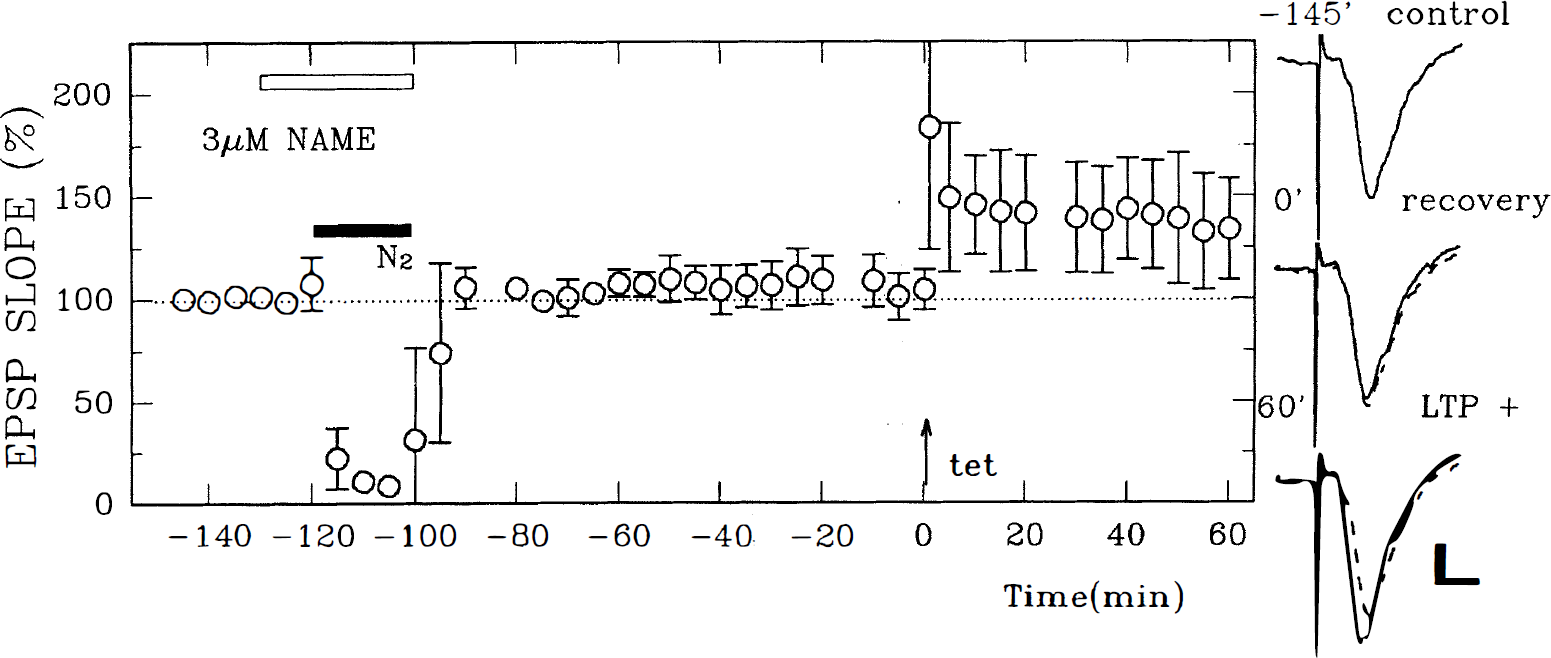
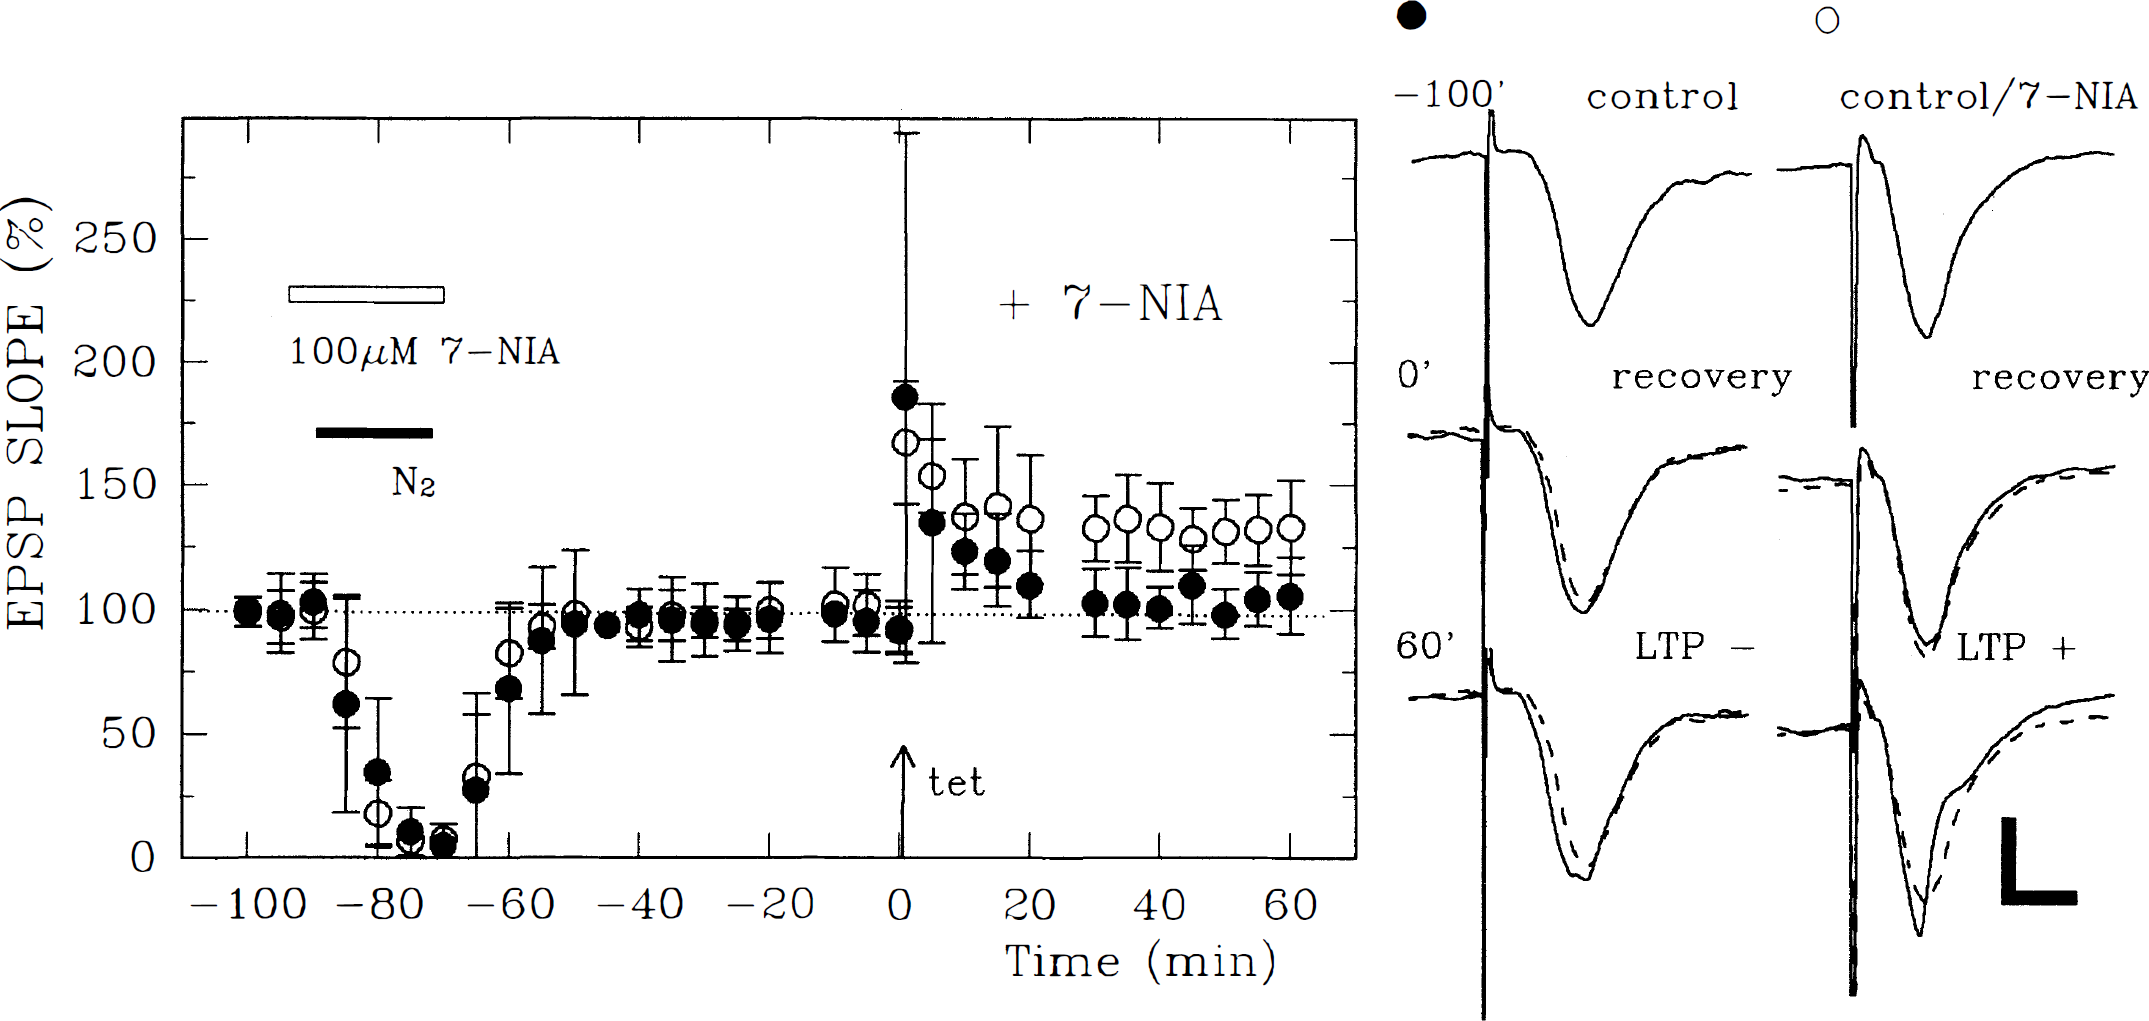
In previous studies, we found that NOS inhibitors prevent NMDAR-mediated LTP inhibition (Izumi et al., 1992c). To examine the involvement of NO in hypoxic LTP inhibition, 100 μmol/L Effects of Effects of Involvement of neuronal nitric oxide synthase in delayed hypoxic LTP inhibition. Oxygen deprivation (filled bar) 70 minutes before tetanic stimulation resulted in the failure of LTP induction (filled circles). This LTP inhibition was reversed by 100 μmol/L 7-nitro-indazole (7-NIA), a specific inhibitor of brain NOS, administered during oxygen deprivation (open circles). Traces on the right depict EPSP from a slice treated with 7-NIA before (upper trace) and 60 minutes after oxygen deprivation (middle), and 60 minutes after tetanic stimulation (lower). The traces on the left show EPSP from a slice not treated with 7-NIA. Dashed traces are control EPSP obtained before oxygen deprivation. Calibration bar: 5 milliseconds, 1 mV.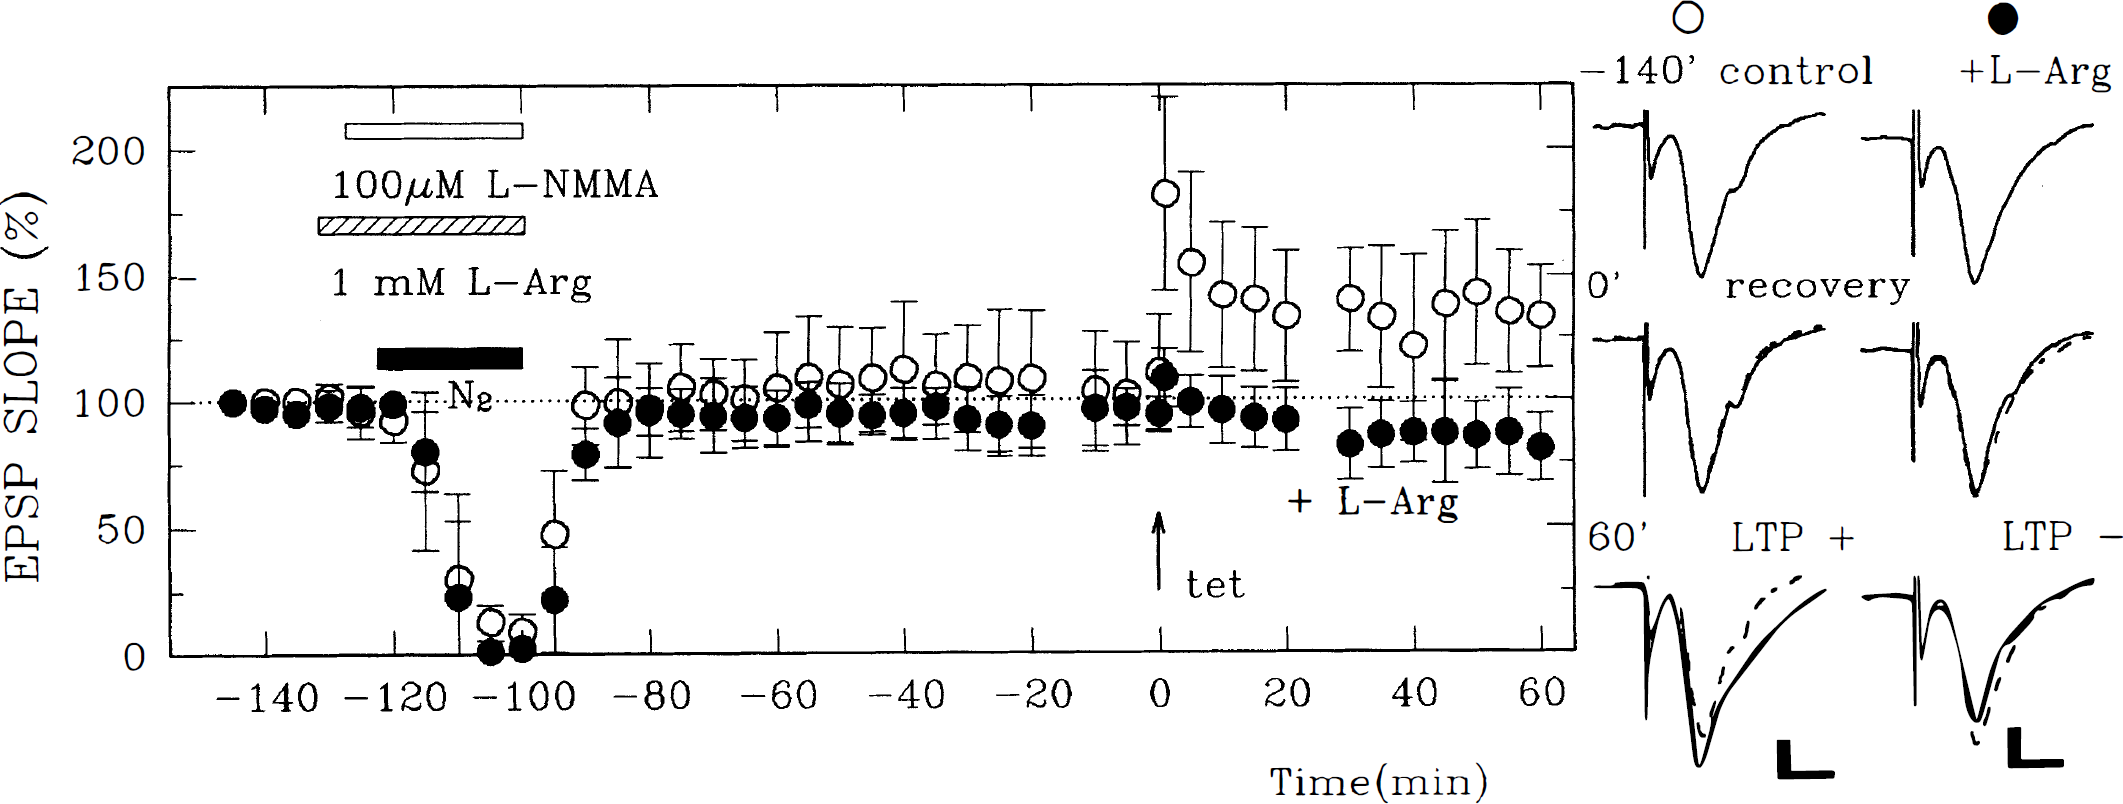
To determine whether NO is a delayed messenger mediating hypoxic inhibition of LTP, 100 μmol/L During reoxygenation, 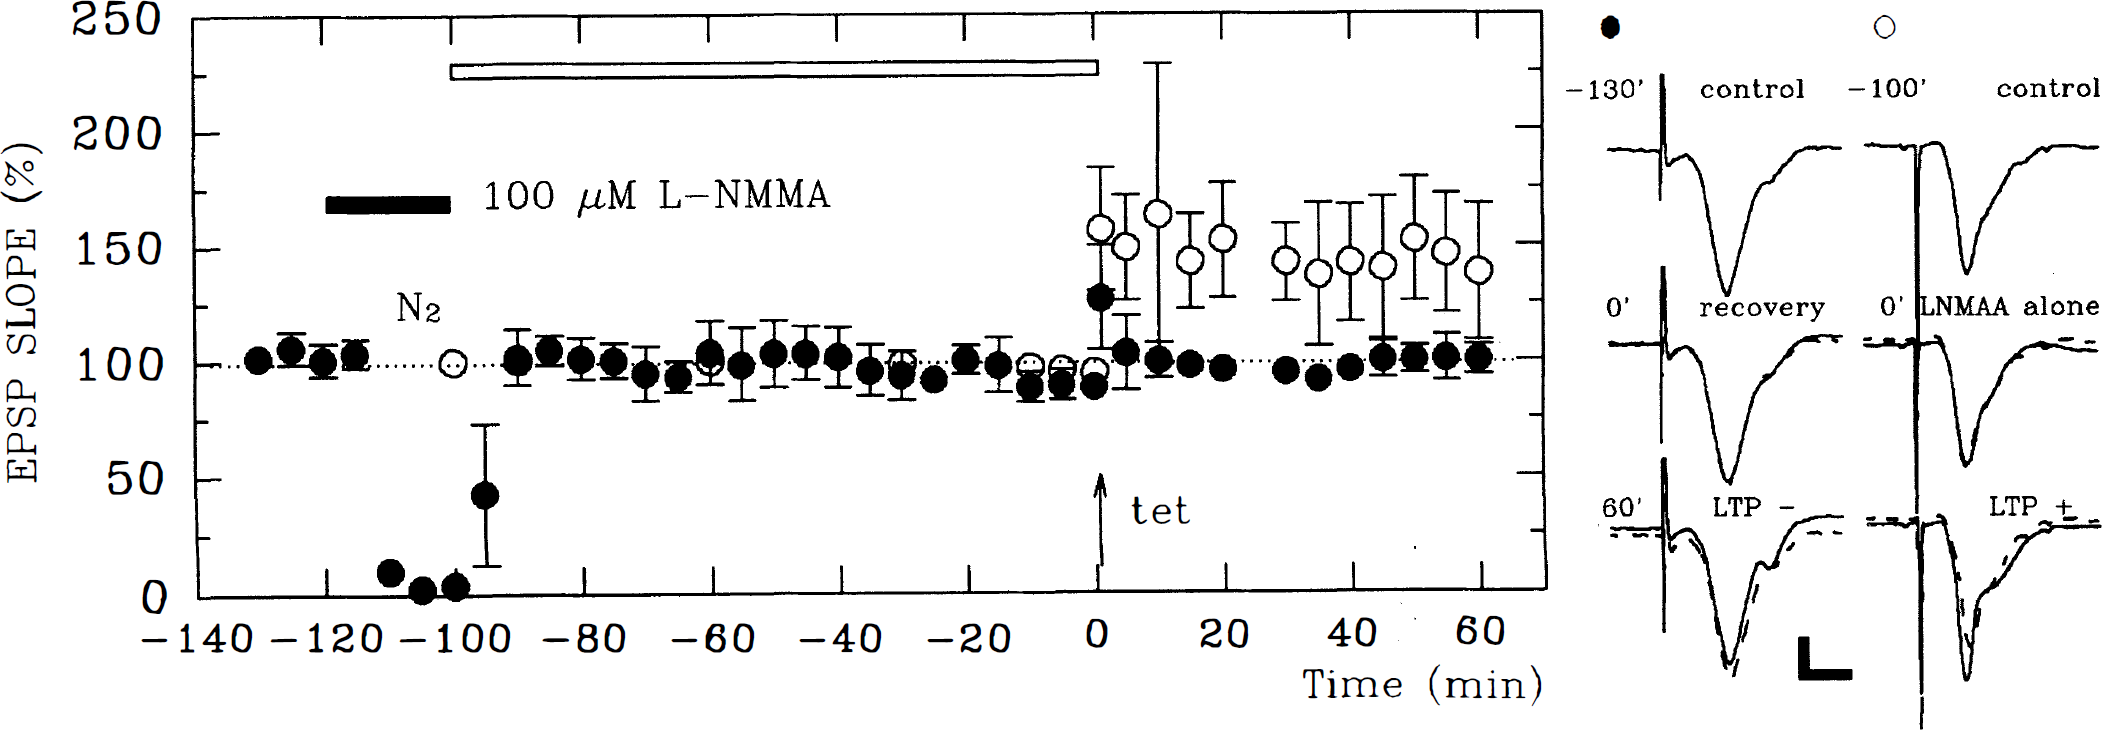
The delayed effects of NO on LTP induction were studied further using sodium nitroprusside (SNP), a NO releaser. We have previously shown that administration of 10 μmol/L SNP for 10 minutes blocks LTP induction by tetanic stimulation delivered during SNP administration (Izumi et al., 1992c). In the current study, tetanic stimulation was delivered at two times after 20 minutes' exposure to 10 μmol/L SNP (Fig. 13). Although LTP was successfully induced by tetanic stimulation delivered 30 minutes after washout of SNP (changes in EPSP slope: +35.8 ± 6.0%, N = 4), LTP was induced only in one of five slices when tetanic stimulation was delivered 100 minutes after the washout of SNP (+4.2 ± 18.3%, N = 5, P < 0.05).
Delayed inhibition of LTP by 10 μmol/L sodium nitroprusside (SNP). The graph shows the effect of 10 μmol/L SNP administered for 20 minutes beginning 30 minutes (open bar) or 100 minutes (filled bar) before the delivery of tetanic stimulation (arrow). The LTP was successfully induced in slices treated with SNP 30 minutes before tetanic stimulation (open circles), whereas LTP induction was blocked by pretreatment of slices with SNP 100 minutes before tetanic stimulation (filled circles). Traces in the left row depict EPSP obtained 10 minutes before (upper) and after tetanic stimulation (lower) in a slice treated with 10 μmol/L SNP 30 minutes before tetanic stimulation. The traces on the right are EPSP 10 minutes before (upper) and 60 minutes after (lower) tetanic stimulation in a slice treated with 10 μmol/L SNP 100 minutes before tetanic stimulation. Dashed traces are control EPSP obtained before SNP administration. Calibration bar: 5 milliseconds, 1 mV.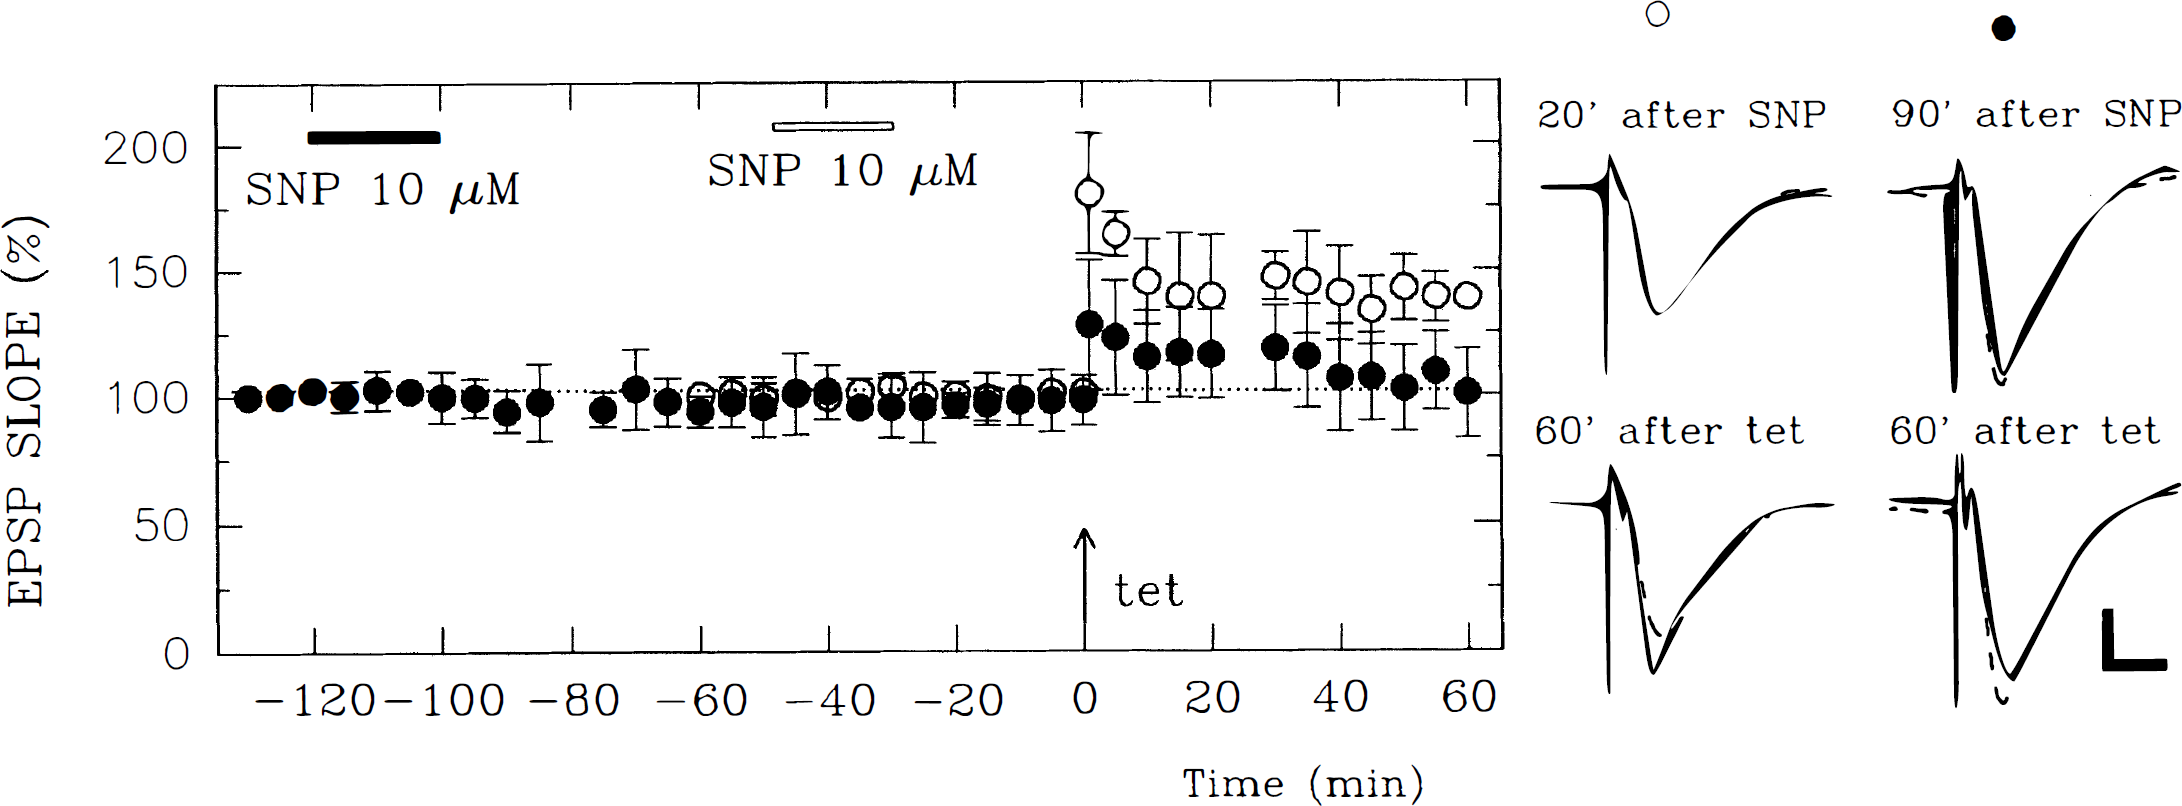
DISCUSSION
Mental deterioration and amnesia are important clinical sequelae in survivors of cerebral hypoxia. After severe episodes of hypoxia, neuronal loss clearly contributes to changes in cognitive function. However, milder insults that do not produce significant neuronal damage also can result in memory problems. In some cases, particularly after carbon monoxide exposure, the memory deficits become manifest over time (Grinker et al., 1926, Deckel 1994). The mechanisms underlying the delayed neurologic effects of hypoxia are not clear (Hardy and Thom, 1994). Because LTP is a leading candidate to be a mechanism involved in certain forms of memory, this process may be useful for determining how hypoxia impairs mnemonic function.
To investigate the effects of hypoxia on LTP, we used 20 minutes of oxygen deprivation in rat hippocampal slices. Synaptic responses were depressed completely during the anoxic period but recovered fully after reoxygenation. Whereas 20 minutes oxygen deprivation with glucose reduction produces severe neuronal damage (Izumi et al., 1996), oxygen deprivation alone did not result in histologic deterioration (Fig. 1). Prior studies using rodent hippocampal slices show variable degrees of recovery of synaptic transmission after relatively brief anoxic episodes, ranging from little recovery (Opitz and Reymann 1991; Schurr et al., 1987; Wallis et al., 1992) to complete restoration (Canhao et al., 1994; Chen et al., 1996; Yoneda and Okada, 1989). To produce irreversible loss of population spikes in the CA1 region during 40 minutes of hypoxia, Clark and Rothman (1987) found it necessary to increase the bath temperature from 30° to 34°C and lower the glucose concentration from 10 to 7 mmol/L. Similar adverse effects of low glucose and higher temperature have been described by others (Taylor and Weber, 1993; Zhu and Erdemli, 1995). In our experiments performed at 30°C, it took 10 to 15 minutes for oxygen deprivation to depress EPSP completely. During the period of oxygen deprivation, we did not observe hypoxic depolarization, a predictor of irreversible cell damage after hypoxia (Somjen et al., 1993), and EPSP were restored completely to control levels 20 minutes after reoxygenation. Recovery of synaptic transmission during reoxygenation is reported to be accelerated by NMDAR antagonists and NOS inhibitors (Chen et al., 1996; Opitz and Reymann, 1991; Zhu and Erdemli, 1995). Perhaps because our conditions for hypoxia are mild and perhaps because of the young age of the rats used in the current study, we did not observe significant effects of APV or NOS inhibitors either during oxygen deprivation or during the reoxygenation period.
Although 20 minutes of oxygen deprivation did not reverse previously established LTP, hypoxia impaired LTP induction in two ways. First, LTP was inhibited when tetanic stimulation was followed immediately by 20 minutes of oxygen deprivation (Fig. 2). Second, LTP could not be induced when tetanic stimulation was delivered 70 to 100 minutes after oxygen deprivation (Fig. 5). Because LTP can be induced by tetanic stimulation delivered 30 minutes after hypoxic treatment (Fig. 4), it appears that the mechanisms underlying the delayed LTP inhibition differ from those involved in the immediate posttetanic inhibition of LTP. Indeed, delayed LTP inhibition was not altered by DPCPX, an adenosine receptor antagonist that blocks the effects of oxygen deprivation immediately after theta-burst stimulation (Arai et al., 1990). During oxygen deprivation, DPCPX did reduce the depression of EPSP (Canhao et al., 1994). However, the subsequent recovery of synaptic responses was only partial, suggesting that preservation of synaptic function during oxygen deprivation does not necessarily result in better recovery after the insult. As suggested by Boissard and coworkers (1992), suppression of synaptic transmission by adenosine may promote recovery of neuronal function after oxygen deprivation.
We initially suspected that delayed hypoxic LTP inhibition may result from persistent depression of NMDAR after oxygen deprivation. Prior studies report that NMDAR-EPSP are more sensitive to hypoxic insults and recover more slowly after reoxygenation than non–NMDAR-EPSP (Canhao et al., 1994). However, we found that NMDAR-EPSP recovered completely after 20 minutes of hypoxia and exhibited a transient facilitation during the recovery period. This makes it unlikely that delayed hypoxic LTP inhibition results from a decrement in NMDAR function. We next considered whether excessive or untimely activation of NMDAR during or after hypoxic insults inhibits LTP induction, since prior studies have shown that excessive activation of NMDAR results in a failure in LTP production. For example, tetanic stimulation delivered in the presence of low magnesium fails to induce LTP (Coan et al., 1989; Izumi et al., 1992c), and perfusion of low concentrations of NMDA or agonists at NMDAR blocks LTP induction (Izumi et al., 1992b). We previously reported that the inhibitory effects of NMDA are mediated by NO release (Izumi et al., 1992c). Consistent with this, we found that delayed hypoxic LTP inhibition is blocked by APV and NOS inhibitors.
Since NMDAR-EPSP are transiently facilitated after hypoxic exposure (Gozlan et al., 1994), tetanic stimulation after oxygen deprivation could result in excessive activation of NMDAR and NO release. In the current study, however, we failed to observe persistent anoxia-mediated changes in NMDAR-EPSP with our 20-minute hypoxic paradigm. Although the use of APV during reoxygenation was limited by its known inhibitory effects on LTP induction, we observed that administration of APV during, but not after, oxygen deprivation prevented delayed hypoxic inhibition of LTP. This suggests that the activation of NMDAR during oxygen deprivation is critical for the delayed effects on LTP induction.
Several lines of evidence suggest that activation of NMDAR is involved in the neurologic sequelae that follow anoxic insults (Patel et al., 1992; Rothman et al., 1987; Schurr et al., 1995; Zhu and Erdemli, 1995). Furthermore, the cerebral edema due to carbon monoxide poisoning is ameliorated by ketamine, an antagonist of NMDAR (Penney and Chen, 1996). The activation of NMDAR during carbon monoxide poisoning is followed by excessive NOS activity (Ischiropoulos et al., 1996), which may result in neuronal damage. Additionally,
Although NO has been proposed to be a retrograde messenger for LTP induction (Schuman and Madison, 1993), conflicting results have been reported by investigators when experiments are conducted at temperatures above room temperature (Williams et al., 1993; Bannerman et al. 1994). Using slices kept at 30°C, we previously found that
Just as the delayed hypoxic inhibition of LTP is distinct from acute hypoxic LTP inhibition, the delayed inhibition of LTP by SNP (Fig. 9) should be differentiated from its acute effects (Izumi et al., 1992c). We previously observed that long-term depression of EPSP by 100 μmol/L SNP was followed by a failure of LTP induction (Izumi and Zorumski, 1993). Importantly, 100 μmol/L active SNP does not depress NMDAR-EPSP (Izumi et al., 1993), suggesting that the delayed inhibition of LTP by 10 μmol/L SNP does not result from inactivation of NMDAR. Furthermore, NO appears to hamper LTP induction slowly after release. Thus, NOS inhibitors may have variable effects when administered after an episode of acute cerebral hypoxia, depending on the timing of NOS activation. This is of practical importance because therapeutic intervention is possible only after the insult in most cases of hypoxia–ischemia. Although NMDAR antagonists appear to be of limited value when administered after ischemic insults (Nellgård et al., 1991; Dezsi et al., 1994), a neuronal NOS inhibitor has been shown to reduce infarct volume after transient ischemia if injected after reperfusion (Zhang et al., 1996). Additionally, administration of NAME after reperfusion diminishes memory deficits after transient ischemia (Ohno et al., 1994). In the current study, however, a NOS inhibitor administered after hypoxic exposure failed to restore LTP induction, suggesting that delayed administration of NOS inhibitors may not be effective in preventing the memory impairment that follows brief or milder bouts of hypoxia. Nevertheless, better understanding of the biological targets of NO may lead to therapeutic strategies that are effective in the posthypoxic period.