
Abstract
Laser-Doppler flowmetry (LDF) is a reliable method for estimation of relative changes of CBF. The measurement depth depends on wavelength of the laser light and the separation distance of transmitting and recording optical fibers. We designed an LDF probe using two wavelengths of laser light (543 nm and 780 nm), and three separation distances of optical fibers to measure CBF in four layers of the cerebral cortex at the same time. In vitro comparison with electromagnetic flow measurements showed linear relationship between LDF and blood flow velocity at four depths within the range relevant to physiologic measurements. Using artificial brain tissue slices we showed that the signal for each channel decreased in a theoretically predictable fashion as a function of slice thickness. Application of adenosine at various depths in neocortex of halothane-anesthetized rats showed a predominant CBF increase at the level of application. Electrical stimulation at the surface of the cerebellar cortex demonstrated superficial predominance of increased CBF as predicted from the distribution of neuronal activity. In the cerebellum, hypercapnia increased CBF in a heterogeneous fashion, the major increase being at apparent depths of approximately 300 and 600 μm, whereas in the cerebral cortex, hypercapnia induced a uniform increase. In contrast, the CBF response to cortical spreading depression in the cerebral cortex was markedly heterogeneous. Thus, real-time laminar analysis of CBF with spatial resolution of 200 to 300 μm may be achieved by LDF. The real-time in depth resolution may give insight into the functional organization of the cortical microcirculation and adaptive features of CBF regulation in response to physiologic and pathophysiologic stimuli.
Keywords
Laser-Doppler flowmetry (LDF) is a well-established noninvasive technique for continuous monitoring of CBF. The time resolution is in the millisecond range and the spatial resolution in the plane is in the range of hundreds of micrometers. The application of LDF to studies of the cerebral circulation has bridged the gap in temporal resolution that for decades separated studies of the cerebral circulation from electrophysiology. Thus, it is now possible, with the simultaneous use of conventional microelectrode techniques and LDF, to depict the exact spatial and temporal relationship between evoked nerve cell activity in the cortex and CBF (Akgoren et al., 1996). The identification of the cellular elements that generate CBF increases requires, however, more detailed knowledge of the time course and magnitude of CBF changes in three dimensions in real time. For this purpose we designed a laser-Doppler probe with the potential of in-depth resolution.
The sampling depth using LDF varies as a function of the wavelength of the laser beam and the separation distances of the transmitting and recording optical fibers in the probe. Green laser light with a short wavelength measures local blood flow in more superficial layers than red or near-infrared light with a longer wavelength (Gush and King, 1991; Hales et al., 1993). Furthermore, Monte Carlo simulations of photon penetration indicate that the wider separation of the transmitting and recording optical fibers, the larger the measuring depth of the system (Jakobsson and Nilsson, 1993). Hence, an appropriate combination of wavelengths and fiber separations in a single probe has the potential of real-time laminar analysis of CBF. A related approach has previously been used to achieve depth resolution of blood flow measurement in the skin, to distinguish capillary blood flow in the superficial dermis from flow in arteriovenular anastomoses in the deeper dermis (Gush and King, 1991; Hales et al., 1993).
This study describes the design and application of a laser-Doppler probe specifically configured for studies of the brain microcirculation. Resolution in depth was achieved by the use of green and near-infrared laser light and three separation distances between the transmitting and the receiving fibers. The method was validated in vitro by comparison with electromagnetic measurements using a glass capillary. In vivo validation included the application of adenosine at various levels in the cortex and electrical stimulation of the most superficial cortical layers. The result confirmed that the probe was useful for a semiquantitative analysis of CBF at four different cortical depths. Heterogeneity in depth of the CBF response was demonstrated during hypercapnia in the cerebellum and during cortical spreading depression (CSD) in the cerebral cortex. The results are consistent with the idea that LDF technology may be used for laminar analysis of CBF in response to physiologic and pathophysiologic stimuli.
METHODS
Principle of LDF
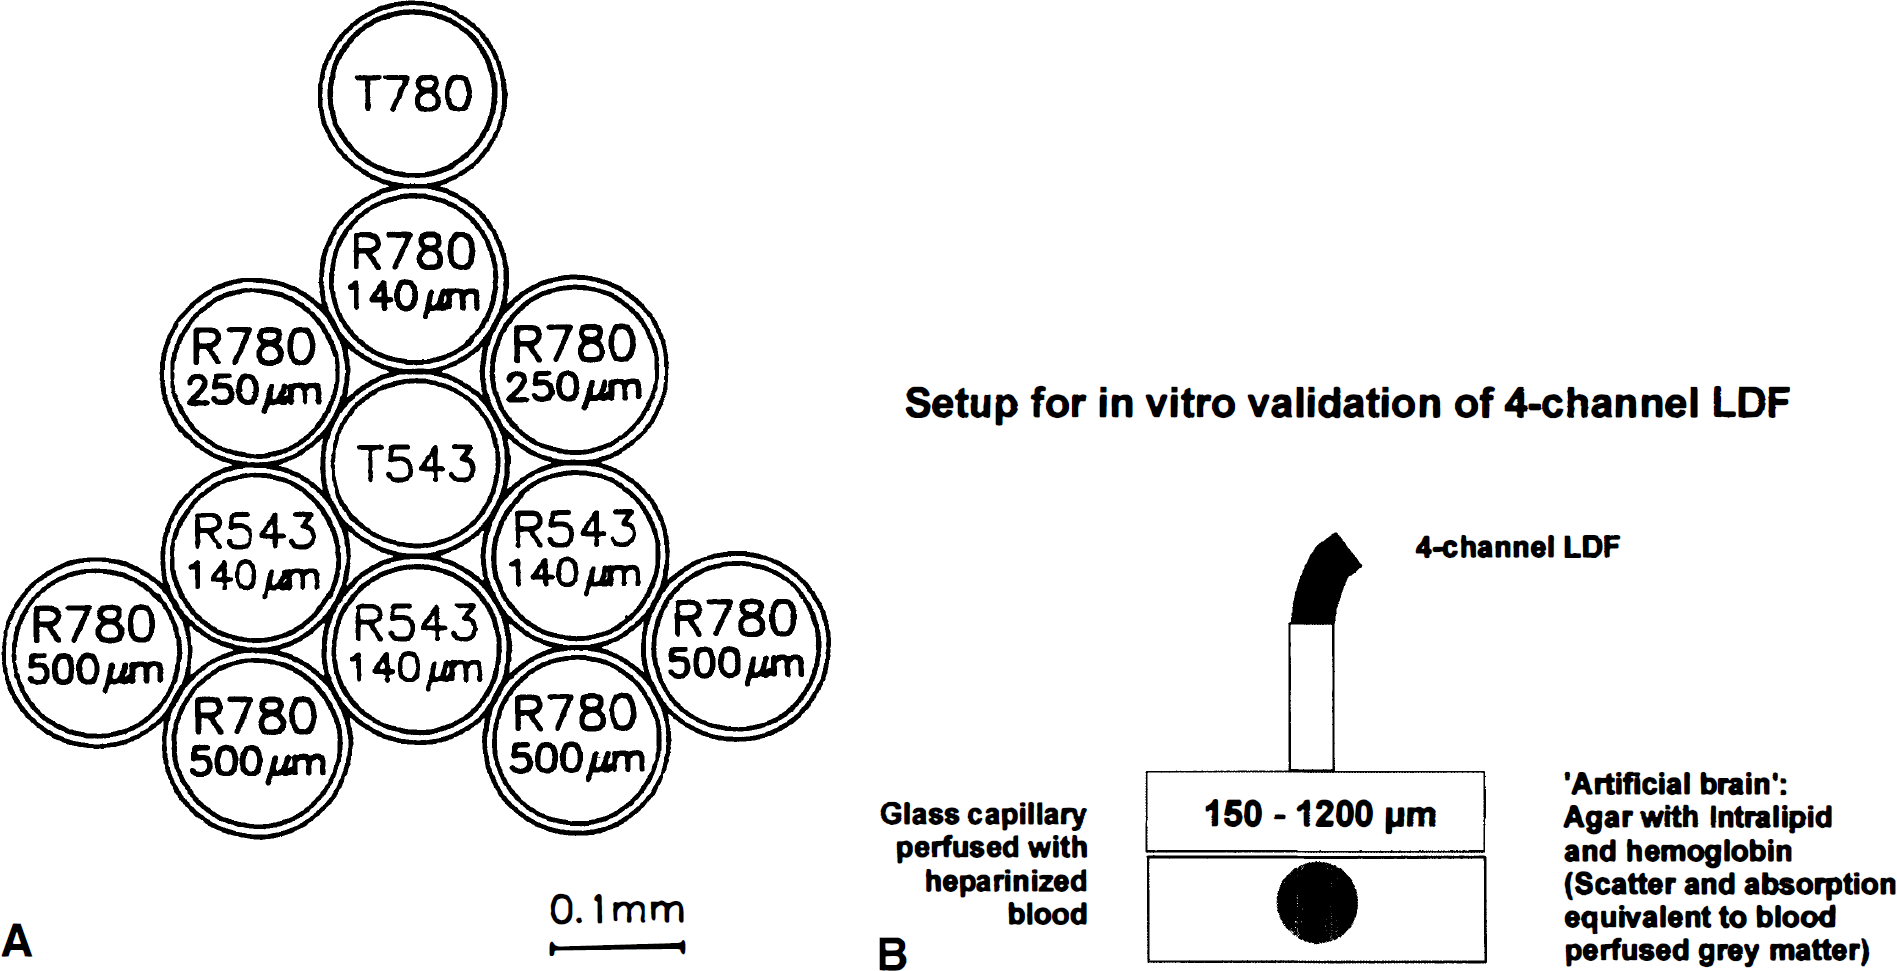
When laser light enters perfused tissue, photons that interact with moving red blood cells are Doppler (frequency) -shifted, whereas light scattered by stationary cells remains unshifted (Riva et al., 1972; Stern, 1975). Simplified, analysis of the backscattered light gives the bandwidth of the Doppler shift, which is proportional to the velocity of the red blood cells, whereas the amplitude of the Doppler-shifted signal is proportional to the concentration of moving blood cells in the tissue (Nilsson et al., 1980; Barfod et al., 1997). The blood flow equivalent (i.e., moving blood cell flow) is derived from the multiplication of the mean Doppler shift by the fraction of light that is Doppler-shifted (Stern et al., 1977). The intensity of the reflected light is termed “total backscatter.” Total backscatter depends on laser and probe configuration and on the optical properties of the tissue, including the volume and distribution of red blood cells. Total backscatter is independent of blood cell velocity. The LDF measurements are only valid within a certain range of total backscatter, and for green laser light major variations in total backscatter even within this range may affect the linearity of the LDF measurement, because of parallel alterations of measurement depth (Gush and King, 1991). A standard LDF probe contains two active optic fibers: a transmitting fiber connected to a laser source conducts the laser beam to the perfused tissue, and a recording fiber conducts the backscattered light to a photodetector. The measurement depth increases with the wavelength of the laser light and with the distance between the transmitting and recording optic fiber of the LDF probe (Obeid et al., 1990; Jakobsson and Nilsson, 1993; Gush and King, 1991). Using these principles we (M.F., M.L.) conceived a four-channel LDF probe, which was engineered by Perimed AB, Järfälla, Sweden (PF 415:49) holding four combinations of wavelength and fiber separation: green laser light (543 nm), fiber separation, 140 μm (LDFGreen); and near-infrared laser light (780 nm), fiber separations, 140 μm, 250 μm, and 500 μm (LDFRed(140), LDFRed(250), and LDFRed(500)). A diagram of the optical fibers in the probe tip is shown in Fig. 1A. The four channels of the probe were connected to two two-channel laser-Doppler flowmeters (Periflux 4001 Master, maximal laser intensities ≈0.9 mW (543 nm) and ≈1.25 mW (780 nm), attenuation of laser intensity 0.7 dB at probe tip for both wavelengths, Perimed AB). The light of the recording fiber for the green laser was filtered to remove the near-infrared light and vice versa.
(
In vitro modeling of microcirculatory flow
The linearity and different measurement depth of the four channels in the probe were tested in vitro (Fig. 1B). Heparinized, diluted (hematocrit, 10%) human blood was pumped (Ismatec, model MVCA-4, Zürich, Switzerland) through a glass capillary (inner diameter 2 mm, outer diameter 2.5 mm; “laminar flow“) using a roller pump (velocity 0 to 3 mm/s). The glass capillary was embedded in a medium (”artificial brain“) modeling the optical properties (absorption, scatter; Benson and Knoll, 1984; Eggert and Blazek, 1987) of brain tissue in vivo. The medium was composed of agar (approximately 1%) containing 5% Intralipid (Pharmacia, Erlangen, Germany; see Chance et al., 1993) and 0.5% hemoglobin (the average hemoglobin concentration in brain tissue; Wray et al., 1988). This medium was adjusted by slight variations in the agar concentration to give a measured (Shimadzu UV-1202 Spectrophotometer, Tokyo, Japan) fall in intensity of transmitted light similar to brain tissue (Wray et al., 1988), i.e., by 1/e for every ≈0.4 mm at 543 nm (the wavelength of the green laser) and for every ≈2.1 mm at 780 nm (the wavelength of the near-infrared laser). Blood flow velocity in the capillary was measured with a Nycotron electromagnetic flowmeter (model 376, Drammen, Norway; Stern et al., 1979). Between the glass capillary and the tip of the four-channel LDF probe we positioned slices (cut on a vibratome) of the “artificial brain” described above of increasing thickness starting at 0 μm (no slice interposed), and increasing in steps of 150μm to 1,200 μm to test for the measurement depth of the four LDF channels (Fig. 1B). Because of the proportions of the glass capillary, we did not test for slices thicker than 1,200 μm. Blood flow velocity in the capillary was kept constant at 3 mm/s while LDF was performed. For four selected slice thicknesses LDF and electromagnetic flow measurements were performed, while the blood flow velocity was reduced from 3 mm/s in four steps to 0 mm/s to test whether the measurement depth was independent of flow velocity in the glass capillary. For the slice thickness of 150 μm this procedure was repeated 10 times, each time varying the steps, to get 40 different sets of measurements to test for linearity of the four channels. A 150-μm slice was used for this purpose, because the LDFGreen signal was extinct when thicker slices were interposed. The influence of hemoglobin oxygenation on LDF measurements by the four channels was tested by temporarily switching the perfusion medium from blood bubbled with 100% O2 to blood bubbled with 100% N2. Data from the four-channel LDF and from the Nycotron electromagnetic flowmeter were converted from analog to digital, stored, and processed on a personal computer running the ASYST software (MacMillan Software, New York, NY, U.S.A.).
In vivo measurements with the four-channel probe
Twenty-nine male Wistar rats (300 to 350 g) were anesthetized with halothane (Vapor; Dräger, Lübeck, Germany), using 4% for induction, 1.5% during surgery, and 0.7% for maintenance in O2 30%/N2O 70%. Catheters were inserted in a femoral artery and a femoral vein, and the trachea was cannulated. After relaxation with 5 to 15 mg of succinylcholine chloride intraperitoneally, rats were ventilated with a volume respirator and placed in a headholder. A hole of 3 × 3 mm was drilled in the parietal (n = 16) or occipital (n = 13) bone by use of a dental drill under continuous saline superfusion, and the dura was carefully opened. For elicitation of CSD, a hole of 1 to 2 mm was drilled in the frontal bone. Animals were excluded from the study if the cortex was exposed to bleeding during surgery. Craniotomy sites were continuously superfused with artificial CSF at 37°C aerated with 95% O2/ 5% CO2 (composition in mmol/L: NaCl, 120.00; KCl, 2.8; NaHCO3, 22.00; CaCl2, 1.45; Na2HPO4, 1.00; MgCl2, 0.876) at a rate of 0.5 mL/min.
Cerebral blood flow was continuously monitored by the four-channel LDF probe that was placed at a fixed position 0.3 mm above the pial surface. Visible vessels were carefully avoided when the probes were positioned. After stable readings were obtained, the probe was left at that position for the duration of the experiment. The CBF response during stimulation was defined as the percentage increase from a 2-minute period of stable baseline preceding the stimulus. Measurements were converted from analog to digital, stored, and processed on a personal computer running the Perisoft software program (Perimed AB).
Hypercapnia was induced in all animals by adding 5% CO2 to the inhaled air for 5 to 6 minutes. Blood flow values were obtained at equilibrium and represent the mean values for the last 30 seconds of the inhalation period. The time interval between tests ranged from 15 to 30 minutes to allow a well-defined baseline to reestablish. To test for intact vascular reactivity, the CO2 reactivity was measured twice in every experiment before any drug was given. Animals with unstable baselines, or very low CO2 reactivities, defined as less than 1 % increase of CBF per mm Hg increase of arterial P
Cortical spreading depression is a slowly propagating wave of massive, but transient depolarization, accompanied by a hyperperfusion, which normally lasts for 2 minutes (Fabricius et al., 1995). In five animals CSD was elicited in the frontal cortex by a brief needle stab to test the flow response to a local vasodilator stimulus that is expected to increase CBF throughout the cortical mantle. Only the maximal CBF increase (average of 10 seconds) was included in the calculations.
Adenosine is a potent vasodilator, but is rapidly inactivated by cellular uptake and deamination or phosphorylation (Ross et al., 1990). We therefore assumed that locally applied adenosine induced the largest CBF increase closest to the site of application. In the cerebellum of seven animals, adenosine was applied topically (1 mmol/L) for 5 minutes, and after 15 minutes of recovery we injected 30 nL adenosine (20 mmol/L) through a glass micropipet (tip diameter, 25 μm) inserted into the tissue at the edge of the four-channel LDF probe by means of a micromanipulator. The microelectrode was connected by a short stiff plastic tubing to a 5-μL Hamilton glass syringe, which was operated by a digital infusion pump (manufactured at the Panum Institute, Copenhagen, Denmark). Expression of fluid from the microelectrode tip was tested before and after insertion into the tissue. Most injections were performed at depth of 1,000 μm (n = 5), but the CBF response to injections at depths of 500, 1,500, and 2,000 μm were tested as well.
Local electrical stimulation at the surface of the cerebellar vermis activates a beam of parallel fibers that release glutamate, which increases local synaptic activity and CBF (Akgoren et al., 1994; Akgoren et al., 1996). The main part of the increased synaptic activity is restricted to the upper 100 to 200 μm of the cortex (Llinas, 1981). We examined whether the increase of CBF was confined to this superficial layer* as well. In seven animals a bipolar stimulating electrode was positioned 500 to 600 μm lateral to the laser-Doppler probe. A stimulation frequency of 30 Hz for 15 seconds was used as described previously (Akgoren et al., 1994).
Statistics
Data are given as mean ± SD. Simple linear regression was used to correlate electromagnetic flow values and LDF flow, and to correlate LDF flow and total backscatter. Increases in CBF at various depths were compared by analysis of variance.
RESULTS
In vitro modeling of microcirculatory flow
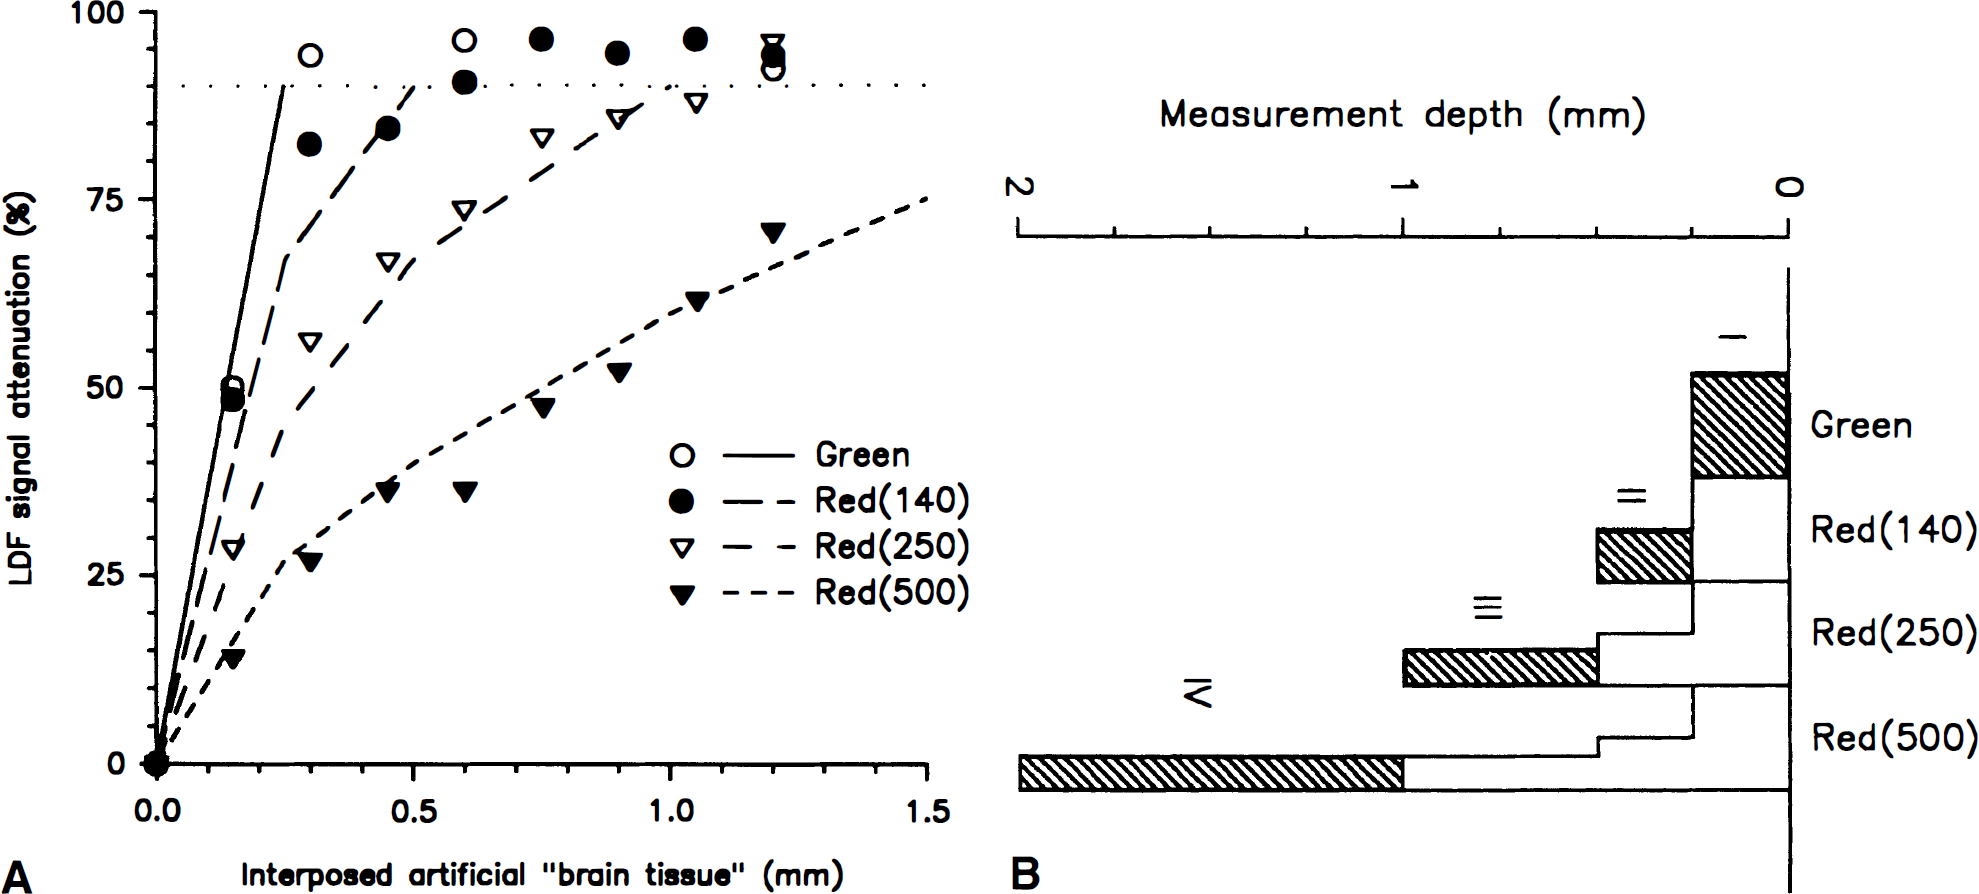
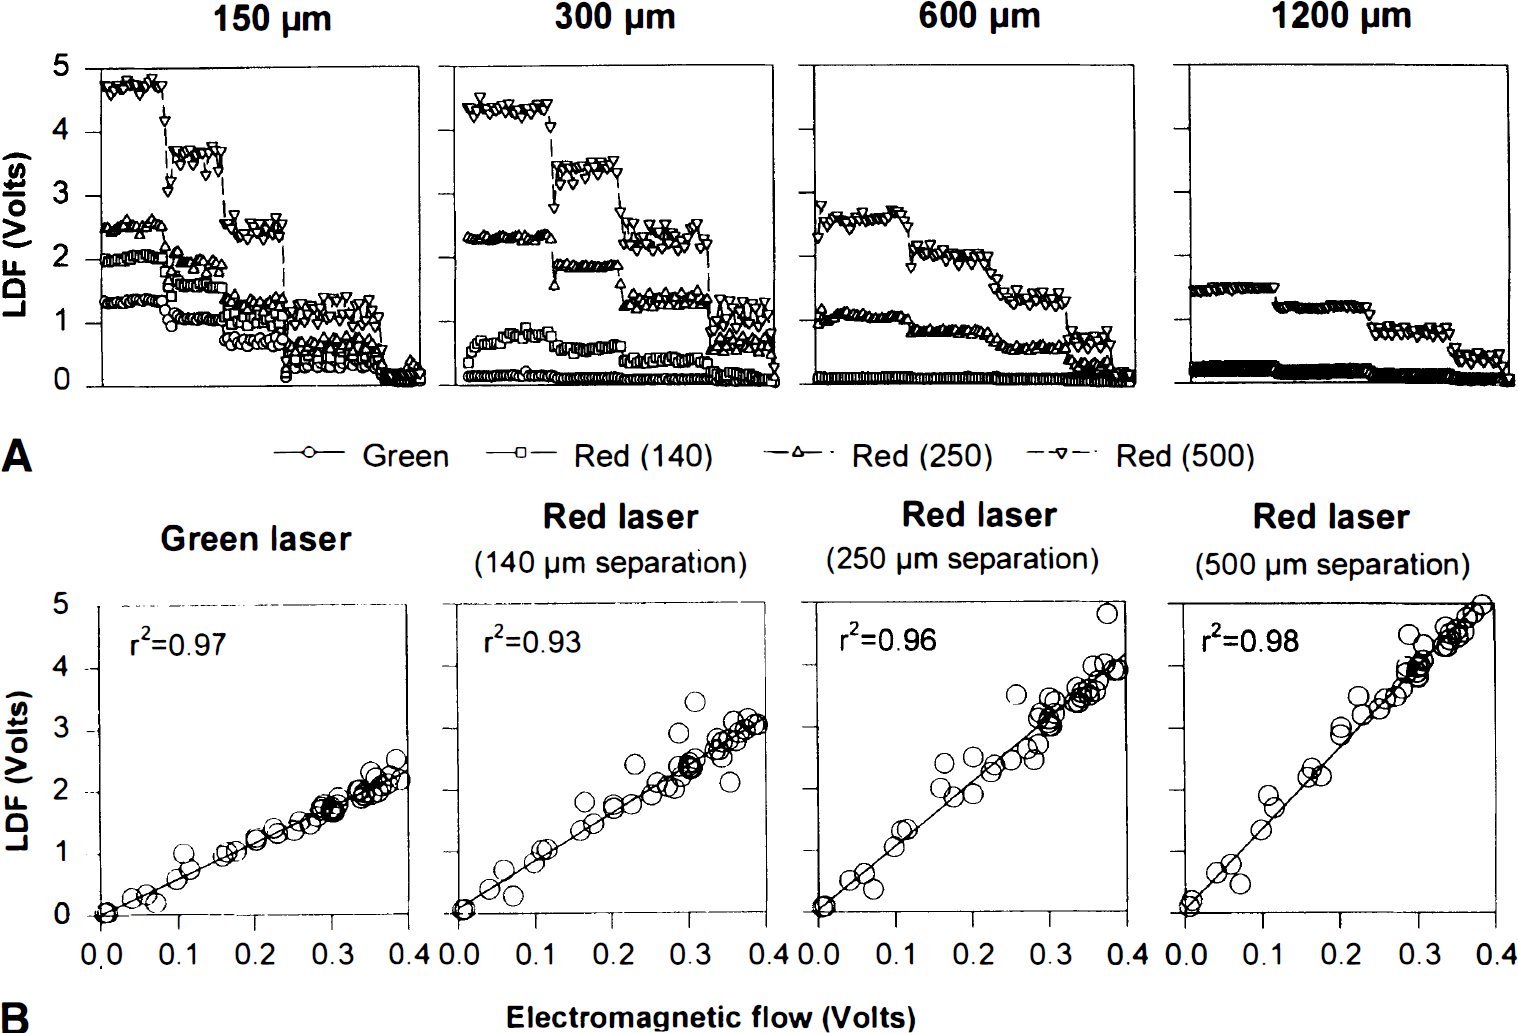
To examine the measurement depth of the four channels in vitro, slices of “artificial brain tissue” increasing stepwise in thickness by 150 μm from 0 μm to 1,200 μm were interposed between the glass capillary and the tip of the four-channel probe (Fig. 1B). While LDF was performed, diluted blood was pumped through the glass capillary at a linear velocity of 3 mm/s. In all channels, the LDF values were attenuated as a function of increasing slice thickness (Fig. 2A). For LDFGreen and LDFRed(140) the flow signal was maximally attenuated by around 95% at slice thicknesses greater than 150 μm and 600 μm, respectively. Thus, for LDFGreen, blood flow signals above the basal noise level were only recorded when less than 300 μm of tissue was interposed. We defined the maximal measurement depth as the maximal thickness of interposed tissue at which signals were attenuated less than 90% (Fig. 2A). The maximal measurement depth was 450 μm for LDFRed(140), 1,050 μm for LDFRed(250), and more than 1,200 μm for LDFRed(500). Thus, the maximal measurement depth of the four channels in vivo could be roughly estimated as ¼, ½, 1, and 2 mm for LDFGreen, LDFRed(140), LDFRed(250), and LDFRed(500), respectively.
(
The four LDF channels measure an integral of blood flow from the surface and into the tissue. It was of interest to estimate in vivo CBF changes at distinct depths of the cortex. The attenuation profiles of the channels could not be fit to any simple function or even a biexponential decline without major deviations from the observed values. Because we had no physical model for a weight function of the contribution of various tissue layers to the integral LDF signal, we had to define an ad hoc model based on the observed depth profiles of signal attenuation (Fig. 2A). Accordingly, we defined four tissue layers of the cortex: layer I, 0 to 0.25 mm; layer II, 0.25 to 0.5 mm; layer III, 0.5 to 1 mm; and layer IV, 1 to 2 mm. For each LDF channel we calculated the relative contribution for each of the four layers to the LDF signal based on linear interpolation of the LDF signal attenuation values (Fig. 2A; Table 1, left). We assumed that the contributions from the four layers to the LDF signal were additive and that CBF was homogeneous throughout the cortex at rest. Thus, changes of CBF in a single layer during stimulation would affect the signal derived from each LDF channel relative to the contribution from that particular layer to the LDF signal during control conditions (Table 1).
Contributions from the four tissue layers to the laser-Doppler flowmetry signal
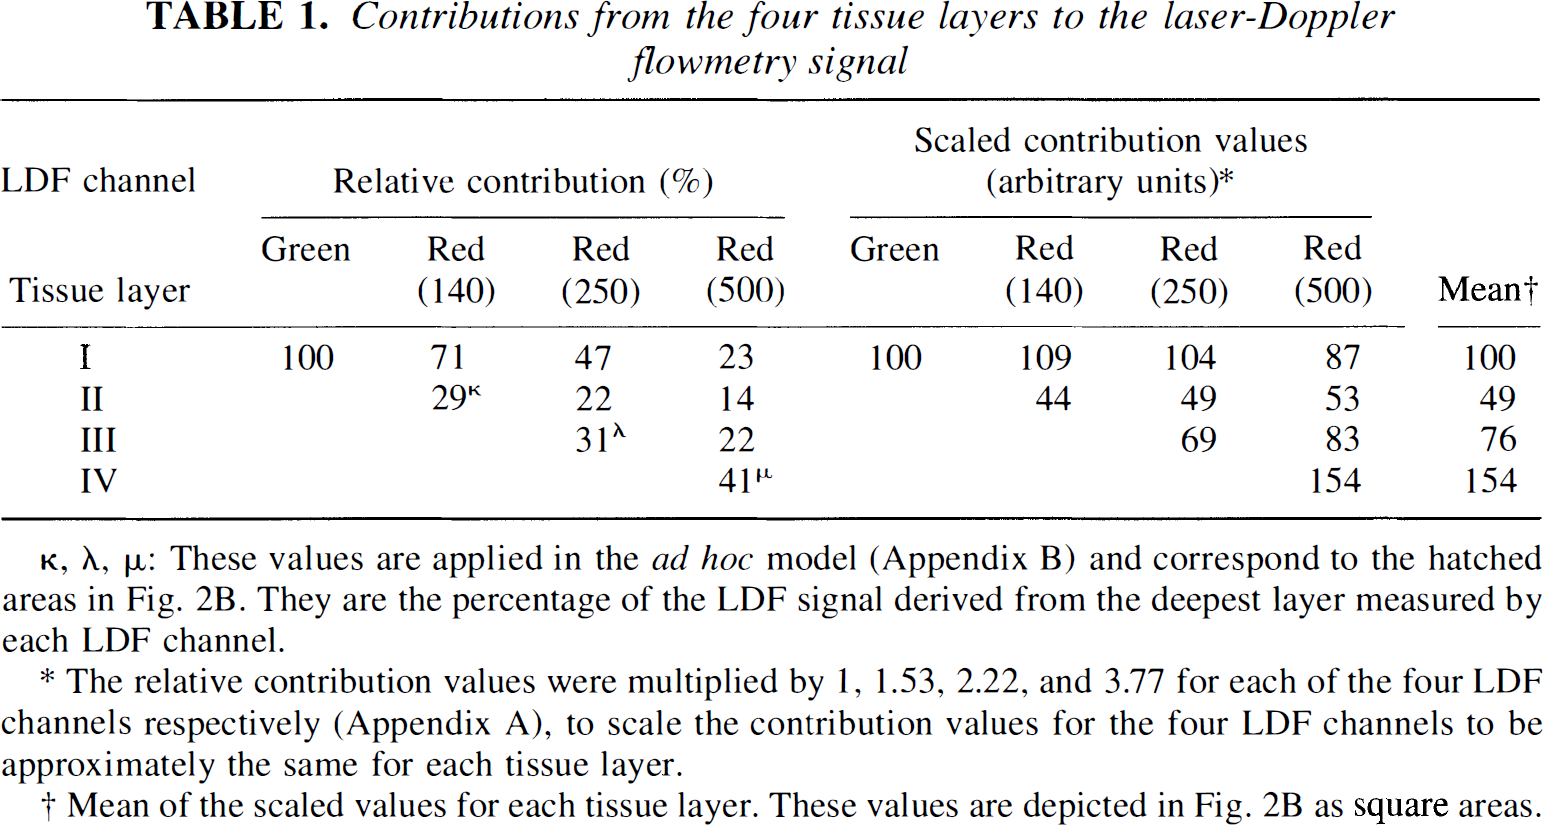
κ, λ, μ: These values are applied in the ad hoc model (Appendix B) and correspond to the hatched areas in Fig. 2B. They are the percentage of the LDF signal derived from the deepest layer measured by each LDF channel.
The relative contribution values were multiplied by 1, 1.53, 2.22, and 3.77 for each of the four LDF channels respectively (Appendix A), to scale the contribution values for the four LDF channels to be approximately the same for each tissue layer.
Mean of the scaled values for each tissue layer. These values are depicted in Fig. 2B as square areas.
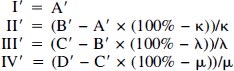
For simplicity, we estimated the CBF changes in each tissue layer based on recordings obtained in two LDF channels only. We assumed that whereas only one of these channels sampled from the layer of interest, samplings from more superficial layers measured by both channels were proportional (Fig. 2B; Appendix A). The percentages of the LDF signals derived from the deepest layer measured by each LDF channel are shown as hatched areas in Fig. 2B and were denoted κ for layer II, LDFRed(140) (channel B), λ for layer III, LDFRed(250) (channel C), and μ for layer IV, LDFRed(500) (channel D). (Table 1, left) The relative CBF increase (I′, A′, II′, etc.) in the four layers and four channels (where A is LDF-Green) can be expressed as:
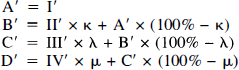
Based on this model, relative changes of CBF in the four tissue layers of the cortex can be estimated as illustrated below (Fig. 9, Appendix B).
At slice thicknesses of 150, 300, 600, and 1,200 μm, the blood flow velocity was reduced from 3 mm/s in four steps to 0 mm/s (Fig. 3A). For the three red laser channels, the relationship between the thickness of the interposed “tissue” and the attenuation of the LDF value was independent of the blood flow velocity—as long as an LDF signal above the basal noise level was recorded (Fig. 3A). This indicates that the in-depth resolution is independent of the flow velocity.
(
Laser-Doppler flowmetry measurements of blood flow for each of the four channels correlated linearly with the flow velocities measured simultaneously with electromagnetic flowmeter at flow rates between 0 and 3 mm/s (n = 40; R2; 0.93 to 0.98) (Fig. 3B). Therefore, relative flow increases of the channels may be compared without regard to the actual CBF measured at individual channels.
To test for the influence of hemoglobin oxygenation, blood bubbled with 100% O2 was instantaneously replaced by blood bubbled with 100% N2. The resultant change in oxygenation from 100% to 5% did not affect the LDF signals (Fig. 4). This finding was not unexpected. The curves for the light absorption coefficients of oxyhemoglobin and deoxyhemoglobin as a function of wavelength have a winding course and are widely separated at most wavelengths, but they intersect close to 543 nm and close to 780 nm (Yarborough, 1992).
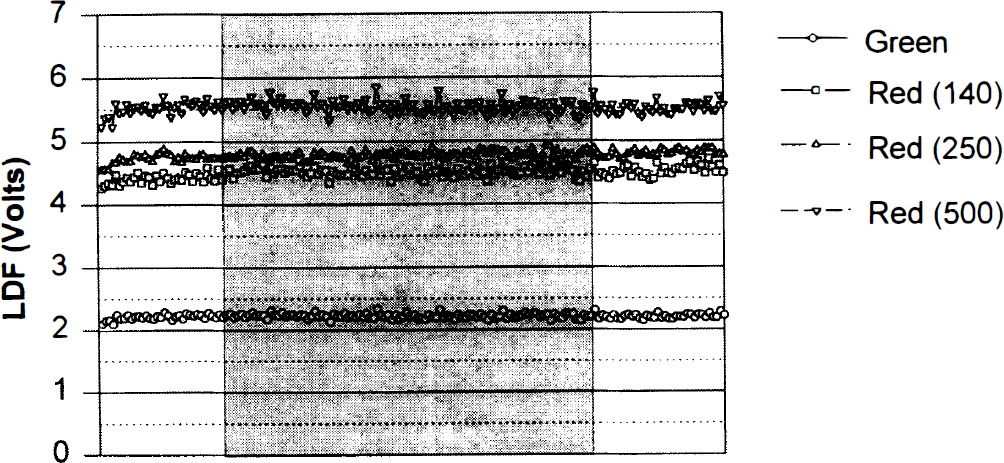
Glass capillary perfusion was switched from blood bubbled with 100% O2 to blood bubbled with 100% N2 (shaded area) and back. The resultant change in oxygenation from 100% to 5% did not affect the LDF signals.
In vivo measurements with the four-channel probe
The CBF values of the four channels recorded during control conditions varied between the animals. For comparison the values were normalized for each animal by dividing the observed value of each of the four channels by the mean of the four values (× 100%) (Fig. 5). For both cerebral and cerebellar cortex, the basal perfusion values of the four channels increased steadily from LDFGreen and through LDFRed(140), LDFRed(250), and LDFRed(500) in almost every animal (P < 0.001 for both tissues; parietal cortex, n = 13; cerebellum, n = 16). Thus, the basal perfusion value is dependent on wavelength and fiber separation.
Resting LDF values in rat cerebrum (n = 16) and cerebellum (n = 13) measured by the four-channel LDF-probe. Mean and SD are indicated. A uniform increase of perfusion values is seen by increasing wavelength and fiber separation. In this and following figures, the LDF channels are indicated as follows: Gr, Green; 140, Red(140); 250, Red(250); 500, Red(500).
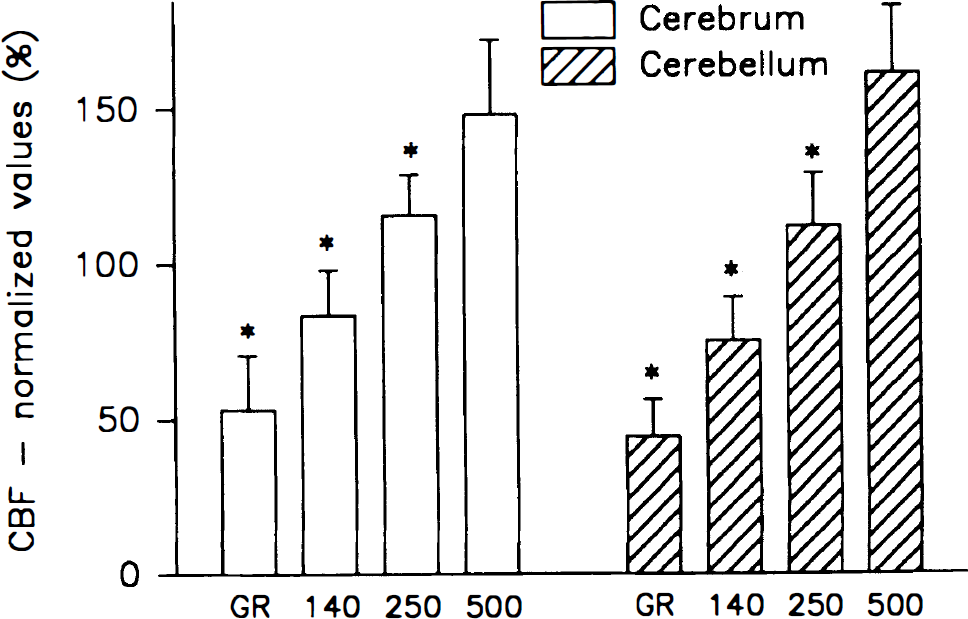
The vascular response to 5% hypercapnia varied between channels and regions (Fig. 6). In the cerebellum, the highest CBF increase was recorded in the middle tissue layers, i.e., LDFRed(250) and LDFRed(140) (89% to 96%) whereas the perfusion increase was only 71% ± 24% in LDFRed(500) and 52% ± 41% in LDFGreen (P < 0.001). The lower increase of LDFGreen was independent of the rate of superfusion of the craniotomy with aerated and carbonated CSF (pH 7.30 to 7.40), as the response remained constant when the superfusion rate was increased in turn from 0 to 0.5 and 3 mL/min between successive episodes of hypercapnia (tested in three animals, data not shown). Thus, the lower increase of CBF in the green channel reflects a heterogeneous CBF response, not loss of CO2 from the surface.
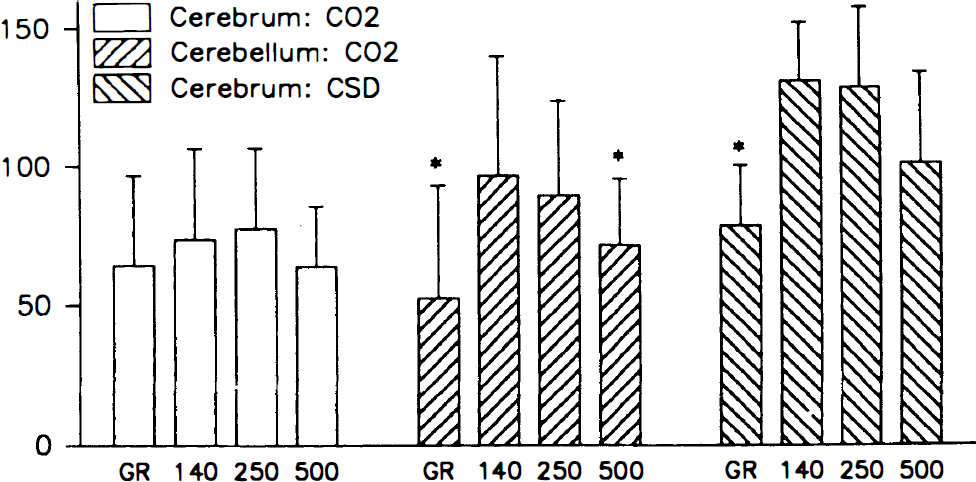
Relative increase of CBF in response to hypercapnia (5% CO2) in the cerebrum (n = 16) and cerebellum (n = 13) and to cortical spreading depression (CSD) (n = 5) in the cerebrum measured by LDF. Mean and SD are indicated. *, P > 0.001 (analysis of variance). Cerebral blood flow increases predominantly in the middle layers in response to hypercapnia in the cerebellum and in response to CSD in the cerebral cortex. The figure illustrates heterogeneous CBF responses to two types of vasodilator stimuli.
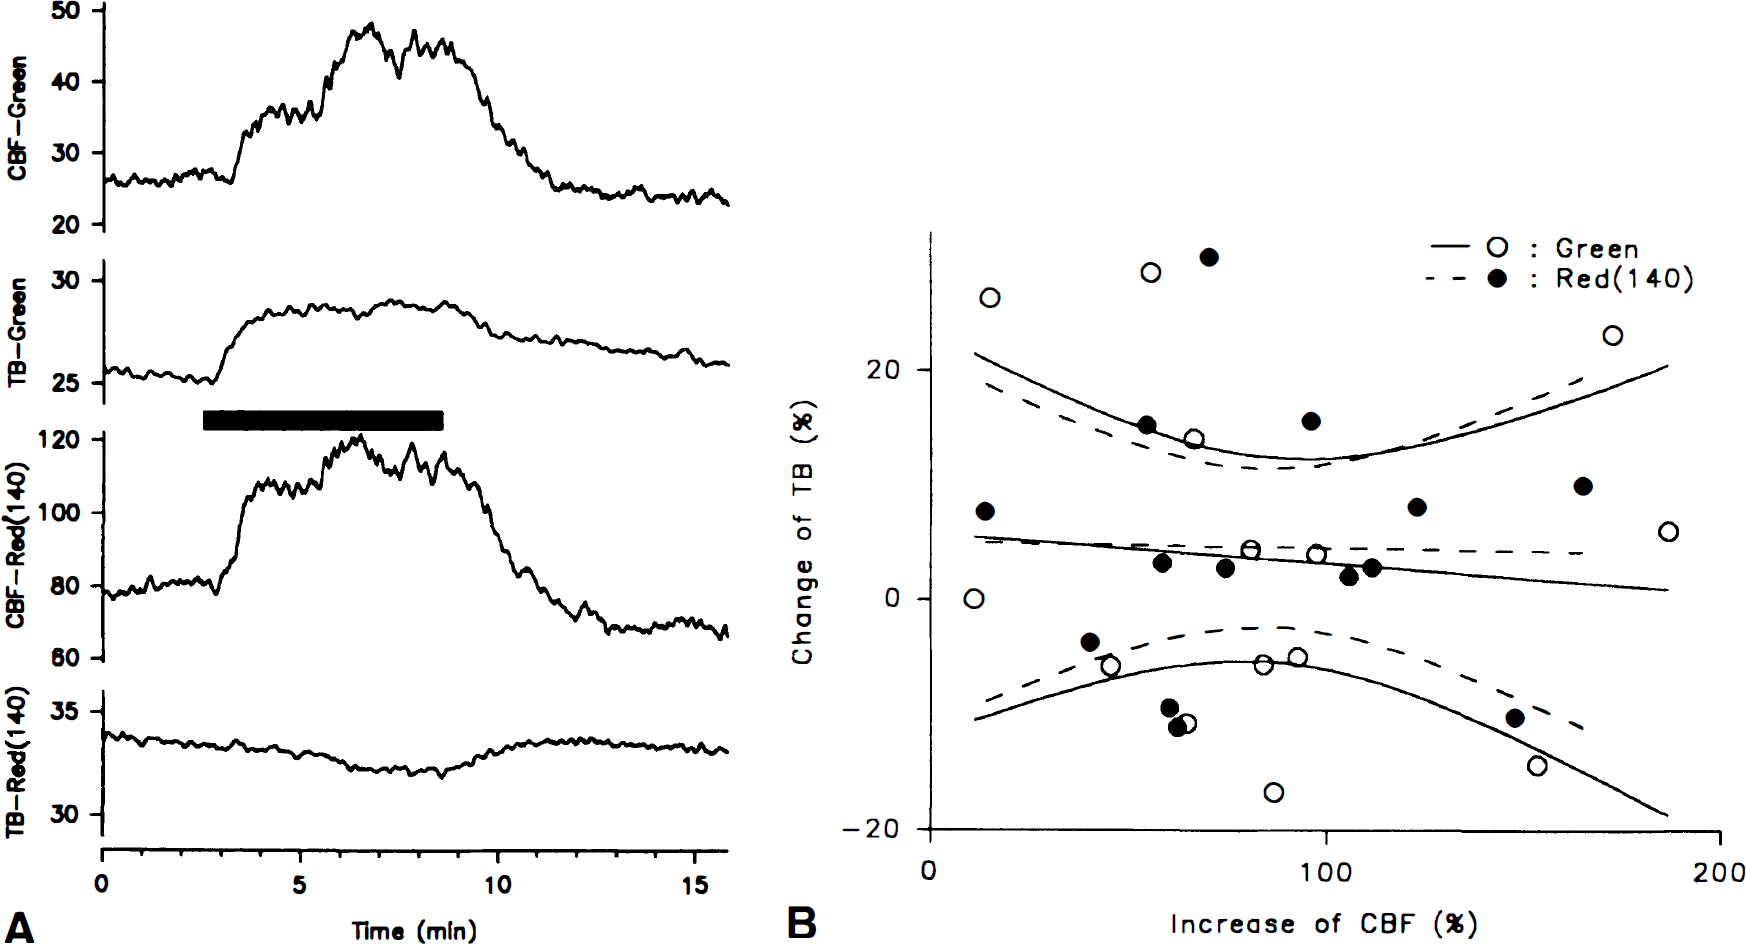
The change of total backscatter during inhalation of CO2 (2.5%, 5%, or 7.5%) was insignificant both for LDFGreen (4% ± 15%) and LDFRed(140) (5% ± 11%) (14 episodes in five animals). In both channels the size and direction of the change of total backscatter varied between episodes (Fig. 7A). There was no linear correlation of changes of total backscatter to increases of CBF (range, 11% to 189%) for either LDFGreen (r = 0.09; n = 14) or LDFRed(140) (r = 0.02; n = 14) (Fig. 7B). Thus, the increases of CBF measured in LDFGreen and LDFRed are independent of changes of total backscatter.
(
In the cerebral cortex a less heterogeneous profile of CBF changes was observed during hypercapnia (64% to 78%) (Fig. 6), indicating variations between cortical regions.
Cortical spreading depression, propagating from the frontal cortex, elicited a CBF response in the parietal cortex that was markedly heterogeneous, being 78% ± 22% in LDFGreen, and more than 50% higher in the other channels (117% to 130%; P < 0.001) (Fig. 6). This suggests a smaller increase of CBF in upper than in lower tissue layers of the cortex during CSD.
Adenosine (1 mmol/L) applied topically on the cerebellar cortex induced a rise of CBF that decreased with depth (112% → 53 %; P = 0.004), whereas the CBF response to injection of 30 nL adenosine (20 mmol/L) at a depth of 1,000 μm was highest at LDFRed(500) and LDFRed(250), and decreased toward the less penetrating channels (30% → 16%; P = 0.003) (Fig. 8). This suggests that adenosine acts on pial arterioles as well as intracortical vessels to increase CBF. It also supports the idea that the channels reflect changes of CBF at different depths. Injection of adenosine at a depth of 500 μm induced fairly equal increases of CBF in all channels, suggesting an influence on CBF in both more superficial and deeper layers. Injections at a depth of 2,000 μm gave less clear results: either no increase was seen, or, when larger volumes were injected, CBF increased in all channels. This might suggest that large injection volumes may spread along the injection micropipet to increase CBF throughout the tissue.
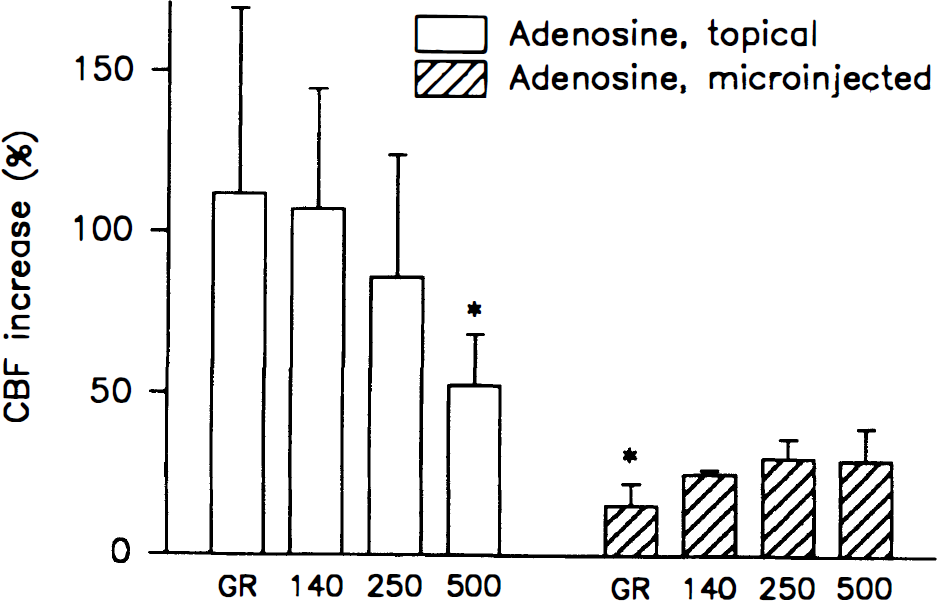
The CBF response to topical adenosine (1 mmol/L) (n = 7) decreased steadily as a function of depth, whereas the response to injection of 30 nL of adenosine (20 mmol/L) at a depth of 1,000 μm (n = 5) increased steadily with depth (*, P > 0.005). Thus, the highest increase of CBF corresponded to the point of application of adenosine.
Local tetanic stimulation of the cerebellar surface increased CBF by 76% ± 19% in LDFGreen and by 60% ± 19%, 44% ± 17%, and 24% ± 8% in LDFRed(140), LDFRed(250), and LDFRed(500), respectively (Fig. 9). If the in vitro evaluation of measurement depth corresponds to in vivo conditions, then LDFGreen exclusively measures CBF in the molecular layer of the cerebellar cortex (Llinas, 1981). The declining CBF increase at increasing depth of measurement (P < 0.001) is consistent with the functional anatomy of cerebellar neuronal circuits, which predicts that stimulation of the parallel fibers will increase CBF mainly, if not exclusively, in the superficial tissue layer of the cerebellar cortex. According to our model (Appendix B) the observed data corresponds to a CBF increase of 76%, 26%, 13%, and −5% in layers I, II, III, and IV, respectively (Fig. 9).
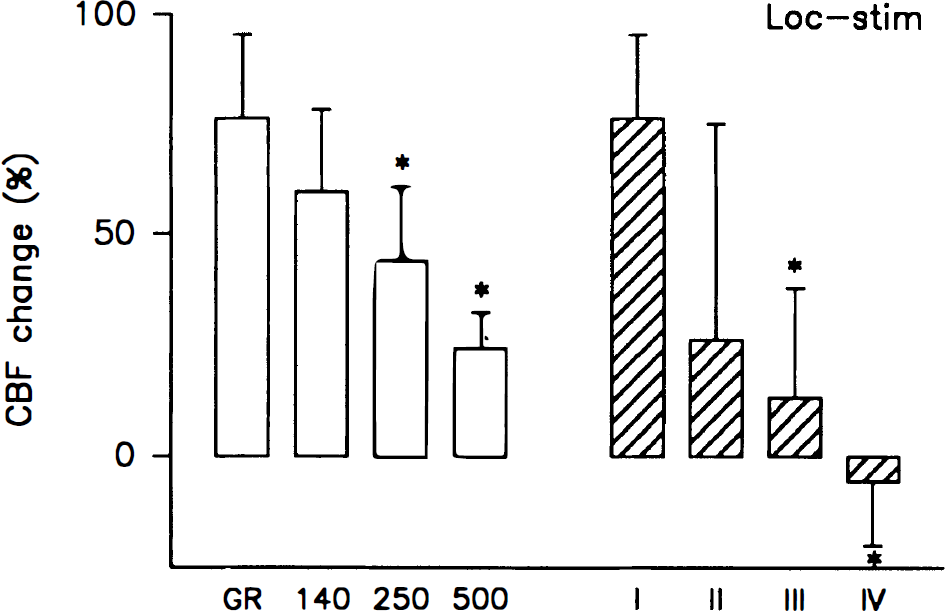
Local tetanic stimulation of the parallel fibers in the cerebellum increased CBF by 78% ± 8% in the upper tissue layer of the cerebellar cortex in which these fibers and their synaptic connections are located. The CBF increase declined at increasing depth of measurement (*, P < 0.001; n = 7). The calculated increases in the four layers I through IV are indicated, and show an even more marked decline of the CBF increase as a function of depth. Thus, local synaptic activity elicits local increases of CBF.
DISCUSSION
The in vitro test of our four-channel LDF probe demonstrated the potential for in-depth resolution of CBF measurements in real time. Figure 2 shows that in tissue with optical properties similar to the cerebral cortex, the measurement depth of the LDF signal increased by the wavelength of the laser light and by the separation distance of the optical fibers. This was anticipated from previous experiments in the skin (Gush and King, 1991) and from theoretical calculations (Jakobsson and Nilsson, 1993). The light intensity at the probe tip was approximately 30% less at 543 nm compared with that at 780 nm laser light. To compensate for this and for the higher tissue absorption of green laser light, three recording fibers was used in LDFGreen compared with one recording fiber for LDFRed(140) (Fig. 1A). The basal noise level in vitro (Fig. 3A, left graph) and the baseline variations in vivo (Fig. 7A) was similar for LDFGreen and LDFRed(140). Thus, the different measurement depth of the two wavelengths of laser light was not owing to different laser intensities or signal-to-noise ratios. The distribution in depth of moving erythrocytes contributing to the signal in each LDF channel is reflected in the attenuation profile of the LDF signal produced by increasing thickness of the interposed artificial brain tissue (Fig. 2). The Monte Carlo simulations (Jakobsson and Nilsson, 1993) anticipate a smooth bell-shaped curve of sampling density by depth, the level of maximal sampling intensity being deeper with increasing fiber separation. Our raw data showed a high contribution from the most superficial layer in all channels, corresponding to the initial steep slope of the attenuation profiles, whereas the contribution from deeper layers was less, because of attenuation of the signal as a function of distance (i.e., depth). Thus, CBF in the most superficial layers contributes substantially to the LDF signal in all channels, but otherwise our results are in fair agreement with the results of the Monte Carlo simulation.
Further characteristics of the laser-Doppler probe were tested in vitro: Fig. 3A illustrates that the attenuation of the LDF signal by interposed “artificial brain” slices is independent of the flow velocity through the underlying glass capillary. Thus, the measurement depth is independent of the actual blood flow velocity. Laser-Doppler flowmetry in the four channels and electromagnetic flow correlated linearly (Fig. 3B), as expected from previous calibrations of single-channel probes. However, the data presented here document that this linearity is unaffected by the simultaneous use of two wavelengths of laser light, two sets of optical filters, and different fiber separations. Finally, blood oxygenation did not affect the LDF signal (Fig. 4). Thus, the system is valid even in the face of major changes of blood oxygenation.
Laser-Doppler flowmetry measurement depth in vivo still remains to be settled, and our in vitro results are not the final answer to this problem. Direct transfer of the in vitro measurement profile to the in vivo situation is hampered by difference of conditions: for the in vitro experiments we used an agar-lipid gel mixed with erythrocytes that were stationary and suspended to homogeneity, and we had to assume that the absorption of light was independent of movement of these erythrocytes. The concentration of erythrocytes in the agar was constant, whereas the volume of moving blood cells in living tissue may change during stimulation. Thus, major increases of blood volume in vivo might lead to a reduction of measurement depth by increasing light absorption as discussed below. Furthermore, direct correlation of measurement depth in vitro to the in vivo situation must be done with caution, as nerve fiber orientation and density as well as other structures in real brain cortex add to the complexity of the light scattering. Nevertheless, our data do suggest the same proportion of measurement depth in vitro and in vivo.
Laser-Doppler flowmetry studies on skin have addressed the wavelength-dependent differences of blood flow measurements (Gush and King, 1991; Hales et al., 1993). Differences are mainly explained by the approximately 20 times greater red blood cell absorption for green light than for red light, whereas the fact that the penetration through excised skin is 60% higher for red light than for green light is considered of minor importance. The high absorption of green light by hemoglobin makes red blood cells in superficial capillaries the predominant source of the Doppler shift for green light, whereas a substantial part of red light undergoes multiple scattering by red blood cells in larger vessels as well without being absorbed (Gush and King, 1991). Thus, red light measures flow in these vessels (e.g., arteriovenous anastomoses in the skin) to a larger extent than green light. Accordingly, in addition to the different measurement depths at the two wavelengths, one has to consider the vessel morphology of the tissue when interpreting the results (Gush and King, 1991). The inhomogeneous structure of the skin makes this a critical point. In our in vitro study however, the agar suspension of erythrocytes resembles a tissue with capillaries only, rather than larger vessels. Moreover, our in vivo LDF measurements examine cerebral microcirculation in capillaries and small venules, not in larger surface vessels. In the brain of the adult rat, capillary density increases steadily from the upper to the middle layers of the cortex (Bär, 1980), making the upper layers more transparent, but tissue and vessel morphology is homogeneous without abrupt changes of vessel architecture (Yu et al., 1994). Thus, the contribution from the different layers of the cortex to the laser-Doppler signal can be assumed to depend mainly on measurement depth.
Our in vivo data support this notion because adenosine induced a local increase of CBF that was greatest closest to the point of application (Fig. 8). The graded CBF response to topical adenosine might reflect diffusion of adenosine through the cortex, or a graded response to a vasodilator stimulus acting only at the surface. Similarly, the response to injection of adenosine at a depth of 1,000 μm might reflect a very localized direct action of adenosine at this depth and an upstream vasodilation that increased CBF in the superficial layers, or the concentration of adenosine might decrease gradually toward the surface because of diffusion from the injection site. Nevertheless, the low response in LDFGreen and in LDFRed(140) to injection of adenosine at 1,000 μm supports the idea that these two channels measure CBF superficially, whereas the higher increase of CBF measured by LDFRed(250) and LDFRed(500) support that these channels measure at depths around 1 mm as predicted from the in vitro study.
The basal LDF values increased as a function of fiber separation and wavelength in vivo (Fig. 5) as well as in vitro (Fig. 3A). The increase found in vitro contrasts with the homogeneous blood flow through the glass capillary. Thus, comparison of absolute LDF values between different fiber systems makes little sense, and an inhomogeneity of basal blood flow in the cortex cannot be detected by this method. However, comparison of relative changes of CBF are valid (Fabricius and Lauritzen, 1996).
Capillary density in different brain regions is related to local CBF (Klein et al., 1986), but it is not known whether this relationship also exists in different layers of the same region. Thus, perfusion near the surface could possibly be lower than in the middle layers. Alternatively, a higher flow rate of erythrocytes through the fewer capillaries near the surface could compensate for a lower density of capillaries and lead to an even distribution of perfusion throughout the cortex. Examination of autoradiograms after injection of 14[C]-iodoantipyrine reveals no signs of heterogeneous perfusion as a function of depth (data not shown). With a spatial resolution on the order of 200 μm, this suggests that a higher flow rate may indeed compensate for a lower capillary density in this layer, but further studies are needed to clarify this issue.
The heterogeneous CBF response to hypercapnia in the cerebellum and to CSD in the parietal cortex may indicate that the responsiveness of the cortical vasculature varies as a function of depth (Fig. 6). If the tissue is homogeneously perfused at rest, a higher perfusion of the fewer capillaries in the most superficial layer is needed to keep a homogeneous flow through the cortex. This might explain why the response to hypercapnia and CSD is heterogeneous: the most superficial capillaries are closer to their maximal capacity during rest than the capillaries located deeper in the cortex, and therefore have less capacity for a flow increase. An alternative explanation to the findings is a transient decrease of measurement depth in LDFGreen owing to an increase in the concentration of moving blood cells during the CBF increase. This increase of blood volume is expected to affect the measurement depth of LDFGreen far more than the other channels, because the absorption coefficient of hemoglobin for green light (543 nm) is approximately 20 times larger than for near-infrared light (780 nm) (Yarborough, 1992). A reduction of measurement depth in LDFGreen might lead to an underestimation of the CBF increase proportional to the reduction of the tissue volume measured, thus affecting the linearity of the channel. However, blood cell velocity increases far more than blood volume during hypercapnia (Barfod et al., 1997), and we found increases of blood volume during CSD in LDFGreen of only 17% ± 21% (data not shown). Furthermore, increases of blood volume in the microcirculation are mainly attained by more erythrocytes filling the capillaries, not by vasodilation, i.e., the tissue is not obscured by bulk enlargement of vessels. An overall increase of light absorption would cause total backscatter to decrease, possibly reflecting a decrease of measurement depth. During hypercapnia, changes of total backscatter were often detected in parallel with the CBF increase, but the change could be either an increase or decrease in total backscatter (Fig. 7A), probably dependent on the spatial organization of the vascular and nervous tissue facing the LDF probe. On the average, no significant change of total backscatter was detected in either LDFGreen or LDFRed(140) (Fig. 7B). This suggests that the measurement depth in LDFGreen remains fairly unchanged during hypercapnia.
Simultaneous registration of synaptic activity and changes of CBF in depth is one promising aspect of the new LDF probe. The congruence of increased synaptic activity and increased CBF as a function of depth during electrical stimulation of the cerebellar parallel fibers (Fig. 9) is, to our knowledge, the first on-line indication of such a relationship. The finding opens interesting perspectives for investigations of this relationship in the future.
Based on the well-defined settings in vitro we constructed an ad hoc model to give approximate estimates of CBF in four separate layers based on the changes of CBF in the four LDF channels (Fig. 2B). The model illustrates two main points: first, that a considerable overlap exists between the layers measured by the different channels, and second that differences of perfusion increases between two LDF channels give at least qualitative information about differences of perfusion in two separate tissue layers of the cortex even if the quantitative changes in the deeper layers can be estimated only roughly. Thus, the increase of CBF during tetanic stimulation of the most superficial layer of the cerebellar cortex appears almost exclusively located in this layer (Fig. 9). A similar accentuation of the profile is found for the response to topical adenosine when CBF changes in the separate layers are estimated. Applying the algorithm to the data for hypercapnia and CSD gives a clear profile with a much higher increase of CBF in layer II than in the other layers. The tendency of a more marked profile after calculating the CBF increase of the four layers according to the ad hoc model is consistent, even if κ, λ, and μ in the algorithms are varied between 25% and 50%. Thus, the apparent relative CBF changes of the four channels is an underestimation of the differences of perfusion changes throughout the cortex.
In summary, the four channel probe gave on-line real-time information about CBF changes as a function of depth. Autoradiography, in comparison, gives information about laminar CBF changes in absolute values, but only at a single time point. Applying the probe in vivo is straightforward, but there are certain limitations. The position of the probe is critical for the basal values recorded by LDF in vivo, and small movements of the probe cause major changes of these values. This is observed even when no pial vessels can be seen on the cortical surface. Furthermore, the functional anatomy of the pial vasculature suggests a polygonal structure with diameter variations of cortical columns between 200 and 800 μm (Scrimin, 1992). Thus, only certain positions at the surface of the cerebral cortex, i.e., at the center of a polygon, are fit for studies of the microcirculation with the four-channel probe. For LDFRed(250), and particularly LDFRed(500), pial vessels could easily be included in the tissue volume under study because of the greater fiber separation. However, pial vessels were easily avoided when measuring over the cerebellum, and even over the cerebral cortex such vessels could be avoided with some care taken. Most investigators use single LDF probes with 250 to 500 μm fiber separation, and the probe is placed at some distance from the cortex, either on the dura, on a coverslip, or on thinned bone. In these cases pial vessel circulation will inevitably contribute to the LDF signals. Knowledge of the separation of transmitting and receiving fibers in the LDF probe is important when comparing data between laboratories. The physiologic experiments showed clear heterogeneous patterns of perfusion in response to physiologic stimuli. This is the first demonstration of real-time heterogeneity of the cortical microcirculation in depth during functional activation of the cortex.
Footnotes
Acknowledgment
The authors thank Ms. Lillian Grøndahl for expert technical assistance and Peter Dalgaard, Ph.D., for inspiring discussions regarding the modeling of the data.
Abbreviations used
*
The term “layer” does not refer to the anatomic layers of the cerebral or cerebellar cortex, unless specifically indicated.