
Abstract
Cortical spreading depression (CSD) induces marked hyperemia with a transient decrease of regional cerebral blood flow (rCBF), followed by sustained oligemia. To further understand the microcirculatory mechanisms associated with CSD, we examined the temporal changes of diameter of intraparenchymal penetrating arteries during CSD. In urethane-anesthetized mice, the diameter of single penetrating arteries at three depths was measured using two-photon microscopy during passage of repeated CSD, with continuous recordings of direct current potential and rCBF. The first CSD elicited marked constriction superimposed on the upstrokes of profound dilation throughout each depth of the penetrating artery, and the vasoreaction temporally corresponded to the change of rCBF. Second or later CSD elicited marked dilation with little or no constriction phase throughout each depth, and the vasodilation also temporally corresponded to the increase of rCBF. Furthermore, the peak dilation showed good negative correlations with basal diameter and increase of rCBF. Vasodilation induced by 5% CO2 inhalation was significantly suppressed after CSD passage at any depth as well as hyperperfusion. These results may indicate that CSD-induced rCBF changes mainly reflect the diametric changes of the intraparenchymal arteries, despite the elimination of responsiveness to hypercapnia.
Keywords
Introduction
Cortical spreading depression (CSD) and CSD-like depolarization waves involve mass depolarization of neurons and glial cells, followed by sustained suppression of spontaneous neuronal activity, 1 characterized by suppression of electrical activity, negative deflection of direct current (DC) potential, and redistribution of ions between extracellular and intracellular compartments. 2 CSD slowly propagates in gray matter regardless of functional divisions or the vascular network, and is thought to be involved in triggering headache and the symptoms of migraine aura, 3 as well as in various neurological disorders such as trauma and stroke. 4 These waves often induce profound metabolic and hemodynamic effects, resulting in exacerbation of the ischemic tissue outcome. 5
CSD induces characteristic changes in blood flow and energy metabolism6–9 accompanied with rapid ion fluxes at the membranes of neurons and astrocytes, 10 which lead to large changes in extracellular ion concentrations and affect tissue electrical resistance. 2 Increase of glucose utilization and metabolism 11 and the cerebral metabolic rate of oxygen 12 often lead to tissue hypoxia, 13 and are closely linked to cerebral blood flow (CBF) changes. 14
CSD has been experimentally elicited with chemical, electrical, or mechanical stimuli in various animals, and research in animal models has provided much information about its pathological role, as well as clues to potential clinical therapies. The CSD-induced response of CBF involves the production and release of multiple vasodilating and vasoconstricting factors by diverse cells within the neurovascular unit.8,15 In mice, CSD causes severe vasoconstriction, resulting in CBF and oxygenation decreases to ischemic levels.16–18 CSD-induced hyperemia is followed by a long-lasting decrease to below the prestimulus level, so-called post-CSD oligemia.19–21 At least three vasomotor elements, vasoconstrictive tone that temporally overlaps with the depolarization, profound hyperemia and long-lasting hypoemia, have been proposed, and the magnitude and timing of each element seem to be dependent on species, systemic and physiological state, pharmacological state and other factors. 6
We have shown that potassium-induced CSD elicited a biphasic response of regional CBF (rCBF), namely initial oligemia with capillary flow cessation followed by hyperemia, in anesthetized rats and cats,22,23 and an initial constriction of pial arteries followed by propagated dilation in rats. 24 We subsequently confirmed a remarkable constriction, followed by dilation and then long-lasting minor constriction of pial arteries in response to CSD, and we also found that the vasoreactivity was diminished with successive passages of CSD, even though the rCBF increase response was maintained. 25 In this work, to elucidate the mechanisms controlling the changes of microcirculation associated with CSD, we examined the behavior of intraparenchymal penetrating arteries by means of two-photon laser-scanning microscopy. Furthermore, we examined whether the responsiveness of the penetrating arteries to hypercapnia is affected by successive passages of CSD.
Materials and methods
General procedures
Animals were used with the approval (No.09058) of the Animal Ethics Committee of Keio University (Tokyo, Japan), and all experimental procedures were in accordance with the university's guidelines and the ARRIVE (Animal Research: Reporting In Vivo Experiments) reporting guidelines for the care and use of laboratory animals. Male Tie2-green fluorescent protein (GFP) transgenic mice (STOCK Tg [TIE2GFP] 287Sato/J; Jackson Lab, Bar Harbor, ME, USA) (8–12 months old, weighing 32.1 ± 1.9 g, N = 16) were used. Tie 2, a receptor of angiopoietins 1 and 2, is expressed specifically in endothelial cells, and fluorescent endothelial cells in Tie2-GFP transgenic mice can be specifically identified by means of fluorescence microscopy. 26 Mice were housed under diurnal lighting in an air-conditioned room at a temperature of 23.0 ± 1.0 ℃ and humidity of 55 ± 7%, and allowed food and tap water ad libitum.
Animals were anesthetized with urethane (1.1 g/kg of body weight, intraperitoneally) and additional doses were administered as required to maintain the depth of anesthesia, which was assessed in terms of stable physiological parameters and body movements. Each mouse was fixed to a head-holder (SG-4N modified to be flexible around the horizontal axis; Narishige Scientific Instrument Laboratory, Tokyo, Japan) and was intratracheally intubated to provide artificial ventilation with a small animal ventilator (SAR-830/AP, CWE, Inc., Ardmore, PA, USA) and to monitor endtidal CO2 with a CO2 analyzer (microCapStar, CWE, Inc.). Endtidal CO2 level was maintained constant by adjusting the ventilation volume and rate. A cranial window was made at the parieto-temporal region of the cerebral cortex (see below). Arterial blood pressure (ABP) was continuously recorded through a femoral arterial catheter via a surgical strain-gage (MLT0670 and ML117, ADInstruments Ltd., Dunedin, New Zealand) and heart rate (HR) was determined from the ABP wave. Body temperature was maintained at around 37 ℃ with a heating-pad and thermo-controller (BWT-100, Bioresearch Center Co., Ltd., Nagoya, Japan). Arterial blood gas and pH were analyzed with a blood gas analyzer (RapidLab 348, Siemens AG, Munich, Germany) before and after induction of CSD.
To induce CSD, KCl solution (1.0 M, 5–10 µl) was applied into an additional hole posterior to the cranial window, approximately 1 mm in diameter with a small incision of the dura, centered at the coordinates of 5 mm posterior and 2 mm lateral to the bregma, after confirmation that all parameters had remained stable for at least 10 min after the CO2 inhalation procedure (see below). CSD induction was performed only one series in one hemisphere, because hemodynamic and metabolic changes associated with second CSD may be different from those of first CSD.25,27 After an application of KCl solution, CSD usually occurred repeatedly at 5–10 min intervals. KCl solution was arbitrarily applied for additional induction of CSD up to 5–8 times in some mice. It is well established that CSD does not propagate from one hemisphere to the other, and does not interfere with the circulation or metabolic rate in the contralateral cortex.9,28 Therefore, CSD induction and measurement of arterial diameter were performed in both hemispheres in some mice.
Measurement of DC potential and rCBF
In the vicinity of the cranial window (see below), a direct current (DC) potential electrode (EEG-5002Ag, Bioresearch Center Co., Ltd.) and the probe (BF52, Advance Co., Ltd., Tokyo, Japan) of a laser Doppler flowmeter (LDF) (ALF 21, Advance Co., Ltd.) were positioned on the dura and on the skull, respectively, in order to avoid possible mechanical induction of CSD by incision of the dura. A short-pass filter IR 810 nm (Asahi Spectra Co., Ltd., Tokyo, Japan) was set in the LDF to sense the intrinsic laser (λ = 780 nm) and avoid sensing the pulse laser (λ = 900–950 nm) for two-photon microscopy. DC potential was applied at 1–100 Hz and digitized at 1 kHz with a differential headstage and differential extracellular amplifier (Model 4002 and EX1; Dagan Co., Minneapolis, MN, USA). Continuous recordings of ABP, as well as HR, rCBF, and DC potential, were stored on a multi-channel recorder (PowerLab 8/30; ADInstruments Ltd.) and LabChart software (ADInstruments Ltd.) was used for off-line analysis as described previously.
29
A schematic of the cranial window, the positions of the DC potential electrode, LDF probe, and the other small window for KCl application is shown in Figure 1(a).
Experimental set-up and typical recordings. (a) Schematic illustration of cranial window, and positions of the DC potential electrode, the LDF probe and another hole for KCl application. (b) Typical 3D image of cortical microvasculature and analyzed slices at the depth of 0, 150, and 300 µm from the surface of the cortex. The focused artery is indicated with arrows. Scale bars: 50 µm.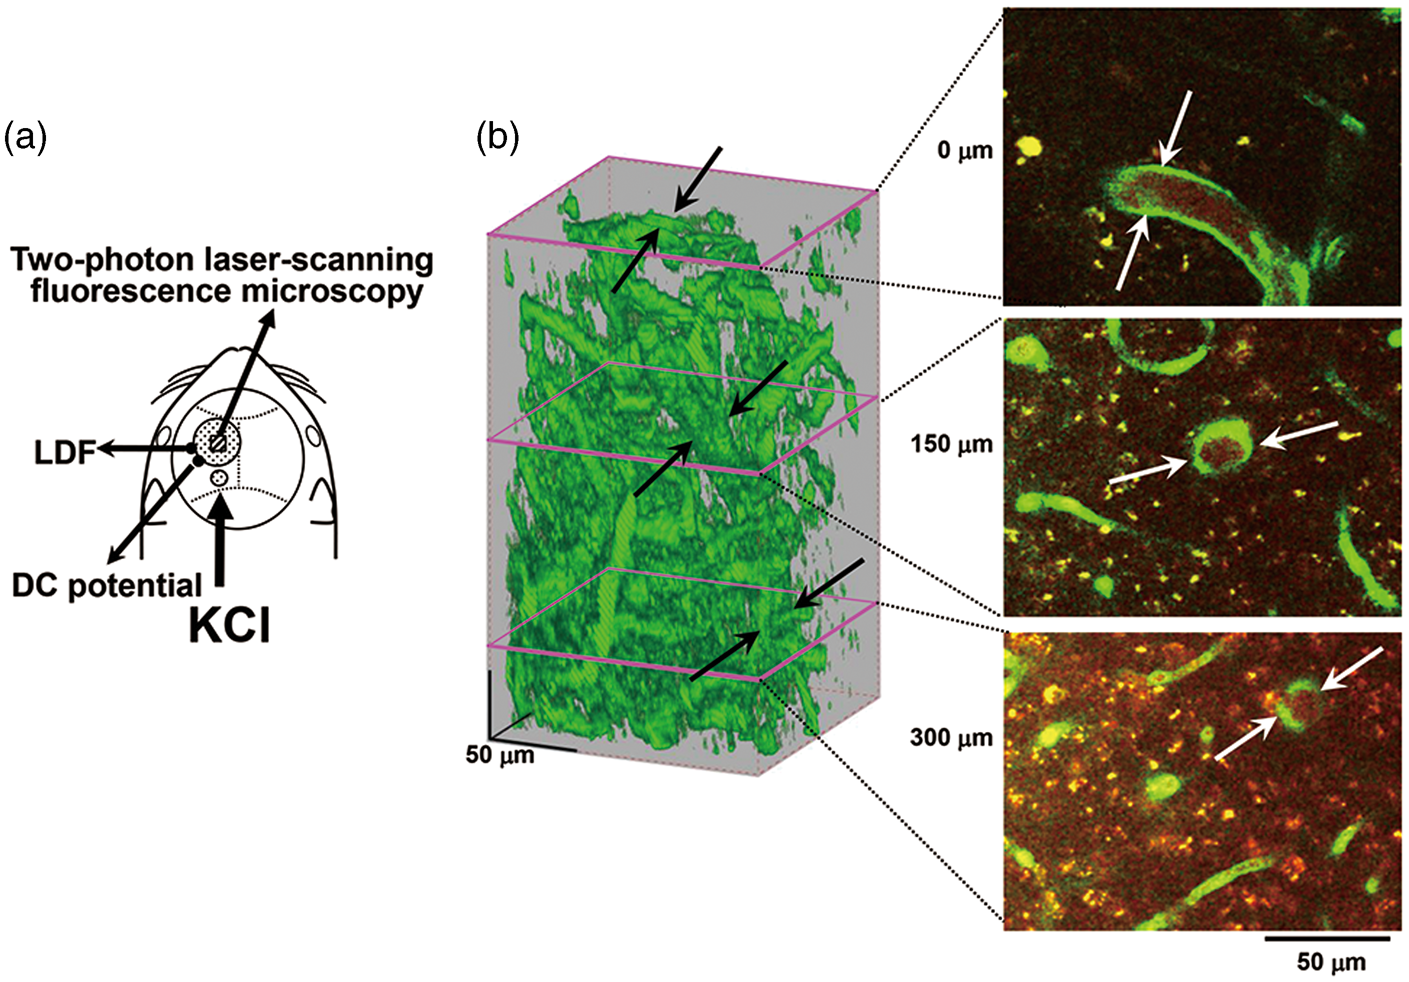
Imaging of penetrating arteries by two-photon microscopy
A cranial window of approximately 3 mm diameter was made at the parieto-temporal region of the cerebral cortex, and sealed with a circular 140-µm-thick quartz glass fixed with dental cement over the intact dura to prevent dehydration. 30 In a subset of the animals, rhodamine B isothiocyanate-dextran (MW 70,000, Sigma, St Louis, MO, USA) dissolved in saline (30–50 µl of 10 mg/ml solution) was intravascularly administered to highlight the vasculature. Imaging was conducted with a two-photon microscope (FV1200MPE, Olympus Co., Tokyo, Japan) excited at 900–950 nm with a femtosecond laser source, Ti:sapphire laser (MaiTaiHP, Spectra Physics, Santa Clara, CA, USA). A water immersion objective lens (XLPlanN25X/1.05WMP, Olympus Co.) was used to obtain high-resolution images. Emission was simultaneously detected through a band-pass filter for rhodamine (>575 nm) and GFP (510–550 nm). A single image plane consisted of 512-by-512 pixels and the in-plane pixel size was 0.5 µm. Volume images to a depth of 350 µm from the cortical surface were reconstructed from 71 images acquired at a z-step size of 5.0 µm. We focused on one penetrating artery that traveled deeper than 350 µm to measure the diameter in each region of interest (ROI) (Figure 1(b)).
Acquisition and analysis of the time course of background intensity and arterial diameter after CSD induction
Three images of the focused area containing the whole targeted penetrating artery were sequentially acquired, starting from the cortical surface (the entrance of the penetrating artery; 0 µm) and moving with a z-step of 145–150 µm to the deep cortex (Figure 1(b)). Acquisition time was approximately 1.9 s per frame and 5.9 s per cycle. After application of KCl solution or occurrence of CSD, 50–80 cycles were repeated at 6.0 s intervals.
Volume images and time-lapse images were reconstructed and analyzed offline with FV10-ASW software (Olympus Co.). Background intensity was estimated within parenchyma including no luminous (GFP-expressing) vessels in the cortical surface frames (0 µm) or within the whole imaging area in the intracortical frames (150–300 µm). The diameter of penetrating arteries was evaluated with image analysis software, ImagePro® Plus (Media Cybernetics Inc., Rockville, MD, USA). The diameter of the vessels was evaluated as the peak-to-peak distance of identical GFP-expressing endothelium. To avoid error arising from change of shape or fluctuation of the surface position, the cross-section was fixed through the imaging series (Supplementary figure 1). The cross-section at 0 µm was set vertically to the incoming angle of the pial artery.
Acquisition and analysis of arterial diameter during CO2 inhalation
Before CSD induction, volume images were acquired from six to seven frames with a z-step size of 2 µm around the same depths of the above-mentioned penetrating artery before, during, and after CO2 inhalation. The image acquisition was started at 30–60 s after the start of inhalation of a gas mixture of 5% CO2 in air, when rCBF measured with LDF showed plateau level. At the depth of 0 µm, images having identical shapes of surrounding vessels were selected among the volume images to avoid the influence of fluctuation of the surface position caused by hypercapnia, and the diameter was evaluated at the identical location. Average diameter was determined at each level in the parenchyma. Baseline rCBF remains low for approximately 30 to 60 min after occurrence of CSD (post-CSD oligemia). After five to eight CSDs had passed, the small hole used for KCl application was washed to end CSD induction. When no CSD had occurred for more than 3 min, imaging and CO2 inhalation procedure were performed. At approximately 10 min after imaging, 5% CO2 gas mixture was provided again and arterial blood gases were analyzed.
Data analysis
Changes of rCBF and vessel diameter are shown as percentages (%), and change of DC potential was calculated by subtracting the averaged level for 30–60 s before the onset of the DC potential deflection in each CSD. DC potential, rCBF, and diametric response of arteries were temporally averaged every 6 s. The criterion time for diametric change was set at the beginning of the rapid drop of background intensity at the intracortical level (see below). The criterion time for simultaneously recorded DC potential and first CSD-induced rCBF was set at the maximum trough. The criterion time for rCBF in the case of second or later CSD was set at the time when the value exceeded the average plus 2 × SD.
All data are reported as means ± SD. The correlation between basal diameter and % change was analyzed and Pearson's product moment correlation coefficient was obtained using Pearson's correlation and least-squares regression analysis. Changes of physiological parameters, rCBF and arterial diameter in response to CSDs and CO2 inhalation were analyzed using a paired t-test versus the prior CSD and pre-CO2 inhalation values, respectively. These changes were also analyzed between before/after CSD passage using a paired t-test. A p value of <0.05 was considered to be statistically significant.
Results
General results
Physiological parameters and blood gases before and after CSD induction (before the CO2 inhalation procedure) are shown in Supplementary table (1) and (2). Mean arterial blood pressure (MABP) was maintained within ± 20 mmHg in each mouse throughout the experiment. The data of four mice in which the MABP decreased below 60 mmHg or the arterial blood oxygen pressure decreased below 70 mmHg were excluded.
Changes of penetrating artery diameter
Arteries could be discriminated by the presence of dense and thick accumulations of GFP-expressing endothelial cells, whereas the venous endothelium showed only sparse and spot-like distributions. A total of 16 penetrating arteries from 14 mice were used for analysis of the time course of response to CSD. One application of KCl repeatedly induced negative deflections of DC potential (i.e. CSD) without any apparent changes in physiological parameters, as shown in Figure 2(a). Approximately 1 min after KCl application, each penetrating artery of interest constricted almost simultaneously at different depths, followed by dilation and gradually recovery (Figure 2(b) and (c) and Supplementary Movie). Vasoconstriction was accompanied with an apparent rapid decrease of intracortical background intensity, whereas the background intensity at the surface showed only a slight increase. Therefore, we set the time point of the rapid decrease of background intensity as the criterion time of CSD acquisition.
Typical results in one mouse. (a) Recordings of DC potential, rCBF, ABP, and HR in response to KCl application (indicated with an arrow). CSD as represented by DC deflection occurred repeatedly, as shown with open arrowheads. (b) Images obtained with the two-photon microscope at the depths of 0 µm, 150 µm, and 300 µm from the brain surface under the cranial window, clipped every 30 s. Times from the beginning of imaging are shown at the upper right. Scale bar: 20 µm. (c) Time courses of penetrating artery diameter change (upper panel) and background intensity (bottom panel) at several depths. Note that a rapid decrease of background intensity at the intracortical planes coincided temporally with rapid penetrating artery constriction.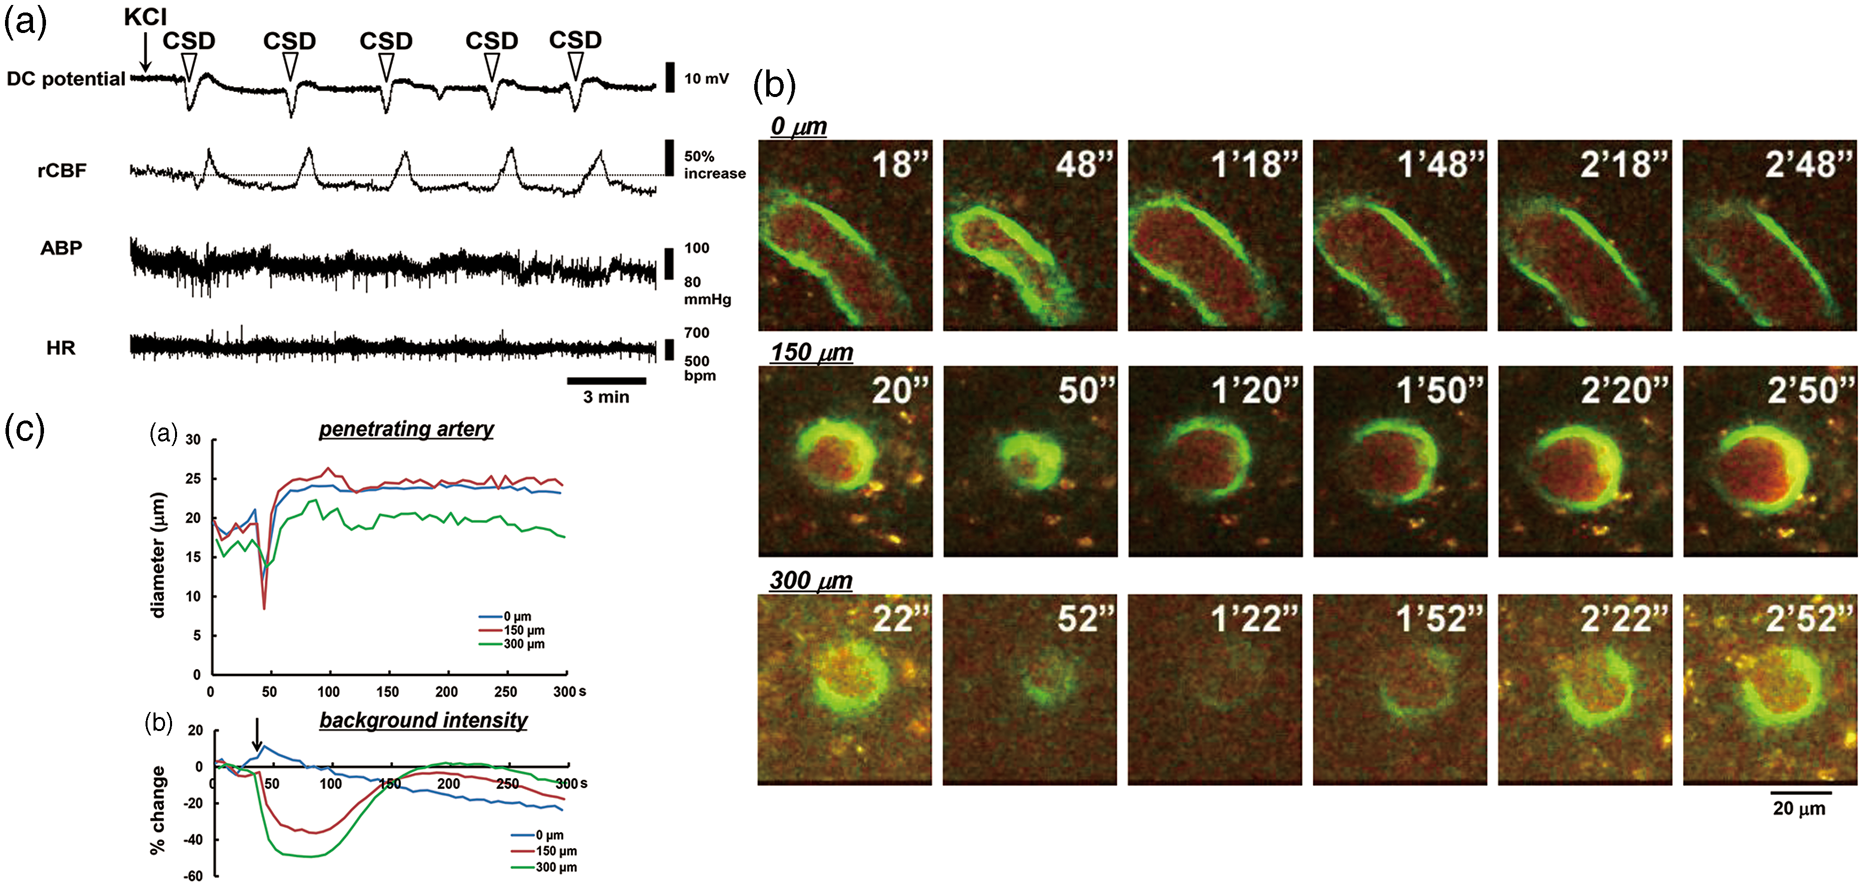
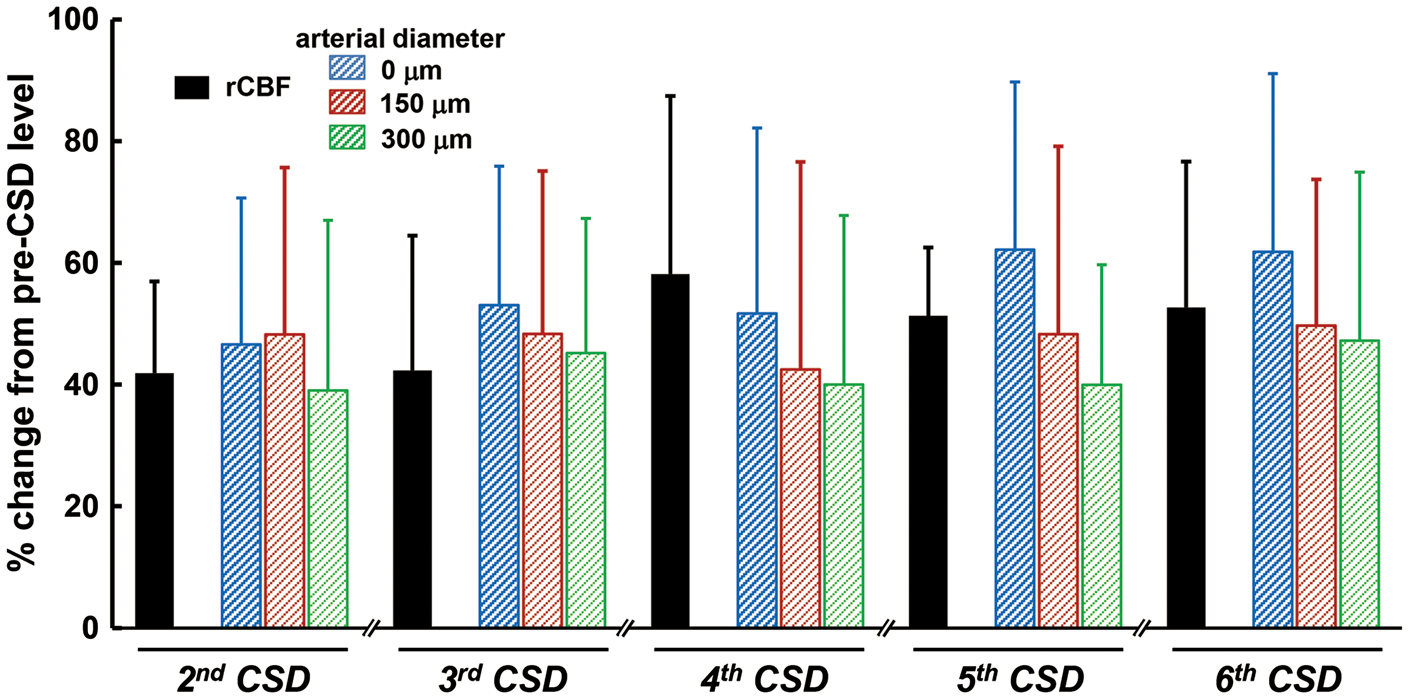
Temporally averaged results associated with repeated CSD are shown in Figure 3 and Supplementary figure 2 (n = 16). During first CSD passage, the penetrating artery began to dilate slightly before the rapid decrease of intracortical background intensity, followed by marked constriction at each depth to below the basal diameter (maximum trough; 0 µm, −30.3 ± 26.9%, p < 0.01; 150 µm, −30.2 ± 20.0%, p < 0.01; 300 µm, −25.2 ± 18.7%, p < 0.01) just after rapid decrease of background intensity, with subsequent dilation (maximum peak; 0 µm, 32.4 ± 15.8%, p < 0.01; 150 µm, 25.5 ± 21.8%, p < 0.01; 300 µm, 17.0 ± 17.2%, p < 0.01). Temporal change of simultaneously recorded rCBF was quite similar to the change of arterial diameter. The trough of DC potential coincided with the change of background intensity (Figure 3(a)). A subsequent episode of CSD elicited marked dilation at each depth, with transient slight constriction at the phase of increasing diameter. The temporal change of simultaneously recorded rCBF showed a significant increase without any transient decrease, and its duration was longer than that of arterial dilation. The trough of DC potential also matched the changes of background intensity quite closely (Figure 3(b)). Temporal changes and maximum changes of arterial diameter (marked dilation) and rCBF (marked hyperperfusion) with similar changes of DC potential were repeated during subsequent CSDs with only slight fluctuations (Figure 4 and Supplementary figure 3). After five to eight CSDs, rCBF significantly decreased (−21.8 ± 20.0%, p < 0.01; post-CSD oligemia) in all animals, whereas the diameter of the penetrating artery showed a slight but statistically significant constriction at 0 and 300 µm (Supplementary table (1)).
Temporal changes of average diameter of penetrating artery, background intensity, rCBF and DC potential associated with the passage of first CSD (a), and second CSD (b) induced by KCl application (n = 13–14). Temporal changes were evaluated relative to the level before the corresponding CSD. Filled circles of identical colors indicate statistically significant change (p < 0.05) as compared with the pre-CSD levels using the paired t-test at each depth 0 (blue), 150 (red), and 300 µm (green). Filled circles for DC potential and rCBF indicate statistically significant change (p < 0.05) as compared with the pre-CSD levels using the paired t-test. Half-transparent area shows ± standard deviation. The criterion times for arterial diameter and background intensity were determined when the background intensity in the intraparenchymal cortex rapidly decreased, as shown with arrows. The criterion times of DC potential and first CSD-induced rCBF were set at the trough of the changes and that of second CSD-induced rCBF was set at the beginning of the increase, as shown with arrow heads. To avoid overlapping of the response curves at each depth, temporal changes of arterial diameter and background intensity with standard deviation are shown in separate panels in Supplementary figure 2. Similar responses associated with third or later CSD passage are shown in Supplementary figure 3. The scale of the vertical axis for each category is the same. Note that slight vasodilation precedes the rapid fall of intensity. Summarized data of CSD-induced maximum increase of rCBF and penetrating artery vasodilation associated with second or later CSDs (n = 9–16). Maximum changes with respect to the pre-level of the respective CSD were statistically significant using the paired t-test (p < 0.01).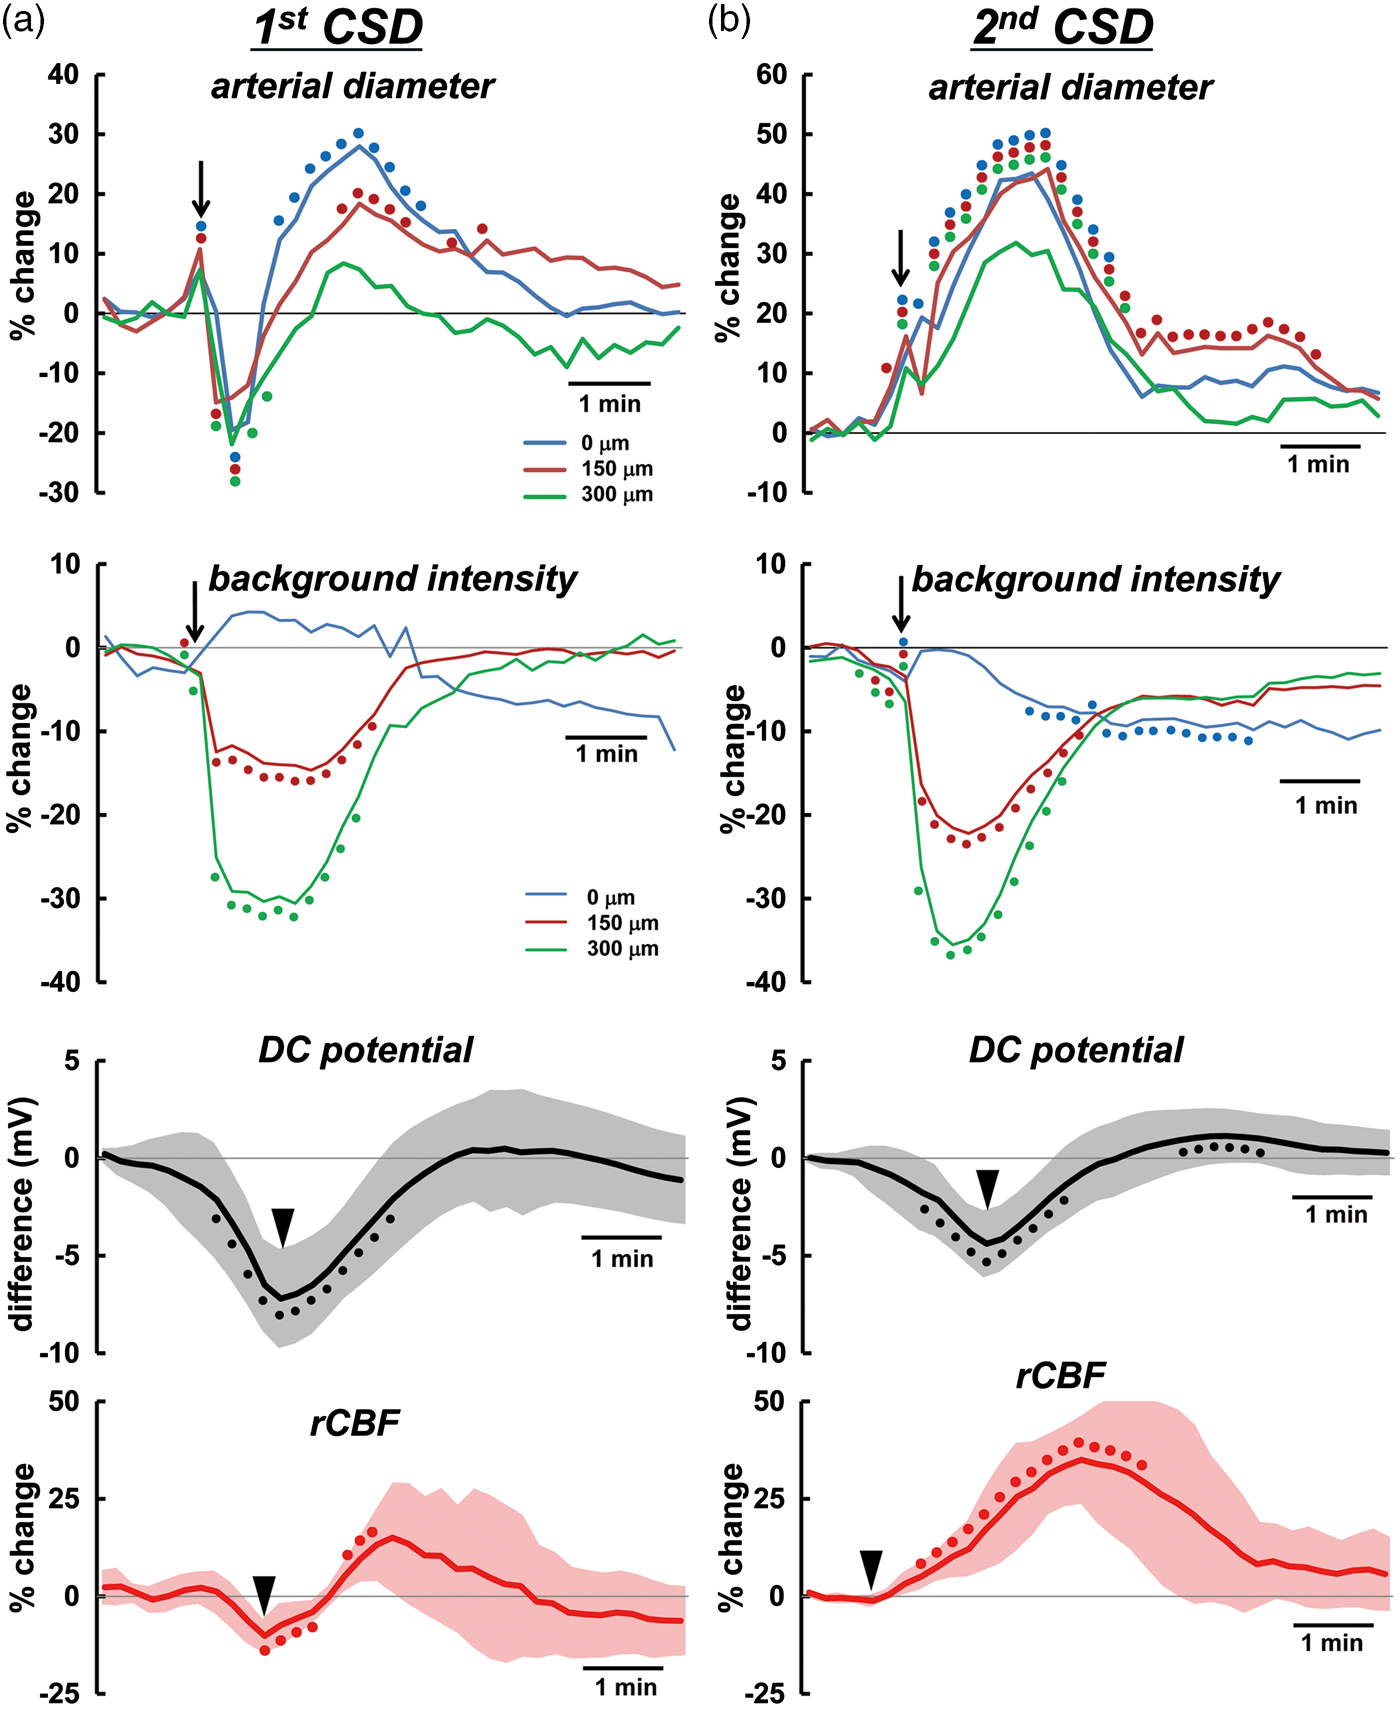
Correlation of diametric changes of penetrating artery
Initial constriction and subsequent dilation in the penetrating arteries in response to first CSD passage was weakly correlated with basal diameter, as shown in Figure 5(a) and (b). Subsequent CSD repeatedly elicited significant dilation that was negatively correlated with basal diameter, as shown in Figure 5(c) and Supplementary figure 4. Namely, the smaller arteries tended to show larger vasoreaction, except during the first CSD.
Correlation of diametric changes of penetrating arteries with basal diameter. Scatter diagrams and regression lines of initial vasoconstriction (a) and subsequent vasodilation (b) in response to first CSD and vasodilation in response to second CSD (c) as compared with the basal diameter of the same artery (n = 14–16). Solid lines show statistically significant (p < 0.05) and dotted lines show non-significant (p > 0.05) correlations. The correlation coefficient is shown in each graph and asterisks indicate statistical significance (p < 0.05). Similar correlations associated with third or later CSD passage are shown in Supplementary figure 4.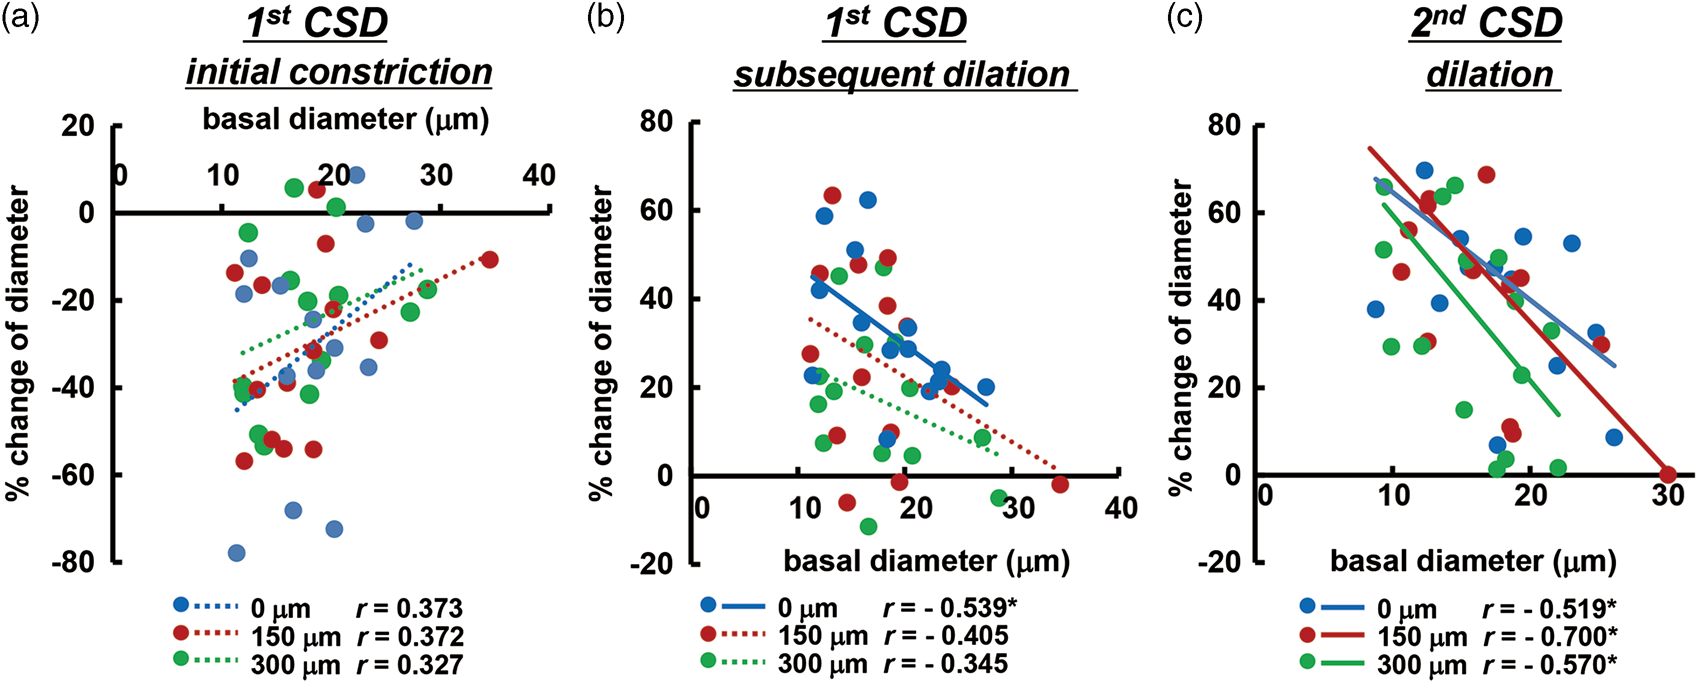
Next, we examined the correlation between second or later CSD-induced dilation of the penetrating artery and simultaneously recorded rCBF increase. No significant correlation was found at 0 and 150 µm, whereas there was a significant positive correlation at 300 µm depth (Figure 6).
Correlation of maximum changes of penetrating arteries with simultaneously recorded rCBF associated with second or later CSD. Scatter diagrams and regression lines of peak changes of penetrating arteries at 0 µm (a), 150 µm (b), and 300 µm (c) as compared with peak changes of rCBF (n = 26–29). Solid lines show statistically significant (p < 0.05) and dotted lines show non-significant (p > 0.05) correlations. The correlation coefficient is shown in each graph and an asterisk indicates statistical significance (p < 0.05).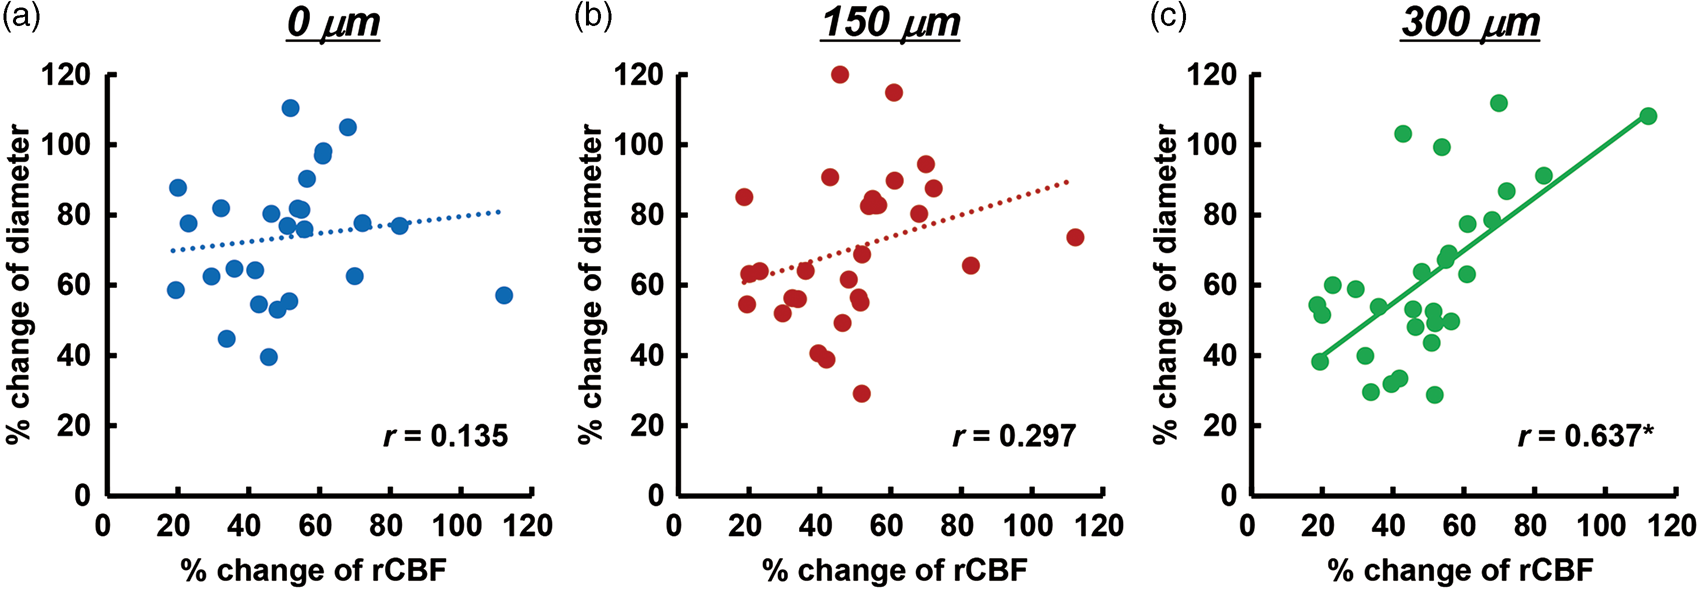
Vasoreactivity in response to CO2 inhalation
A total of 19 penetrating arteries from 14 mice were used for analysis for CO2 inhalation. Inhalation of 5% CO2 induced a marked increase of rCBF accompanied with a slight increase of ABP and a slight decrease of HR (Figure 7(a) and (b) and Supplementary table (3)). These changes were reversed after cessation of CO2 inhalation. Changes in ABP and HR were not significantly different between before and after CSD passage, namely CO2 inhalation had a systemically similar effect at both times. Basal level of rCBF and the diameter of penetrating artery were reduced after CSD passage by 17.3 ± 18.2% (p < 0.01), 14.6 ± 14.0% at 0 µm (p < 0.01), 12.9 ± 9.5% at 150 µm (p < 0.01) and 6.0 ± 10.0% at 300 µm (p < 0.05). Regional CBF and arterial diameter were significantly increased by CO2 inhalation before CSD passage, whereas the change of rCBF was reduced almost by half (p < 0.01 vs. before CSD) and the increase of arterial diameter was significantly reduced at each depth (p < 0.01 vs. before CSD) after CSD passage (Figure 7(c)). Changes of arterial diameter were negatively correlated with the basal diameter of the same vessel before CSD (Figure 7(d)), but after CSD passage, the correlation almost disappeared, even at 0 µm depth (r = −0.064).
Changes in rCBF, penetrating artery diameter and physiological parameters in response to 5% CO2 inhalation. Typical recordings of rCBF, ABP, and HR around the period of CO2 inhalation (a), and images of penetrating artery at three depths (b) before (left panel) and after (right panel) CSD induction. Note that the baseline of rCBF is reduced by 22% after CSD passage. Scale bars: 20 µm. (c) Summary of changes in rCBF and penetrating artery diameter at different depths from the surface of the brain in response to CO2 inhalation before and after CSD induction (n = 14–19). Significant differences versus pre-CO2 inhalation level using the paired t-test: *p < 0.05 and **p < 0.01. (d) Scatter diagram and regression lines of increases of penetrating arteries in response to 5% CO2 inhalation as compared with basal diameter of the same artery before CSD induction (n = 15–19). Solid lines show statistically significant (p < 0.05) and dotted lines show non-significant (p > 0.05) correlations. The correlation coefficient is shown and asterisks indicate statistical significance (p < 0.05).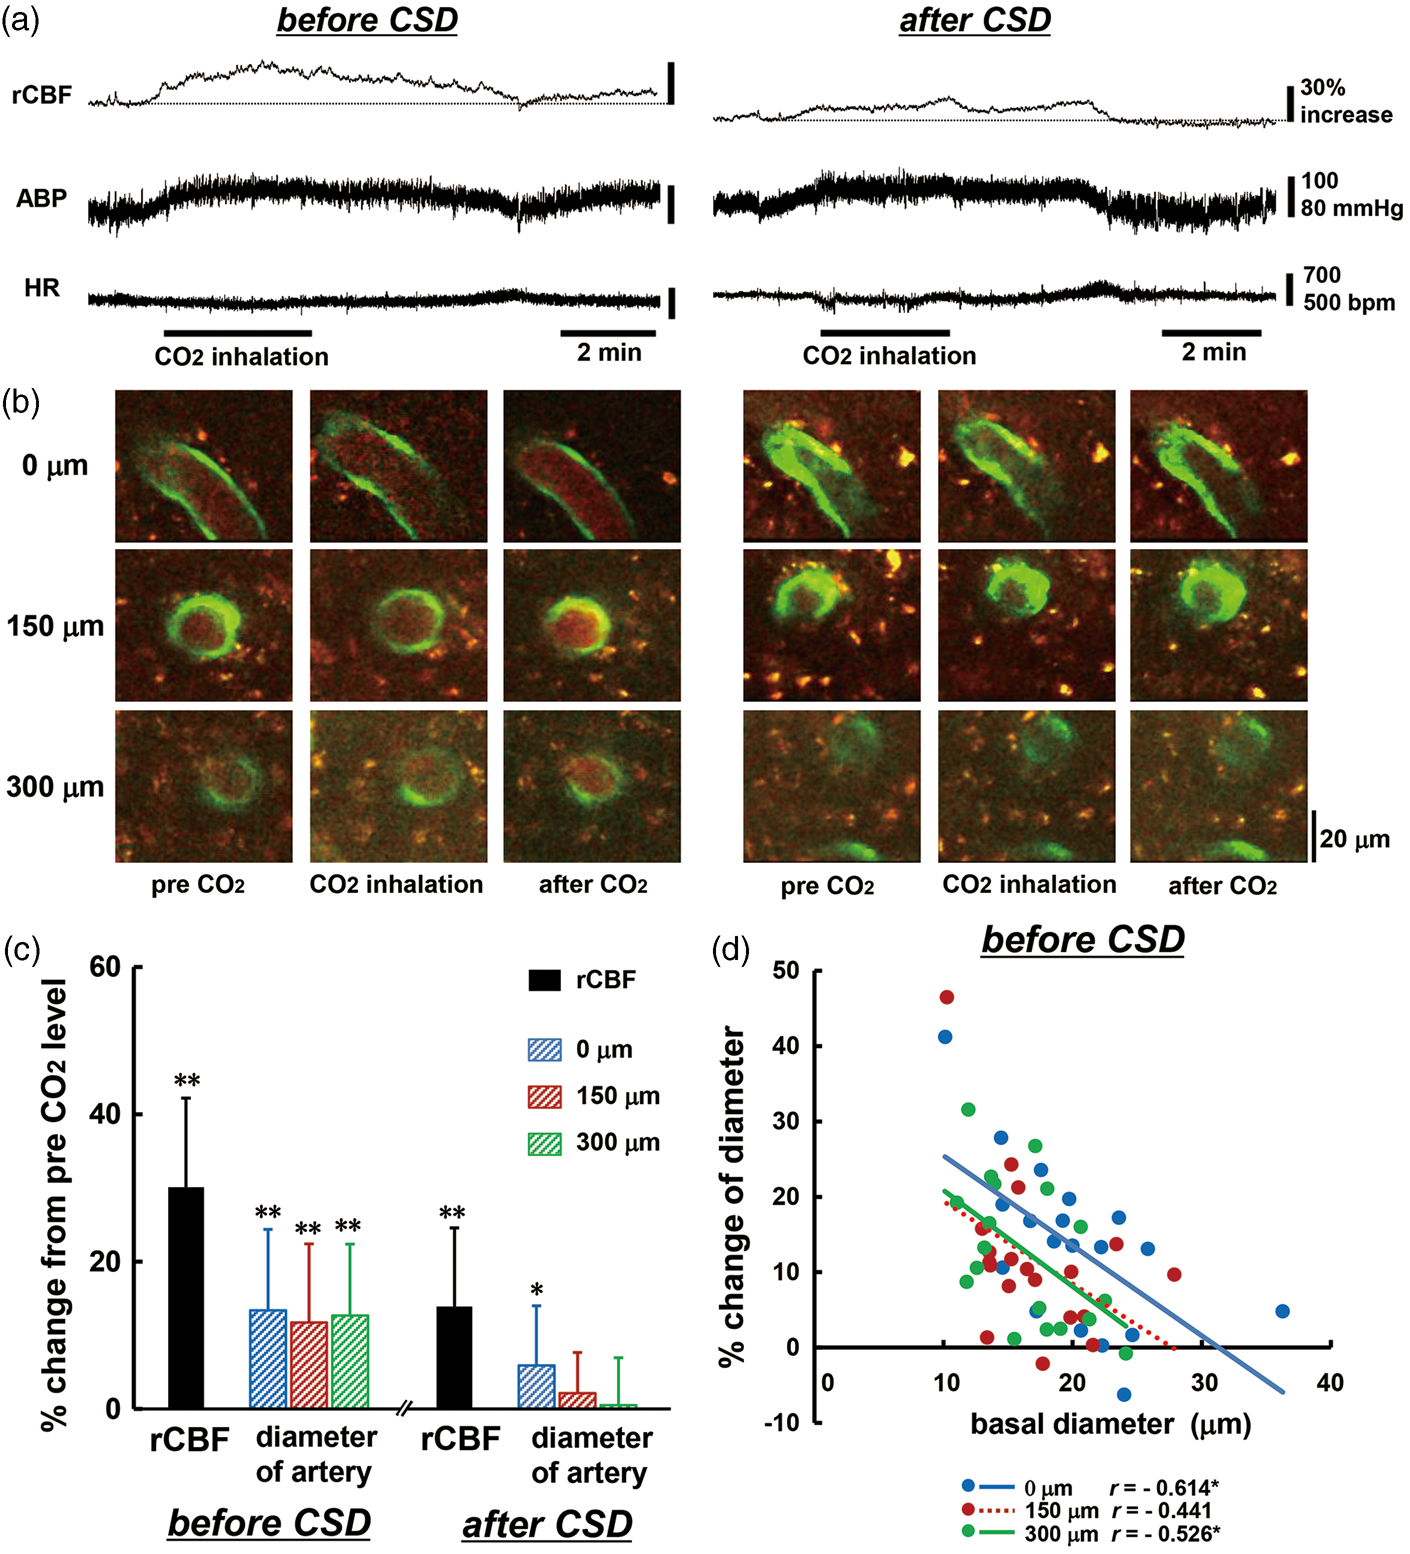
Discussion
Difference between penetrating artery and pial artery
Penetrating arteries were discriminated on the basis of dense and thick accumulations of GFP-expressing endothelial cells as previously described in the case of pial arteries. 25 We observed dramatic diametric changes in pial arteries, but little change in pial veins in good accordance with the sensory stimulus-evoked responses seen in cortical arteries specifically labeled with Alexa Fluor 633. 31
We previously demonstrated a rapid and remarkable constriction, subsequent dilation and then long-lasting constriction of pial arteries in response to CSD. Each of these responses was diminished with successive passages of CSD, even though the rCBF increase response was well maintained. 25
The initial constriction of penetrating arteries observed in the present study was comparable with that of pial arteries and temporally corresponded to a transient drop within the hyperperfusion period. On the other hand, pial arteries are richly innervated by extrinsic perivascular nerves. 32 Temporal changes of pial arteries and penetrating arteries might look similar, but the vasoreaction of pial arteries might be overridden by the effect of perivascular nerves. Indeed, chronic nasociliary and parasympathetic denervation attenuated CSD-induced hyperemia in rats. 33 Diffusion of parenchymal extracellular vasoactive metabolites might mean that there is little vasodilative effect on pial arteries. 34 Namely, the vasomotor response of penetrating arteries seems to be mainly driven by the parenchymal environment, whereas that of pial arteries seems to be at least in part influenced by extrinsic perivascular nerve activity, rather than parenchymally released vasoactive substances. Furthermore, diffusion of vasoactive substances to interstitial fluid surrounding pial arteries and/or the effect of extrinsic perivascular nerves might be diminished during repeated CSD.
Mechanism of vasoreaction of penetrating artery to first CSD
The initial vasoconstriction might be a direct effect of extracellular potassium on vascular smooth muscle, at least in part, because elevated K+ is known to induce constriction of isolated basilar arteries. 16 CSD caused an immediate rise of extracellular K+ level to more than 50 mM.35,36 Moderate elevation (<20 mM) of extracellular K+ causes vasodilation via K+ channels, 37 whereas higher concentrations lead to vasoconstriction. 38 Penetrating arteries began to dilate before the sudden fall of background intensity, possibly due to a moderate rise of K+ level, and then rapidly constricted concomitantly with the sudden fall of intensity, possibly due to a greater increase of K+ level (Figure 3).
First CSD-induced vasodilation was prominent at the entrance of the penetrating arteries, whereas penetrating arteries under the surface showed little dilation. This is consistent with previous findings in neonatal rats. 39 Since mild dilation was seen at the intermediate depth in this experiment, deep arteries might show little dilation, and thus, hyperemia seems to be intimately related to dilation of arteries on the brain surface and/or near the surface.
It was proposed that at least three vasomotor elements, initial constriction/hypoemia, subsequent dilation/hyperemia and following mild constriction/oligemia, overlap one another in cerebral arteries when the first CSD passes. 6 The magnitude and timing of each vasomotor element seem to be species-dependent, and can be modulated by cortical depth and/or various physiological factors. These counteracting mechanisms make the vasoreaction/rCBF relationship complicated. This may be the reason why the correlation between vasoreaction of penetrating arteries and basal diameter associated with first CSD was lower than that for subsequent CSD (Figure 5(a) and (b)).
Vasodilation of penetrating artery in response to repeated CSD
Vasoreactivities of penetrating artery, especially vasodilation in response to repeated CSD, were more prominent in smaller arteries and we found a significant negative correlation between diametric changes of penetrating arteries and basal diameter (Figure 5(c) and Supplementary figure 4). This is consistent with the results for pial arteries as summarized in a recent review. 8 However, there are only a few studies indicating in one experimental procedure.25,39 Indeed, this is the first report demonstrating the correlation in intraparenchymal penetrating arteries. It is possible that vessels having irregular diameter are converted to have a more consistent diameter and/or smaller vessels would more dilated, leading to an effective reduction of the vessel resistance.
Repeated CSD-induced vasodilation of penetrating arteries was prominent at each depth examined, whereas the dilative response of pial arteries was diminished.17,25 With or without vasodilation of pial arteries, a marked increase of rCBF was elicited. Depth-resolved LDF showed depth heterogeneity, in that a larger hyperemic response was found in deeper cortical layers (0.25–1 mm) compared with superficial layers or even deeper layers (below 1 mm) in response to CSD in rats.40,41 Furthermore, CSD-induced maximum vasodilation and increase of rCBF were significantly correlated in this study (Figure 6). Although the imaged penetrating arteries were located away from the rCBF measurement area, rCBF measured with LDF may be presumed to be close to the value in the imaged area, because the measured value with LDF is an average over a rather large area (approximately 1 mm in radius), and hemodynamic changes propagate accompanied with disturbance of ionic homeostasis. Considering these results and the similar temporal changes of vasodilation of penetrating arteries and simultaneously recorded rCBF, we consider that CSD-induced hyperperfusion may be largely due to vasodilation of capacious intraparenchymal arteries, including penetrating arteries.
Generally, fluid flow is proportional to the fourth power of radius according to Poiseuille's law. This may not strictly hold in vivo, because of viscosity changes and vessel resistance in winding vessels. However, the change of rCBF is usually larger than that of arterial diameter, as shown in our observation of hypercapnia (Figure 7). On the other hand, CSD-induced vasodilation of penetrating arteries is comparable with the change of rCBF (Figure 4). Because of the restricted location and the propagation of CSD-induced vasodilation, the LDF detection area might be too large, i.e. it might include nondilating areas, resulting in underestimation of rCBF.
Vasoconstriction of penetrating artery in response to repeated CSD
CSD profoundly increases energy consumption and metabolic rate, resulting in severe hypoxia, followed by metabolic suppression and critical oxygen supply-demand mismatch during oligemia.12,13,27 Arteries may be further constricted due to constrictive factors such as 20-hydroxyeicosatetraenoic acid (20-HETE), 42 prostanoids, 43 and mitochondrial permeability transition pore. 44 Repeated CSD elicited little or no constriction and pronounced dilation of penetrating artery in this experiment. Vasoconstriction due to pulsed changes associated with CSD may be relatively small in such a constrictive state. Therefore, vasodilation may be clearly apparent. Multiple CSD events may occur and aggravate the symptoms in patients with familial hemiplegic migraine, head trauma, or subarachnoid/intracerebral hemorrhage. 45 Thus, it may be important to investigate the effects of multiple CSDs in pathological states.
Vasoreactivity of penetrating artery in response to hypercapnia
The penetrating arteries that we examined exhibited vasodilation in response to CO2 inhalation, with a high correlation to basal diameter, but although their reactivity was greatly reduced, the change of rCBF partially remained (Figure 7). Hypercapnia induces broadly based vasodilation in mouse cerebral cortex, 46 whereas CSD induces an increase of rCBF predominantly in the middle layer of the rat cerebral cortex. 40 CSD might have a greater effect in the upper layer of the cerebral cortex, as shown by slightly larger vasodilation (Figure 4). Thus, the partially retained response of rCBF might be due to vasodilation in near-surface layers and in subcortical tissue, and/or local control mechanism(s) such as capillary flow, other than intraparenchymal arterial dilation.
Cerebrovascular reactivity to dilating stimuli such as hypercapnia, potassium, and somatosensory stimulation is severely impaired and neurovascular coupling is disrupted for hours after passage of CSD in anesthetized cats 47 and rats.14,48–50 The response to the direct vasodilator papaverine was diminished after CSD, 51 whereas responses to vasodilative mediators such as calcitonin gene-related peptide (CGRP) and adenylate cyclase activator forskolin were preserved. 52 Pretreatment with L-arginine, nitric oxide donor, or guanosine 3′,5′-cyclic monophosphate (cGMP) analogue 8-Br-cGMP recovered the reduced vascular reactivity to hypercapnia after CSD.53,54 Thus, CSD might suppress function within the vessel, including direct action on vascular smooth muscle, but might have little effect on parenchymal function, including release of neurotransmitters. Although the correlation of the responsiveness to hypercapnia was reduced after CSD, the correlation of vasodilation of penetrating artery elicited by repeated CSD was well maintained in this experiment. Previous experiments have examined pial arteries in various species. Our results indicated that penetrating arteries show similar behavior, suggesting that CSD-induced hyperemia is potently affected by parenchymal mediators.
Background intensity
Optical imaging of intrinsic signal (OIS) has been used to investigate optical properties of biological tissues, including light absorption and scattering, which reflect changes in hemoglobin concentration, cell swelling 48 and also the redox state of flavoprotein. 55 It has been demonstrated that CSD induces increases of light scattering, oxy-hemoglobin, reduced state of cytochrome c and cytochrome aa3 and decreases of deoxy-hemoglobin and flavin adenine dinucleotide, together with a DC potential deflection in rat. 56 A CSD-induced slight increase of OIS, indicating intracellular pH changes and hemodynamic response, was observed with DC potential deflection in rat. 57 A slight increase of background intensity at the surface of the brain and a rapid decrease in the deep cortex were observed at CSD passage, as observed in this experiment. An increase of OIS might be due to absorption and/or scattering of the laser beam in the upper layer of the cortex, resulting in a marked decrease of background intensity in the intracortical layer, because light scattering strongly affects signal strength in the deeper cortex in two-photon microscopy, resulting in a reduction of fluorescence. 58 Therefore, the distinct fall of the background intensity in the deep cortex is thought to be a potent indicator of CSD wave arrival.
Peri-infarct spreading depression-associated OIS might reflect blood flow rates in the rat cortex. 59 However, the exciting light of erythrocytes is around 600 nm, which is outside the excitatory range of the laser in two-photon microscopy, and the temporal change of intracortical background intensity was similar to that of DC potential deflection, but not rCBF change, especially at first CSD passage. Therefore, the influence of rCBF on background intensity might be small or negligible. Furthermore, since the CSD-associated Ca2+ wave precedes OIS change, 60 slight changes of background intensity and vasodilation might have occurred just before the criterion time (the time of rapid drop of the background intensity) (Figure 3), in accordance with a previous report. 17
Neurovascular coupling
CSD produces a decrease in vascular reactivity and play a significant role in disrupting the neurovascular coupling relationship. 48 On the other hand, the vasodilative response of the penetrating arteries to repeated CSD passage was well maintained, with a significant correlation between basal diameter and responsiveness.
The cerebrovascular responses to CSD involve various vasoactive factors derived from diverse cell types within the neurovascular unit.8,15 On the other hand, arterioles are innervated with extrinsic/intrinsic neurons that affect capillary flow through astrocyte endfeet or pericytes to the smooth muscle at the precapillary arterioles. 61 CSD-induced swelling of neurons and distortion of dendritic spines, 13 morphological changes of astrocyte endfeet, 62 and/or contraction of pericytes 63 might affect capillary flow. Decrease of red blood cell velocity in capillaries during CSD was demonstrated in rats.29,39 Although these responses might be too small for net control of CBF, dysfunction of local circulation might be harmful for neural function and the marked vasoconstriction induced by CSD might aggravate dysfunction of capillary flow. CSD may have a critical role in migraine aura and other brain disorders such as acute ischemia, head trauma, and subarachnoid hemorrhage. Therefore, we suggest that examination of the pathophysiological mechanism of this marked vasoreactivity of intraparenchymal arteries might lead to identification of a new target to protect brain function from cerebral injury.
Spreading depression, which occurs in pathological states such as reduced perfusion pressure, ischemia and subarachnoid hemorrhage, is often accompanied by augmented and/or prolonged initial constriction, which may exacerbate symptoms. 8 As the mechanism of initial constriction is poorly understood, compared with that of the subsequent dilation, further investigation seems warranted.
Conclusion
We observed a rapid and remarkable constriction of intraparenchymal penetrating arteries at each depth examined, in response to CSD. Successive passages of CSD induced prolonged and marked vasodilation, which temporally corresponded to rCBF increase, and impaired the vasoreactivity to hypercapnia. These results indicate that intraparenchymal arteries have a critical role in CSD-induced rCBF changes.
Footnotes
Funding
The author(s) disclosed receipt of the following financial support for the research, authorship, and/or publication of this article: This work was supported by JSPS KAKENHI Grant Numbers 22390182 (Suzuki N), 26350981 (Unekawa M), 15K06760 (Tomita Y), and 24590732 (Toriumi H).
Declaration of conflicting interests
The author(s) declared no potential conflicts of interest with respect to the research, authorship, and/or publication of this article.
Authors' contributions
MU contributed with design of the experiment, acquisition, analysis and interpretation of data, drafting, revising and approving the manuscript; YT contributed with design of the experiment, interpretation of data, revising and approving the manuscript; KM contributed with design, analysis and interpretation of data, revising and approving the manuscript; HT and TO contributed with design of the experiment, revising and approving the manuscript; IK and NS contributed with design of the experiment, interpretation of data, revising and approving the manuscript. All authors read and approved the final manuscript.
References
Supplementary Material
Please find the following supplemental material available below.
For Open Access articles published under a Creative Commons License, all supplemental material carries the same license as the article it is associated with.
For non-Open Access articles published, all supplemental material carries a non-exclusive license, and permission requests for re-use of supplemental material or any part of supplemental material shall be sent directly to the copyright owner as specified in the copyright notice associated with the article.