Hypoxemia and anemia are associated with increased CBF, but the mechanisms that link the changes in Pao2 or arterial O2 content (Cao2) with CBF are unclear. These experiments were intended to examine the contribution of nitric oxide. Cao2 in pentobarbital-anesthetized rabbits was reduced to approximately 6.5 mL O2/dL by hypoxemia (Pao2 approximately 24 to 26 mm Hg) or hemodilution with hetastarch (hematocrit approximately 14% to 15%). Animals with normal Cao2 (approximately 17.5 to 18 mL O2/dL) served as controls. In part I, each animal was given 3, 10, and 30 mg/kg Nω-nitro-l-arginine methyl ester (l-NAME) intravenously (total 43 mg/kg) to inhibit production of nitric oxide. Forebrain CBF was measured with radioactive microspheres approximately 15 to 20 minutes after each dose. Baseline CBF was greater in hypoxemic rabbits (111 ± 31 mL·100 g−1·min−1, mean ± SD) than in hemodiluted (70 ± 22 mL·100 g−1·min−1) or control animals (39 ± 12 mL·100 g−1·min−1). l-NAME (which reduced brain tissue nitric oxide synthase activity by approximately 65%) reduced CBF in hypoxemic animals to 80 ± 23 mL·100 g−1·min−1 (P < 0.0001), but had no significant effect on CBF in either anemic or control animals. In four additional rabbits, further hemodilution to a Cao2 of approximately 3.5 mL O2/dL increased baseline CBF to 126 ± 21 mL·100 g−1·min−1, but again there was no effect of l-NAME. In part II, animals were anesthetized as above, and a closed cranial window was prepared. The cyclic GMP (cGMP) content of the artificial CSF superfusate was measured under baseline conditions, and then after the reduction of Cao2 to approximately 6.5 mL O2/dL by either hypoxemia or hemodilution. Concentrations of cGMP did not change during either control conditions or after hemodilution. However, cGMP increased significantly with the induction of hypoxemia. The cGMP increase in hypoxemic animals could be blocked with l-NAME. These results suggest that nitric oxide plays some role in hypoxemic vasodilation, but not during hemodilution.
Hypoxemia and anemia are both accompanied by increases in CBF, but the mechanisms that control flow during reductions in Pao2 or oxygen content remain the subject of debate. Although it seems ideologically sensible that CBF should increase to compensate for a fall in arterial oxygen content (Cao2) and thus maintain O2 delivery (CBF × Cao2), the chemical or mechanical factors that sense changes and control responses have been elusive. This is particularly true with hemodilution. Whereas hypoxemia involves a reduction in Pao2, Cao2, and tissue oxygen tension (Pto2), hemodilution is associated with a reduced Cao2, a normal Pao2, a marked reduction in whole blood viscosity, and a poorly defined change in Pto2. The relative roles of these various parameters in defining CBF are still uncertain—although it is clear that changes in Cao2 and O2 availability are important.
We recently compared CBF during hemodilution and hypoxemia in rabbits. (Todd et al., 1994) We observed that at a Cao2 of approximately 6.0 to 6.5 mL O2/dL, (a Pao2 of approximately 26 mm Hg, or a hematocrit of approximately 14%), CBF was significantly greater in hypoxemic animals than in those subjected to hemodilution. Surprisingly, we also noted that cerebral O2 delivery decreased during progressive reductions in hematocrit, while it remained constant with hypoxemia; in other words, the increase in CBF did not “compensate” for the fall in Cao2. One possible explanation for the limited rise in CBF during hemodilution might be a reduction in the endothelial production of vasoactive substances. For example, it is well known that reductions in perfusate viscosity, and hence shear stress, on the endothelium will reduce the production of both nitric oxide (NO) and prostacyclin. (Hecker et al., 1993; Melkumyants et al., 1995; Pohl et al., 1991).
The current experiments were undertaken to examine the possible role of NO in the control of CBF during hypoxemia and anemia. Specifically, we measured the CBF responses to the systemic administration of a common nitric oxide synthase (NOS) inhibitor and examined the cortical release of cyclic GMP (cGMP) as a marker of NO action.
MATERIALS AND METHODS
All experiments were performed in male New Zealand White rabbits weighing 3.2 to 4.2 kg and were approved by the University of Iowa Animal Care and Use Committee.
Part I: CBF
Twenty-two animals were initially anesthetized with 5% halothane in O2 in a closed plastic box. A catheter was inserted into a marginal ear vein, and a tracheostomy performed. Succinylcholine (approximately 1.25 mg/kg) was given intravenously, and mechanical ventilation was started using an 02/N2 gas mixture (Fio2 approximately 0.4). Halothane was discontinued, and anesthesia thereafter was maintained with pentobarbital. This was given as a 50-mg/kg intravenous loading dose, followed by a continuous infusion at the rate of 5 to 7.5 mg/kg per hour This was dissolved in normal saline, which was delivered at the rate of 4 mL/kg per hour. Succinylcholine was added to the mixture in amounts sufficient to ensure the delivery of approximately 2.5 mg/kg per hour. An esophageal thermistor was inserted and body temperature thereafter maintained at 38° to 39°C using a warming blanket or heating lamp.
With the animal supine and after infiltration of all incision sites with 0.25% bupivicaine, PE-160 catheters were surgically inserted into the right femoral artery and into both brachial arteries. A PE-90 catheter with a coiled “pigtail” end was inserted into the right femoral artery and advanced until the tip rested in the left ventricle (as verified by observation of a typical ventricular pressure waveform). These catheters were secured, the animal was turned to the prone position, and the head was fixed in a stereotactic frame, with the intraaural line located approximately 6 cm above the midthorax. The animals then remained undisturbed for approximately 60 minutes (or a total of approximately 120 minutes since discontinuation of halothane). Mean arterial pressure (MAP) was recorded, and a sample of arterial blood was drawn for the measurement of Pao2, Paco2, pH, hematocrit (Hct), hemoglobin (Hgb), % Oxy-Hgb, and Hgb-bound O2 content. These last three values were obtained using a Radiometer OSM3 cooximeter, calibrated for use with rabbit blood. Total Cao2 was calculated as the sum of Hgb-bound and dissolved O2 (Pao2 × 0.003).
Hemodilution (n = 8). After the above noted stabilization period, stepwise isovolemic hemodilution was performed. In increments of 20 mL, arterial blood was removed and replaced with a slightly greater volume of warmed 6% hetastarch in saline (Hespan, DuPont Pharmaceuticals, Wilmington, DE, U.S.A.). The amount of hetastarch given was adjusted to ensure a stable MAP. This procedure was continued until a target Cao2 value of approximately 6.5 mL O2/dL was achieved, a process that typically required about 30 minutes. Ventilation was adjusted to keep Paco2 between 36 and 40 mm Hg, and small doses of sodium bicarbonate were given to ensure an arterial pH of less than 7.30.
Hypoxemia (n = 7). After stabilization, stepwise hypoxemia was achieved by incremental reductions in Fio2 (produced by changing the O2/N2 ratio). This was continued until a target Cao2 of approximately 6.5 mL O2/dL was reached. As with hemodilution, this process took place over approximately 30 minutes. Animals were otherwise treated identically to those in the hemodilution group.
Controls (n = 7). Anesthesia and ventilation were continued as above, but no alterations in Pao2 or Cao2 were performed.
When target Cao2 values had been reached in the two intervention groups (or at an equivalent time point in controls), baseline CBF was measured in each animal by the injection of 15-μm diameter radioactive microspheres through the left ventricular catheter. Spheres were labeled with 153Gd, 113Sn, 85Sr, or 46Sc. Reference blood samples were withdrawn from both brachial arteries at a rate of 1 mL/min for 2 minutes, starting about 15 seconds before microsphere injection. Each animal was then sequentially given 3, 10, and finally 30 mg/kg of Nω-nitro-l-arginine methyl ester (l-NAME, Sigma Chemical, St. Louis, MO, U.S.A.) intravenously (or a cumulative dose of 43 mg/kg). Cerebral blood flow was determined approximately 15 to 20 minutes after the injection of each dose. Mean arterial pressure was monitored continuously during this period, and arterial blood was sampled to ensure that Paco2 and Cao2 remained constant.
After the last measurements (which were completed approximately 45 to 60 minutes after the collection of baseline data and injection of the initial dose of l-NAME), the animal was killed with intravenous KCl. The brain was removed and placed in formalin for 24 hours. The hindbrain caudal to the colliculi was removed and discarded. The forebrain was weighed and counted along with the reference blood samples in a Packard Auto-Gamma unit (Packard Instruments, Downers Grove, IL, U.S.A.). Cerebral blood flow was calculated using standard equations. Values were accepted only if counts between the two arterial reference samples differed by less than 10%.
Supplementary Studies. For reasons that will be noted in Results, an additional group of four rabbits was studied in a fashion identical to that noted above, except that Cao2 was reduced by hemodilution with hetastarch to a target value of approximately 3.5 mL O2/dL. These animals subsequently received a single 43-mg/kg dose of l-NAME, with CBF determined 30 to 45 minutes later.
To ensure that NOS inhibition by l-NAME was adequate, six rabbits were anesthetized as noted above. These animals were assigned to one of three groups of two animals each. In the first (control), no other interventions were performed. In the second, 3 mg/kg l-NAME was given, and in the third, 43 mg/kg l-NAME was given. Approximately 45 minutes after the administration of l-NAME (or at an equivalent time in control animals), the animals were killed with KCl. The brain was rapidly removed and quickly frozen. Approximately 1 g of brain tissue from the frontoparietal area, containing both cortical gray and underlying white matter, was homogenized in a Tris-EDTA buffer and centrifuged. Nitric oxide synthase activity was determined in the supernatant by the arginine-to-citrulline conversion assay described by Bredt and Snyder and modified by Iadecola et al. (Bredt and Snyder, 1989; Iadecola et al., 1994). In brief, a mixture of 14C l-arginine, Tris, NADPH, and CaCl2 was added to an aliquot of the brain extract. After a 15-minute incubation period, the reaction was stopped with HEPES and EDTA (pH 5.2), and the mixture was passed through a Dowex 50X8-400 ion-exchange column (200 to 400 mesh, Bio-Rad, Hercules, CA, U.S.A.) to separate 14C-arginine from 14C-citrulline. Protein concentration in the extract was determined with a Bradford assay kit (Bio-Rad).
Part II: cGMP
Vasodilation by NO is mediated at least in part by a pathway that involves cGMP. We therefore examined changes in cortical soluble cGMP activity in hypoxemic and anemic rabbits.
Twenty rabbits were anesthetized with halothane and pentobarbital as above. Catheters were inserted into the right femoral artery and both femoral veins, the animal was turned phone, and the head was fixed in a stereotactic frame. After bupivicaine infiltration, the calvarium was exposed, and a 10- to 12-mm diameter right parietal craniotomy was constructed, with its anterior margin approximately 0.5 mm posterior to coronal suture and its medial border approximately 0.5 mm lateral to the midline. With the aid of a surgical microscope, the dura was carefully reflected, and the exposed brain enclosed by a cranial window constructed from bone wax, dental cement, and a microscope coverglass. The window was filled with warmed artificial CSF that had been equilibrated with O2 and CO2 to achieve a Pco2 of approximately 42 mm Hg and a Po2 less than 80 mm Hg.* Temperature in the window (as measured with a thermocouple) was servocontrolled to approximately 38° to 39°C using an overhead warming lamp.
After surgery was complete, the animals remained undisturbed for 20 minutes. The fluid was removed from the window, which was then refilled with fresh artificial CSF. After 15 minutes, this fluid was harvested as a baseline sample (and the window refilled). Animals were then assigned to either control, hemodilution, or hypoxemic groups. Hemodilution and hypoxemia were achieved as described above, again with target Cao2 values of approximately 6.5 mL O2/dL. After stable target Cao2 values had been achieved, the window was emptied and refilled with artificial CSF. This was again collected after a 15-minute dwell time. There were no other interventions in control animals, but CSF samples were collected at similar time points.
All CSF samples were frozen for later analysis. After thawing, cGMP concentrations were measured using a commercial 125I-radioimmunoassay kit (Amersham, Arlington Heights, IL, U.S.A.).
To confirm that hypoxic changes in cGMP (see below) were related to NO production, a cranial window was created in another group of five rabbits. After completion of the window, 43 mg/kg l-NAME was administered and the animals were subjected to hypoxia. Artificial CSF was harvested as before and cGMP was analyzed using the same method as above.
Statistics
All hemodynamic, blood gas, and CBF data in part I were examined with a two-way, repeated measures analysis of variance (ANOVA), with the four l-NAME doses (0, 3, 10, and 30 mg/kg) treated as the repeated measure. In case of a significant A × B interaction, post-hoc Fisher's least significant difference testing was performed. Similarly, a one-way repeated measures ANOVA was used to examine the CBF response to l-NAME in the “extreme” hemodilution animals (although these were not statistically compared with other groups). Changes in cGMP during hypoxemia or hemodilution were examined using a two-way repeated measures ANOVA, with values before and after the intervention (hypoxemia, hemodilution, or control) treated as the repeated measure. Changes in the cGMP response to hypoxia after l-NAME were examined using a one-way repeated measures ANOVA.
RESULTS
Part I: CBF
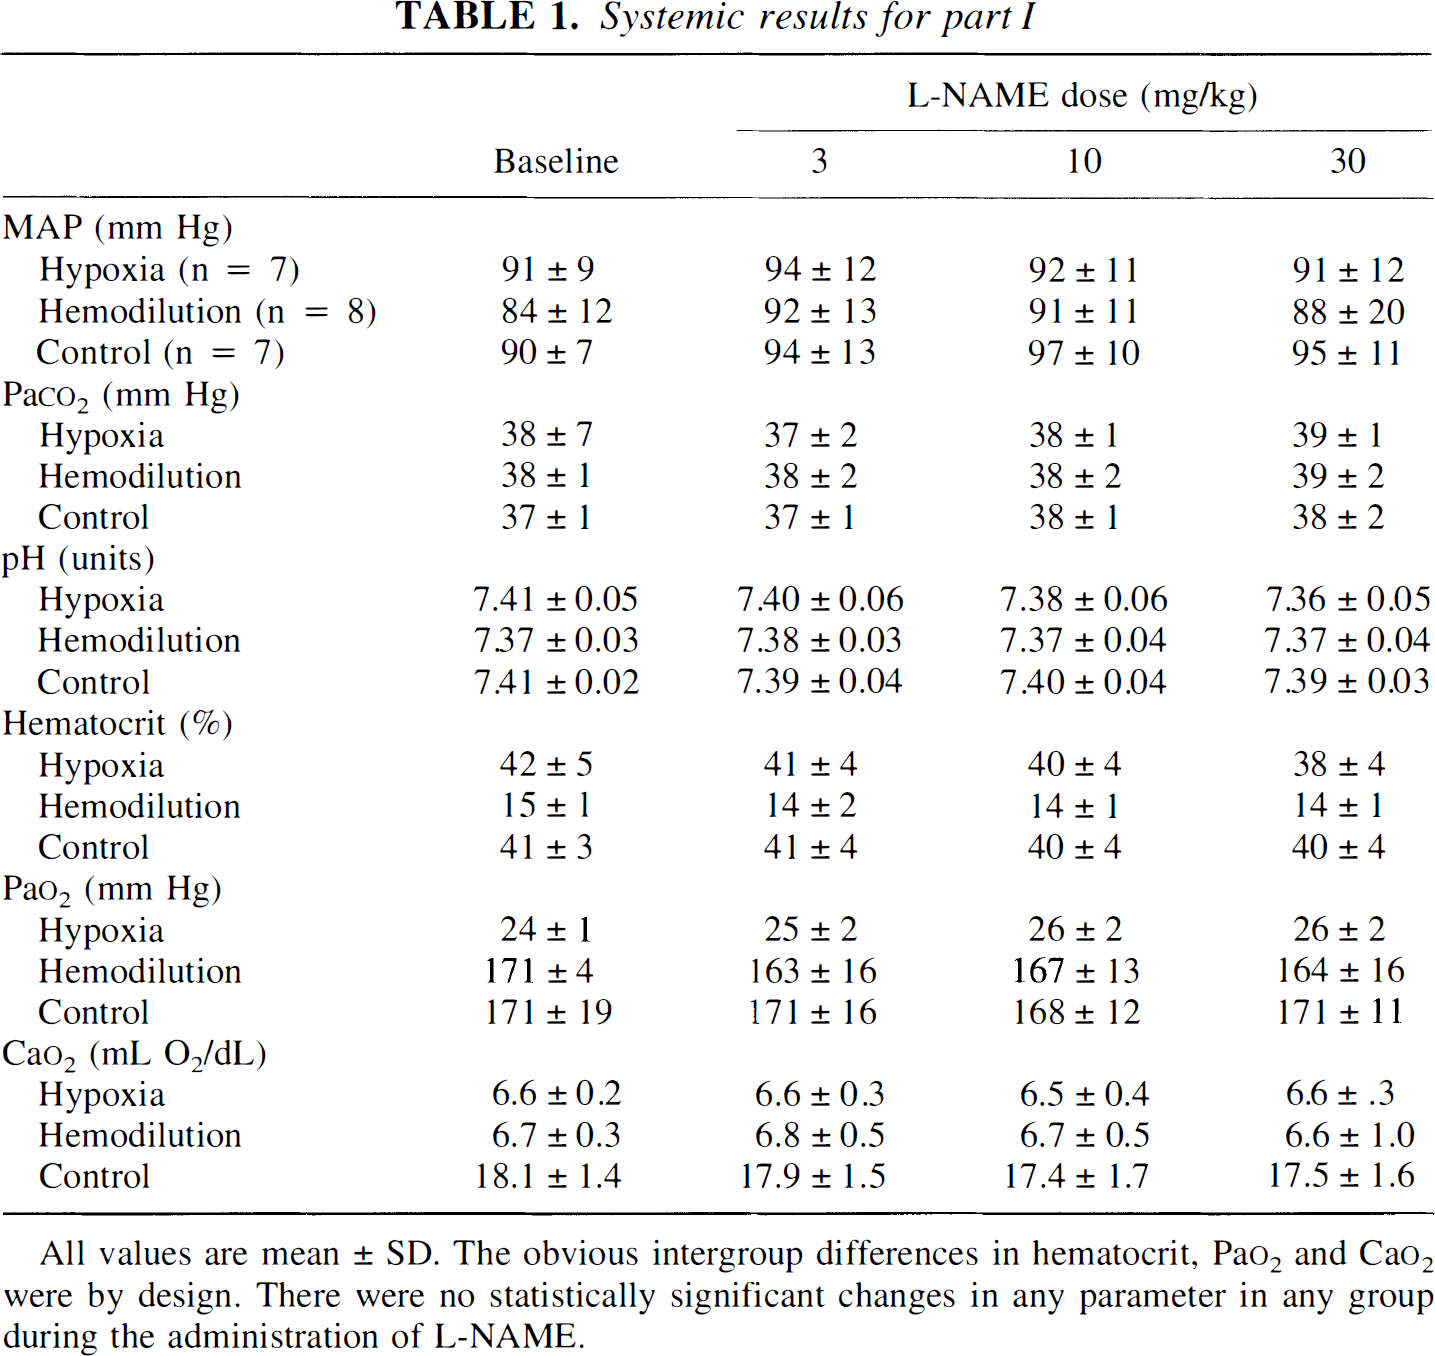
Hemodynamic and blood gas data are shown in Table 1. The intended between group differences in Hct, Pao2, and Cao2 were achieved, but there were no important differences in MAP, Paco2, or pH. There was a small (but statistically insignificant) increase in MAP in control animals with the administration of l-NAME, but not in the hypoxemic or hemodiluted groups. There were also no l-NAME-related changes in any other variable.
Systemic results for part I
L-NAME dose (mg/kg)
Baseline
3
10
30
MAP (mm Hg)
Hypoxia (n = 7)
91 ± 9
94 ± 12
92 ± 11
91 ± 12
Hemodilution (n = 8)
84 ± 12
92 ± 13
91 ± 11
88 ± 20
Control (n = 7)
90 ± 7
94 ± 13
97 ± 10
95 ± 11
Paco2 (mm Hg)
Hypoxia
38 ± 7
37 ± 2
38 ± 1
39 ± 1
Hemodilution
38 ± 1
38 ± 2
38 ± 2
39 ± 2
Control
37 ± 1
37 ± 1
38 ± 1
38 ± 2
pH (units)
Hypoxia
7.41 ± 0.05
7.40 ± 0.06
7.38 ± 0.06
7.36 ± 0.05
Hemodilution
7.37 ± 0.03
7.38 ± 0.03
7.37 ± 0.04
7.37 ± 0.04
Control
7.41 ± 0.02
7.39 ± 0.04
7.40 ± 0.04
7.39 ± 0.03
Hematocrit (%)
Hypoxia
42 ± 5
41 ± 4
40 ± 4
38 ± 4
Hemodilution
15 ± 1
14 ± 2
14 ± 1
14 ± 1
Control
41 ± 3
41 ± 4
40 ± 4
40 ± 4
Pao2 (mm Hg)
Hypoxia
24 ± 1
25 ± 2
26 ± 2
26 ± 2
Hemodilution
171 ± 4
163 ± 16
167 ± 13
164 ± 16
Control
171 ± 19
171 ± 16
168 ± 12
171 ± 11
Cao2 (mL O2/dL)
Hypoxia
6.6 ± 0.2
6.6 ± 0.3
6.5 ± 0.4
6.6 ± .3
Hemodilution
6.7 ± 0.3
6.8 ± 0.5
6.7 ± 0.5
6.6 ± 1.0
Control
18.1 ± 1.4
17.9 ± 1.5
17.4 ± 1.7
17.5 ± 1.6
All values are mean ± SD. The obvious intergroup differences in hematocrit, Pao2 and Cao2 were by design. There were no statistically significant changes in any parameter in any group during the administration of l-NAME.
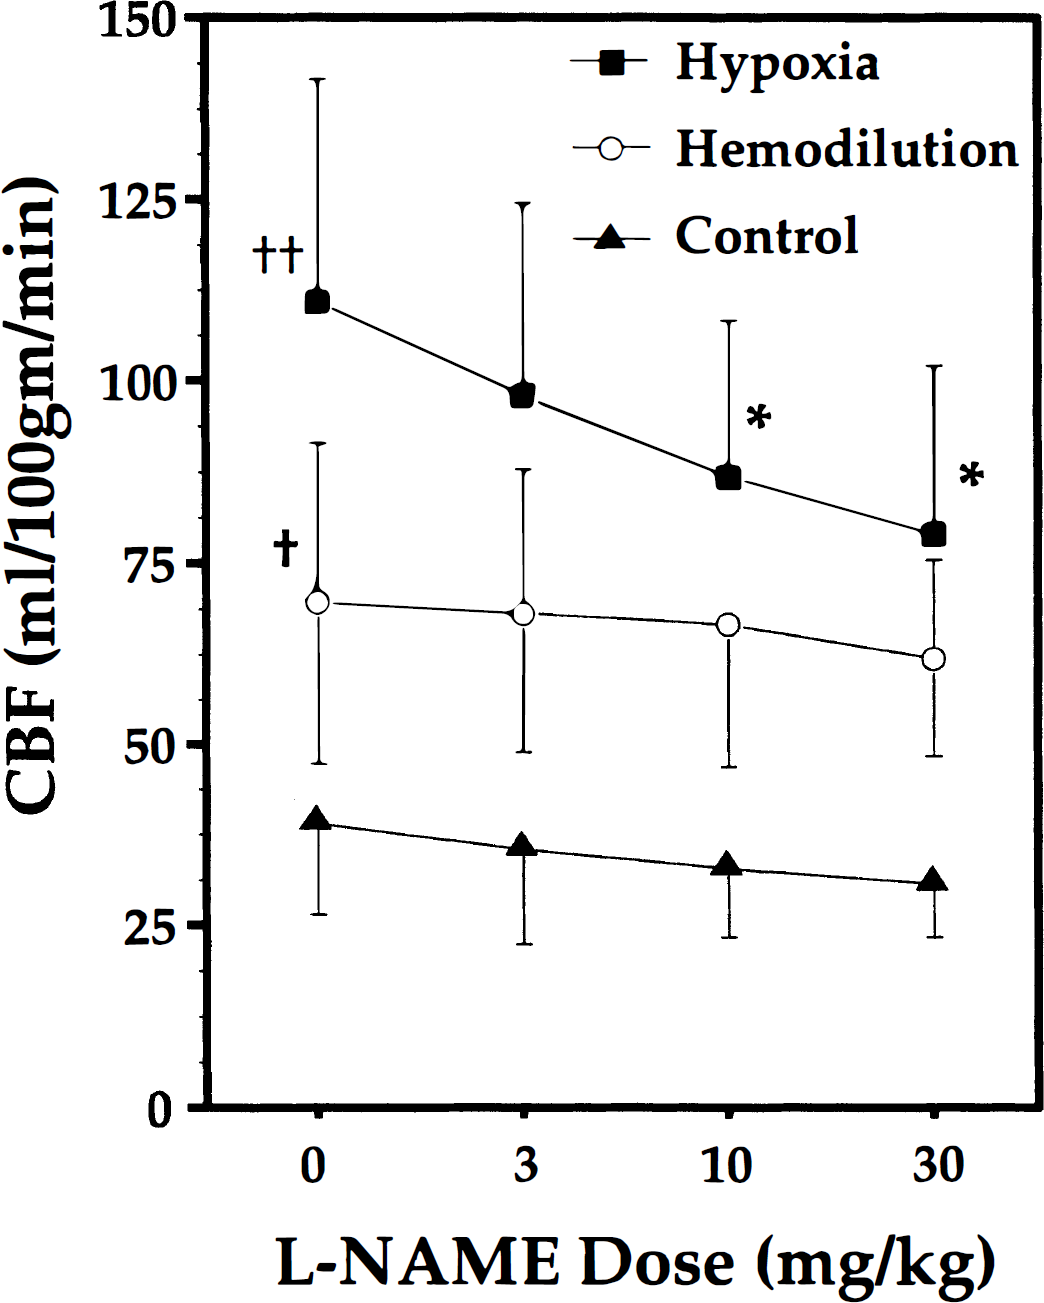
Changes in forebrain CBF in the three groups are shown in Fig. 1. Baseline CBF was greatest in hypoxemic animals, and lowest in controls. With the administration of l-NAME, CBF decreased significantly only in hypoxemic animals; after both the 10- and 30-mg/kg doses, the P value for the comparison versus baseline was less than 0.0001. By contrast, there were no significant changes in CBF in either the hemodilution or control groups (P = 0.11 for the baseline versus 30-mg/kg dose in the control group).
Cerebral blood flow (CBF) changes with increasing l-NAME dose in hypoxemic, hemodiluted, or control groups. Note that doses are incremental; the cumulative l-NAME after the 30-mg/kg dose was 43 mg/kg. † denotes P < 0.05 for baseline (dose = 0) CBF in hemodiluted versus control animals. ‡ denotes P < 0.01 for baseline (dose = 0) CBF in hypoxemic versus control animals. * denotes P < 0.0001 for CBF versus baseline in hypoxemic animals.
Because baseline CBF in animals hemodiluted to a Cao2 of approximately 6.5 mL O2/dL was less than in those subjected to hypoxia (70 versus 111 mL·100 g−1·min−1), we were concerned that the starting conditions of the hypoxic and hemodilution groups were not comparable, perhaps in terms of any underlying stimulus to NO production. To address this situation, an additional four animals were hemodiluted to a Cao2 of 3.5 ± 0.3 mL O2/dL and given a single 43-mg/kg dose of l-NAME. Baseline CBF under such conditions were much higher than at a Cao2 of approximately 6.5 mL O2/dL (126 ± 21 mL·100 g−1·min−1). However, in spite of the greater degree of baseline vasodilation, there were no CBF changes after l-NAME (127 ± 27 mL·100 g−1·min−1).
NOS inhibition
In two control animals, tissue NOS activity was 10.72 and 11.25 pmol·min−1·mg−1 of protein (mean 10.98). After 3 mg/kg l-NAME, activities of 11.13 and 11.75 (mean 11.44) pmol·min−1·mg−1 of protein were measured. In samples obtained from animals given 43 mg/kg l-NAME, values of 4.56 and 4.48 (mean 4.52) pmol·min−1·mg−1 of protein were obtained.
Part II: cGMP
Hemodynamics and blood gas values in animals in part II were similar to those in part I. Changes in cGMP concentrations differed markedly between the groups. In the control group (n = 7), cGMP concentration during baseline conditions was 3.49 ± 2.75 pmol/100 μL, versus 2.87 ± 2.33 pmol/100 μL approximately 30 minutes later. In the hemodilution groups (n = 6), cGMP concentrations were 3.86 ± 1.23 pmol/100 μL under baseline conditions versus 3.26 ± 1.44 pmol/100 μL after hemodilution. In contrast, in hypoxemic animals (n = 7), cGMP increased from 3.98 ± 2.70 pmol/100 μL during baseline conditions to 6.85 ± 4.28 pmol/100 μL during hypoxia. The P value for the ANOVA interaction term (A × B) was 0.027, with the change in cGMP in hypoxic animals achieving a P value of 0.01 (there were no significant changes in the control or hemodilution groups).
In the five hypoxic animals treated with l-NAME, baseline (before hypoxia) cGMP concentrations were 7.78 ± 2.18 pmol/100 μL. After hypoxia, cGMP concentrations were 8.25 ± 2.23 pmol/100 μL (not significant). [Note that these experiments were not performed concurrently with other cGMP measurements, nor were the assays done with in the same “batch” of materials as the earlier measurements.]
DISCUSSION
The data presented suggest that NO plays at least some role in the CBF changes produced by hypoxemia. These results are similar to those reported by several other groups. For example, Pearce et al. (1989) and Pohl (1990) both noted that hypoxemic relaxation of isolated vessel rings was attenuated by removal of the endothelium. Pearce et al. (1990) also demonstrated that hypoxemia increased the cGMP content of vessels and that hypoxemic vasodilation could be blunted with methylene blue. Iwamoto et al. (1992b) noted that methylene blue could blunt hypoxemic CBF elevations in awake sheep. Studies with more specific NOS inhibitors have also demonstrated a blunting of hypoxemic vasodilation (Kozniewska et al., 1992; Reid et al., 1995) or a reduction in CBF in animals that were already hypoxemic. (Isozumi et al., 1994; Iwamoto et al., 1992a). However, Rengasamy and Johns (1991) demonstrated direct hypoxemic inhibition of NOS enzyme activity in brain, whereas Fredricks et al. (1994) and McPherson et al. (1994) did not observe any change in hypoxemic CBF after treatment with either l-NA or l-NAME in dogs. Pelligrino et al. (1993) even described augmented hypoxemic vasodilation after l-NAME treatment in rats. The reason for these experimental discrepancies are unclear, although differences in species, anesthetics, and NOS antagonists may play roles. Nevertheless, we believe that both the reduction in CBF produced by l-NAME in hypoxemic animals and the increase in cortical cGMP concentrations associated with hypoxemia suggest that NO is active in our preparation. The fact that l-NAME did not return CBF to normoxic levels—although possibly related to incomplete NOS inhibition—raises the possibility that other vasoactive factors are involved.
The situation observed during hemodilution appears to be very different. First, although baseline CBF was increased compared with controls, it was significantly lower than in hypoxemic animals in spite of comparable Cao2. This is similar to an earlier observation from our laboratory (Todd et al., 1994). Second, l-NAME did not significantly reduce CBF. To extend these observations, a supplementary study was performed, using an even greater reduction in arterial oxygen carrying capacity (which might serve as a greater stimulus to NO production). Although additional reductions in Cao2 resulted in greater baseline CBF, there was still no response to l-NAME. This effect of hemodilution on the response to NOS inhibition has been described previously, although in a different vascular bed; Wilson and Taylor (1994) reported that reducing the hematocrit of blood perfusing an isolated lung effectively abolished l-NAME-induced vasoconstriction. Finally, the CBF increase produced by hemodilution was not accompanied by a change in cortical cGMP. These findings in combination argue that, contrary to the situation with hypoxemia, NO is not involved in the flow increase observed during hemodilution. It should, however, be noted that a recent report by Ulatowski et al. (1996) seems to contradict this conclusion. These authors observed the expected CBF increase in hemodiluted cats (to values of approximately 65 mL·100 g−1·min−1) but also found a small but significant decrease in CBF after treatment with l-NAME (to 59 mL·100 g−1·min−1). The absolute magnitude of this decrease is very similar to that seen in our hemodiluted animals (in which absolute CBF dropped after the maximal l-NAME dose, from 70 to 62 mL·100 g−1·min−1). However, in our rabbits, this change was not statistically significant.
Early investigators recognized that the increase in flow during hemodilution could be related to a reduction either in viscosity or in Cao2, because both are determined by hematocrit (Haggendal et al., 1966). There is now a substantial body of information supporting the idea that Cao2 is an important determinant of the CBF response to hemodilution—although it may not be the only factor. Jones et al. (1981) found that CBF increased in proportion to decreases in Cao2 during combinations of hypoxemia and anemia. Brown et al. (1985) also found that there was a much better correlation between Cao2 and cerebral oxygen delivery than there was between viscosity and delivery. More recently, Kurosue and Heros (1992) demonstrated apparently parallel Cao2 versus CBF response curves in normal rabbits in which Cao2 was reduced by either hypoxemia or hemodilution. The major contradictory evidence comes from the studies of Hudak et al. (1986) and Massik et al. (1987). These investigators transfused lambs with methemoglobin-containing red blood cells (which increase Hct without increasing Cao2), and noted decreases in CBF; they concluded that whole blood viscosity must be playing some role. Tsuda et al. (1987) also argued that plasma viscosity (as altered with hetastarch or dextran) could influence CBF. In contrast, Brown and Marshall (1985) failed to note any CBF changes in patients with paraproteinemias who were subjected to plasmapheresis, and Waschke et al. (1994), working in animals hemodiluted with cell-free cross-linked hemoglobin solutions, found that increases in plasma viscosity (produced by polyvinylpyrrolidone-PVP) did not influence flow.
If Cao2 is the primary determinant of CBF during both hypoxemia and hemodilution, why do we see differences in baseline CBF, as well as in the responses to l-NAME, and cGMP production? There are several possibilities. First, in spite of similar Cao2, tissue oxygen tension (Pto2) may be higher during hemodilution. If there is a relationship between Pto2 and the release of NO or other vasodilators, then hemodilution might be less of a “stimulus” than hypoxia, even when Cao2 is the same. Shinozuka et al. (1984, 1989), in widely separate studies, measured Pto2 during progressive hypoxemia or hemodilution, and found higher Pto2 values in hemodiluted animals. A direct answer to this hypothesis would require direct comparative measurements of Pto2 and NO production (perhaps assessed by cGMP release) during hypoxemia and anemia; such experiments are underway. However, we believe it is unlikely that this can be a complete explanation. In the small supplementary group of rabbits hemodiluted to a Cao2 of approximately 3.5 mL O2/dL, baseline CBF increased to match that seen in hypoxemic rabbits (with a Cao2 of approximately 6.5 mL O2/dL). If Pto2-induced NO release were the controlling factor for CBF, we would have expected this increase in CBF (which should have been associated with a further reduction in Pto2) to result in the appearance of l-NAME sensitivity. This did not occur.
Another possibility is that NO production is triggered not by brain Pto2, but at least in part by arterial Po2 (Pao2). There is evidence that arterial or arteriolar endothelium or smooth muscle can “sense” luminal oxygen tension directly, and at least a portion of the response may involve NO release (for review, see Pearce, 1995). In spite of the identical Cao2, Pao2 was much greater in hemodiluted animals (approximately 170 mm Hg versus 25 mm Hg with hypoxemia), which may have inhibited endothelial NO release.
There is a third possibility. The endothelial release of autacoids is modulated by changes in shear stress applied to the endothelial surface (Buga et al., 1991; Melkumyants and Balashov, 1990; Ngai and Winn, 1995). As shear stress decreases, release of NO and prostacyclin diminishes, and vessels constrict. Conversely, increases in shear stress can enhance autacoid production and result in vasodilation. Shear stress is the product of viscosity and the velocity of fluid movement over a surface. It is hence possible that the reductions in viscosity produced by hemodilution might suppress autacoid release. If NO production were already inhibited, treatment with l-NAME would have no effect. There is evidence in support of this. Muizelaar et al. (1983, 1998) and Hudak et al. (1989) observed pial arteriolar constriction during hemodilution, whereas Hurn et al. (1993) measured an anemia-induced increase in CBF but found no change in vessel diameter. What remains unclear is just how hemodilution alters actual shear stresses on the endothelium. Although hemodilution with hetastarch reduces whole blood viscosity, it does not markedly reduce plasma viscosity (Audibert et al., 1994; unpublished observations). Because plasma is in direct contact with the endothelium, particularly in smaller vessels, it is possible that hemodilution with hetastarch may have little effect on viscosity as seen by the endothelium. Furthermore, if CBF increases, the velocity-induced changes in shear stress may offset viscosity-mediated factors. Nevertheless, it is almost certain that shear forces are greater in hypoxemic animals (high whole blood viscosity, high flow rates) than with hemodilution (lower viscosity, lower flow rates), and hence it is also likely that shear stress-related autacoid release may be greater with hypoxemia.
One final possibility may simply be a link between baseline vascular “tone” and l-NAME response. Hypoxia results in a reduction in tone (vasodilation); in such conditions, removing a vasodilator like NO produces an easily measurable effect. In contrast, if vessels in hemodiluted animals have a much higher tone (i.e., are less dilated), NO removal might have less effect. We cannot address this possibility. As noted above, hemodilution typically results in either no change in pial vessel diameter or a small decrease; this is in clear contrast to the dilation that occurs with hypoxia. It could be argued that the animals described with extreme hemodilution (which also did not respond to l-NAME) contradict this argument. Unfortunately, without a direct measure of vascular diameters, it is impossible to draw any conclusions regarding “tone,” and the very high CBF in these animals could be driven entirely by viscosity reductions.
In summary, we observed that animals subjected to “matched” hypoxemia and hemodilution (equivalent Cao2) not only have differing CBF, but different responses to the administration of an NOS antagonist and different rates of cortical cGMP production. Response to l-NAME could not be “induced” in hemodiluted animals by further reductions in Cao2—even though baseline CBF increased to values equal to those seen in hypoxemic rabbits. These findings suggest that hypoxemia and hemodilution, although both resulting in an increase in flow, involve at least partially different processes of vascular control.
Footnotes
Acknowledgment
The authors thank Julie Weeks for her help with the nitric oxide synthase activity measurements.
Abbreviations used
*
The composition of the artificial CSF was (in g/L): 7.072 NaCl; 0.186 KCl; 0.294 CaCl2; 0.142 MgCl2; 2.436 NaHCO3; 0.667 dextrose; 0402 urea. After warming to 37°C, the artificial CSF was bubbled in 4.96% CO2, 5% O2, and the balance N2. The osmolality of the CSF was 298 to 304 mOsm/L.
References
1.
AudibertGDonnerMLefevreJCStoltzJFLaxenaireMC (1994) Rheologic effects of plasma substitutes used for preoperative hemodilution. Anesth Analg78:740–745
2.
BredtDSSnyderSH (1989) Nitric oxide mediates glutamate-linked enhancement of cGMP levels in the cerebellum. Proc Natl Acad Sci USA86:9030–9033
3.
BrownMMMarshallJ (1985) Regulation of cerebral blood flow in response to changes in blood viscosity. Lancet16:604–609
4.
BrownMMWadeJPHMarshallJ (1985) Fundamental importance of arterial oxygen content in the regulation of cerebral blood flow in man. Brain108:81–93
5.
BugaGMGoldMEFukutoJMIgnarroLJ (1991) Shear stress-induced release of nitric oxide from endothelial cells grown on beads. Hypertension17:187–193
6.
FredricksKTLiuYRuschNJLombardJH (1994) Role of endothelium and arterial K+ channels in mediating hypoxic dilation of middle cerebral arteries. Am J Physiol267:H580–H586
7.
HaggendalENilssonNJNorbackB (1966) Effect of blood corpuscle concentration on cerebral blood flow. Acta Chir Scand364(Suppl):3–12
8.
HeckerMMulschABassengeEBusseR (1993) Vasoconstriction and increased flow—two principal mechanisms of shear stress-dependent endothelial autacoid release. Am J Physiol265:H828–H833
9.
HudakMLKoehlerRCRosenbergAATraystmanRJJonesMD (1986) Effects of hematocrit on cerebral blood flow. Am J Physiol251:H63–H70
10.
HudakMLJonesMDPopelASKoehlerRCTraystmanRJZegerSL (1989) Hemodilution causes size-dependent constriction of pial arterioles in the cat. Am J Physiol257:H912–H917
11.
HurnPDTraystmanRJShoukasAAJonesMDJ (1993) Pial microvascular hemodynamics in anemia. Am J Physiol264: H2131–H2135
12.
IadecolaCXuXZhangFHuJEl-FakahanyEE (1994) Prolonged inhibition of brain nitric oxide synthase by short-term systemic administration of Nitro-l-arginine methyl ester. Neurochem Res19:501–505
13.
IsozumiKFukuuchiYTakedaHItohY (1994) Mechanisms of CBF augmentation during hypoxia in cats: probable participation of prostacyclin, nitric oxide and adenosine. Keio J Med43:31–36
IwamotoJYoshinagaMYangSPKrasneyEKrasneyJ (1992b) Methylene blue inhibits hypoxic cerebral vasodilation in awake sheep. J Appl Physiol73:2226–2232
16.
JonesMDTraystmanRJSimmonsMAMolteniRA (1981) Effects of changes in arterial O2 content on cerebral blood flow in the lamb. Am J Physiol240:H209–H215
17.
KorosueKHerosRC (1992) Mechanism of cerebral blood flow augmentation by hemodilution in rabbits. Stroke23:1487–1493
18.
KozniewskaEOsekaMStysT (1992) Effects of endothelium-derived nitric oxide on cerebral circulation during normoxia and hypoxia in the rat. J Cereb Blood Flow Metab12:311–317
19.
MassikJTangYLHudakMLKoehlerRCTraystmanRJJonesMD (1987) Effect of hematocrit on cerebral blood flow with induced polycythemia. J Appl Physiol62:1090–1096
20.
McPhersonRWKoehlerRCTraystmanRJ (1994) Hypoxia, alpha(2)-adrenergic, and nitric oxide-dependent interactions on canine cerebral blood flow. Am J Physiol266:H476–H482
21.
MelkumyantsAMBalashovSA (1990) Effect of blood viscosity on arterial flow induced dilator response. Cardiovasc Res24:165–168
22.
MelkumyantsAMBalashovSAKhayutinVM (1995) Control of arterial lumen by shear stress on endothelium. News Physiol Sci10:204–210
23.
MuizelaarJPWeiEPKontosHABeckerDP (1983) Mannitol causes compensatory cerebral vasoconstriction and vasodilation in response to blood viscosity changes. J Neurosurg59:822–828
24.
MuizelaarJPBoumaGJLevasseurJEKontosHA (1992) Effect of hematocrit variations on cerebral blood flow and basilar artery diameter in vivo. Am J Physiol262:H949–H954
25.
NgaiACWinnHR (1995) Modulation of cerebral arteriolar diameter by intraluminal flow and pressure. Circ Res77:823–840
26.
PearceWJ (1995) Mechanisms of hypoxic cerebral vasodilatation. Pharmacol Ther65:75–91
27.
PearceWJAshwalSCuevasJ (1989) Direct effects of graded hypoxia on intact and denuded rabbit cranial arteries. Am J Physiol257:H824–H833
28.
PearceWJReynier-RebuffelAMLeeJAubineauPIgnarroLSeylazJ (1990) Effects of methylene blue on hypoxic cerebral vasodilatation in the rabbit. J Pharmacol Exp Ther254:616–625
29.
PelligrinoDAKoenigHMAlbrechtRF (1993) Nitric oxide synthesis and regional cerebral blood flow responses to hypercapnia and hypoxia in the rat. J Cereb Blood Flow Metab13:80–87
30.
PohlU (1990) Endothelial cells as part of a vascular oxygen-sensing system: hypoxia-induced release of autacoids. Experientia46:1175–1179
31.
PohlUHerlanKHuangABassengeE (1991) EDRF-mediated shear-induced dilation opposes myogenic vasoconstriction in small rabbit arteries. Am J Physiol261:H2016–H2023
32.
ReidJMDaviesAGAshcroftFMPatersonDJ (1995) Effect of l-NMMA, cromakalim, and glibenclamide on cerebral blood flow in hypercapnia and hypoxia. Am J Physiol269:H916–H922
33.
RengasamyAJohnsRA (1991) Characterization of endothelium-derived relaxing factor/nitric oxide synthase from bovine cerebellum and mechanism of modulation by high and low oxygen tensions. J Pharmacol Exp Ther259:310–316
34.
ShinozukaTNemotoEMBleyaertAL (1984) Cerebral cortical oxygenation and perfusion during hetastarch hemodilution. Adv Exp Med180:853–860
35.
ShinozukaTNemotoEMWinterPM (1989) Mechanisms of cerebrovascular O2 sensitivity from hyperoxia to moderate hypoxia in the rat. J Cereb Blood Flow Metab9:187–195
36.
ToddMMWuBMaktabiMHindmanBWarnerDS (1994) Cerebral blood flow and oxygen delivery during hypoxemia and hemodilution: role of oxygen content. Am J Physiol267:H2025–H2031
37.
TsudaYHartmannAWeiandJSolymosiL (1987) Comparison of the effects of infusion with hydroxyethyl starch and low molecular weight dextran on cerebral blood flow and hemorheology in normal baboons. J Neurol Sci82:171–180
38.
UlatowskiJABucciENishikawaTRazynskaAWilliamsMATakeshimaRTraystmanRJKoehlerRC (1996) Cerebral O2 transport with hematocrit reduced by cross-linked hemoglobin transfusion. Am J Physiol270:H466–H475
39.
WaschkeKFKrieterHHagenGAlbrechtDMVan AckernKKuschinskyW (1994) Lack of dependence of cerebral blood flow on blood viscosity after blood exchange with a Newtonian O2 carrier. J Cereb Blood Flow Metab14:871–876
40.
WilsonPSKhimenkoPMooreTMTaylorAE (1996) Perfusate viscosity and hematocrit determine pulmonary vascular responsiveness to NO synthase inhibitors. Am J Physiol270:H1757–H1765