
Abstract
The possibility that adenosine and ATP-sensitive potassium channels (KATP) might be involved in the mechanisms of the increases in cerebral blood flow (CBF) that occur in insulin-induced hypoglycemia was examined. Cerebral blood flow was measured by the [14C]iodoantipyrine method in conscious rats during insulin-induced, moderate hypoglycemia (2 to 3 mmol/L glucose in arterial plasma) after intravenous injections of 10 to 20 mg/kg of caffeine, an adenosine receptor antagonist, or intracisternal infusion of 1 to 2 μmol/L glibenclamide, a KATP channel inhibitor. Cerebral blood flow was also measured in corresponding normoglycemic and drug-free control groups. Cerebral blood flow was 51% higher in untreated hypoglycemic than in untreated normoglycemic rats (P < 0.01). Caffeine had a small, statistically insignificant effect on CBF in normoglycemic rats, but reduced the CBF response to hypoglycemia in a dose-dependent manner, i.e., 27% increase with 10 mg/kg and complete elimination with 20 mg/kg. Chemical determinations by HPLC in extracts of freeze-blown brains showed significant increases in the levels of adenosine and its degradation products, inosine and hypoxanthine, during hypoglycemia (P < 0.05). Intracisternal glibenclamide had little effect on CBF in normoglycemia, but, like caffeine, produced dose-dependent reductions in the magnitude of the increases in CBF during hypoglycemia, i.e., +66% with glibenclamide-free artificial CSF administration, +25% with 1 μmol/L glibenclamide, and almost complete blockade (+5%) with 2 μmol/L glibenclamide. These results suggest that adenosine and KATP channels may play a role in the increases in CBF during hypoglycemia.
Keywords
Inhibition of cerebral glucose utilization (CMRglc) by either limitation of glucose supply (e.g., insulin-induced hypoglycemia) or by blockade of glycolysis with pharmacologic doses of 2-deoxyglucose (2-DG) has been shown to result in considerable increases in cerebral blood flow (CBF) (Della Porta et al., 1964; Norberg and Siesjö, 1976; Abdul-Rahman et al., 1980; Hollinger and Bryan, 1987; Bryan et al., 1987; Breier et al., 1993; Horinaka et al., 1997a). The mechanisms underlying these increases are still undefined, but a number of possibilities have been excluded, e.g., direct action of insulin on CBF or cerebral energy metabolism; blood H+, lactate, and K+ concentrations; blood CO2 and O2 tensions; and nitric oxide production (Horinaka et al., 1997a). These glucose-deprived conditions are associated with rises in plasma epinephrine levels, but equivalent rises in plasma epinephrine levels produced by continuous intravenous infusions have been found to have no effects on cerebral blood flow and energy metabolism (Horinaka et al., 19976).
Another possible candidate to be considered is adenosine, which has cerebral vasodilator effects (Berne et al., 1974; Kuschinsky and Wahl, 1978). Because it has many properties to be expected of a physiologic regulator of cerebral vascular tone, it has been proposed as a potential chemical mediator of metabolic regulation of CBF (Rubio et al., 1978; Winn et al., 1981b). For example, adenosine levels in brain tissue rise during cerebral ischemia (Berne et al., 1974; Nordstrom et al., 1977; Winn et al., 1979), hypotension (Winn et al., 1980), hypoxia (Winn et al., 1981a), seizures (Schrader et al., 1980), and chemical or electrical stimulation (Sciotti et al., 1993); these are all conditions in which cerebral resistance vessels are also dilated. It is of interest that the increases in CBF in hypoglycemia appear or become prominent when arterial plasma glucose levels decline to about 2.5 to 3 mmol/L (Horinaka et al., 1997a), levels at which brain glucose utilization and the ability to maintain cerebral tissue ATP levels are reduced (Ghajar et al., 1982; Suda et al., 1990); conditions that tend to reduce ATP and raise ADP levels are those that favor formation of adenosine (see Discussion).
Whatever the mediator of the increased CBF in glucose deprivation may be, whether adenosine or some other agent, it must ultimately invoke additional mechanisms that lead to relaxation of the vascular smooth muscle of the cerebral vessels. Hyperpolarization of smooth muscle cells in response to activation of K+ channels and closure of voltage-gated Ca2+ channels have been shown to lead to dilation of blood vessels (Nelson, 1993). ATP-sensitive K+ channels (KATP) were first described in cardiac muscle (Noma, 1983) but have also been found in skeletal muscle (Spruce et al., 1985), pancreatic β-cells (Ashcroft et al., 1984; Cook and Hales, 1984), neurons (Ashford et al., 1988), and vascular smooth muscle (Standen et al., 1989; Nelson, 1993). KATP channels are regulated by intracellular ATP and open when intracellular ATP levels fall. They have been shown to be involved in the dilation of cerebral arteries that can be invoked by treatment with KATP channel openers (Faraci and Heistad, 1993). Decreased glucose concentration has been shown to open KATP channels in pancreatic β-cells and neurons in the brain (Edwards and Weston, 1993). KATP channels are also modulated by various normal endogenous substances. For example, the vasodilators calcitonin gene-related peptide and adenosine have been shown to activate KATP channels in smooth muscle of systemic arteries and gallbladder (Nelson et al., 1990a; Dart and Standen, 1993; Quayle and Standen, 1994; Zhang et al., 1994). Presumably, adenosine and KATP channels could be acting independently, sequentially, or in concert to increase CBF during glucose deprivation.
To investigate the possibility that adenosine or KATP channels may play critical roles in the increases in CBF in cerebral glucose deprivation, we have examined the effects of caffeine, a nonselective antagonist of adenosine receptors, and glibenclamide, a KATP channel blocker, on the CBF response to insulin-induced hypoglycemia in unanesthetized rats. We chose to use caffeine rather than the more potent xanthine theophylline because the latter has greater effects on respiration and arterial Pa
MATERIALS AND METHODS
Chemicals
Chemicals were obtained from the following sources: 4-Iodo-[N-methyl-14C]antipyrine ([14C]IAP, specific activity 54 mCi/mmol) from Du Pont NEN (Boston, MA, U.S.A.); beef-pork crystalline zinc insulin (Regular ILETIN I) from Eli Lilly & Co. (Indianapolis, IN, U.S.A.); anhydrous caffeine (1,3, 7-trimethylxanthine) and glibenclamide (Glyburide) from Sigma Chemical Co. (St. Louis, MO, U.S.A.). All other chemicals used were of reagent or HPLC grade.
Animals
Normal adult male Sprague-Dawley rats weighing 299 to 378 g were obtained from Taconic Farms (Germantown, NY, U.S.A.) and maintained in animal quarters with a standard 12-hour light/dark cycle with humidity and temperature controlled at normal levels. Water and food were allowed ad libitum. All procedures in animals were in strict accordance with the NIH Guide for the Care and Use of Laboratory Animals and were approved by the local Animal Care and Use Committee. The rats were fasted 16 hours before surgery but had free access to water.
The animals were lightly anesthetized with halothane (5% for induction, 1% to 1.5% for maintenance) in 70% N2O/30% O2, and polyethylene catheters (PE-50, Clay-Adams, Parsippany, NJ, U.S.A.) were inserted into both femoral arteries and one vein. Because of the limited ability of glibenclamide to traverse the blood–brain barrier, it was necessary to administer it by intracisternal infusion. Silastic catheters (0.012-inch inner diameter × 0.025-inch outer diameter, Read Plastic Inc., Rockville, MD, U.S.A.) were, therefore, implanted in the cisterna magna for the administration of glibenclamide or its vehicle in those rats in which the effects of glibenclamide were studied. After insertion of the catheters the surgical wounds were treated with 5% lidocaine cream and sutured. The animals were then placed in loose-fitting abdominopelvic plaster casts and allowed to recover from the effects of the anesthesia for at least 3 hours before initiation of the procedure for determination of CBF. Body temperature was maintained at 37°C throughout the operative and postoperative periods by a thermostatically controlled infrared lamp coupled to a rectal temperature probe.
Physiologic variables
Physiologic variables were monitored after the 3-hour period of recovery from anesthesia to assess the physiologic status of the animals. Mean arterial blood pressure (MABP) was measured with an air-damped mercury manometer. Arterial blood Pa
Experimental procedures
Approximately 3 hours after recovery from the anesthesia, arterial plasma glucose levels, arterial blood hematocrit, gas tensions and pH, and MABP were measured. If these were within normal limits, the experimental procedure was initiated by the intravenous injection of either 0.5 to 1.0 mL physiologic saline or insulin (10 to 20 U/kg) dissolved in an equivalent volume of saline. The procedures specific for studying the effects of caffeine or glibenclamide were then implemented as follows.
Effects of caffeine on CBF response to hypoglycemia. Fifteen minutes after the injection of insulin or its saline vehicle, 10 or 20 mg/kg caffeine was injected intravenously; control animals received equivalent volumes of physiologic saline. Because caffeine had been found to cause hyperventilation and a decrease in Pa
Effect of glibenclamide on CBF response to hypoglycemia. Simultaneously with the intravenous injections of the saline or insulin, intracisternal infusion of 1 or 2 μmol/L glibenclamide in a solution of 1% dimethyl sulfoxide (DMSO) in artificial CSF was initiated. The DMSO was needed to dissolve the glibenclamide. The infusion was maintained by a Harvard Apparatus Syringe Infusion Pump 22 (Harvard Apparatus Inc., South Natick, MA, U.S.A.) at a rate of 1.5 μL/min for approximately 30 minutes before and during the 1-minute period of CBF measurement. Controls were infused with the solution of 1% DMSO in artificial CSF. Physiologic variables were measured 5 minutes before and again immediately before the measurement of CBF.
Measurement of CBF
Cerebral blood flow was determined by the [14C]IAP method (Sakurada et al., 1978) with minor modifications as previously described (Horinaka et al., 1997a, 1997b).
Measurement of adenosine, inosine, and hypoxanthine levels in brain tissue
For measurement of the concentrations of adenosine and its degradation products, inosine and hypoxanthine, in brain tissues of control and hypoglycemic rats, rapidly frozen samples of brain tissue were obtained by the in vivo freeze-blowing technique of Veech et al. (1973). Approximately 30 minutes after the administration of the saline or insulin, the rats were very lightly anesthetized by an intravenous injection of 0.15 to 0.20 mL of 25 mg/mL sodium thiopental dissolved in saline and immediately placed in the freeze-blowing apparatus that was then activated. The light anesthesia prevented an abrupt rise in plasma glucose levels associated with the handling of the animals during placement. The frozen samples of brain obtained from the freeze-blowing procedure were pulverized under liquid nitrogen in a mortar and stored at −80°C until analyzed. Another group of rats was injected intravenously with 200 mg/kg 2-DG and studied similarly to determine whether adenosine release in brain tissue occurs in this model of glucose deprivation in which increases in CBF have also been observed (Breier et al., 1993; Horinaka et al., 1997a). In these animals also physiologic variables were measured approximately 10 minutes before and repeated immediately before freeze-blowing of the brain.
Each pulverized frozen brain sample was weighed and transferred to a glass homogenizer that had been precooled in dry ice. Five milliliters of 70% ethanol, chilled to about −30°C, was added, and the slurry was stirred for at least 2 minutes in a Vortex Mixer (Scientific Industries, Bohemia, NY, U.S.A.); the mixing was frequently interrupted for the homogenizer to be placed in an alcohol bath maintained at −25° to −30°C to keep the samples at the temperature of the bath. An internal standard of 0.5 nmol of 5′-deoxyadenosine was then added to the tissue sample, and the entire mixture was homogenized while the homogenizer tubes were kept in a −20°C bath. The homogenized mixture was centrifuged at 10,000g for 20 minutes at 2° to 5°C, and the supernatant fractions were transferred to centrifuge tubes and lyophilized in a SpeedVac Concentrator (Savant Instruments, Farmingdale, NY, U.S.A.). After drying, 150 μL of H2O was added to reconstitute the homogenate, and undissolved residue was removed by centrifugation at 10,000g for 20 minutes at 2° to 5°C. The supernatant fractions of this last centrifugation were then assayed by HPLC. Samples were either analyzed immediately or stored at −80°C, but never longer than 1 week. Each sample was analyzed in duplicate, and the average of the two values was used.
HPLC analyses were carried out with a Gilson liquid chromatograph system (Gilson Medical Electronics, Middleton, WI, U.S.A.) with UV detection at 259 nm. Adenosine, inosine, hypoxanthine, and the 5′-deoxyadenosine internal standard were separated on a Zorbax SB-C8 analytical column (3.5-μm particle size; 4.6-mm inner diameter × 15 cm) and a Zorbax SB-C8 guard column (MAC-MOD Analytical Inc., Chadds Ford, PA, U.S.A.). The solvent used for the mobile phase was a modification of one used by James and Richardson (1993); it consisted of a gradient mixture of 2.5 mmol/L tetrabutylammonium phosphate (pH 6.4) (Solvent A) and methanol (Solvent B) programmed as follows: (1) 100% A and 0% B at a flow rate of 0.5 mL/min for the first 10 minutes; (2) increase in B to 2% and flow rate increase to 1 mL/min for the next 4 minutes; (3) increase in B to 21 % with flow rate maintained at 1 mL/min for the next 31 minutes; (4) gradual increase in B to 100% during the next 5 minutes with flow rate at 1 mL/min and maintained at 100% for 10 minutes for washout. The column was equilibrated with 100% Solvent A for 10 minutes at a rate of 0.5 mL/min between analyses. With these gradient elution conditions, the retention times for hypoxanthine, inosine, adenosine, and 5′-deoxyadenosine, determined with reference standards, were 13.4, 18.6, 31.6, and 41.7 minutes, respectively. The identity of adenosine was confirmed by its disappearance after its incubation with 1 unit of adenosine deaminase at room temperature for 1 minute.
Statistical analysis
Data are presented as means ± SD. Statistical significance of differences were determined by Student's t-tests for group comparisons or paired comparisons when appropriate.
RESULTS
Effects of glucose deprivation on adenosine release in brain tissue
To determine whether glucose deprivation increases adenosine release in brain tissue, rats were made hypoglycemic with insulin or given pharmacologic doses of 2-DG to reproduce conditions shown to increase CBF in previous studies (Horinaka et al., 1997a) and confirmed in the present studies (see below); control animals received equivalent injections of saline. In these experiments, however, CBF was not measured; instead the brains were rapidly freeze-blown and analyzed for their contents of adenosine as well as its metabolic products because of its rapid metabolism. The changes in the values of the physiologic variables during glucose deprivation in these animals were comparable to those seen in other animals similarly treated (Horinaka et al., 1997a). In the rats with insulin-induced hypoglycemia (n = 9), arterial plasma glucose level fell from 116 ± 12 (mean ± SD) to 34 ± 6 mg/dL (P < 0.01); arterial blood Pa
Glucose deprivation was clearly associated with pronounced statistically significant rises in the levels of adenosine and its metabolites in the brain, particularly of its initial degradation product, inosine (Table 1). The increases with pharmacologic doses of 2-DG were considerably greater than with the insulin-induced hypoglycemia, averaging 8-fold, 41-fold, and 13-fold for adenosine, inosine, and hypoxanthine, respectively.
Effects of insulin-induced hypoglycemia and pharmacological doses of 2-deoxyglucose on adenosine, inosine, and hypoxanthine levels in conscious rat brain
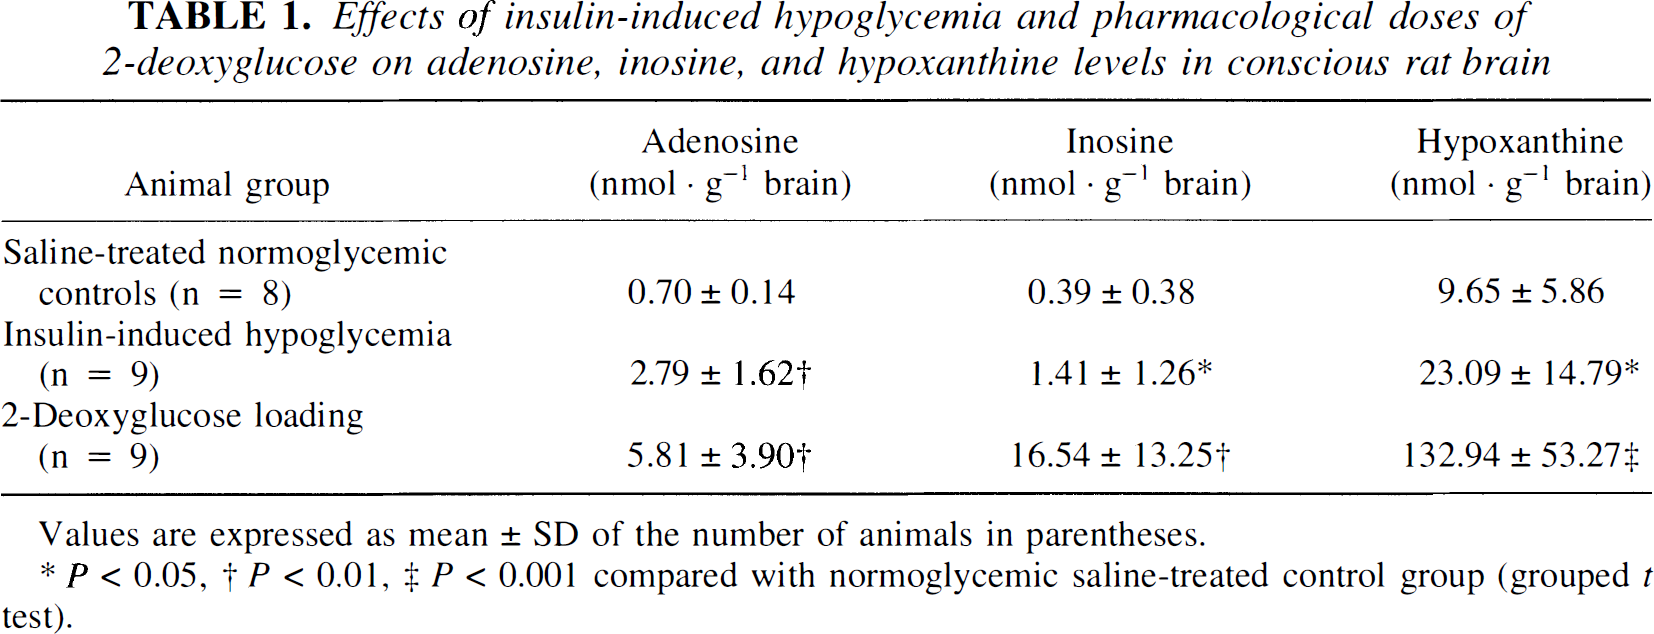
Values are expressed as mean ± SD of the number of animals in parentheses.
P < 0.05
P < 0.01
P < 0.001 compared with normoglycemic saline-treated control group (grouped t test).
Effects of intravenous caffeine administration
Physiologic variables. Acute intravenous injections of caffeine causeS hyperventilation and behavioral changes, e.g., intense grooming, sniffing, chewing, head-bobbing, and paw-pushing, which persisted throughout the experimental period; these behavioral changes were more pronounced with the larger dose of caffeine. The hyperventilation caused increases in arterial Pa
Effects of intravenous caffeine administration on physiological variables in conscious rats
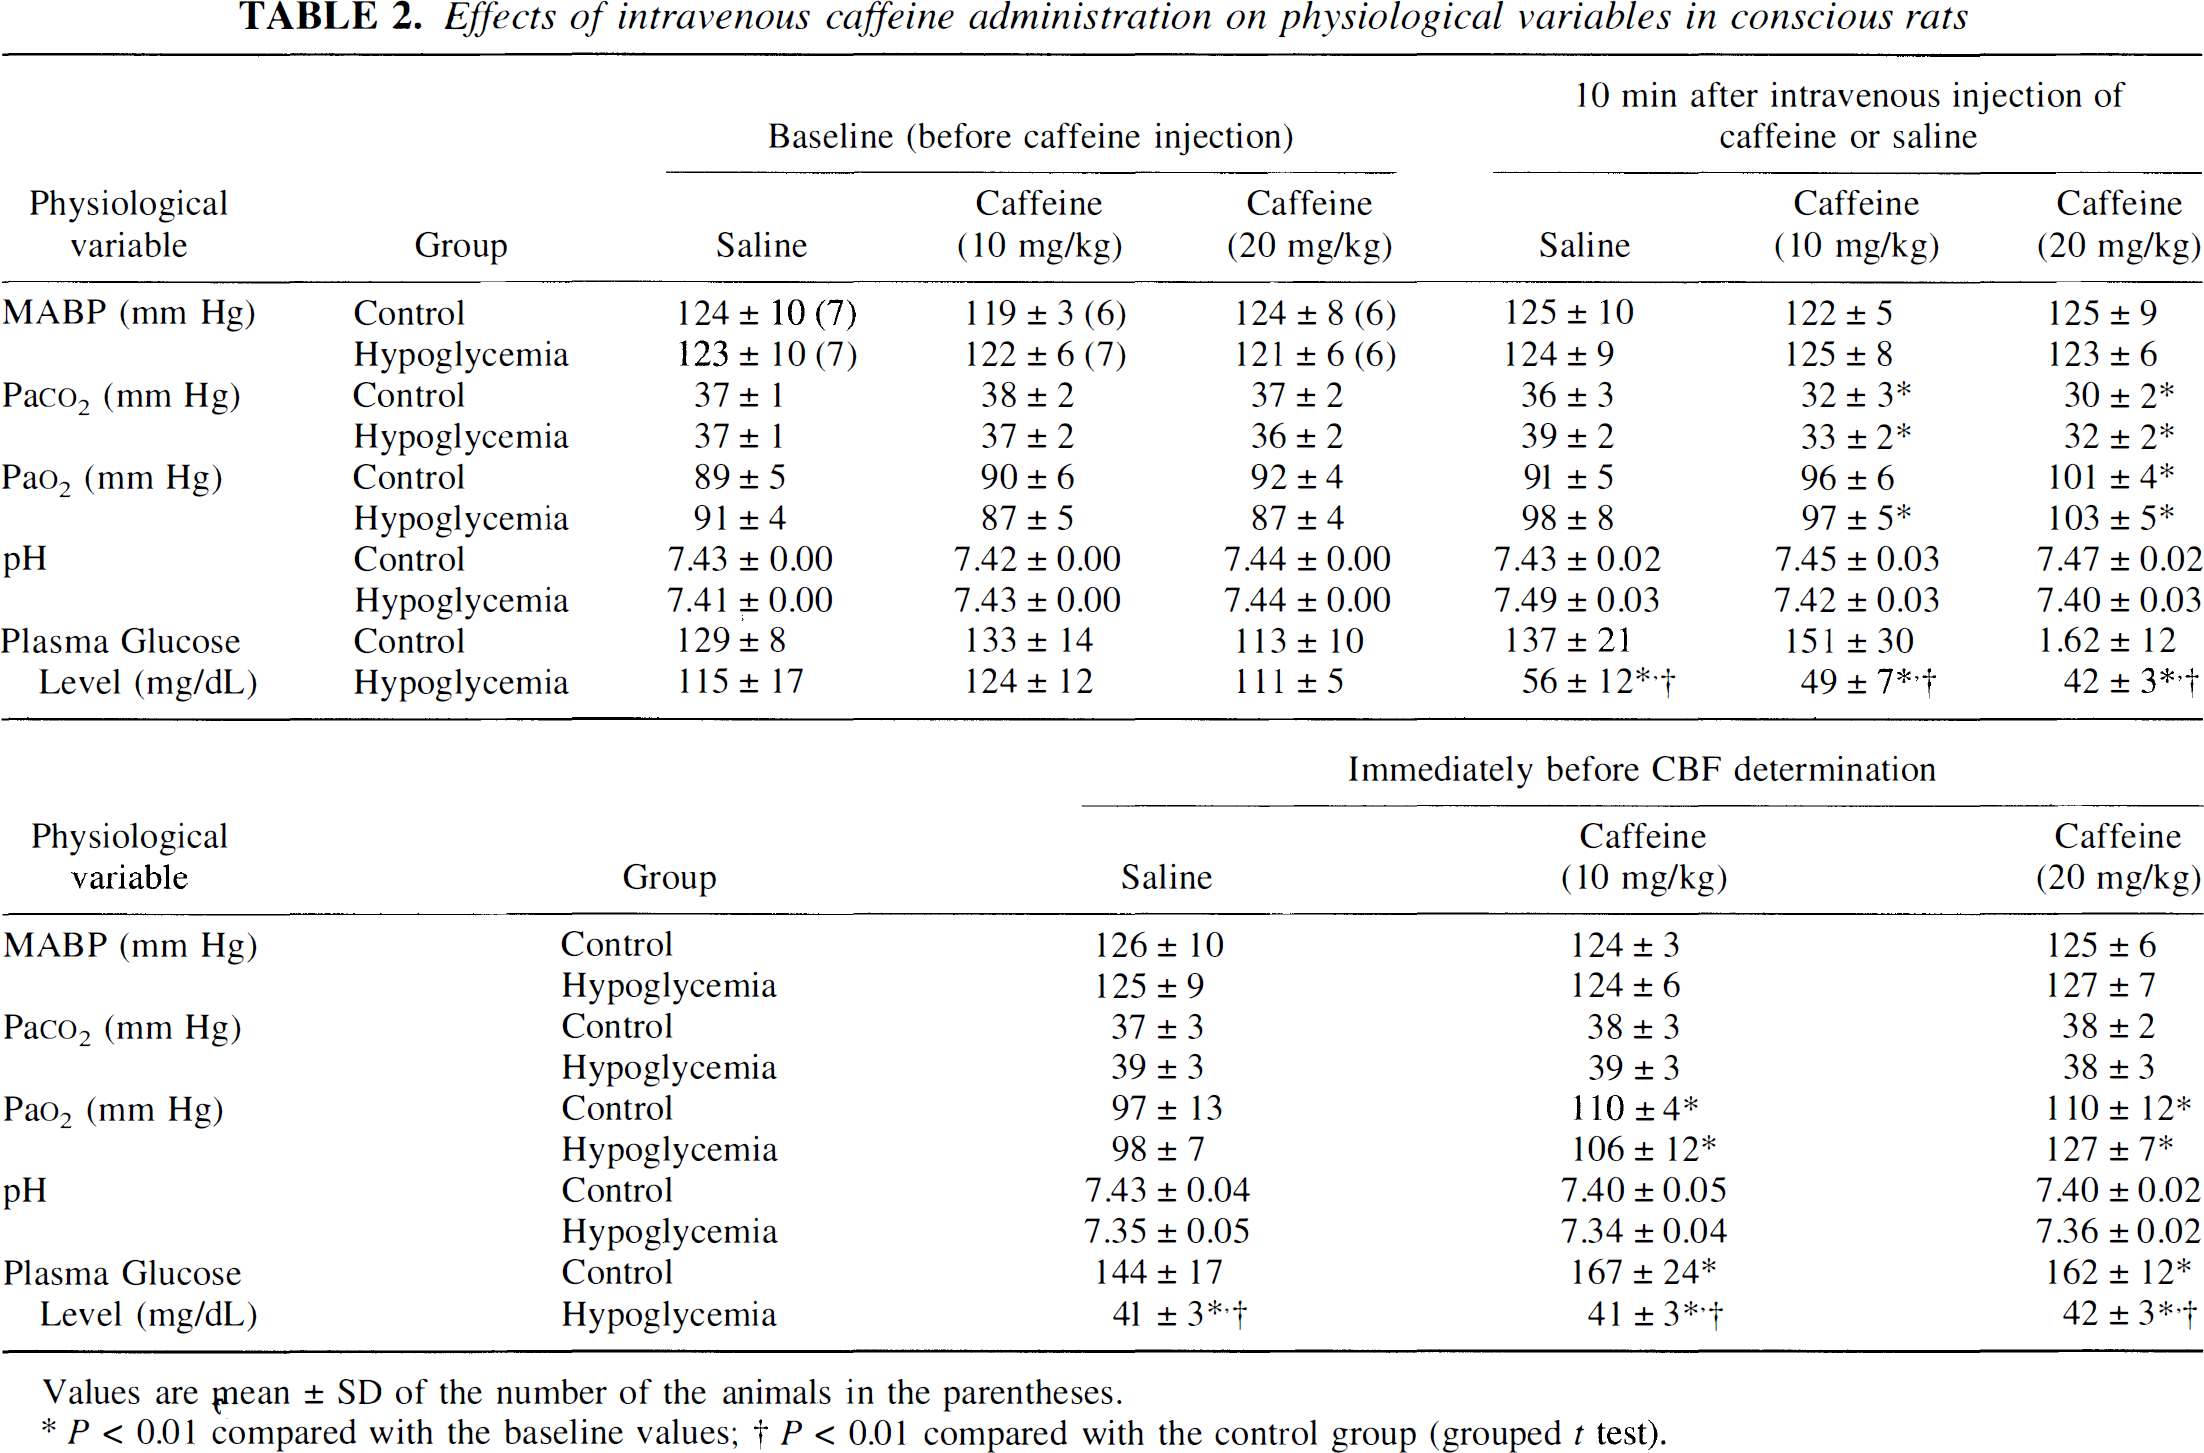
Values are mean ± SD of the number of the animals in the parentheses.
P < 0.01 compared with the baseline values
P < 0.01 compared with the control group (grouped t test).
Values of the blood variables in the rats with insulin-induced hypoglycemia, whether treated with caffeine or saline, showed no statistically significant differences from those in the corresponding controls, except for the arterial plasma glucose concentration, which was reduced to an average of 41 to 42 mg/dL (2.3 mmol/L) compared with 144 to 167 mg/dL (8 to 9.3 mmol/L) in the normoglycemic rats at the time of the CBF measurement (P < 0.01) (Table 2).
Effects on the CBF response to insulin-induced hypoglycemia. Cerebral blood flow was increased in insulin-induced hypoglycemia from a level of 113 ± 18 mL·100 g−1·min−1 (means ± SD, n = 7) in saline-treated normoglycemic controls to 171 ± 34 mL·100 g−1·min−1 (n = 7), a statistically significant rise of 51% (P < 0.01) (Fig. 1). Caffeine administration in doses of 10 and 20 mg/kg tended to reduce CBF in the normoglycemic rats to 96 ± 8 (n = 6) and 111 ± 14 (n = 6) mL·100 g−1·min−1, respectively, but these changes were not statistically significant (Fig. 1). The rise in CBF in response to the insulin-induced hypoglycemia was, however, markedly diminished by caffeine in a dose-dependent manner (Fig. 1). In rats given the dose of 10 mg/kg, hypoglycemia raised CBF to 123 ± 22 mL·100 g−1·min−1 (n = 7) from a level of 96 ± 8 mL·100 g−1·min−1 (n = 7) in the normoglycemic controls, a statistically significant increase (P < 0.05), but only of 27% compared with the 51 % rise in rats not pretreated with caffeine. The dose of 20 mg/kg, however, completely eliminated the increase in CBF caused by hypoglycemia; CBF was 104 ± 20 mL·100 g−1·min−1 (n = 6) in the hypoglycemic rats versus 111 ± 14 mL·100 g−1·min−1 (n = 6) in the normoglycemic, caffeine-treated controls, a statistically insignificant 6% decrease (Fig. 1).
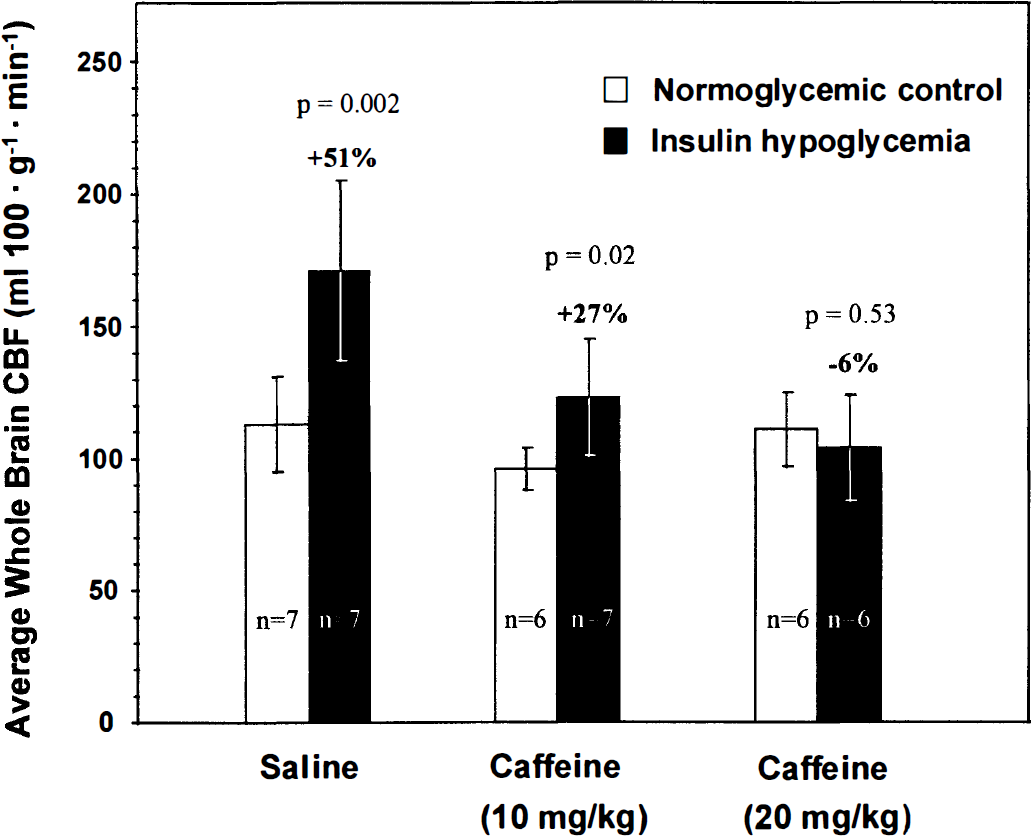
Effects of intravenous caffeine administration on the CBF response to insulin-induced hypoglycemia. Bar heights and error bars represent means ± SD of the number of rats indicated.
Effects of intracisternal glibenclamide infusion
Physiologic variables. Intracisternally infused glibenclamide had no significant effects on the blood variables in normoglycemic control or insulin-treated hypoglycemic rats (Table 3).
Effects of intracisternal glibenclamide infusion on physiological variables in conscious rats
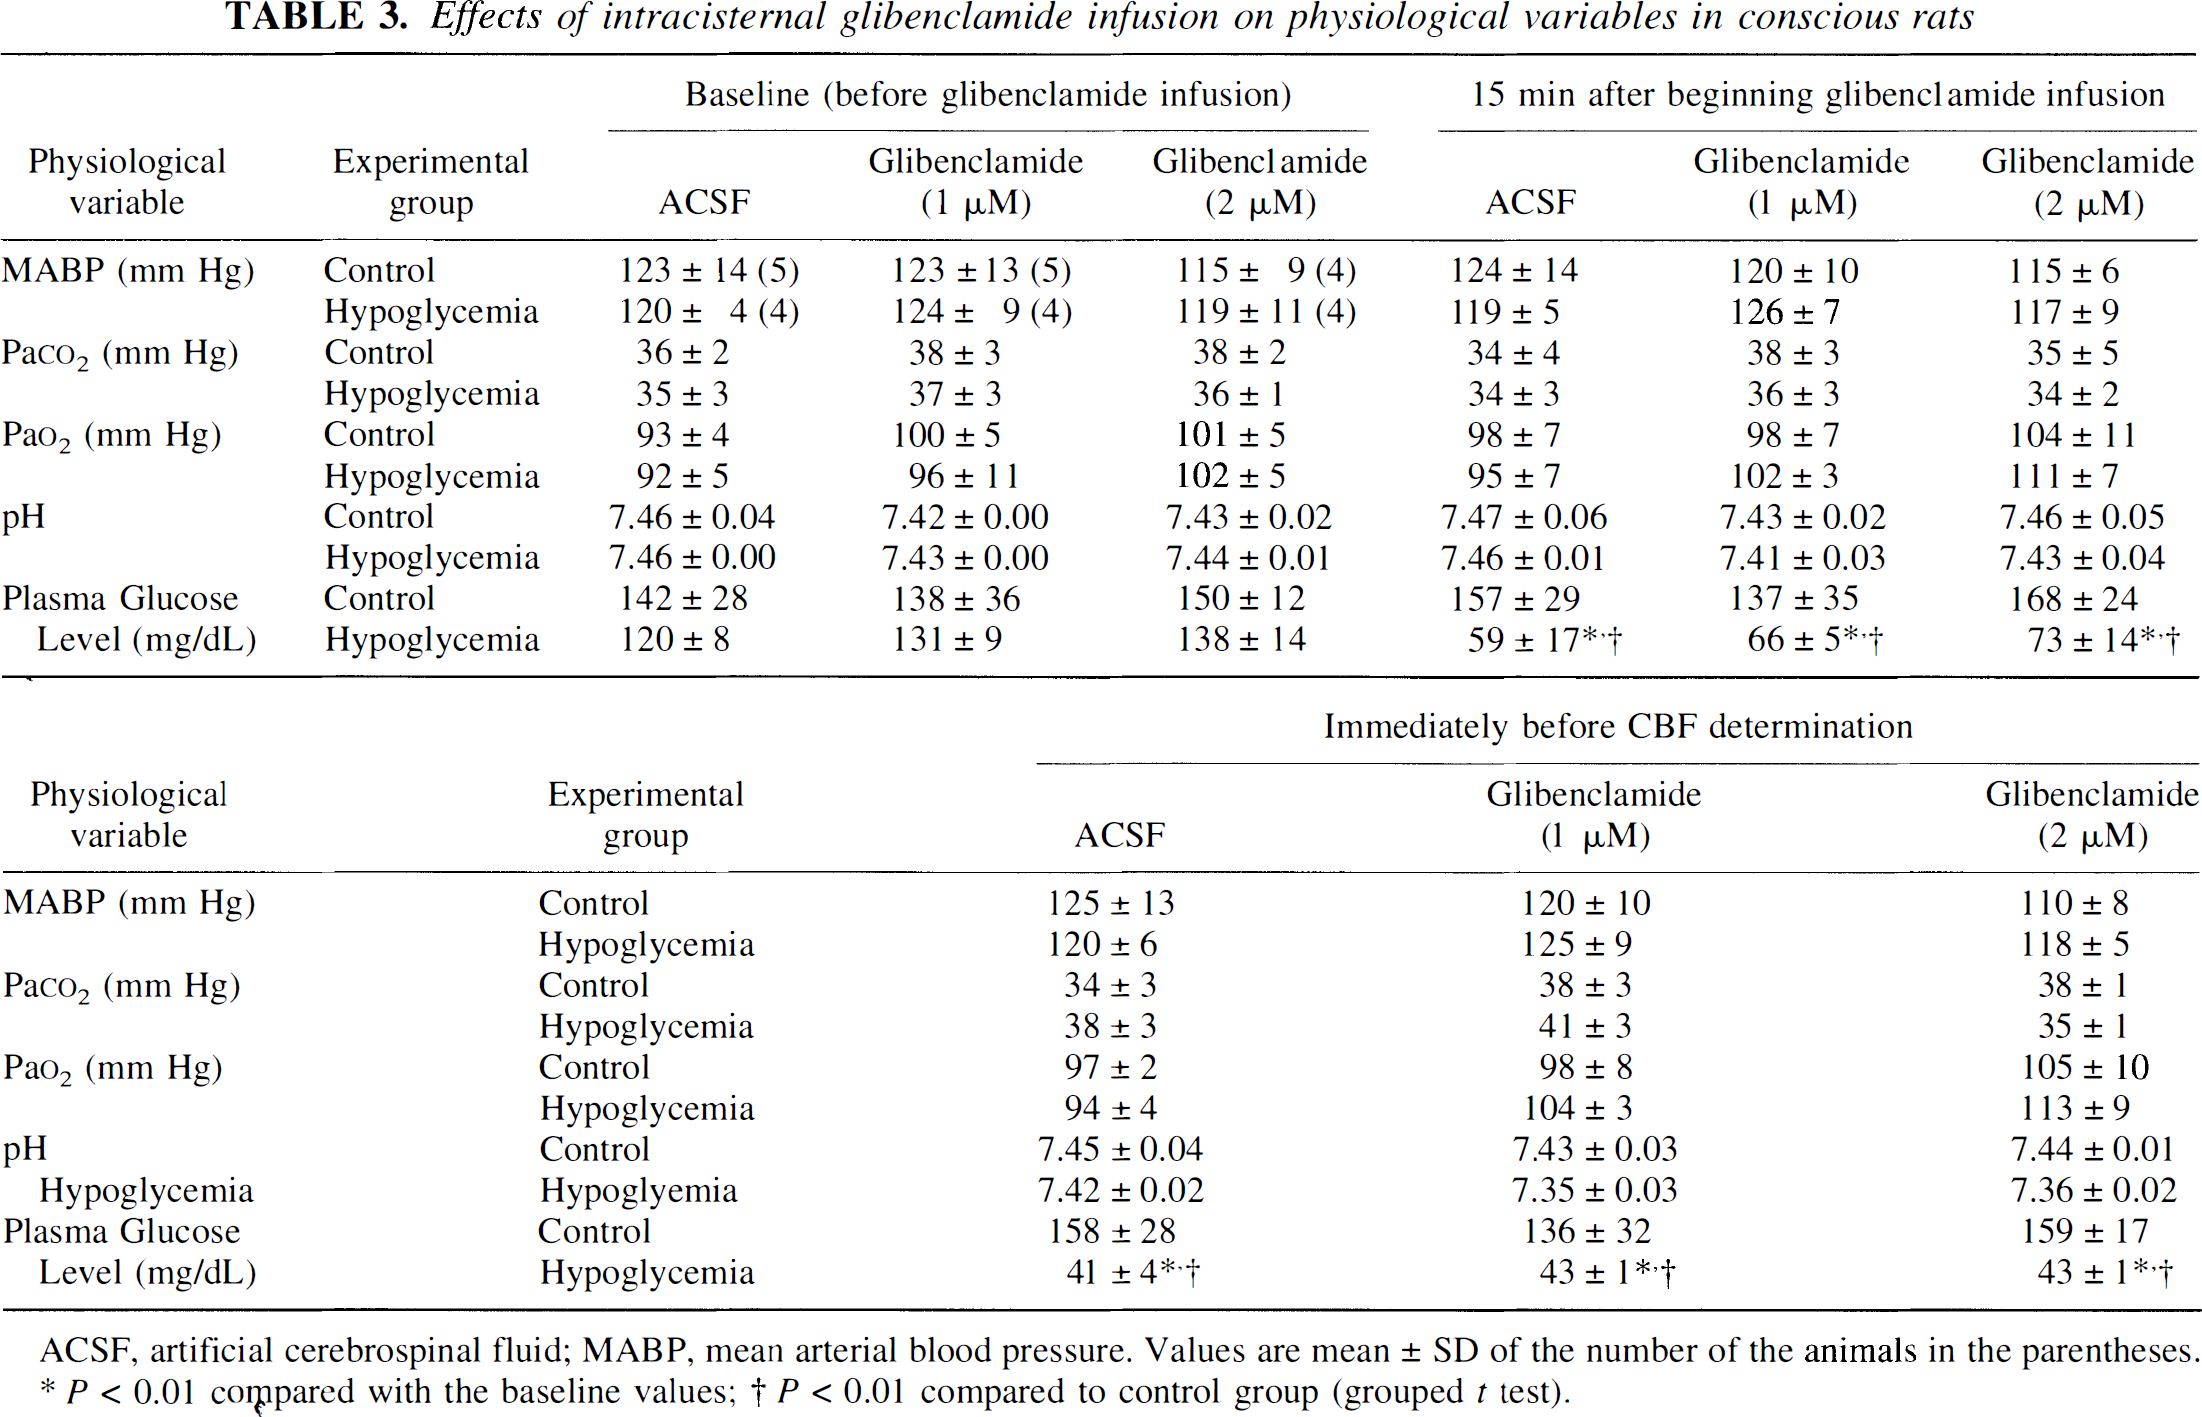
ACSF, artificial cerebrospinal fluid; MABP, mean arterial blood pressure. Values are mean ± SD of the number of the animals in the parentheses.
P < 0.01 compared with the baseline values
P < 0.01 compared to control group (grouped t test).
Effects on the CBF response to insulin-induced hypoglycemia. Glibenclamide had no statistically significant effects on CBF in normoglycemic rats; CBF was 100 ± 16 mL·100 g−1·min−1 (mean ± SD, n = 5) in normoglycemic, artificial CSF-infused control rats compared with 101 ± 21 (n = 5) and 91 ± 12 (n = 4) mL·100 g−1·min−1 in normoglycemic rats infused with 1 μmol/L and 2 μmol/L glibenclamide, respectively (Fig. 2). As with caffeine, however, glibenclamide blocked the increases in CBF in hypoglycemia in a dose-dependent manner. In rats infused with artificial CSF alone, insulin-induced hypoglycemia increased CBF from 100 ± 16 (n = 5) to 166 ± 11 (n = 4) mL·100 g−1·min−1 (+66%). With the infusion of 1 μmol/L glibenclamide the increase in CBF in hypoglycemia was reduced to only +25%, i.e., from 101 ± 21 (n = 5) to 126 ± 11 (n = 4) mL·100 g−1·min−1 (Fig. 2). The infusion of 2 μmol/L glibenclamide almost completely abolished the increase in CBF caused by hypoglycemia, i.e., from 91 ± 12 (n = 4) to 96 ± 11 (n = 4) mL·100 g−1·min−1, a 5% change that was statistically insignificant (Fig. 2).
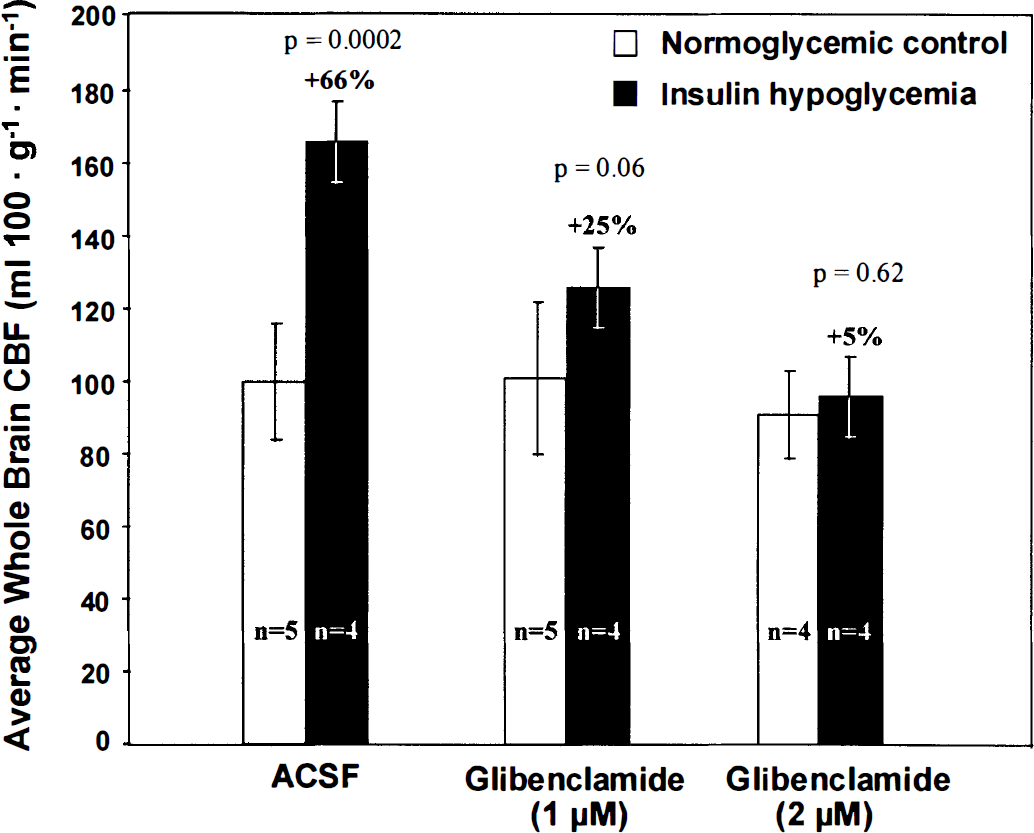
Effects of intracisternal infusions of 1 and 2 μmol/L glibenclamide in artificial cerebrospinal fluid (ACSF) on the CBF response to insulin-induced hypoglycemia. Bar heights and error bars represent means ± SD of the number of rats indicated.
DISCUSSION
The present study confirms that insulin-induced hypoglycemia results in marked increases in CBF (Della Porta et al., 1964; Norberg and Siesjö, 1976; Abdul-Rahman et al., 1980; Hollinger and Bryan, 1987; Bryan et al., 1987; Horinaka et al., 1997a). In previous studies (Horinaka et al., 1997a, 1997b) we systematically examined a number of potential mediators of this response but could identify none that was critical to the mechanism of the effect. Excluded were a number of changes associated with insulin-induced hypoglycemia: direct action of insulin; altered blood Pa
Caffeine is a relatively nonspecific antagonist of adenosine at the adenosine receptors, and cerebral vascular smooth muscle is endowed with several types of purinergic receptors, including some specific for adenosine (Edvinsson et al., 1993). Adenosine has potent vasodilator actions and has long been considered a possible metabolic regulator of the cerebral circulation (Berne et al., 1974, Kuschinsky and Wahl, 1978, Rubio et al., 1978; Winn et al., 1981b; Edvinsson et al., 1993). Its role in the normal regulation of cerebral blood flow is, however, still uncertain. The main argument against such a role is that extracellular adenosine levels in brain in normal physiologic states appear to be too low to have important influence on the cerebral circulation (Edvinsson et al., 1993). Extracellular adenosine concentration may not, however, reflect its true levels at the receptor sites on the blood vessels or the magnitude of adenosine release. Adenosine can be formed by dephosphorylation of AMP by 5′-nucleotidase, an ectoenzyme bound on the membranes of the astrocytic endfeet investing the intracerebral vessels (Kreutzberg et al., 1978); Adenosine concentrations in perivascular fluids may, therefore, exceed those in interstitial fluid. Furthermore, adenosine is rapidly degraded by adenosine deaminase to inosine, which is then deribosylated by purine nucleoside phosphorylase to hypoxanthine. The steady state concentration of adenosine in brain tissue may, therefore, not reflect the dynamic turnover of adenosine in the brain. In our studies we observed approximately fourfold increases in adenosine in brain in hypoglycemia, but concentrations of its immediate degradation product, inosine, and its secondary product, hypoxanthine, also increased about 3.6-fold and 2.3-fold, respectively. We also measured the concentrations of adenosine and its metabolites in brain during blockade of glycolysis by pharmacologic doses of 2-DG, another glucose-deprived condition in which increases in CBF are even greater (Breier et al., 1993; Horinaka et ak, 1997a). In this condition there is even more pronounced adenosine release inasmuch as brain levels of adenosine, inosine, and hypoxanthine increased 8-fold, 42-fold, and 14-fold, respectively. Ruth et al. (1993) have also observed increases in both CBF and brain interstitial adenosine levels, determined by microdialysis, during insulin-induced hypoglycemia in anesthetized piglets. Clearly there is an enhanced release of adenosine in brain in the glucose-deprived conditions in which CBF is enhanced.
There are at least four adenosine receptor subtypes, A1, A2A, A2B, and A3. The vasodilating effect of adenosine is associated with activation of A2 receptors (Edvinsson et al., 1993) and the stimulation of adenylate cyclase activity and cyclic AMP (cAMP) formation. The A1-receptor has a very high affinity for adenosine whereas the A2-receptor has a low affinity. Consequently, low doses of caffeine, which is an adenosine receptor antagonist, block the low-affinity adenosine A2-receptors whereas the high-affinity adenosine A1-receptors are blocked at much higher doses (Daly et al., 1983).
Caffeine easily crosses the blood–brain barrier by simple diffusion and carrier-mediated transport (McCall et al., 1982) and rapidly enters brain (Axelrod and Reichenthal, 1953), which seems to be the organ most sensitive to caffeine (Dews, 1982). Thithapandha et al. (1972) have shown that CSF levels reach half plasma levels in 4 to 8 minutes, and brain levels of caffeine remain almost constant for the first hour after intravenous administration. At 10 and 20 mg/kg in our studies, caffeine itself had no statistically significant effects on CBF in normoglycemic rats but reduced the increases in CBF during insulin-induced hypoglycemia in a dose-dependent manner to the point of complete abolition of the response (Fig. 1). These results suggest that the action of adenosine on its receptors is critical to the increase in CBF during hypoglycemia.
Intracisternal infusions of glibenclamide had effects similar to those of caffeine, i.e., little effect on CBF in normal rats but a dose-dependent inhibition of the increase in CBF in insulin-induced hypoglycemia to the point of complete blockade of the response (Fig. 2). Glibenclamide is a selective inhibitor of ATP-sensitive K+ channels, which play an important role in regulating the tone of vascular smooth muscle (Standen et al., 1989; Nelson et al., 1990a,b). These channels are inhibited by ATP. When disinhibited by a fall in ATP levels, they open and allow K+ efflux from the cells, resulting in hyperpolarization of the cell membrane, reduced Ca2+ influx into the cells through voltage-dependent Ca2+ channels, and relaxation of the smooth muscle of the blood vessels (Standen et al., 1989; Nelson et al., 1990b, 1993). Abolition of the CBF response to hypoglycemia by blockade of the KATP channels with glibenclamide suggests that opening of KATP channels is an important component of the mechanisms of the CBF response to hypoglycemia. It is noteworthy that glibenclamide also blocks the 2-DG-induced hyperpolarization and vasodilation in rat coronary arteries (Conway et al., 1994).
If the blockade of the CBF response to hypoglycemia by either caffeine or glibenclamide is attributed to their presumed most likely actions, i.e., caffeine antagonism of adenosine at adenosine receptors and glibenclamide inhibition of KATP channels in vascular smooth muscle, then the present results support the view that adenosine is a normal regulator of cerebrovascular tone and CBF (Rubio et al., 1978; Winn et al., 1981b). They also suggest a unifying hypothesis that includes both adenosine and KATP channels as components of a mechanism common to both the adjustment of CBF to functional activation and increased energy demand and inadequate substrate supply (Fig. 3). Energy metabolism is stimulated in neural tissue by increased spike activity that activates Na+,K+-ATPase activity to restore ionic gradients across the cell membranes (Mata et al., 1980; Kadekaro et al., 1985). The consequent lowering of the ATP to ADP ratio and increase in inorganic phosphate (Pi) stimulates both glycolysis and electron transport. Electrical stimulation of brain tissue in vitro has also been shown to result in release of adenosine and its metabolites from the tissue (Pull and McIlwain, 1972). Glucose deprivation caused by hypoglycemia or inhibition of glycolysis with pharmacologic doses of 2-DG (Chapman et al., 1981; Horinaka et al., 1997a), hypoxia (Kety and Schmidt, 1948; Rubio et al., 1975), and bicuculline-induced seizures (Meldrum and Nilsson, 1976; Winn et al., 1981c), are also conditions in which both CBF and brain adenosine levels are elevated. In addition, there are conditions, such as hypotension (Winn et al., 1980) and ischemia (Winn et al., 1979), in which, for obvious reasons, CBF does not increase, but in which brain adenosine levels rise and cerebral vessels dilate. In all these conditions the ATP to ADP ratio tends to fall and ADP levels tend to increase because of either overutilization or underproduction of ATP. Increased ADP leads to increased AMP by the action of the ubiquitous enzyme adenylate kinase, thus providing substrate for 5′-nucleotidase to produce adenosine. Adenosine action at smooth muscle A2 receptors produces cyclic AMP, which has, in fact, been shown to increase in brain tissue during electrical stimulation (Kakiuchi et al., 1969). Cyclic AMP activates protein kinase A to phosphorylate the KATP channels in vascular smooth muscle. The phosphorylated channels may tend to open, resulting in increased K+ efflux, hyperpolarization of the cell membranes, decreased influx of Ca2+ through voltage-dependent Ca2+ channels, relaxation of the vascular smooth muscle, and vasodilation. Protein kinase activity and cAMP-dependent phosphorylation of KATP channels have been reported in vascular and other tissues (Ashcroft, 1994; Hamada et al., 1994; Kleppisch and Nelson, 1995; Roch et al., 1995; Xu et al., 1996). This cascade is initiated by increased ADP levels, which lead to formation and release of adenosine by brain tissue, followed by adenosine's action on caffeine-sensitive adenosine receptors on smooth muscle cells, and culminating in opening of the glibenclamide-sensitive K+ channels. This sequence is presented diagrammatically in Fig. 3.
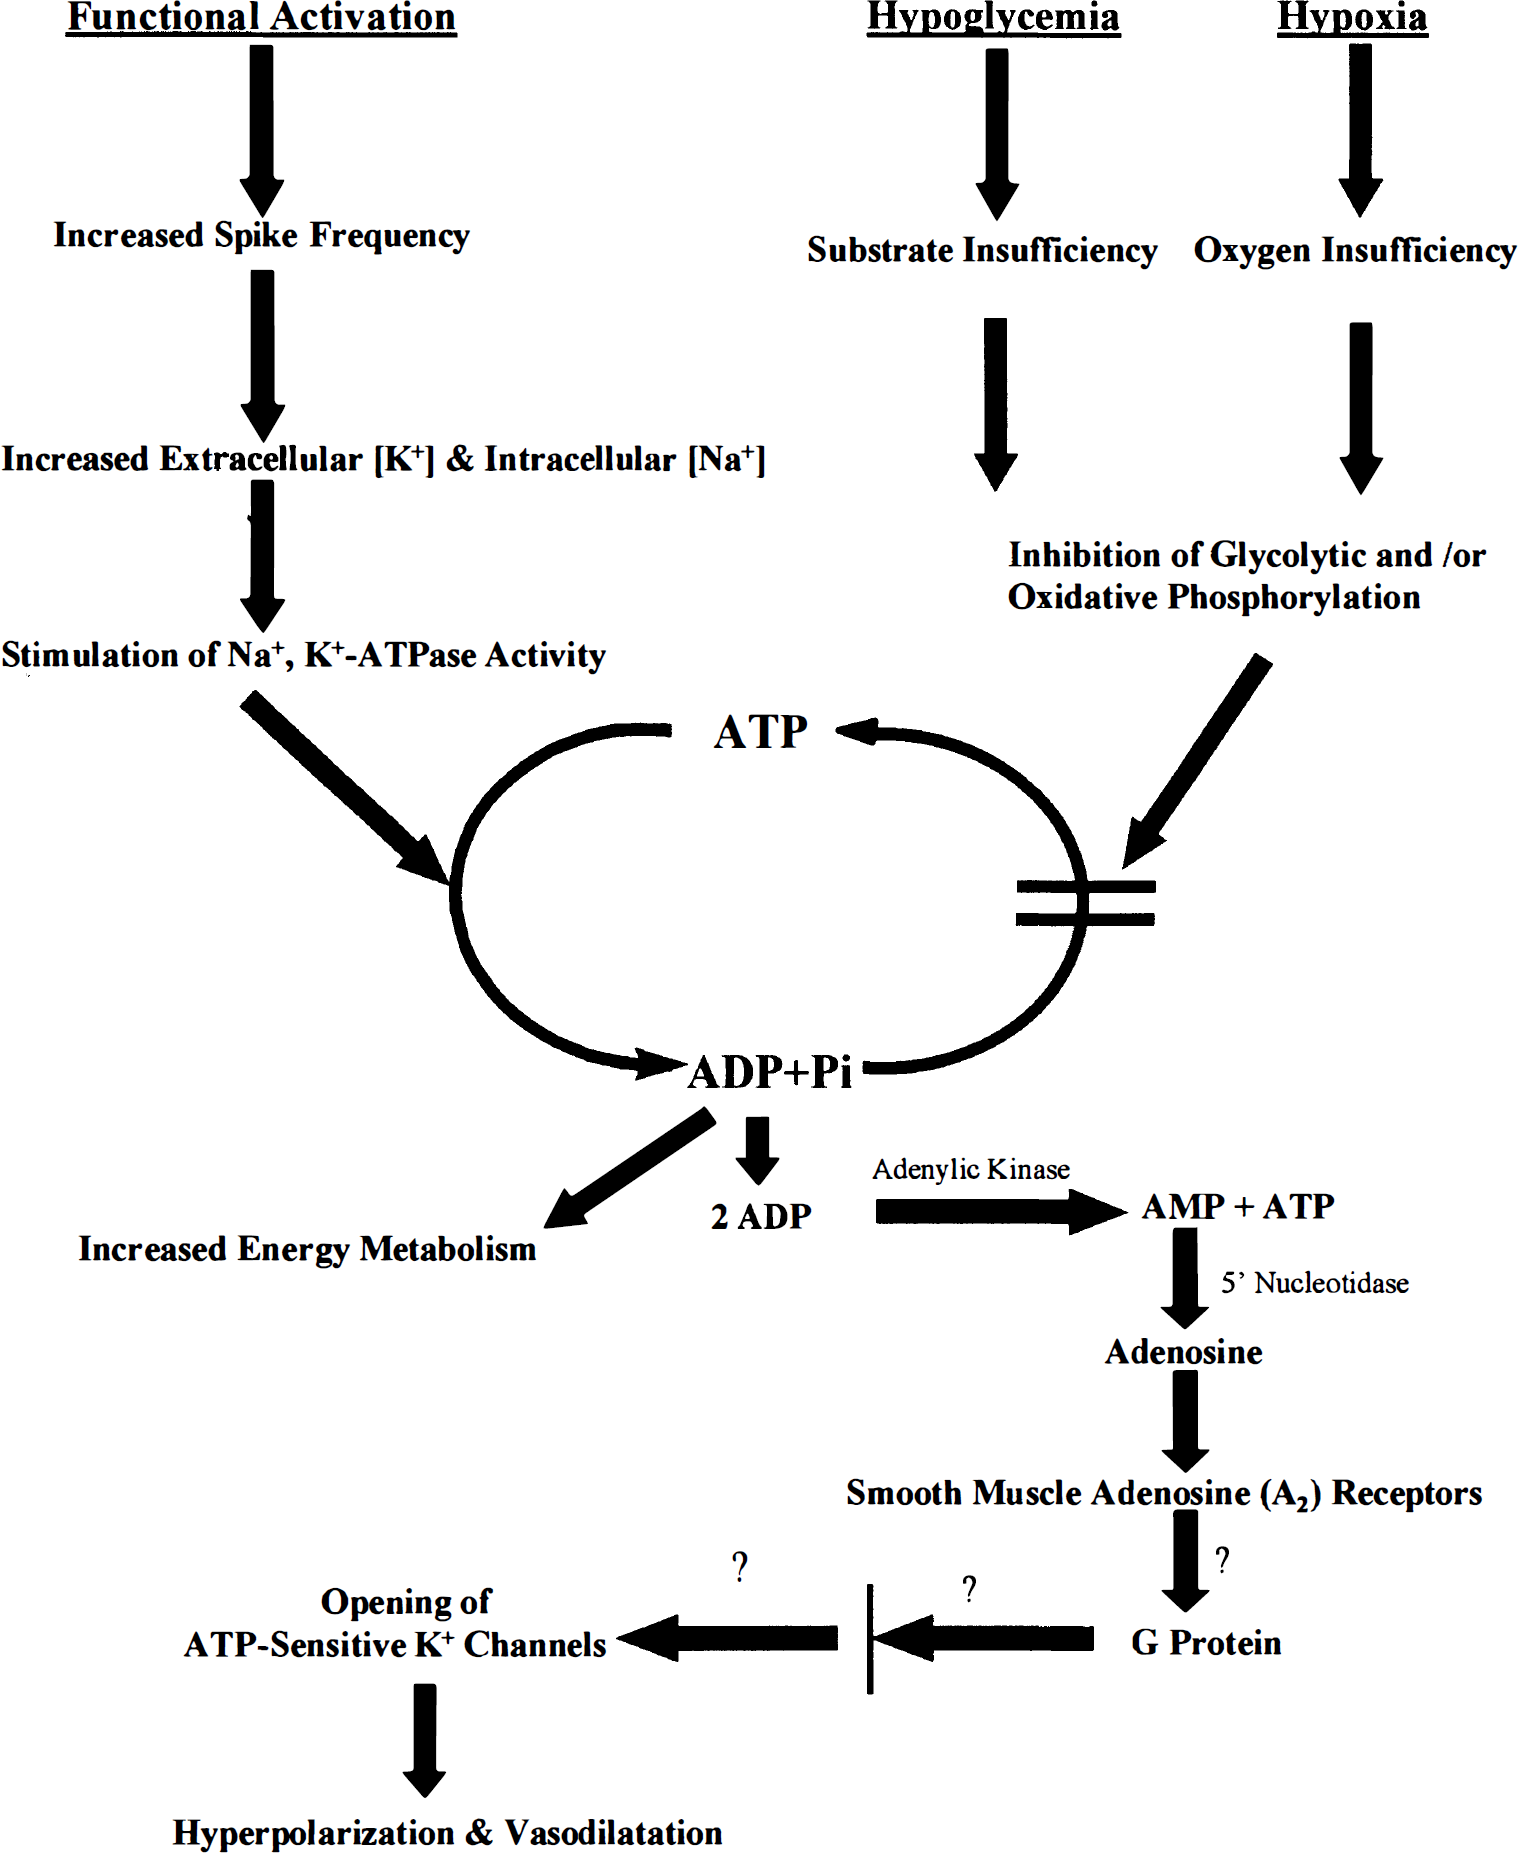
Proposed sequence of events in the mechanisms of the regulation of cerebral blood flow in response to deficient substrate supply or activated neural activity (see Discussion). The question marks placed at several sites in the schema do not imply that such factors have not yet been found; they have been found to operate in some tissues, but there is still no evidence of their role in the regulation of the cerebral circulation.
This hypothesis does not require the assumption of an obligatory sequential relationship, e.g., “tight coupling,” between rates of glycolysis or oxidative metabolism and CBF. One is not a direct consequence of the other. Both are derived from the same initial chemical change, a shift in the balance from ATP to ADP, and then evolve by parallel, separate, independent mechanisms (Fig. 3). Because the shift from ATP to ADP ratio can stimulate both energy metabolism and adenosine formation and increased CBF, there may appear to be a so-called coupling of the two, but it is more a correlation than a true coupling. Metabolism and CBF can and do sometimes vary independently as, for example, in the moderate degrees of hypoglycemia used in the present studies (Suda et al., 1990; Horinaka et al. 1997a).
There are some caveats to consider before this hypothesis can be accepted. First, it assumes that the effects of caffeine and glibenclamide observed in this study resulted from their specific actions at the levels of the adenosine receptors and KATP channels in the vascular smooth muscle. This assumption may be hazardous, particularly with respect to caffeine, which may have other actions as well. Caffeine has localized effects on glucose utilization in the brain (Nehlig et al., 1984) and inhibits cyclic nucleotide phosphodiesterases, which degrade cyclic AMP and cyclic GMP. It may even have a direct effect on the KATP channels, bypassing the adenosine receptors. For example, caffeine has been reported to increase intracellular Ca2+ concentration in pancreatic β-cells by directly inhibiting the KATP channels, which leads to depolarization-induced opening of L-type voltage-dependent Ca2+ channels (Islam et al., 1995). In this study we deliberately chose caffeine because of its non-specificity toward the various adenosine receptors as we were uncertain which might be involved. Obviously more investigation on the effects of more specific adenosine receptor antagonists on the increases in CBF associated with glucose deprivation or functional activation are needed. We are currently pursuing such studies.