
Abstract
In this study, positron emission tomography (PET) imaging with a radioligand to adenosine A2A receptors (A2AR)—a potent regulator of inflammation—was used to gain insight into the molecular alterations in normal-appearing white matter (NAWM) and gray matter (GM) in secondary progressive multiple sclerosis (SPMS). Normal-appearing white matter and GM, despite seeming normal in conventional mangnetic resonance imaging (MRI), are important loci of widespread inflammation, neuronal damage, and source of progressive disability in multiple sclerosis (MS). Dynamic PET imaging using A2AR-specific [ 11 C]TMSX and brain MRI with diffusion tensor imaging were performed to eight SPMS patients and seven healthy controls. Distribution volumes (VT) of [ 11 C]TMSX were analyzed from 13 regions of interest using Logan plot with arterial plasma input. The SPMS patients had significantly increased [ 11 C]TMSX-VT in NAWM compared with controls (mean (s.d.): 0.55 (± 0.08) vs. 0.45 (± 0.05);P = 0.036). Both the increased VT and the decreased fractional anisotropy (FA) in NAWM were associated with higher expanded disability status scale (EDSS) scores (P = 0.030 and P = 0.012, respectively), whereas the T2-lesion load of SPMS patients did not correlate with EDSS. This study shows, that A2ARs are increased in the brain of SPMS patients, and that [ 11 C]TMSX-PET provides a novel approach to learn about central nervous system pathology in SPMS in vivo.
INTRODUCTION
Multiple sclerosis (MS) is an autoimmune disease, where inflammation of the central nervous system (CNS) inflicts neuronal damage and permanent disability. While the treatment regime of relapsing remitting MS is expanding with potent therapies becoming available for clinical use, there is still no efficient treatment for secondary progressive multiple sclerosis (SPMS).
According to current understanding, the progression in MS results from chronic inflammation causing diffuse demyelination, axonal injury, and neurodegeneration, which may also be fueled by oxidative stress causing mitochondrial injury. 1 Focal inflammatory areas are visualized as T2-hyperintense lesions in conventional MRI, but the correlation of physical disability to T2-lesion burden is weak. 2 Instead, areas of brain, which appear normal in conventional MRI, but are slightly abnormal when studied using non-conventional MRI—i.e., areas of normal-appearing white matter (NAWM) and gray matter (GM)—may be pathologically more significant for the development of physical disability. 3 Thus, modulators of chronic inflammation, which might control neuronal damage in the NAWM and GM and therefore the progression of disability in SPMS, are worth investigating to gain an insight into the pathogenic mechanisms, which may contribute to disease progression.
Adenosine is a ubiquitous purine, which acts by binding to four types of widely expressed G-protein-coupled receptors, namely A1R, A2AR, A2BR, and A3R. Adenosine-mediated signaling leads to modulation of inflammation, 4 and in the peripheral immune system, especially the A2A-mediated effects efficiently attenuate inflammation. 5 A2ARs are strongly upregulated at sites of inflammation and tissue damage, thus providing an endogenous way to limit inflammation. 6 A2AR expression in MS brain is still, however, very poorly characterized. [ 11 C]TMSX is a selective radioligand, which binds to adenosine A2AR. 7 Previously, it has been used for in vivo imaging of human brain only in healthy controls and in patients with Parkinson’s disease (PD). In the controls, the strongest binding potential is noted in the striatum. 8 In Parkinson’s disease, a reduction of A2ARs in the putamen of the affected side has been observed, 9 with an increase after dopaminergic treatment. A2ARs may play an important role in regulation of neurotransmission, parkinsonism, and neuroprotection, and A2A antagonists are in active therapeutic development for Parkinson’s disease. 10
Given the strong involvement of A2AR in the control of inflammation, we wanted to gain insight into A2AR prevalence in the brain of SPMS patients, and used the [ 11 C]TMSX radioligand and in vivo PET imaging to evaluate this.
MATERIALS AND METHODS
The study was carried out at the Turku University Hospital and Turku PET Centre, Turku, Finland. The study protocol was approved by the Ethical Committee of the Hospital District of Southwest Finland.
Based on the reports of previous brain [ 11 C]TMSX-PET studies8,9,11 and on the experience from other C-11 labeled PET ligands having similar properties,12,13 it was estimated that 10 subjects in each study group would be sufficient to reveal 15% difference in [ 11 C]TMSX uptake between the study groups with 90% power at P-level <0.05.
Ten SPMS patients and 10 age and sex-matched control subjects were enrolled in the study. A written informed consent was obtained from all participants before entering the study. Complete medical history was acquired, and general and neurologic status were assessed using the expanded disability status scale (EDSS) 14 rating. Inclusion criteria for the SPMS patients were as follows: definite MS diagnosis for more than 5 years before enrolling according to Poser 15 or revised McDonald criteria, 16 progressive disease for a minimum of 2 years from the previous relapse, moderate-to-heavy lesion load (>9 T2-hyperintense MS lesions) in brain MRI, and age 18 to 75 years. Exclusion criteria of SPMS patients included disease-modifying treatment within 3 months or corticosteroid treatment within 30 days of evaluation, EDSS>8, an active neurologic disease or autoimmune disease other than MS, or another significant comorbidity. The control subjects were healthy individuals with no known neurologic symptoms or diseases.
MR Methodology, Imaging, and Data Analysis
Brain MRI (Philips Gyroscan Intera 1.5 T Nova Dual scanner; Philips, Best, the Netherlands) was performed on all subjects for neuroradiological analysis and acquisition of anatomic reference for PET images. Magnetic resonance imaging sequences included axial T1 and T2 weighted, coronal T2 weighted, fluid-attenuated inversion recovery (FLAIR), axial diffusion tensor imaging (DTI), and axial gadolinium-enhanced 3DT1 weighted series.
Total lesion load of the white matter (WM) MS plaques was determined from coronal fluid-attenuated inversion recovery scans with a semiautomated thresholding technique, which has previously been used in our MS studies, 17 using GE AW1.0 software (GE Medical Imaging Systems, Milwaukee, WI, USA). Same signal intensity threshold (200 and over) was used for all patients’ lesion load assessment. Fluid-attenuated inversion recovery sequence was chosen for lesion volume measurement because of its convenience in assessing intensity limits to separate MS lesions having high signal compared with normal-appearing brain tissue, and especially to CSF having no signal in the fluid-attenuated inversion recovery sequence.
Computer analysis of the DTI data was carried out by using the FSL toolbox (FMRIB Software Library, Version 4.1.8; FMRIB, Oxford, UK). 18 FSL is a comprehensive library of analysis tools for fMRI, MR imaging, and DTI imaging data. The NAWM masks for DTI images were created from T2 images. First, the extracranial tissue was extracted from T2 images using BET (Brain Extraction Tool). 19 After removal of the extracranial tissue with BET, the resulting T2 images were segmented into four classes with FAST (FMRIBs Automated Segmentation Tool) to separate GM, CSF, and MS lesions from NAWM. In segmentation with FAST, we used four iterations for bias field removal and 20 mm full-width half-maximum value for bias field smoothing. The MS lesions were efficiently excluded from the NAWM images with this procedure, which was visually checked slice by slice. There were some small central WM areas having obviously normal signal intensity, which were also excluded from the NAWM class by this automatic procedure. These areas were added back to NAWM images manually with FSL View tool.
The raw diffusion data were first pre-aligned to correct for head motion and the effects of gradient coil eddy currents. After this step, the FA and mean diffusivity (MD) images were created by using FDT (FMRIB’s diffusion toolbox), and the extracranial tissue was extracted from the FA and MD images with BET. After linearly co-registering the FA and MD images to corresponding T2 images with FLIRT (FMRIB’s Linear Image Registration Tool), the FA and MD maps representing NAWM were created with T2-derived NAWM masks. Histograms with 170 bins were created from these maps by using FSLmaths. Each bin was normalized by the total number of voxels contributing to the histogram. From each histogram, the average FA and MD and histogram peak heights were derived.
Voxelwise statistical analysis of the FA data was performed using TBSS (Tract-Based Spatial Statistics). 20 All subjects’ FA data were aligned into a common space using the nonlinear registration tool FNIRT (FMRIB’s Nonlinear Image Registration Tool). Next, the mean FA image was created and thinned to create a mean FA skeleton, which represents the centers of all tracts common to the group. Each subject’s aligned FA data were then projected onto this skeleton and the resulting data fed into voxelwise cross-subject statistics. The skeleton projection derived from FA data by TBSS was also applied to MD images for voxelwise analysis of MD.
Measurement of the total brain, WM and GM volumes, was performed with SIENAX (structural image evaluation, using normalization, of atrophy—v2.6, part of FSL). 21 Preprocessing of 3DT1 MR images for parametric PET data analysis was performed using MatLab 2011 (The MathWorks, Natick, MA, USA) with Voxel-Based Morphometry, version 8 (VBM8) 22 toolbox in Statistical Parametric Mapping, version 8 (SPM8). 23 First, the 3DT1 images were segmented into white and GM images according to standard VBM procedures, 24 whereafter normalization of the images into MNI space was performed with DARTEL, 25 an SPM8 toolbox extension for accurate diffeomorphic registration yielding more improved anatomic precision.
[ 11 C]TMSX Radioligand Production
The radiochemical synthesis of [ 11 C]TMSX ([7-N-methyl- 11 C]-(E)-8-(3,4, 5-trimethoxystyryl)-1,3,7-trimethylxanthine) from its desmethyl precursor was performed using an adaption of published methods.7,26 Briefly, in situ produced [ 11 C]methane was converted into the labeling agent [ 11 C]methyl triflate, which was trapped into a solution of precursor (0.4 mg) and cesium carbonate (10 mg) in N,N-dimethylformamide (200 μL). After adding approximately 0.6 mL of HPLC mobile phase (acetonitrile/0.01 mol/L phosphoric acid, 41:59) the reaction solution was purified in C18 column. One hundred and fifty microliters of 100 mg/mL ascorbic acid and 0.5 mL of propylene glycol/ethanol (7/3) were added to the collected fraction and the mobile phase was evaporated. Residue was formulated in 0.1 mol/L phosphoric acid buffer containing propylene glycol/ethanol and ascorbic acid (83:15:2) and sterile filtered through Pall Corp. Acrodisc 0.2 μm HT Tuffryn membrane. Radiochemical purity of produced [ 11 C]TMSX was 97.4±0.8% and specific radioactivity was 340±120 MBq/nmol (mean±s.d.) at the time of injection.
[ 11 C]TMSX-PET Imaging and Analysis Methods
Brain PET imaging with [ 11 C]TMSX was performed with ECAT HRRT scanner (CTI/Siemens, Knoxville, TN, USA). 27 The mean time between the MR and PET imaging was 22 days (median 0, s.d. 42 days). The subjects were instructed to abstain from caffeinated drinks 12 hours before the study because of caffeine’s antagonistic properties to adenosine receptors. An antecubital venous cannulation for administration of the ligand, and an arterial cannulation for repeated arterial sampling during the imaging were performed by an anesthesiologist before the scan. The subjects were placed in supine position on the scanner table, and an individually shaped polymer face mask was placed to minimize spontaneous movements of the head during the scan. Polaris Vicra (Northern Digital, Waterloo, Ontario, Canada) motion detection device was used to record the head movements for quality control. After 6 minutes transmission scan using 137Cs point source for attenuation correction, the 60-minute dynamic imaging was started simultaneously with the administration of the ligand as a smooth intravenous bolus of 10 seconds.
During the first 300 seconds, an arterial blood sampling system (Allogg AMSS, Allogg AB, Mariefred, Sweden) was used to acquire continuous arterial blood radioactivity assessment, whereafter manual arterial blood samples were drawn at 5, 10, 15, 20, 30, 40, 50 and 60-minute time points for metabolite and radioactivity analyses. Plasma protein binding was determined from six subjects by ultrafiltration method Microcon YM-30 units with 30,000 molecular weight cut-off filter (Millipore/Amicon, Bedford, MA, USA). 28 11 C-TMSX was bound to plasma proteins to high extent; 90.9 ± 0.4% (mean ± s.d., n = 6). Thus, the free fraction of 11 C-TMSX in plasma was 9.1 ± 0.4%.
To obtain the arterial input function for the distribution volume (VT) estimation, the total radioactivity concentrations and the fraction of the intact [ 11 C]TMSX in the manually obtained arterial plasma samples were determined by using an automatic gamma counter (1480 Wizard 3’; EG&G Wallac, Turku, Finland) and radio-HPLC respectively. Radio-HPLC system consisted of LaChrom Instruments (Hitachi; Merck, Darmstadt, Germany): pump L-7100, UV-detector L-7400, and Interface D-7000, of an on-line radioactivity detector (Radiomatic 150 TR, Flow Scintillation Analyzer; Packard, Meriden, CT, USA) and a computerized data acquisition system. Radio-HPLC was performed on a μ-BondapakC-18 column (125 Å, 10 μm, 7.8 × 300 mm; Waters, Milford, MA, USA) at a flow rate of 6.0 mL/min and a gradient of acetonitrile (A) and of phosphoric acid, 50 mmol/L (B) as follows: 0–2 minutes of 25% A and 75% B, 6–8 minutes of 80% A and 20% B, and 8.5–10 minutes of 25% A and 75% B. The peaks of radioactivity were integrated with PC and proportion of intact radiotracer was calculated. Intact 11 C-TMSX was identified by comparing the retention time of the ‘cold’ TMSX at 351 nm wavelength. All the imaging and blood sampling procedures were performed under dimmed light to prevent the photoisomerization of the ligand.
The initial 5 minutes’ continuous sampling via arterial blood sampling system represents the radioactivity in the whole blood only, and thus, the plasma radioactivity of the initial part was estimated by multiplying the whole blood radioactivity with the plasma per whole blood ratio acquired from the tracer-dependent, population-based mean hematocrit value (0.40). Thereafter, combining the aforementioned data, an in-house developed software was used to calculate the arterial plasma input of the unmetabolized [ 11 C]TMSX radioactivity as a function of time taking into account the physical decay of the radioligand and the time delay between the peripheral injection and the availability of the ligand in brain circulation into account.
Image reconstruction was performed using 27 time frames (6 × 10, 1 × 30, 5 × 60, 5 × 150, and 8 × 300 seconds; total 3600 seconds) according to the methods described before by Alakurtti et al. 29 The displacements between frames—although small according to the external motion detection—were corrected using mutual information realignment in SPM8. We chose a subset of first 19 frames (20 minutes) with the least movement for summation to form a reference for frame-by-frame realignment. The frame-by-frame realignment parameters affirmed the external motion trackings, and coregistration of the attenuation map images and image re-reconstruction were deemed unnecessary for the current application.
For individual region of interest (ROI) drawing, the coregistration of the dynamic and summed images of frames 1 to 27 with the preprocessed 3DT1 MR images was performed using SPM8 running on MatLab 2011. Thirteen ROI (Table 1) were delineated using in-house developed Imadeus software (Forima Inc., Turku, Finland). The WM tissue-associated ROIs were placed into the periventricular and supraventricular WM areas appearing normal in the reference MRI, and distant to the immediate subcortical WM to avoid the partial volume effect from the GM. In MS patients, demyelinating lesions were also delineated out from the NAWM ROIs. The volumes of the ROIs between control and SPMS groups did not differ significantly (mean (s.d.): 7.9 (1.1) vs. 8.3 (4.6) cm3; P = 0.74). Region of interest-specific time-activity curves derived from Imadeus, and plasma input function obtained from arterial blood sampling during the imaging were applied to Logan plot to calculate the distribution volumes of [ 11 C]TMSX from 10 to 40 minutes after the tracer injection.
Brain MRI and [11C]TMSX-PET imaging results of seven control subjects and eight SPMS patients
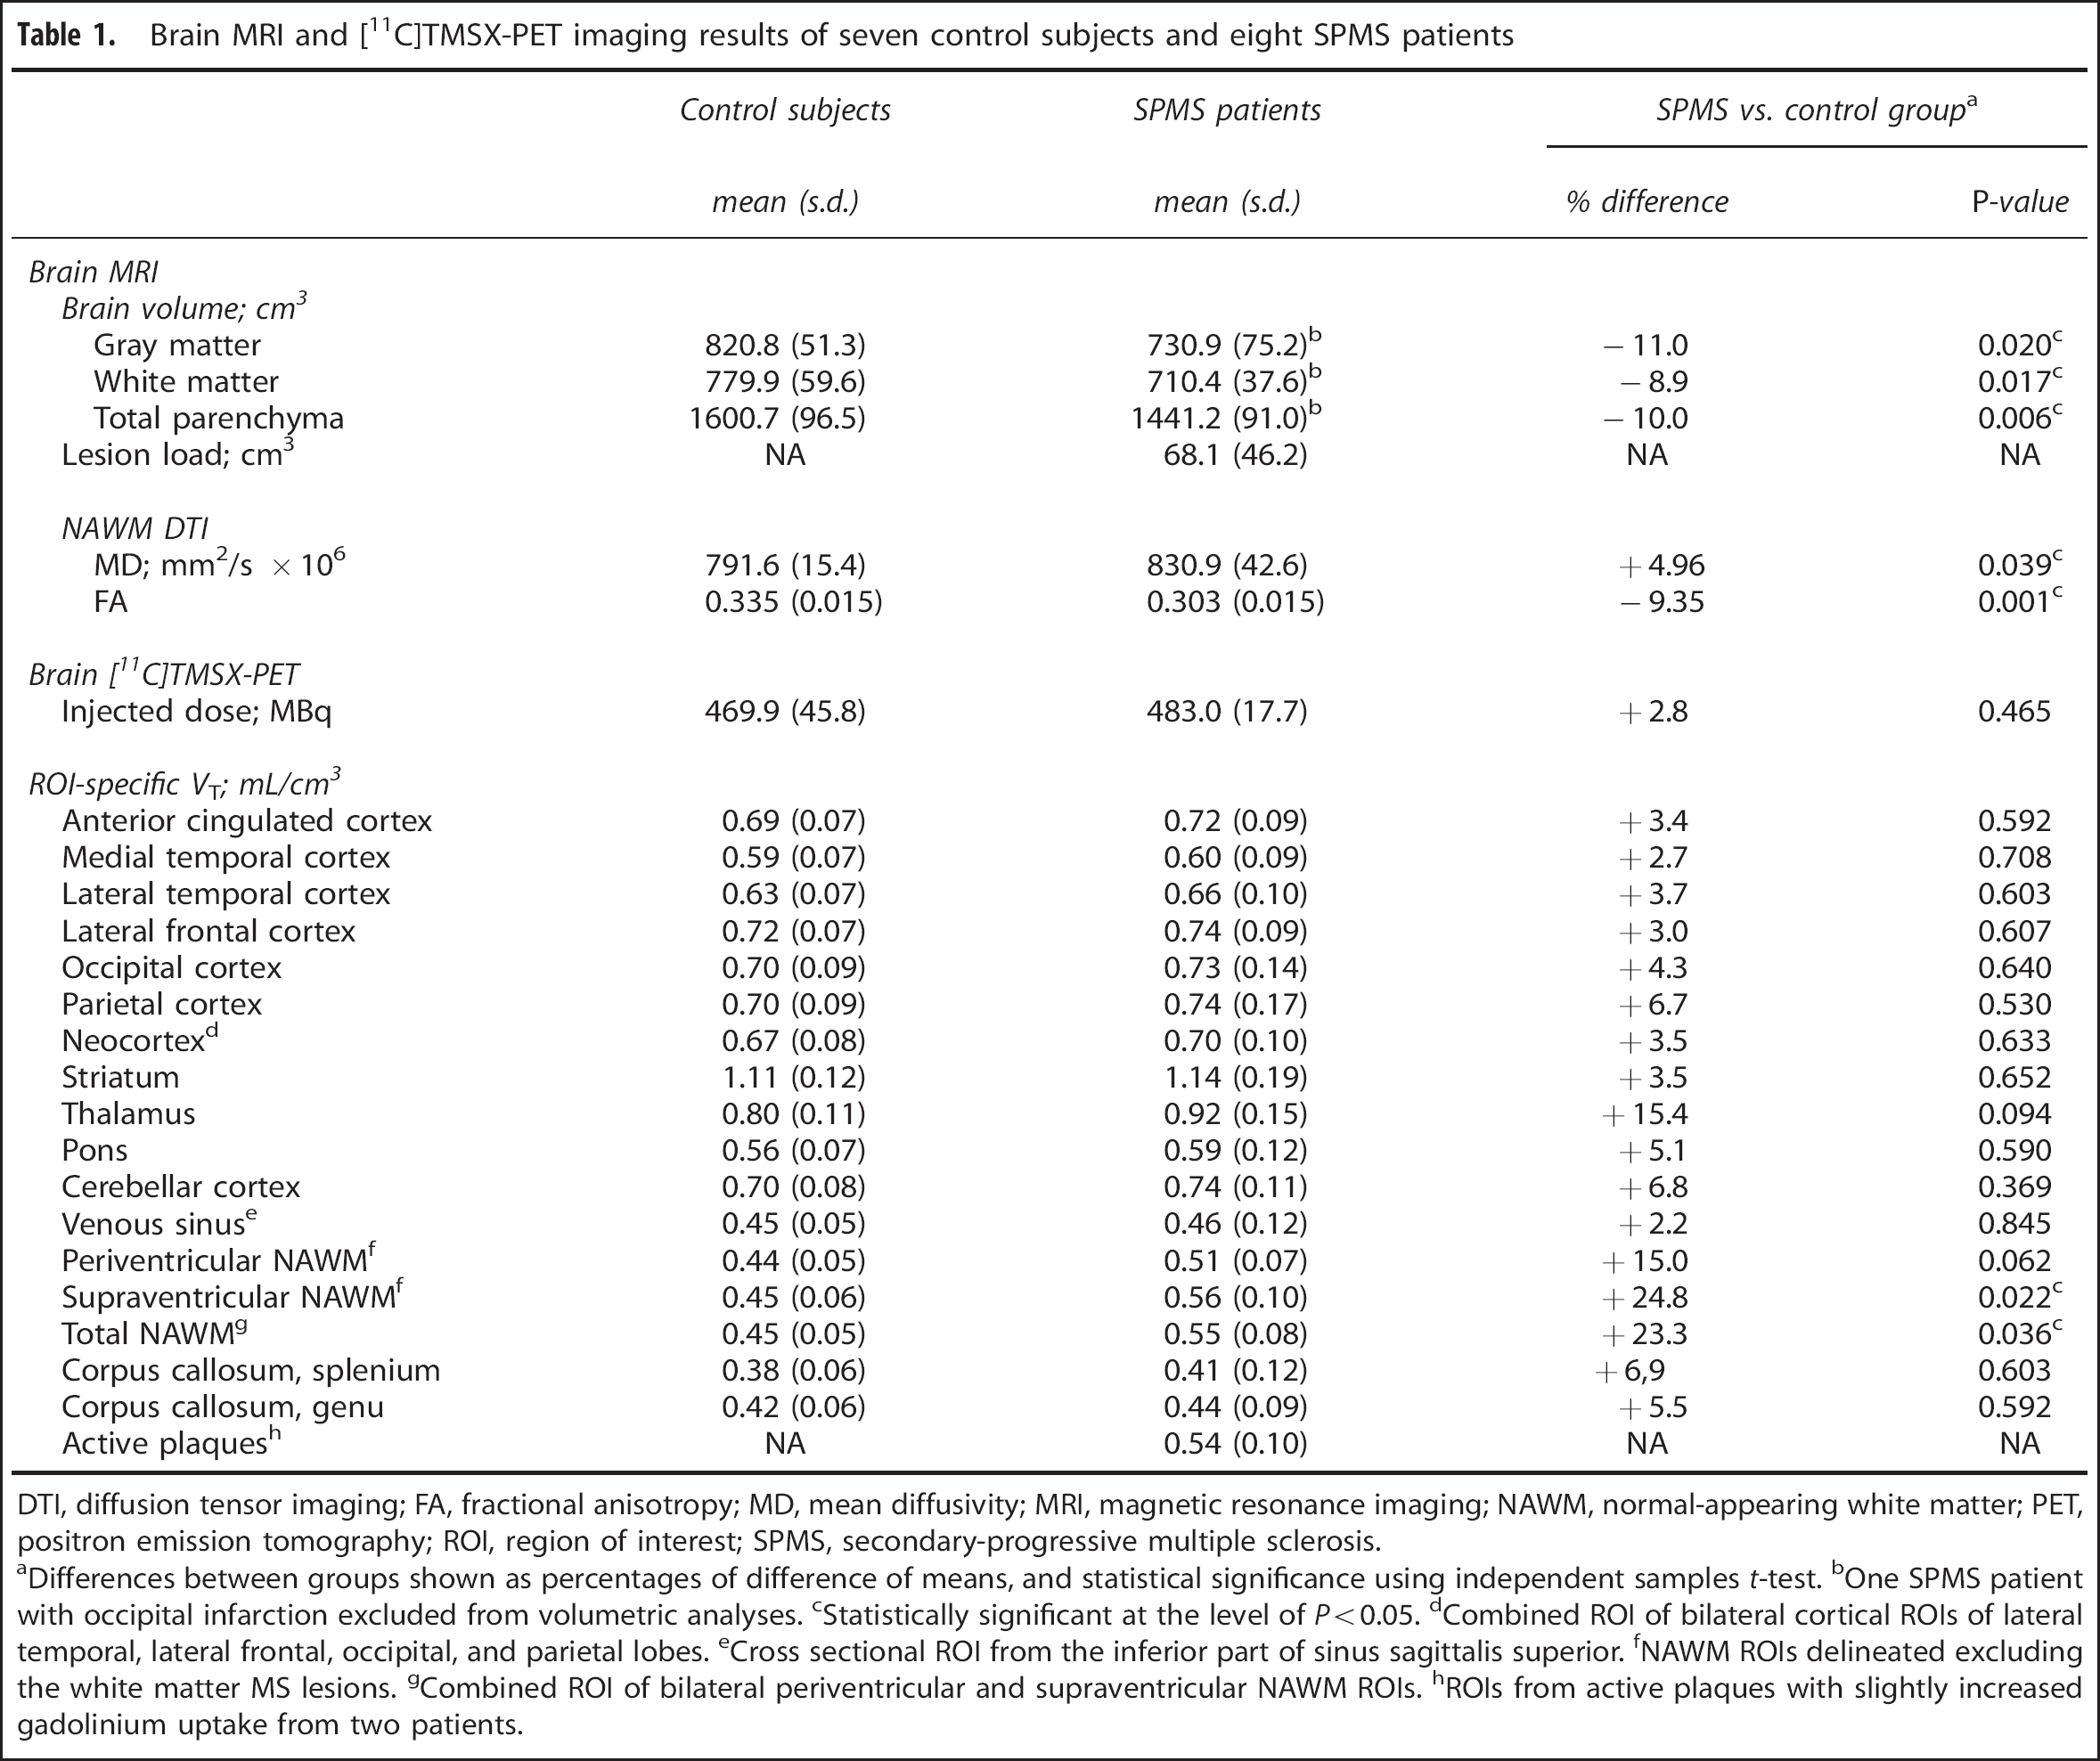
DTI, diffusion tensor imaging; FA, fractional anisotropy; MD, mean diffusivity; MRI, magnetic resonance imaging; NAWM, normal-appearing white matter; PET, positron emission tomography; ROI, region of interest; SPMS, secondary-progressive multiple sclerosis.
aDifferences between groups shown as percentages of difference of means, and statistical significance using independent samples t-test. bOne SPMS patient with occipital infarction excluded from volumetric analyses. Statistically significant at the level of P<0.05. dCombined ROI of bilateral cortical ROIs of lateral temporal, lateral frontal, occipital, and parietal lobes. eCross sectional ROI from the inferior part of sinus sagittalis superior. fNAWM ROIs delineated excluding the white matter MS lesions. gCombined ROI of bilateral periventricular and supraventricular NAWM ROIs. hROIs from active plaques with slightly increased gadolinium uptake from two patients.
Logan plot from 10 to 40 minutes after tracer injection with metabolite-corrected plasma input was also used to calculate the parametric [ 11 C]TMSX images, in which each image pixel represents local VT. The parametric images were normalized to MNI space with VBM8 using DARTEL normalization with subject-specific transformation parameters obtained from 3DT1 MR image preprocessing. Before statistical analysis of the parametric [ 11 C]TMSX-VT images using SPM8, the images were smoothed with 8 mm Gaussian kernel.
Statistical Methods
The statistical analyses of clinical, MRI and ROI variables were performed with SPSS (IBM SPSS Statistics, version 19). Normality of the variables’ distribution was confirmed using Shapiro–Wilk test, whereafter independent samples t-test with Levene’s test of variance equality was performed. To evaluate possible correlations between variables of interest, Pearson’s test was performed providing that the distribution was stated normal.
The voxel-based group differences in the parametric [ 11 C]TMSX-VT images were evaluated in SPM8 using proportional scaling for global normalization of the images and independent samples t-test to test for differences between groups. Before the proportional scaling for global normalization, the requirements for using the method were checked according to previously published reports.30,31 The relation between global and regional VT values were found to be proportional rather than additive (Supplementary Figure), thus supporting the use of proportional scaling instead of analysis of covariance in global normalization. The grand mean scaling was set to value 1 to perform the normalization with image-specific global values. Before the voxel-level analysis, the normalized VT images were masked to contain voxels only from segmented gray and WM, and thus the mean VT of all intracerebral voxels was used in the global normalization. Before the global normalization, there were no significant differences in the global VT between the groups (mean ± s.d. for controls: 0.64 ±0.07, and for SPMS patients: 0.67 ±0.11, respectively; P = ns). The group differences in voxel clusters with uncorrected P< 0.001, and corrected P< 0.05 for multiple comparisons (familywise error, FWE) were regarded as significant.
RESULTS
Study Subjects
Of the enrolled 10 healthy control subjects and 10 SPMS patients, one female from the control group withdrew her consent after the MRI imaging before the [ 11 C]TMSX-PET was performed. One male control subject was excluded because of numerous ischemic degenerative lesions in the cerebral WM on MRI. One female control with no previous history of anxiety experienced an unexpected panic attack during PET imaging, because of which, the scan was prematurely terminated. One female patient’s PET data was excluded because of technical failures in the data reconstruction, and one male patient’s PET data was excluded because of too low registered activity to allow reliable quantitation because of the probable photoisomerization of the ligand before injection.
Thus, eight SPMS patients (age 49.4 ± 11.9 years, range 39 to 66 years, disease duration 12.9 ±5.6 years, and EDSS 6.7 ±1.3 (mean ± s.d.); two men and six women) and seven age and sex-matched control subjects (mean age 49.1 (s.d. ± 8.2, range 42 to 61 years); two men and five women) were included in the final analyses. In descriptive statistical analysis, the Shapiro–Wilk test revealed no deviations from the normal distribution in the demographic, clinical, MRI or PET ROI variables of the study subjects.
MRI Variables
Qualitative MRI Analysis.
All SPMS patients had widespread WM pathology in T2-weighted MRI (Table 1). Active plaques with slightly increased Gadolinium uptake were found in only two patients. One MS patient had a small, right-sided, cortical occipital lesion compatible with an old ischemic infarction but no other ischemic-degenerative lesions were observed. One female control subject (60 years old) had mild ischemic-degenerative WM lesions but no infarctions. None of the ischemic lesions were included in the individual ROIs, and the SPMS patient with occipital infarction was excluded from the volumetric group comparisons. In volumetric analyses, SPMS patients had significantly smaller-average WM and GM volume compared with control subjects (Table 1).
Quantitative MRI Analysis.
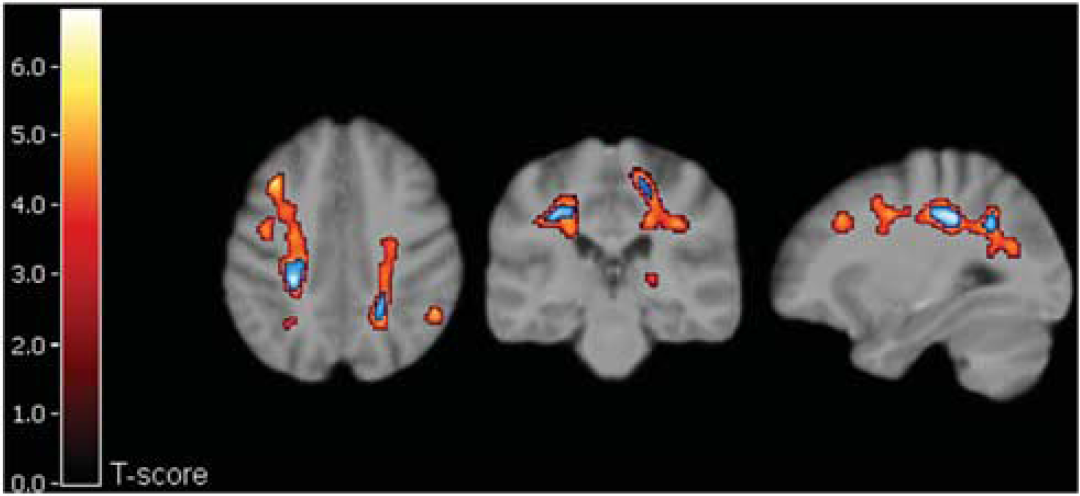
Diffusion tensor imaging results suggested injury of the WM tracts in the NAWM of the SPMS patients; in the histogram analyses, the SPMS patients had significantly lower average FA and higher average MD in the NAWM compared with healthy controls (Table 1). The SPMS patients also had a significant increase in average NAWM FA peak height and significantly decreased average NAWM MD peak height (Figure 1). Voxel-wise DTI analysis of WM showed significantly reduced FA and increased MD of SPMS patients compared with control subjects in widespread areas of WM; along the corpus callosum, the bilateral corticospinal tract, the bilateral optic radiation, and the bilateral corona radiate. The thalami also showed a reduction in FA (Figure 2). Regional increases in the FA values or decreases in the MD values of patients with SPMS compared with control subjects were not found.
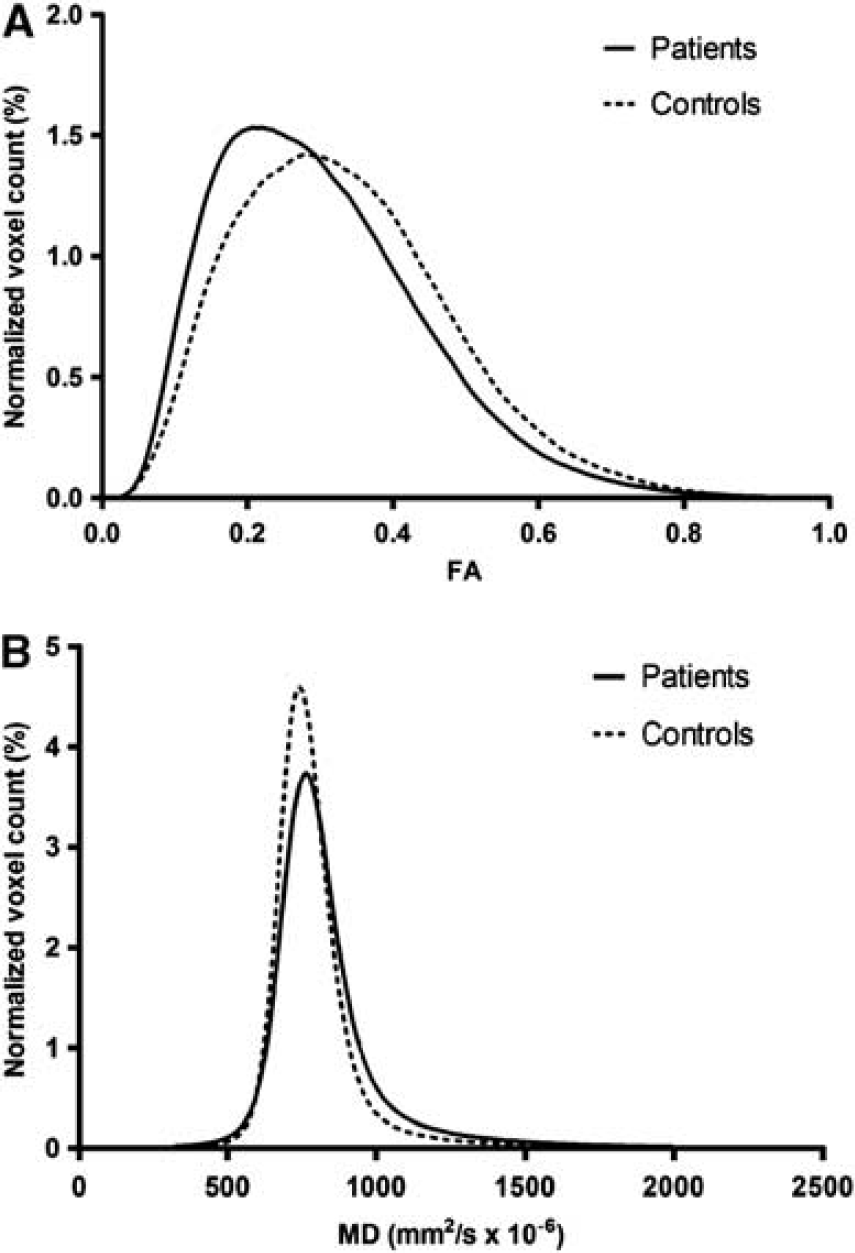
Normalized histograms of fractional anisotropy (FA) (
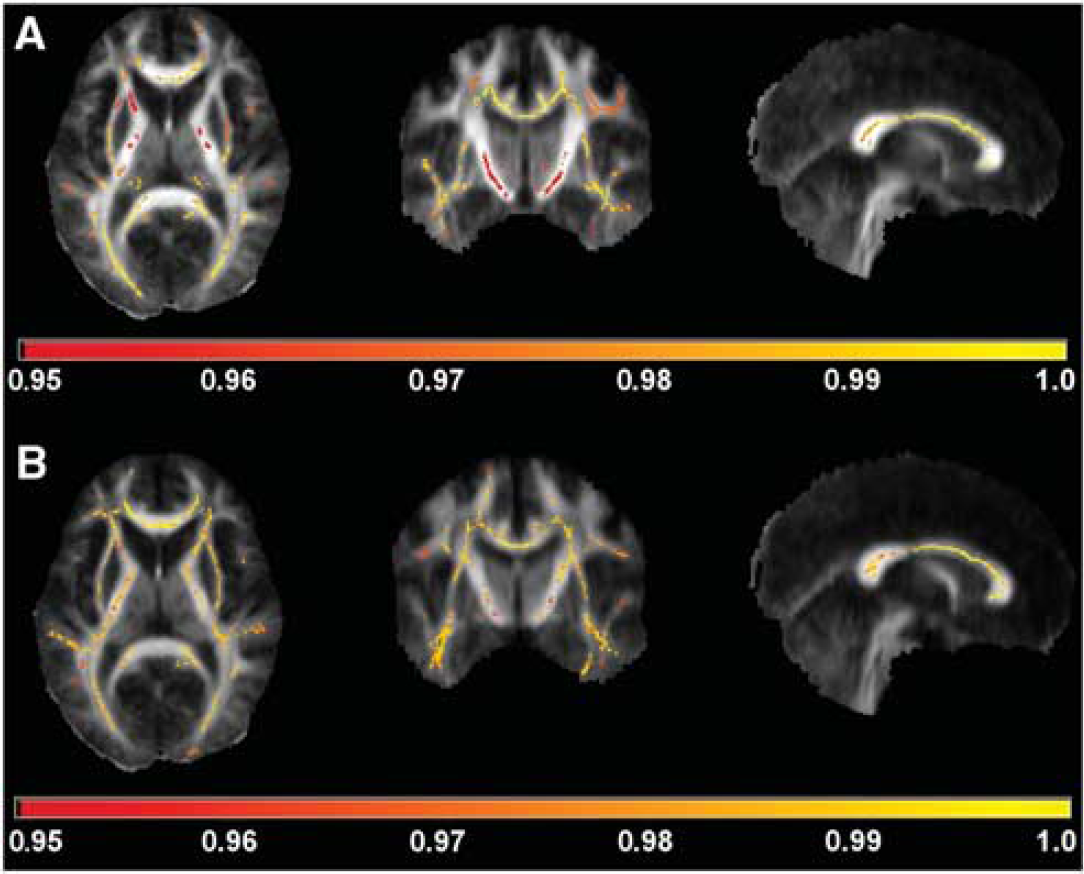
Tract-based spatial statistics analysis of the fractional anisotropy (FA) (
When analyzing the MRI parameters of the SPMS patients using Pearson correlation, neither WM or GM volumes, nor the WM T2-lesion load had significant correlations to EDSS or disease duration. However, the mean FA in the NAWM correlated inversely to EDSS score (i.e., reduced WM tract integrity indicated by reduced mean FA was associated to increased disability measured by EDSS (Figure 4A). As expected, strong inverse correlation of mean FA to mean MD was noted, with Pearson correlation = 0.847 (P<0.001). Decreased WM volumes were also associated with decrement in mean FA (0.595, P = 0.025), and smaller GM volumes correlated to increased mean MD (-0.671, P = 0.009) and reduced mean FA (0.745, P = 0.02).
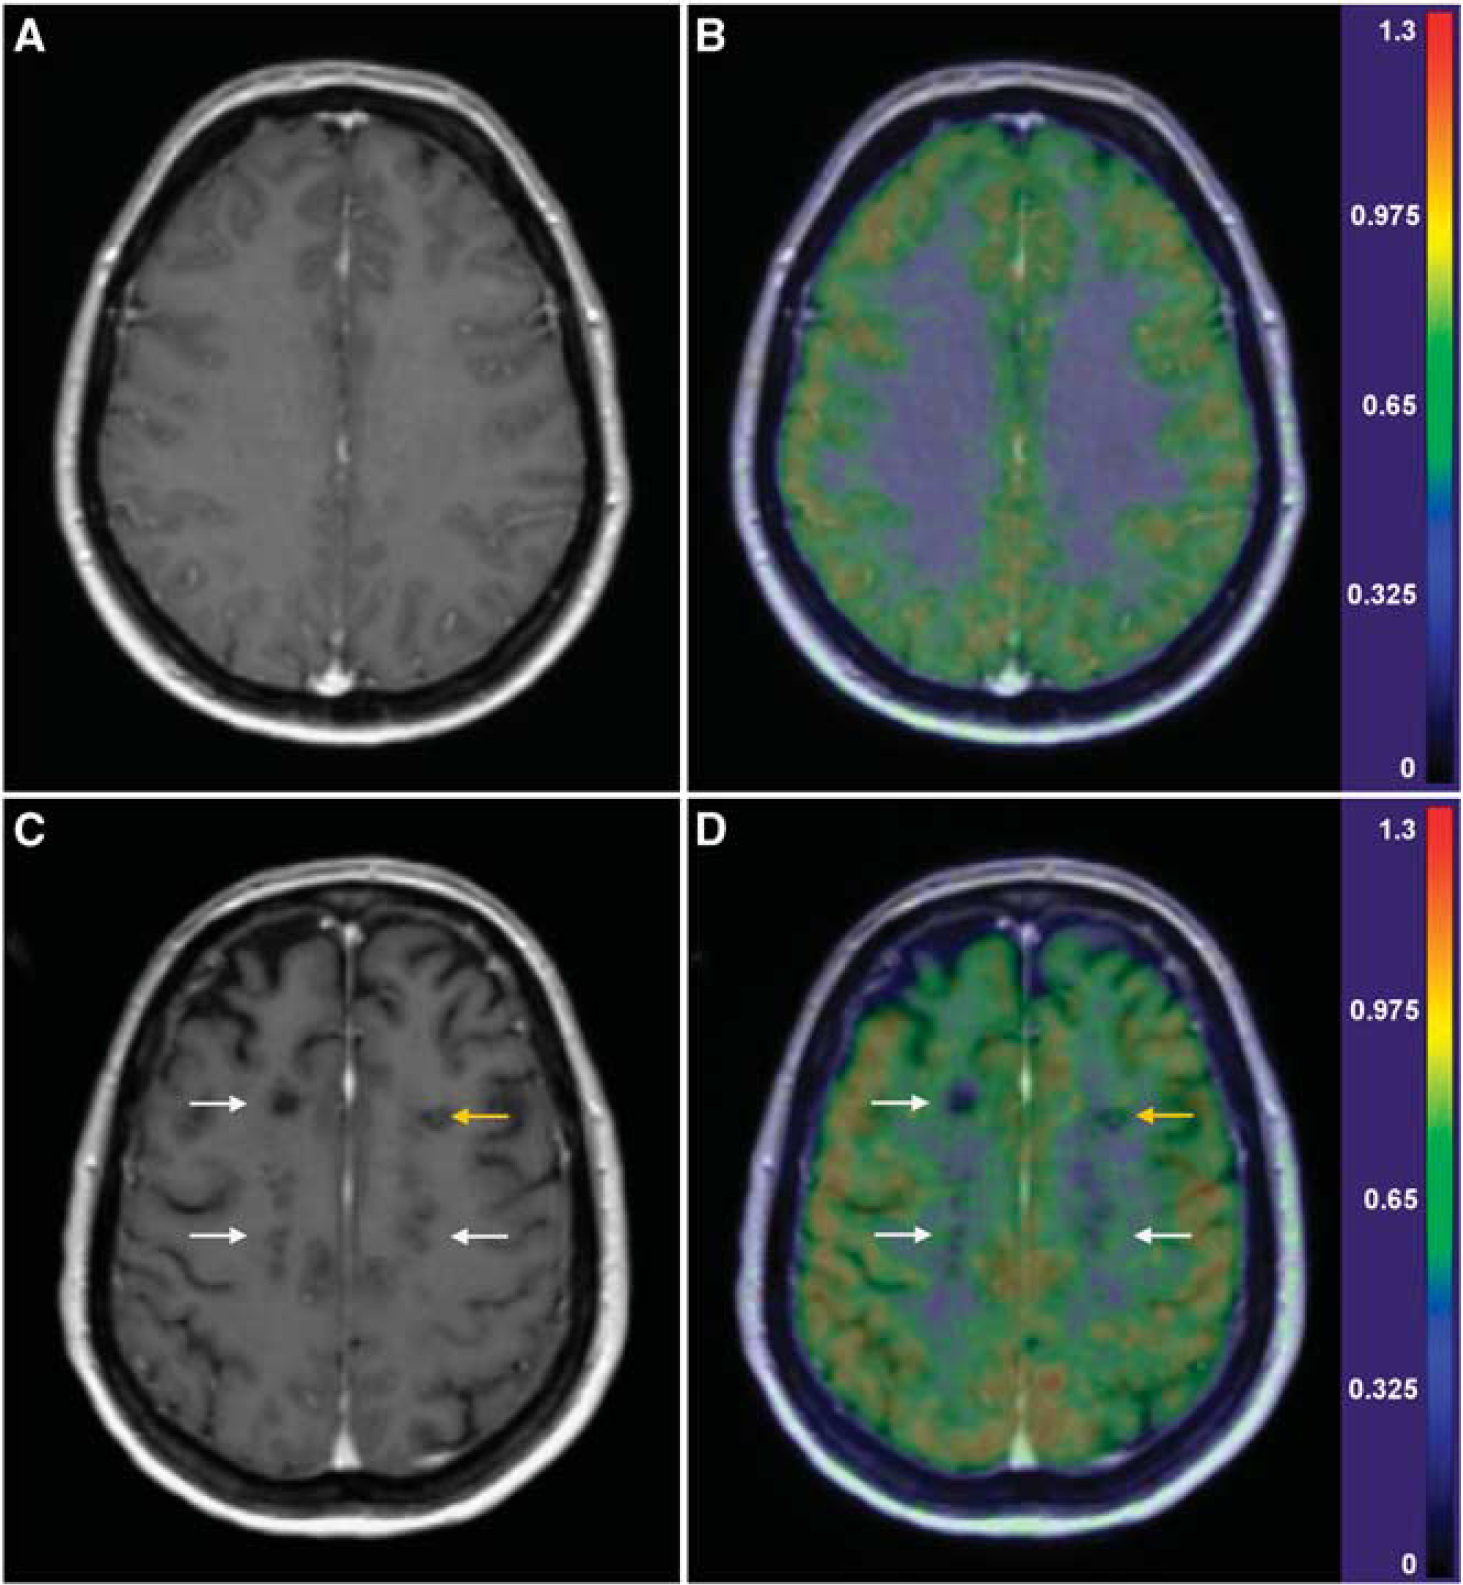
Gd-enhanced 3DT1 magnetic resonance (MR) images (left column), and fusions of parametric [
11
C]TMSX-VT and 3DT1 MR images (right column) of a healthy, 45-year-old woman (panels
[ 11 C]TMSX-PET
The mean administered dose of [ 11 C]TMSX radioactivity was 476.9 (s.d. 33.2) MBq with no significant differences between groups (Table 1), corresponding to a mass of 0.47 (s.d. 0.27) μg. [ 11 C]TMSX was shown to remain very stable in the blood circulation. The fractions of intact tracer at different time points are shown in Figure 3.
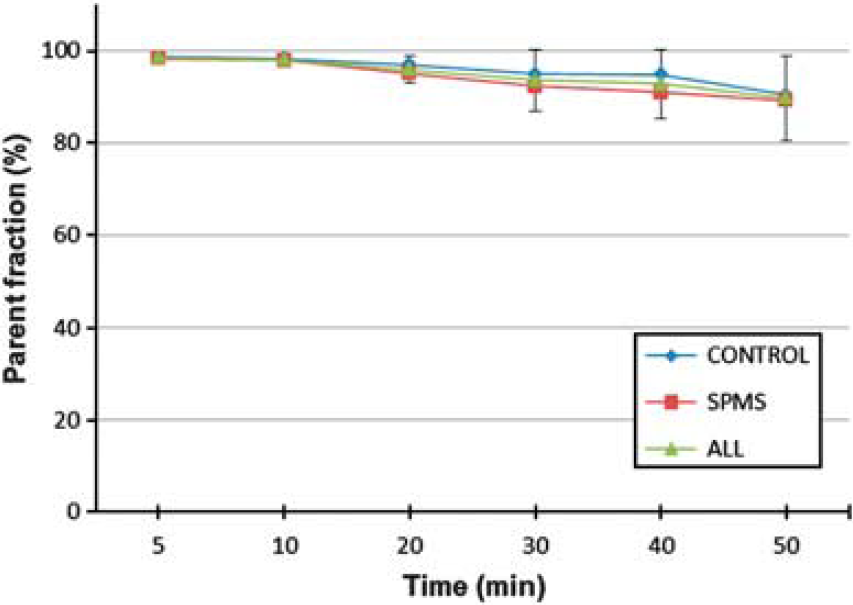
The average fractions of intact [ 11 C]TMSX (parent fraction) of total plasma radioactivity at different time points within groups (controls, n = 7, secondary-progressing multiple sclerosis n = 8) and all studied subjects (n = 15) with s.d. error bars.
The ROI-specific [ 11 C]TMSX-VT results (Table 1) showed significantly increased [ 11 C]TMSX-VT (referring to increased uptake of the ligand by A2AR) in the supraventricular NAWM compared with controls (P = 0.022), and a trend for increased VT was also observed in the periventricular NAWM (P = 0.062). When the combined (supraventricular and periventricular) NAWM ROI of SPMS patients was compared with that from healthy controls, a significant difference was also noted (P = 0.036). The moderately active plaques with slightly increased Gd-uptake in MRI in two patients had similar VTs compared with the NAWM uptake. However, there was virtually no uptake in the chronic T1 ‘black hole’ plaques, whereas rim-like pattern for increased TMSX uptake around the borders of chronic plaques could be identified in individual cases (Figure 4). Furthermore, SPM analyses of parametric [ 11 C]TMSX-VT images showed significantly increased ligand uptake in wide spread areas of the supra- and periventricular WM (Figure 5).
Results of SPM analysis of seven control subjects’ and eight SPMS patients’ parametric [ 11 C]TMSX-VT images. Clusters of significantly increased VT in SPMS compared with control group are overlain on the study subjects’ averaged magnetic-resonance imaging template. T-scores (indicated with scaled color bar)>3.8 correspond to uncorrected P<0.001, and the blue areas indicate clusters with family-wise error-corrected P<0.05.
Significant correlations between [ 11 C]TMSX-VT values, MRI parameters, and clinical measures were noted (Figure 6). The [ 11 C]TMSX-VT in the total NAWM ROI had a significant positive correlation to EDSS. In addition, there was an inverse correlation of the [ 11 C]TMSX-VT to the mean FA in the NAWM. The increased VT in NAWM was also associated with decreased WM volumes. However, the small group sizes did not allow reliable estimation of the correlations by within group approach.
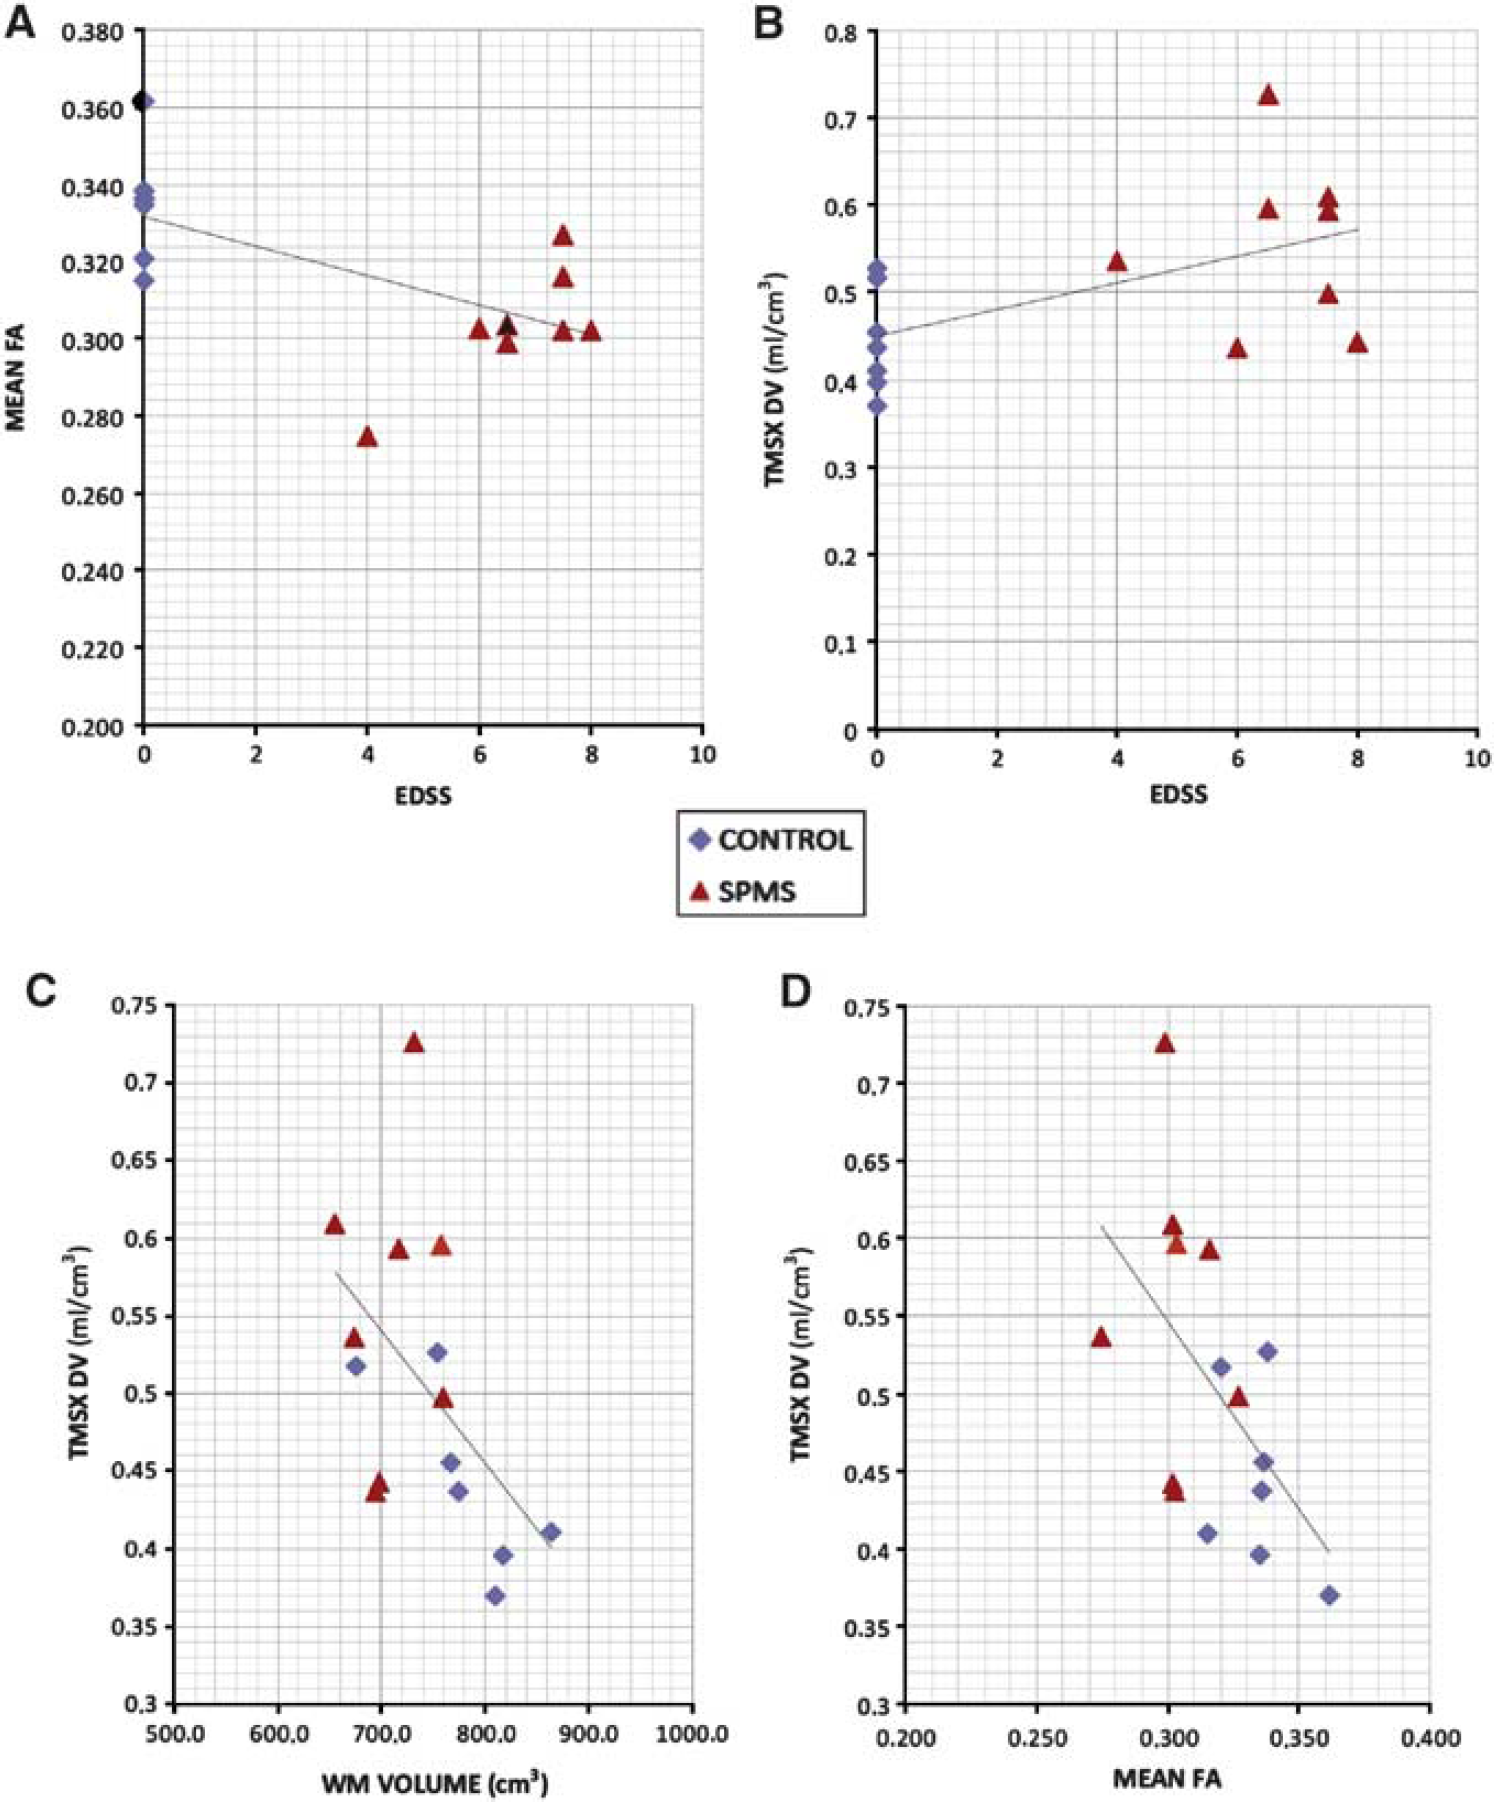
Significant correlations of (
DISCUSSION
Non-conventional MRI techniques such as DTI allow detection of abnormalities in the NAWM of MS patients, but these measurements are mostly descriptive and unspecific in nature. 32 Detailed pathology imaging correlation studies of SPMS brain have, however, demonstrated increased microglial activation and axonal degeneration associated with reduced FA in the NAWM. 3 Our study demonstrates, using a specific A2AR-binding radioligand and in vivo PET imaging, that A2ARs are increased in the NAWM of SPMS patients compared with healthy controls. The increased A2AR binding observed in the present study was associated with (1) decreased FA in DWI, (2) high EDSS, and (3) increased brain tissue loss. Also, the thalami showed a trend for increased A2AR radioligand binding in patients with SPMS. Our results suggest that A2AR might be involved in modifying the widespread pathologic process in the SPMS brain, and importantly, demonstrate that A2AR expression can be quantified using in vivo PET imaging.
In vitro studies have shown abundant expression of A2AR widely throughout the CNS.33,34 Microglial cells express purinergic receptors, 35 and inflammatory stimuli lead to upregulation of the A2AR on microglial cells in vitro. 36 Also, A2A-receptor stimulation of the microglial cells results in morphologic alterations and functional changes in their behavior, the crucial alteration being deramification, a hallmark of neuroinflammation. 36 A2AR-mediated signaling is considered an important regulator of inflammation, but in the CNS, the outcome of A2AR activation is far less clear than in the periphery (where nearly always the activation causes a strong anti-inflammatory effect). Some work suggest that A2AR-signaling on activated microglia results in an anti-inflammatory outcome, 34 whereby A2AR activation would represent an endogenous way to control inflammation in the CNS. In other circumstances, adenosine may contribute to neuronal damage and cell death via microglial A2AR signaling,37,38 suggesting that A2AR antagonism could lead to neuroprotection. Interestingly, adenosine has also been linked to myelination in the CNS. Oligodendrocyte progenitor cells express all four subtypes of adenosine receptors, and adenosine acts as a potent neuron–glial transmitter by inhibiting the proliferation of OPC and by promoting their differentiation and myelination. 39 To ascertain the cell types with altered A2AR expression in MS, human postmortem studies are still needed.
Earlier human PET studies with A2AR-binding radioligands have used the centrum semiovale 9 or cerebellum 12 as reference regions (i.e., the reference tissue devoid of the ligand’s specific binding) in BP estimation. However, these are unsuitable in MS-related studies because of high MS pathology in these areas, and thus BP evaluation was not feasible to be performed. Hence, the results of the VT estimations are subject to higher variability between subjects due to the nonspecific binding component of the VT by definition. Therefore, as an alternative method to control for the effect of global differences in regional VTs, global normalization with proportional scaling was used in the analysis of parametric PET images. However, the increased atrophy and dispersed localization of MS pathology among SPMS patients could contribute to increased PET signal in WM via partial volume effect from the binding in adjacent subcortical GM. Therefore, the preprocessing and normalization features in VBM8 were used to control for the effect of variation in the parenchymal anatomy between subjects.
In our study, arterial input function was obtained via arterial cannulation and blood sampling. Despite of being a golden standard in brain PET image modeling, this method is not only laborous and unpleasant for the study subjects, but also prone to errors due to inaccuracies of manual sampling and HPLC analyses caused by low radioactivity in the last time points, thereby possibly increasing within-group variation. Consequently, further development of PET data modeling based on methods not dependent on reference plasma input or manual delineation of reference tissue region would be of great value for future brain studies with [ 11 C]TMSX-PET. Another drawback in this study was the small number of the study subjects, which also sets limitations on the interpretation and generalization of the results. It should also be noted, that even though the within-group variations of the increased NAWM VT in manually delineated ROIs was relatively high, the automated voxel-based analyses of the parametric images yielded similar results.
In conclusion, we have studied the NAWM of SPMS patients using PET, and found increased expression of A2AR, which correlated with decreased FA. Our work demonstrates the potential usefulness of [ 11 C]TMSX-PET imaging in helping to detect the diffuse pathologic alterations in the NAWM associated with progressive disease. The method could thus complement the conventional imaging approaches, whereby such diffuse alterations are more difficult to identify.
DISCLOSURE/CONFLICT OF INTEREST
The authors declare no conflict of interest.
Footnotes
References
Supplementary Material
Please find the following supplemental material available below.
For Open Access articles published under a Creative Commons License, all supplemental material carries the same license as the article it is associated with.
For non-Open Access articles published, all supplemental material carries a non-exclusive license, and permission requests for re-use of supplemental material or any part of supplemental material shall be sent directly to the copyright owner as specified in the copyright notice associated with the article.