
Abstract
Postischemic brain reperfusion is associated with a substantial and long-lasting reduction of protein synthesis in selectively vulnerable neurons. Because the overall translation initiation rate is typically regulated by altering the phosphorylation of serine 51 on the α-subunit of eukaryotic initiation factor 2 (eIF-2α), we used an antibody specific to phosphorylated eIF-2α [eIF-2(αP)] to study the regional and cellular distribution of eIF-2(αP) in normal, ischemic, and reperfused rat brains. Western blots of brain postmitochondrial supernatants revealed that ~1% of all eIF-2α is phosphorylated in controls, eIF-2(αP) is not reduced by up to 30 minutes of ischemia, and eIF-2(αP) is increased ~20-fold after 10 and 90 minutes of reperfusion. Immunohistochemistry shows localization of eIF-2(αP) to astrocytes in normal brains, a massive increase in eIF-2(αP) in the cytoplasm of neurons within the first 10 minutes of reperfusion, accumulation of eIF-2(αP) in the nuclei of selectively vulnerable neurons after 1 hour of reperfusion, and morphology suggesting pyknosis or apoptosis in neuronal nuclei that continue to display eIF-2(αP) after 4 hours of reperfusion. These observations, together with the fact that eIF-2(αP) inhibits translation initiation, make a compelling case that eIF-2(αP) is responsible for reperfusion-induced inhibition of protein synthesis in vulnerable neurons.
Keywords
Neurons of the CA1 and hilar regions of the hippocampus and layers III, V, and VI of the cerebral cortex have been deemed “selectively vulnerable” because of their inordinate sensitivity to transient ischemia. Morphologic studies have shown that disaggregation of polyribosomes, a hallmark of translation initiation inhibition (van Venrooij et al., 1972), is among the earliest changes during reperfusion in these regions (Jenkins et al., 1981). Furthermore, biochemical studies of protein synthesis during reperfusion (Hossmann and Kleihues, 1973; Cooper et al., 1977; Dienel et al., 1980; Bodsch et al., 1985, 1986; Yoshidomi et al., 1989; Widmann et al., 1991; DeGracia et al., 1996) support the contention that its suppression is an early event (Nowak et al., 1985; Araki et al., 1990), and its restoration may play an important role in neuronal survival after transient ischemia (Thilmann et al., 1986). It is now generally accepted that this depression of protein synthesis is a result of inhibition of translation initiation (Krause and Tiffany, 1993).
Formation of the translation-initiation complex requires the coordinated assembly of the ribosomal subunits, the mRNA to be translated, and the tRNA coding for the first amino acid (methionine in eukaryotic cells); this process is orchestrated by a family of proteins collectively known as eukaryotic initiation factors (eIF) (Merrick, 1992). Rates of global protein synthesis are regulated by altering the phosphorylation state of eIF-2, which introduces the initiator methionyl-tRNA into the translation-initiation complex (Redpath and Proud, 1994). Phosphorylation of serine 51 on the α-subunit of eIF-2 [eIF-2(αP)] generates a competitive inhibitor of eukaryotic initiation factor 2B and thereby prevents the replenishment of GTP onto eIF-2, which is necessary for each round of translation initiation (Rowlands et al., 1988). In several systems, increased eIF-2(αP) results in decreased protein synthesis (Pain, 1996), and studies from our laboratory (DeGracia et al., 1996) and from Burda et al. (1994) reported enhanced phosphorylation of eIF-2α in brain homogenates obtained after reperfusion. In the present study, we have developed an antibody to serine-51-phosphorylated eIF-2α and used this antibody to characterize the effects of ischemia and reperfusion on eIF-2(αP) in brain homogenates and to localize eIF-2(αP) in perfusion-fixed brain sections from normal, ischemic, and reperfused brains.
MATERIALS AND METHODS
Antibody preparation and characterization
Polyclonal antibody against eIF-2(αP) was generated (Research Genetics, Huntsville, AL) in New Zealand White rabbits using the synthetic phosphorylated (bold) peptide ILLSELSRRRIRS conjugated to keyhole limpet hemocyanin. This sequence corresponds to amino acids 45 to 57 and is perfectly conserved around the phosphorylation site in human, Drosophila, and Saccharomyces cerevisiae eIF-2α (Qu and Cavener, 1994). The antisera was affinity purified against column-bound phosphorylated peptide and eluted using a pH gradient. The eluant was then passed through the nonphosphorylated peptide column and the flow-through, depleted of cross-reacting antibodies, was collected. Purified unphosphorylated eIF-2 and a monoclonal antibody against eIF-2α that recognizes both the phosphorylated and unphosphorylated forms were generous gifts from Susan Oldfield (University of Bristol, Bristol, U.K.). Partially purified eIF-2α kinase (heme-controlled repressor, HCR) was a generous gift from Scot Kimball (Pennsylvania State University, Hershey, PA, U.S.A.). All other chemicals were reagent grade.
The selectivity of our antibody for eIF-2(αP) was determined by immunoreactivity toward phosphorylated and unphosphorylated eIF-2α on sodium dodecyl sulfate–polyacrylamide gel electrophoresis (SDS-PAGE) and isoelectric focusing-PAGE (IEF). We used HCR and γ-32P-ATP to phosphorylate purified eIF-2 at Ser51 on the α-subunit by the method of Kimball et al. (1991). Reactions (25 μL) contained 8 μg of eIF-2 in a buffer of 2 mmol/L magnesium acetate, 5 mmol/L dithiothreitol, 300 mmol/L KCl, 50 mmol/L N-[2-hydroxyethyl]piperazine-N′-[2-ethanesulfonic acid] (HEPES, pH 7.45) and 44 μmol/L labeled ATP (specific activity 40 dpm/fmol). The reaction was initiated by adding 2 μL HCR and incubated at 37°C for 35 minutes; control reactions omitted HCR. Incorporation was confirmed as trichloroacetic acid precipitable radioactivity on fiberglass filters. Reaction aliquots containing either 100 or 10 ng of labeled and unlabeled eIF-2α were electrophoresed on a 12.5% SDS-polyacrylamide gel. The proteins were transferred to nitrocellulose (0.45 μm), and the membrane was fixed, dried, and autoradiographed (5-day exposure). This membrane was then immunoblotted with anti-eIF-2(αP), stripped (100 mmol/L 2-mercaptoethanol, 2% SDS, 62.5 mmol/L Tris-HCl, pH 6.7), and reprobed with anti-eIF-2α (3-minute exposure).
Antibody specificity was determined by examining brain postmitochondrial supernatants (PMS) to see whether the antibody identified a single band after SDS-PAGE and immunoblotting (described below) and whether the reperfusion-induced shift in IEF-PAGE migration of eIF-2α (Burda et al., 1994; DeGracia et al., 1996) was caused by its phosphorylation on Ser51. Isoelectric focusing gels (3% T, 0.013% C) containing 2% 3-[(3-cholamidopropyl)dimethylammonio]-1-propane-sulfonate (CHAPS), 9 mol/L urea, and 7.5% ampholines (pH 4.0 to 6.5, Sigma Chemical Co., St. Louis, MO, U.S.A.) were prepared and prefocused at 200 V (constant voltage) for 20 minutes, 300 V for 20 minutes, and 400 V for 20 minutes with 0.01 mol/L glutamic acid as the anode buffer and 0.05 mol/L histidine as the cathode buffer (Maurides et al., 1989). After prefocusing, the wells were thoroughly washed with distilled water and the tank buffers were replenished. Samples (25 μg protein) in a loading buffer of 9 mol/L urea, 3% ampholines, and 5% CHAPS were run beginning at 500 V with a 50-V increase every 30 minutes to 750 V and then a final step to 1,000 V for an additional 30 minutes. Proteins were transferred to nitrocellulose, and the membranes were fixed and immunoblotted as described above.
Animal Model
All animal experiments were approved by our institutional review board and were conducted following the “Principles of Laboratory Animal Care” (NIH publication No. 86-23, revised 1985). Male Long Evans rats weighing 425 to 500 g were anesthetized with ketamine and xylazine, and catheters were placed for vascular access. Animals were monitored for arterial pressure, ECG, and core temperature, and subjected to complete global brain ischemia and reperfusion by cardiac arrest and resuscitation with intensive care after arrest as previously described (DeGracia et al., 1996).
Immunoblotting of brain PMS
For Western analysis, the forebrains were washed briefly in the homogenization buffer (20 mmol/L Tris, pH 7.6, 0.2 mmol/L sucrose, 1 mmol/L dithiothreitol, 5 mmol/L magnesium acetate, 50 mmol/L KCl, 1 mmol/L ethylenediaminetetraacetic acid (EDTA), 2 mmol/L ethylene glycol-bis(β-aminoethyl ether) N,N,N′,N′-tetraacetic acid (EGTA), 100 mmol/L NaF, 7 μg/mL pepstatin A, 1 μg/mL aprotinin, and 10 μg/mL leupeptin) and homogenized in a hand-held Dounce homogenizer with five volumes of ice-cold buffer. The homogenate was centrifuged at 17,000g for 10 minutes at 4°C, and after an aliquot was taken for protein determination by the Folin phenol reagent method, the supernatant was rapidly frozen on dry ice and ethanol and stored at −80°C. Samples containing 50 μg protein were added to an equal volume of 2× SDS-PAGE loading buffer, boiled for 2 minutes, electrophoresed on 12.5% T SDS-polyacrylamide gels, and transferred electrophoretically to nitrocellulose. The membranes were fixed in 25% isopropanol and 12.5% acetic acid for 20 minutes, rinsed, and blocked in 5% nonfat milk in TTBS (100 mmol/L Tris, pH 7.4, 154 mmol/L NaCl, and 1% Tween-20) for 1 hour at room temperature. After the membranes were incubated for an additional hour at room temperature with the primary antibody (1:1,000, rabbit anti-eIF-2(αP) or 1:200 mouse anti-eIF-2α), they were washed in TTBS and incubated for 30 minutes at room temperature with a 1:10,000 dilution of the appropriate secondary antibody (donkey anti–rabbit or sheep anti–mouse IgG in 4% donkey or sheep serum, respectively). Immunoreactive bands were detected by enhanced chemiluminescence (Amersham, Arlington Heights, IL, U.S.A.), and relative band densities were quantified by densitometry. Exposure times were adjusted to ensure linearity. Where appropriate, groups were compared by analysis of variance and Scheffé post hoc analysis.
Immunohistochemistry
Animals used for the immunohistochemical studies (2 to 4 in each group) were perfused transcardially with 50 mL 0.9% NaCl containing 10 μmol/L okadaic acid (to inhibit serine phosphatases [Cohen et al., 1989]) followed by 250 mL fixative containing 50% methanol and 10% glacial acetic acid. Brains were removed and immersed in the same fixative overnight at 4°C. The next day frontal sections, 35 μm in thickness, were prepared with a vibratome and collected in 0.1 mol/L phosphate-buffered saline (PBS, 140 mmol/L NaCl, 3 mmol/L KCl, 8 mmol/L Na2HPO4, and 2 mmol/L KH2PO4, pH 7.4). Immunostaining was performed using the avidin-biotinylated-peroxidase complex kit (Vector Laboratories, Burlingame, CA, U.S.A.). Single sections were treated with 3% hydrogen peroxide for 5 minutes, washed 3 times in PBS, permeabilized in 0.1% Triton X-100 for 15 minutes, washed 3 times in PBS, preblocked in 10% goat serum for 30 minutes, and incubated overnight at 4°C in anti-eIF-2(αP) diluted 1:100 in PBS. Concurrent controls were performed on adjacent sections with the primary antibody preblocked with the antigenic peptide (55 nmol/L). The next day sections were washed 3 times in PBS and then incubated 30 minutes in the avidin-biotinylated-peroxidase complex goat anti–rabbit IgG diluted 1:200 in 0.15% goat serum and PBS. Immunoreactivity was detected using a solution of PBS buffer containing 0.03% hydrogen peroxide and 0.01% diaminobenzidine. The reaction was terminated after 4 minutes by washing three times with distilled water, and glycerol was used to mount sections and coverslips on glass slides. Photomicrographs of immunostaining were obtained using ×6, ×40, and ×100 oil immersion objective lenses and were printed at final magnifications of ×8, ×650, and × 1,250. Representative results are shown in the figures.
RESULTS
Characterization of the eIF-2(αP) antibody
The selectivity of our anti-eIF-2(αP) was first examined on Western blots of native eIF-2α and of eIF-2α after in vitro phosphorylation (Fig. 1). The autoradiogram of this membrane (Fig. 1A) shows that eIF-2α was phosphorylated only in the presence of HCR (lanes 1 and 2). Immunoblotting with the antibody that recognizes both phosphorylated and unphosphorylated eIF-2α showed that both forms were present on this membrane (Fig. 1B). Our antibody, raised against a synthetic peptide corresponding to the phosphorylated Ser51 site of the α-subunit of eIF-2, recognized only eIF-2(αP) (Fig 1C, lanes 1 and 2).
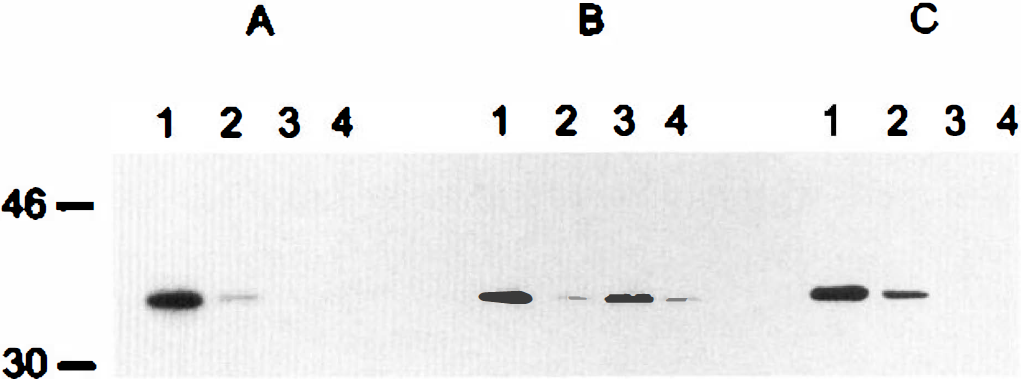
Selectivity of the eIF-2(αP) antibody. Lanes 1 and 2 were loaded with 100 ng and 10 ng of eIF-2α phosphorylated by reaction with heme-controlled repressor (HCR) and [γ-32P]-ATP, and lanes 3 and 4 were loaded with 100 ng and 10 ng unphosphorylated eIF-2α. After electrophoresis on a 12.5% SDS-polyacrylamide gel and transfer of proteins to nitrocellulose, the membrane was fixed, dried, and an autoradiogram prepared (
The specificity of our anti-eIF-2(αP) was examined on Western blots of brain PMS subjected to IEF-PAGE and SDS-PAGE (Fig. 2). As we have previously reported (DeGracia et al., 1996), after IEF-PAGE of normal and 90-minute reperfused brain PMS, an immunoblot with the non–phosphorylation-specific anti-eIF-2α shows the presence of a doublet in all of the reperfused samples (Fig. 2A-1), with the new upper band displaced toward more acidic pH. There was no change in total eIF-2 between the two groups. When this membrane was reprobed with the antibody specific to eIF-2(αP) (Fig. 2A-2), only the upper band of the eIF-2α signal was recognized. This result shows that the upper band seen in the reperfused samples is eIF-2α that has been phosphorylated on Ser51. Furthermore, examination of normal and reperfused brain PMS by SDS-PAGE and immunoblotting with our anti-eIF-2(αP) shows only one band migrating at 36 kDa (Fig. 2B). The intensity of this band is greatly enhanced after reperfusion (Fig. 2B-1), and its signal is ablated by preblocking the primary antibody with 55 nmol/L antigenic peptide (Fig. 2B-2).
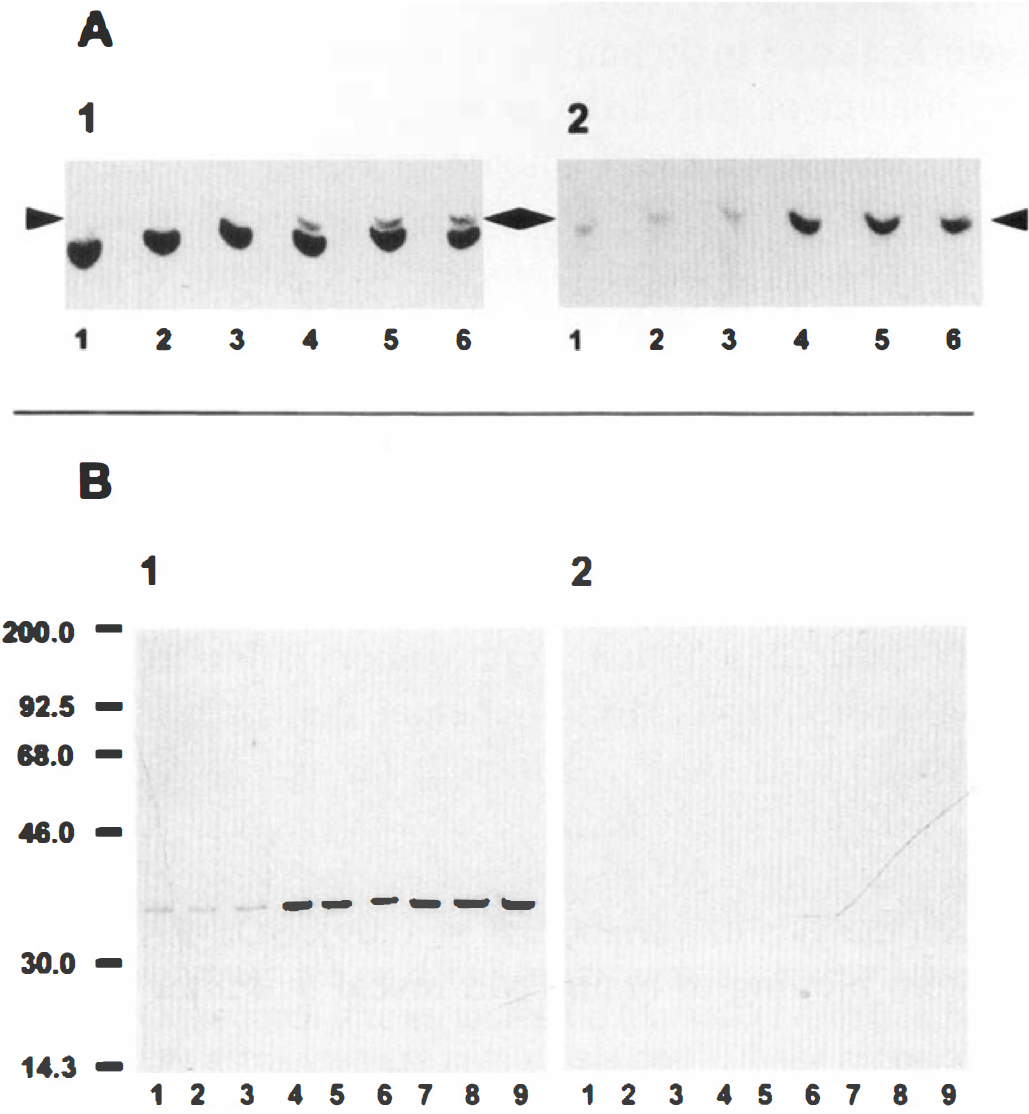
Western blot analysis of eIF-2α and eIF-2(αP) in normal and reperfused brains. (
The effect of ischemia and reperfusion on eIF-2(αP) in brain PMS
We used SDS-PAGE and Western blots to examine the effects of 3 to 30 minutes of global brain ischemia on the content of eIF-2(αP) in brain PMS. Our anti-eIF-2(αP) revealed a small amount of eIF-2(αP) in normal brain PMS (Fig. 2A-2, lanes 1–3) that was not detected by the non–phosphorylation-specific antibody (Fig. 2A-1). Densitometry shows that after 90 minutes of reperfusion eIF-2(αP) accounts for 24% ± 3% of eIF-2α (Fig. 2A-1) and is increased 23-fold over eIF-2(αP) seen in normal brain PMS (Fig. 2A-2). Therefore we estimate that eIF-2(αP) is normally about 1% of the total brain PMS eIF-2α.
We anticipated that dephosphorylation reactions would predominate during ischemia, thereby leading to a decrease in eIF-2(αP). Although the data suggest that eIF-2(αP) levels may increase between 3 and 7.5 minutes of ischemia (Fig. 3), this did not reach statistical significance (analysis of variance, P = 0.09). SDS-PAGE and Western blotting of brain PMS reveal that after only 10 minutes of reperfusion, eIF-2(αP) is increased 19-fold over normal (Fig. 2B-1), and after 90 minutes of reperfusion the 23-fold increase in eIF-2(αP) is in excellent agreement with the 24-fold increase observed with IEF-PAGE.
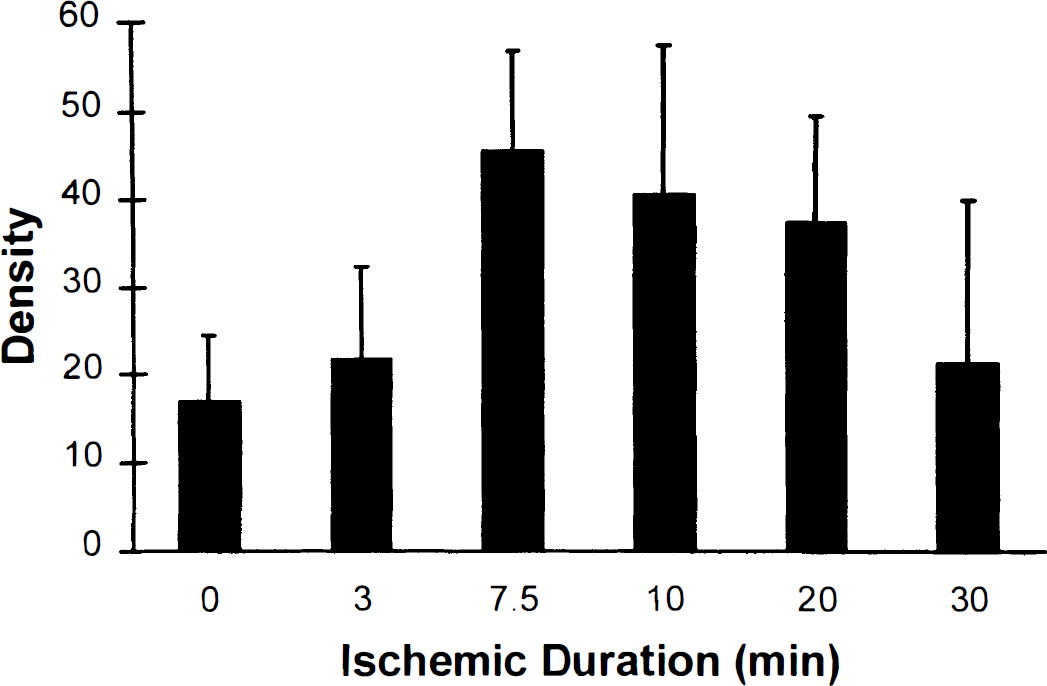
The effect of brain ischemia on eIF-2(αP). Rats were subjected to various durations of cardiac arrest (3 animals at each time point). Postmitochondrial supernatants (50 μg protein) were electrophoresed on a 12.5% SDS-polyacrylamide gel. After the proteins were transferred to nitrocellulose, the membrane was immunoblotted with anti-eIF-2(αP). Signal density is shown as mean ± SD. The data suggests there may be a transient increase in phosphorylated eIF-2α during ischemia (analysis of variance, P = 0.09). We observed no loss of eIF-2(αP) during ischemia.
Localization of eIF-2(αP) in normal, ischemic, and reperfused rat brain
The specificity of our antibody, as demonstrated above, allowed us to map eIF-2(αP) in normal, ischemic, and reperfused brain sections.
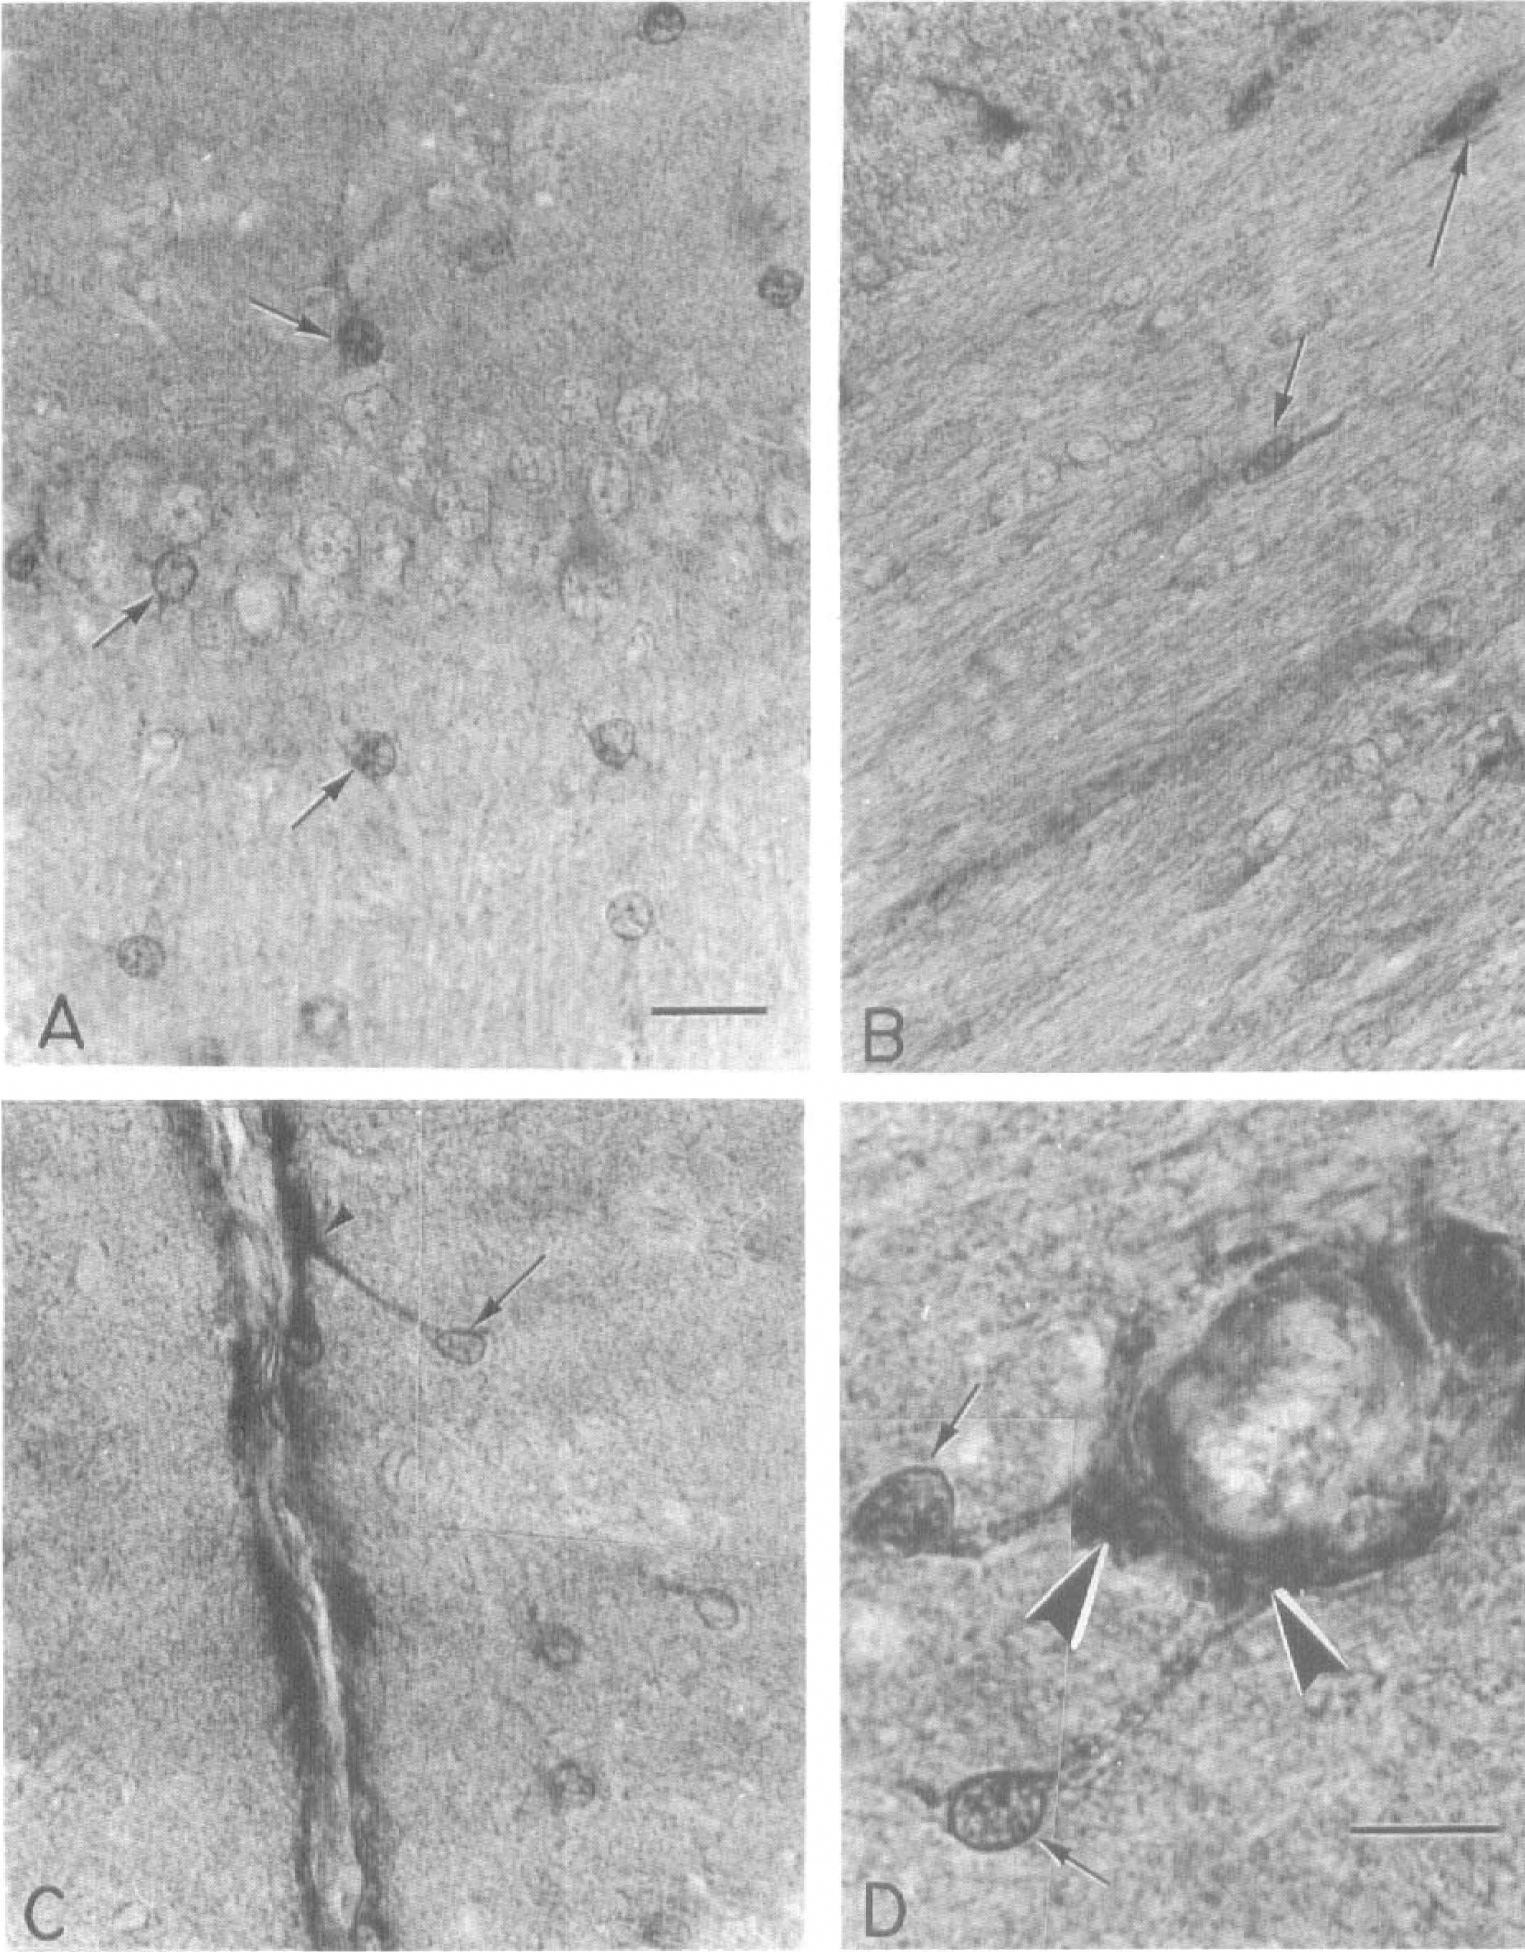
Nonischemic controls. In frontal sections of nonischemic brains, eIF-2(αP) is localized exclusively in astrocytes in all of the brain areas examined, including those in cerebral cortex, hippocampus, striatum, and diencephalon, as well as those in the white matter (Fig. 4A). At higher power the nucleus of astrocytes is strongly immunolabeled whereas the cytoplasm contains enough label to reveal the branching pattern of the processes (Fig. 5A). Astroglial staining is particularly evident within the large tracts of white matter, such as in the corpus callosum, in which labeled astrocytes stand out readily from the rows of unlabeled oligodendrocytes and the bundles of nerve fibers (Fig. 5B). Recognition of the labeled cells as astrocytes is further confirmed by identification of their processes forming the sheaths that serve to isolate the neuronal compartment. For example, in some instances, immunolabeled astroglial processes (Fig. 5C) can be followed to the outer glial limitans on the surface of the hemisphere (Fig. 5C, arrowhead), which is most likely stained from the accumulation of overlapping astroglial processes. Similarly, the perivascular glial sheath that surrounds blood vessels shows enhanced immunostaining. Thus at high-power magnification, some labeled astrocytic processes are followed from the cell body to their termination as broad foot plates (i.e., endfeet) that appose to the outer perimeter of the blood vessel wall (Fig. 5D).
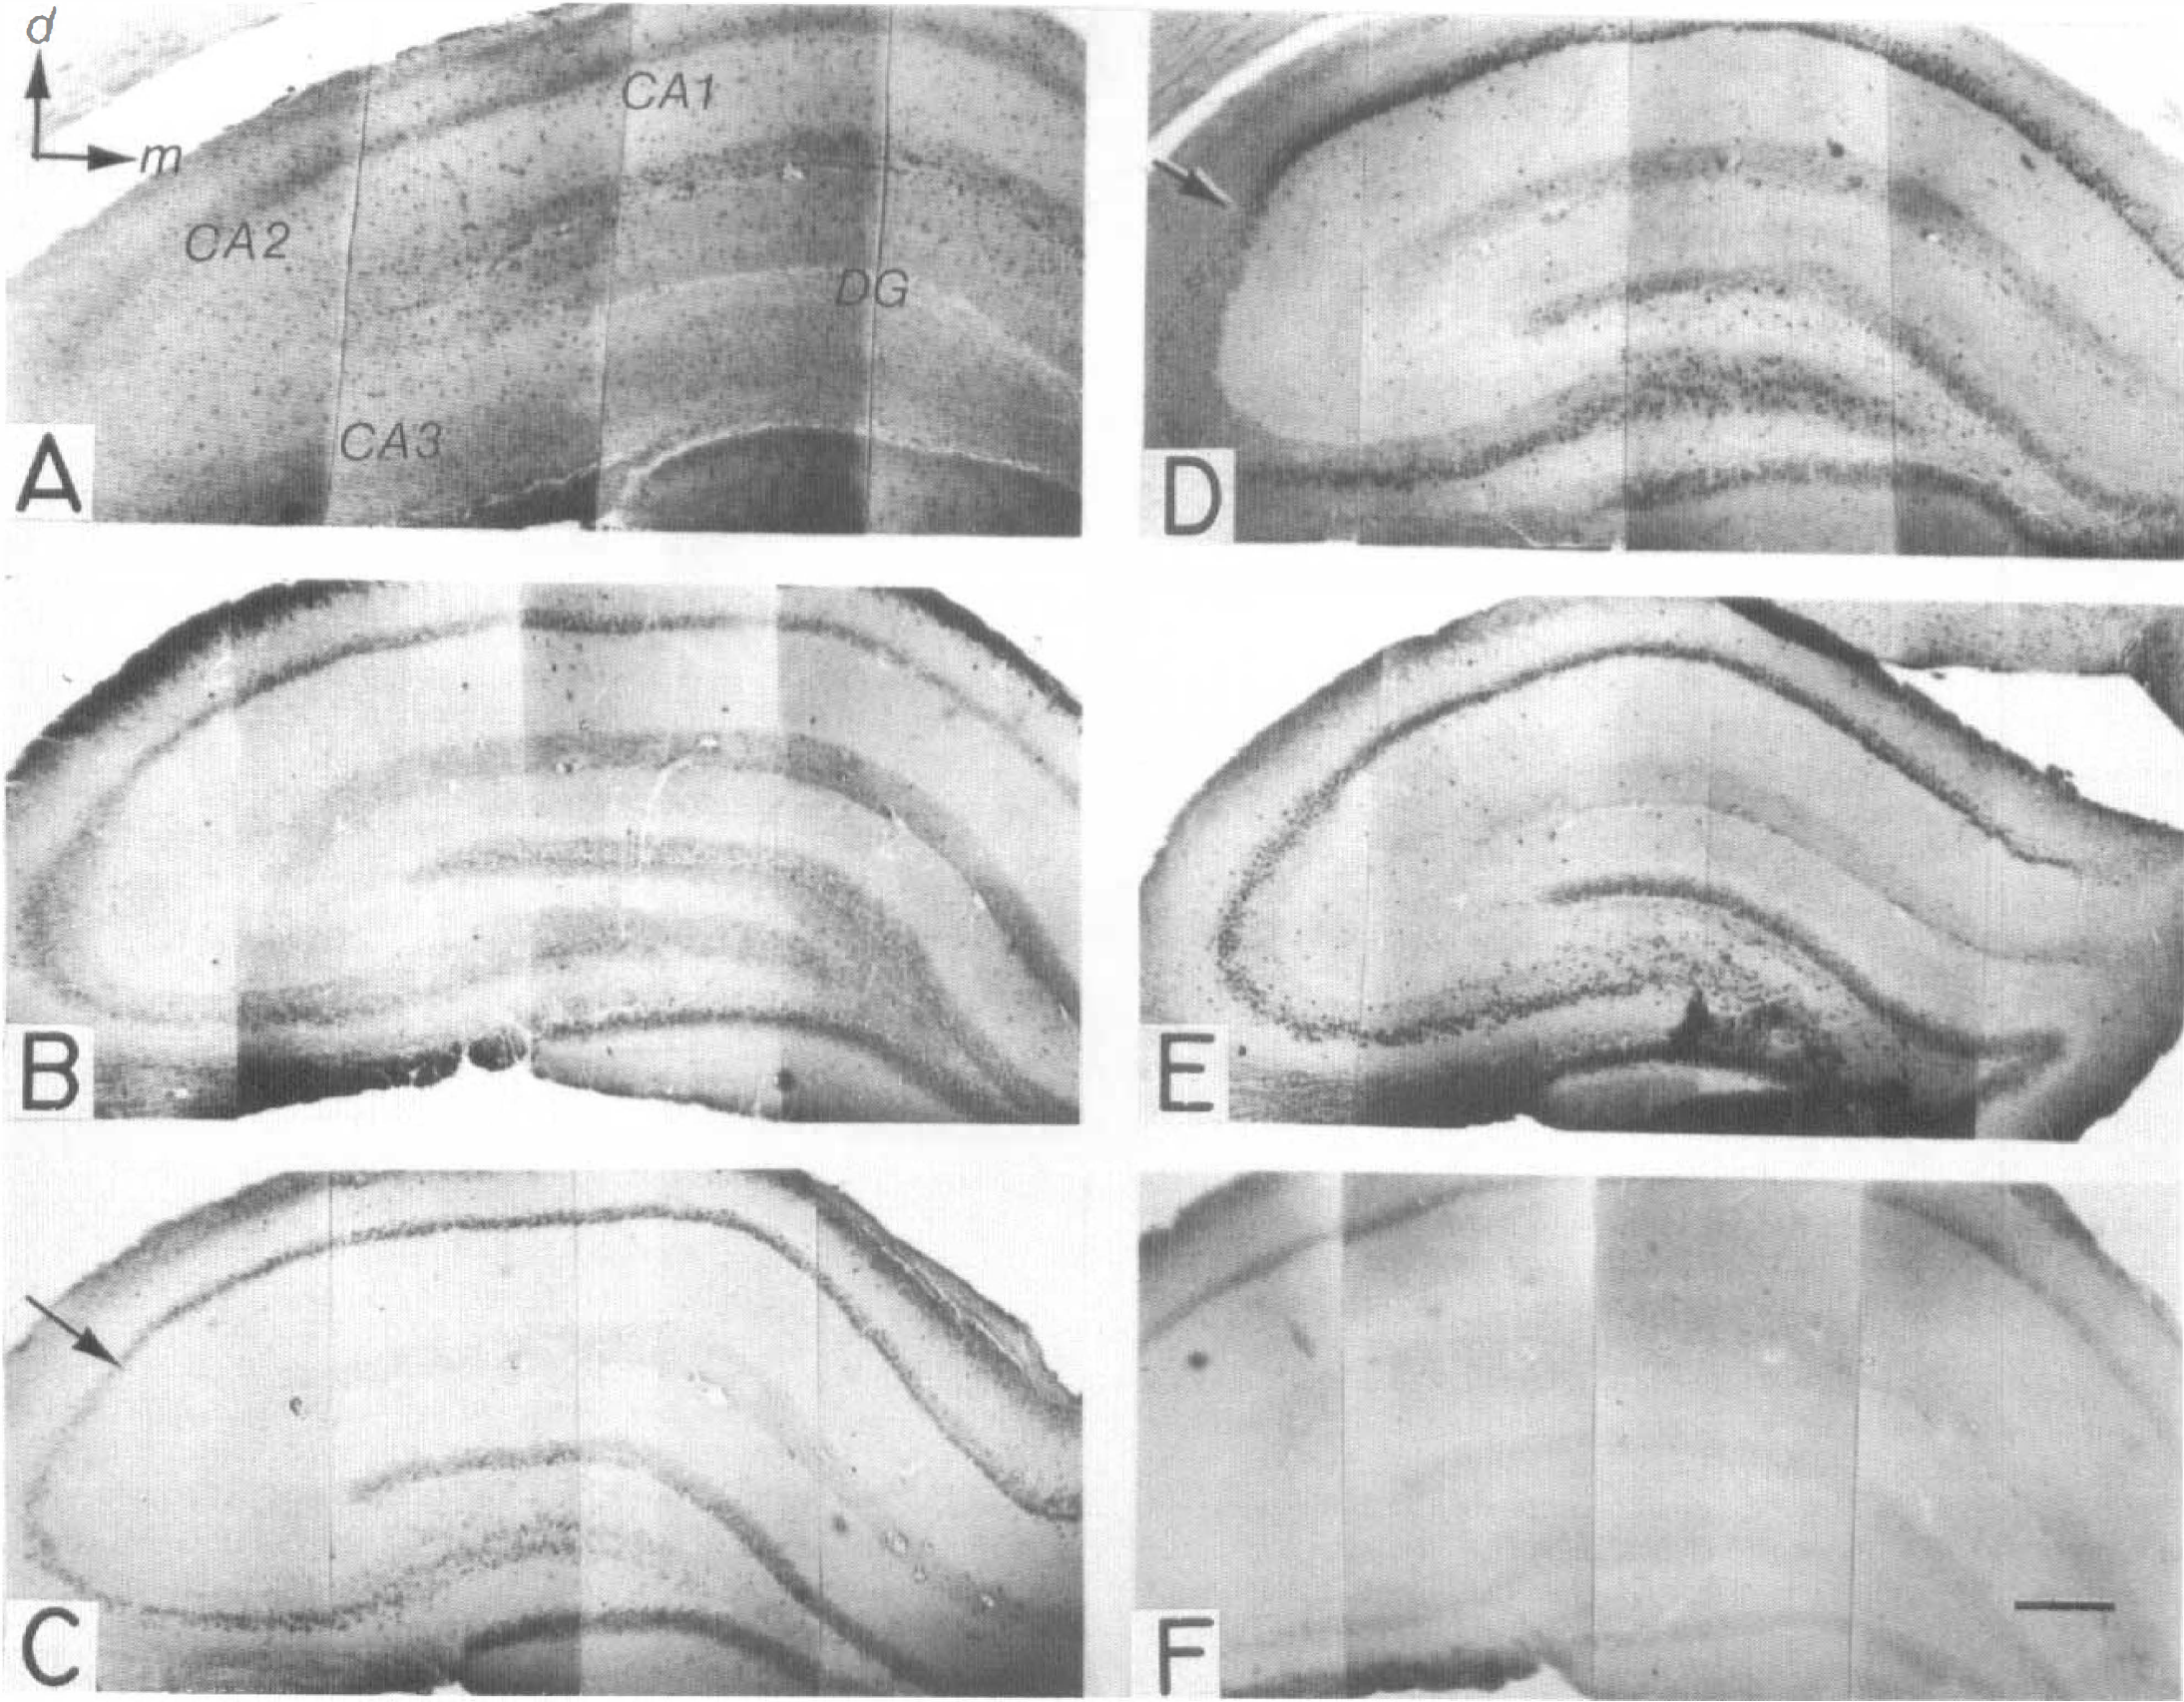
(A through F) Low-power photomicrographic montages of frontal sections through the rat dorsal hippocampus immunostained for eIF-2(αP). Magnification for all panels is indicated by the 1-mm scale bar in
Photomicrographs (
Tissue after 10 minutes of ischemia. In frontal sections of brains subjected only to 10 minutes ischemia, there is weak immunolabeling for eIF-2(αP) throughout the cell layers of the CA fields and the dentate gyrus (Fig. 4B). Higher power objectives reveal weak, homogeneous staining that is restricted to the cytoplasm of neurons in the pyramidal cell layers of CA1 to CA3 as well as to that of granule cells in the dentate gyrus. In contrast the nuclei of these cells and all types of glia are unstained. This staining differs from the granular or punctate staining seen in reperfused brains (see below) and could represent eIF-2(αP) that may have been formed using residual ATP during the ischemic insult.
Tissue after 10 minutes of ischemic and 10 minutes of reperfusion. After 10 minutes of cardiac arrest and 10 minutes of reperfusion, the bulk of eIF-2(αP) labeling is found in the cytoplasm of selectively vulnerable neurons in the CA1 and CA3 hippocampal fields. In contrast the nuclei of the same neurons show no immunolabeling. Astroglia show little labeling whereas other types of glia lack labeling altogether. In the dorsal hippocampus strong labeling occurs in the perikaryon of most pyramidal neurons in the CA1 field (Fig. 6A) and in some neurons in the stratum oriens (Fig. 6A, arrow). Some labeled cell bodies in the strata oriens, radiatum, lacunosum, and moleculare suggest that varieties of hippocampal interneurons may be affected by the same sequelae affecting the pyramidal neurons after ischemia-reperfusion. A more complex labeling pattern exists among the granule cells of the dentate gyrus in which some perikarya are strongly immunolabeled and many others are weakly labeled or unlabeled (Fig. 6B). At higher power the CA1 pyramidal neurons exhibit punctate or granular staining in a perikaryal zone adjacent to the nuclear envelope (Fig. 6C, arrows). In addition, the label extends to the proximal processes, in particular in the area at the base of the apical dendrite. Although the CA2 field contains unlabeled neurons, CA3 has neurons with varying labeling intensities. When strong label is present in a CA3 neuron, it is associated with numerous dark granules with a pattern reminiscent of the fine Nissl substance (Fig. 6D, arrows). Hilar cells present a contrasting pattern in that some cells are strongly immunolabeled whereas others are unlabelled. Similar to the hippocampal neurons, immunostaining in the cerebral cortex is confined mostly to the perikaryal cytoplasm and to the proximal dendrites of pyramidal neurons. Labeled pyramidal neurons are found in layers III, V, and VI, with those in layer V being of the large and medium sizes (Fig. 6E). Labeling intensities vary among pyramidal neurons, including some faintly labeled cells (Fig. 6E, arrows) that are hard to distinguish from unlabeled neurons.
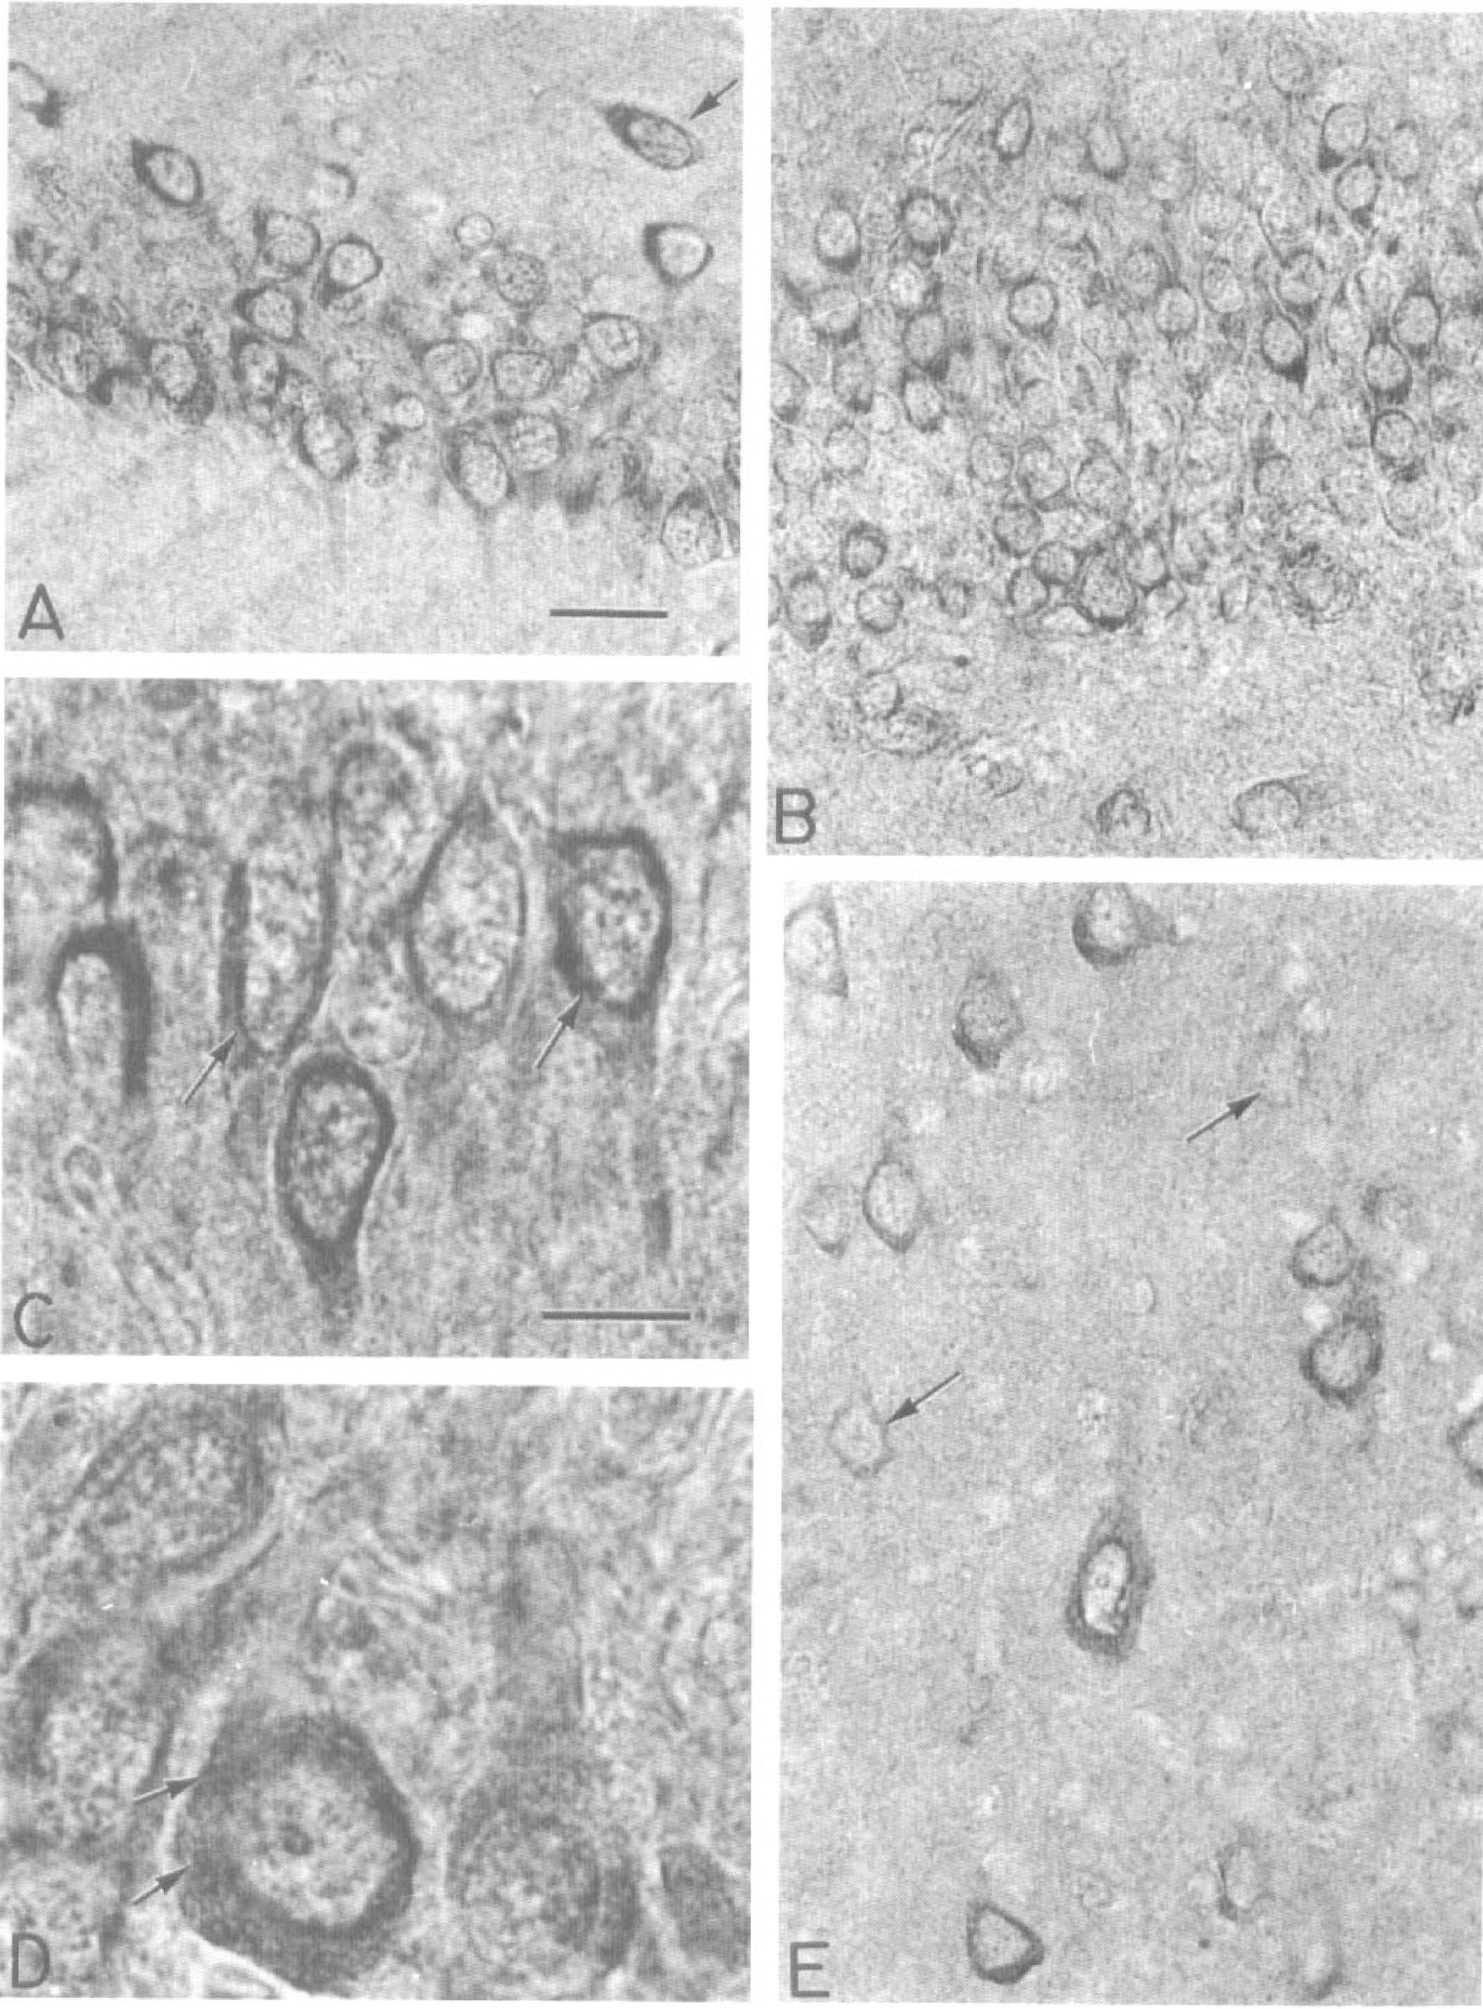
Photomicrographs (
Tissue after 10 minutes of ischemia and 1 hour of reperfusion. By 1 hour of reperfusion a different pattern of eIF-2(αP) emerges from that seen at 10 minutes of reperfusion. The label is visualized now in both the nucleus and cytoplasm of the selectively vulnerable neurons (Fig. 7a). Faint labeling occurs only in astroglia nuclei but not in the other glial types. In CA1 most neurons are strongly labeled in both the nucleus and cytoplasm although the boundaries of the perikaryon appear indistinct. At higher power the nuclear label in CA1 pyramids is associated mostly with the nuclear envelope and the heterochromatin (Fig. 7B, arrows). A few neurons (Fig. 7, large arrowhead), as well as oligodendroglia (Fig. 7, small arrowhead) in the same field are not labeled. In contrast to CA1 the majority of CA2 neurons remain unlabeled (Fig. 7, C), as are the granule cells of the dentate gyrus (Fig. 7, D). The contrasting pattern found in the hilus at 10 minutes of reperfusion is also maintained at 1 hour of reperfusion. It is possible to see in the same field some neurons strongly immunolabeled next to a cell with no label (Fig. 7E, large arrowhead). It should be noted that the nuclear chromatin in some of the strongly labeled hilar cells appears clumped at this time point. Among the neurons of the cerebral cortex many pyramidal cells in layers III, V, and VI remain labeled, but neighboring cells in the same layers often remain unlabeled.
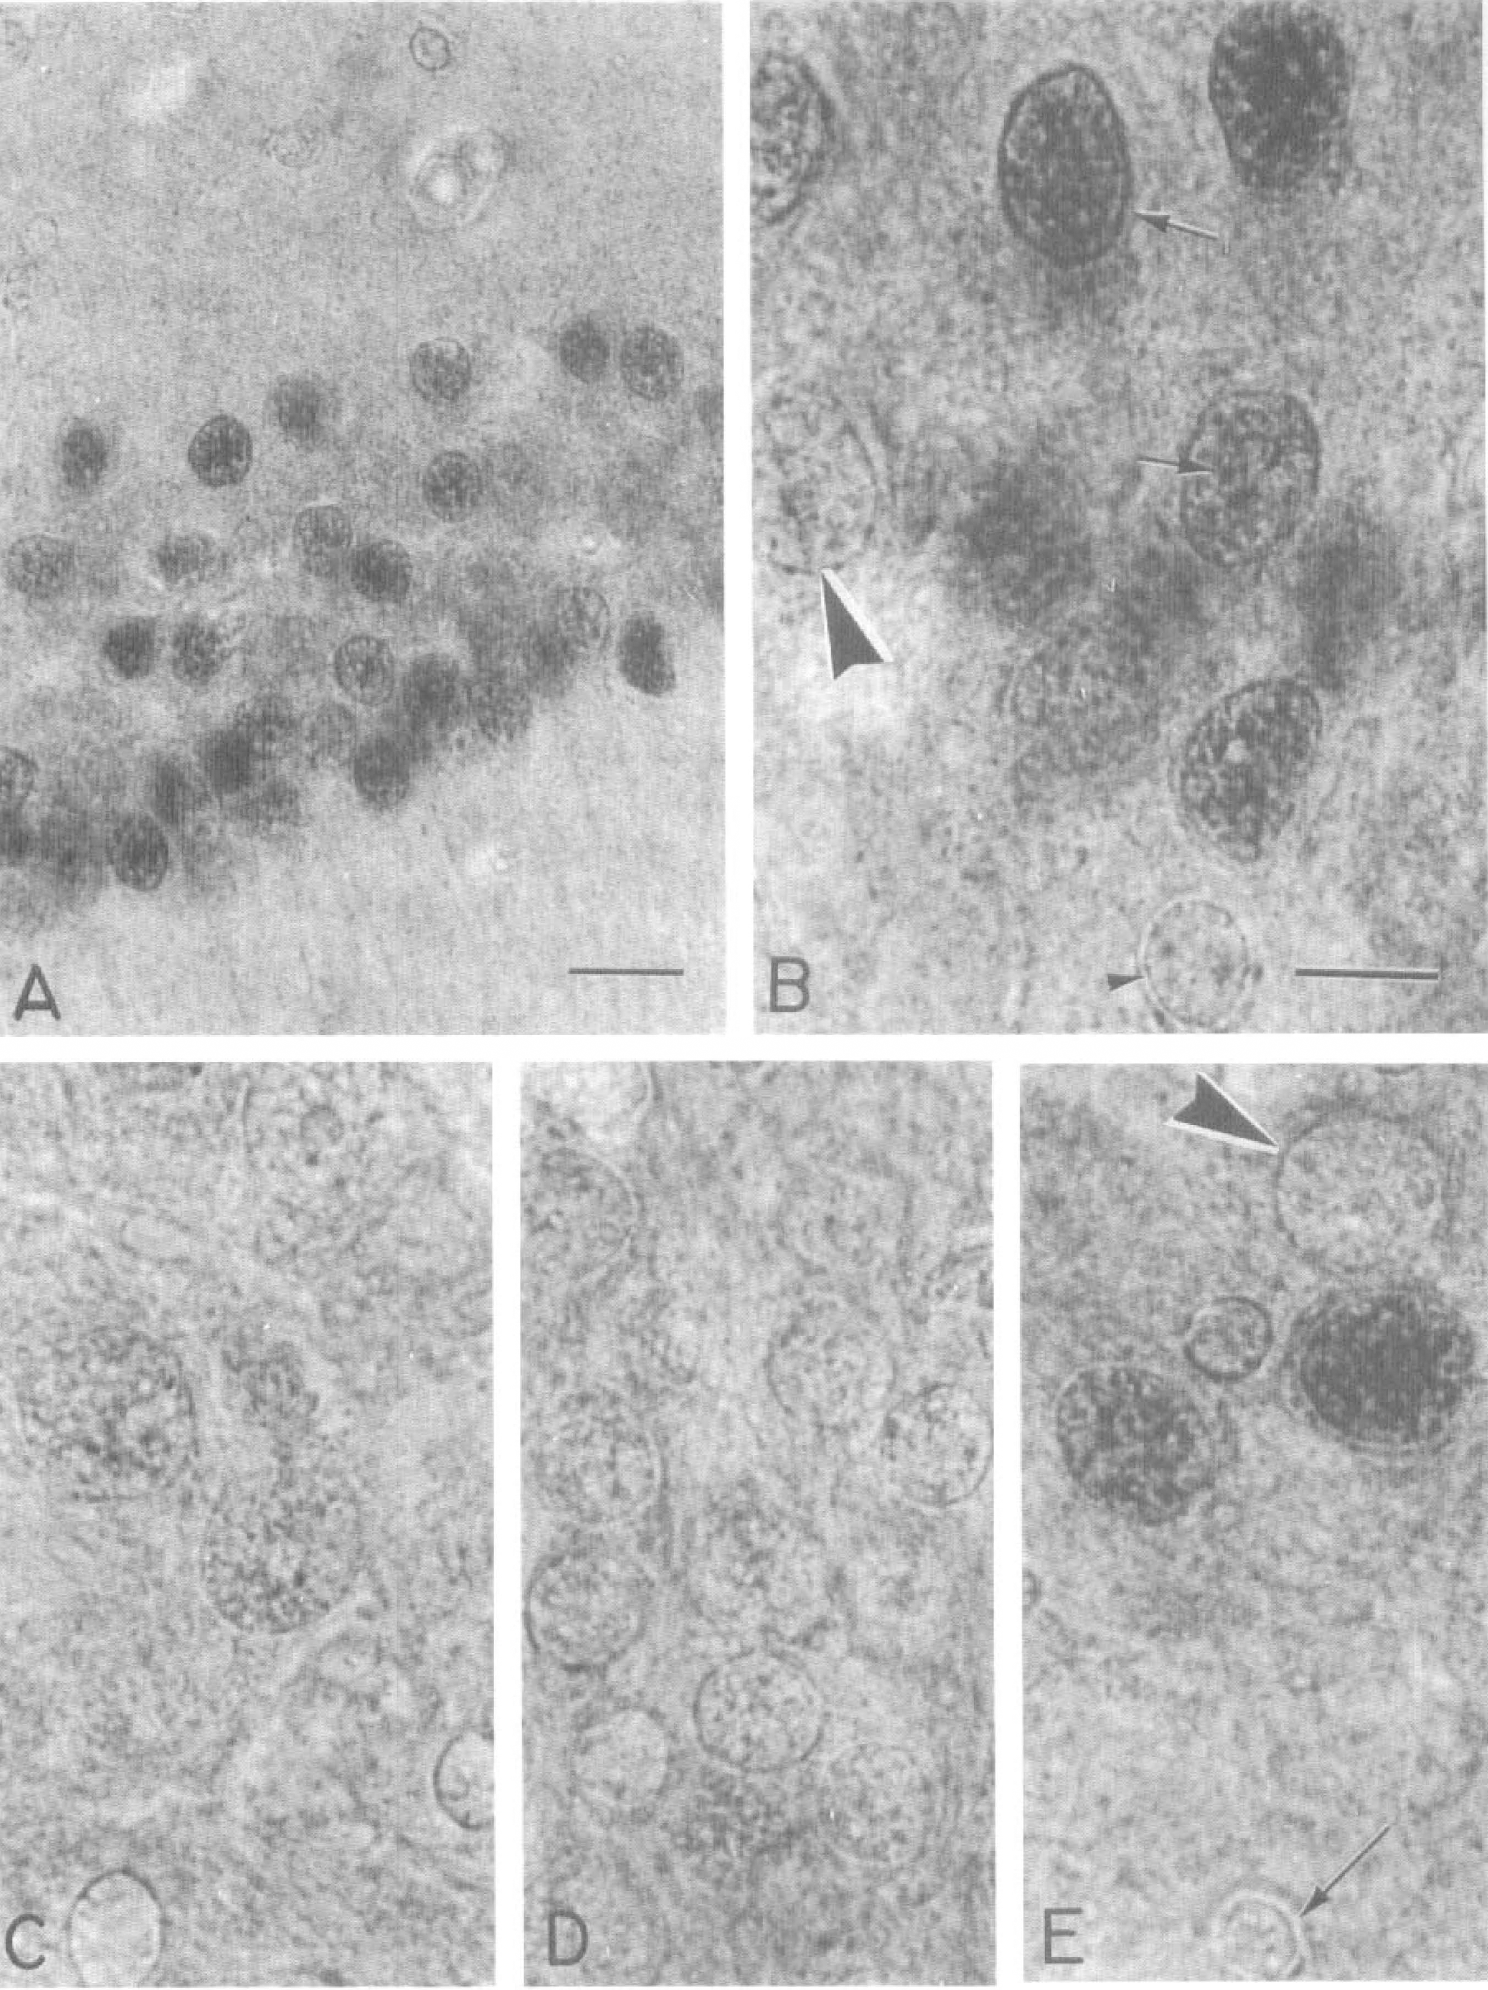
Photomicrographs (
Photomicrographs (
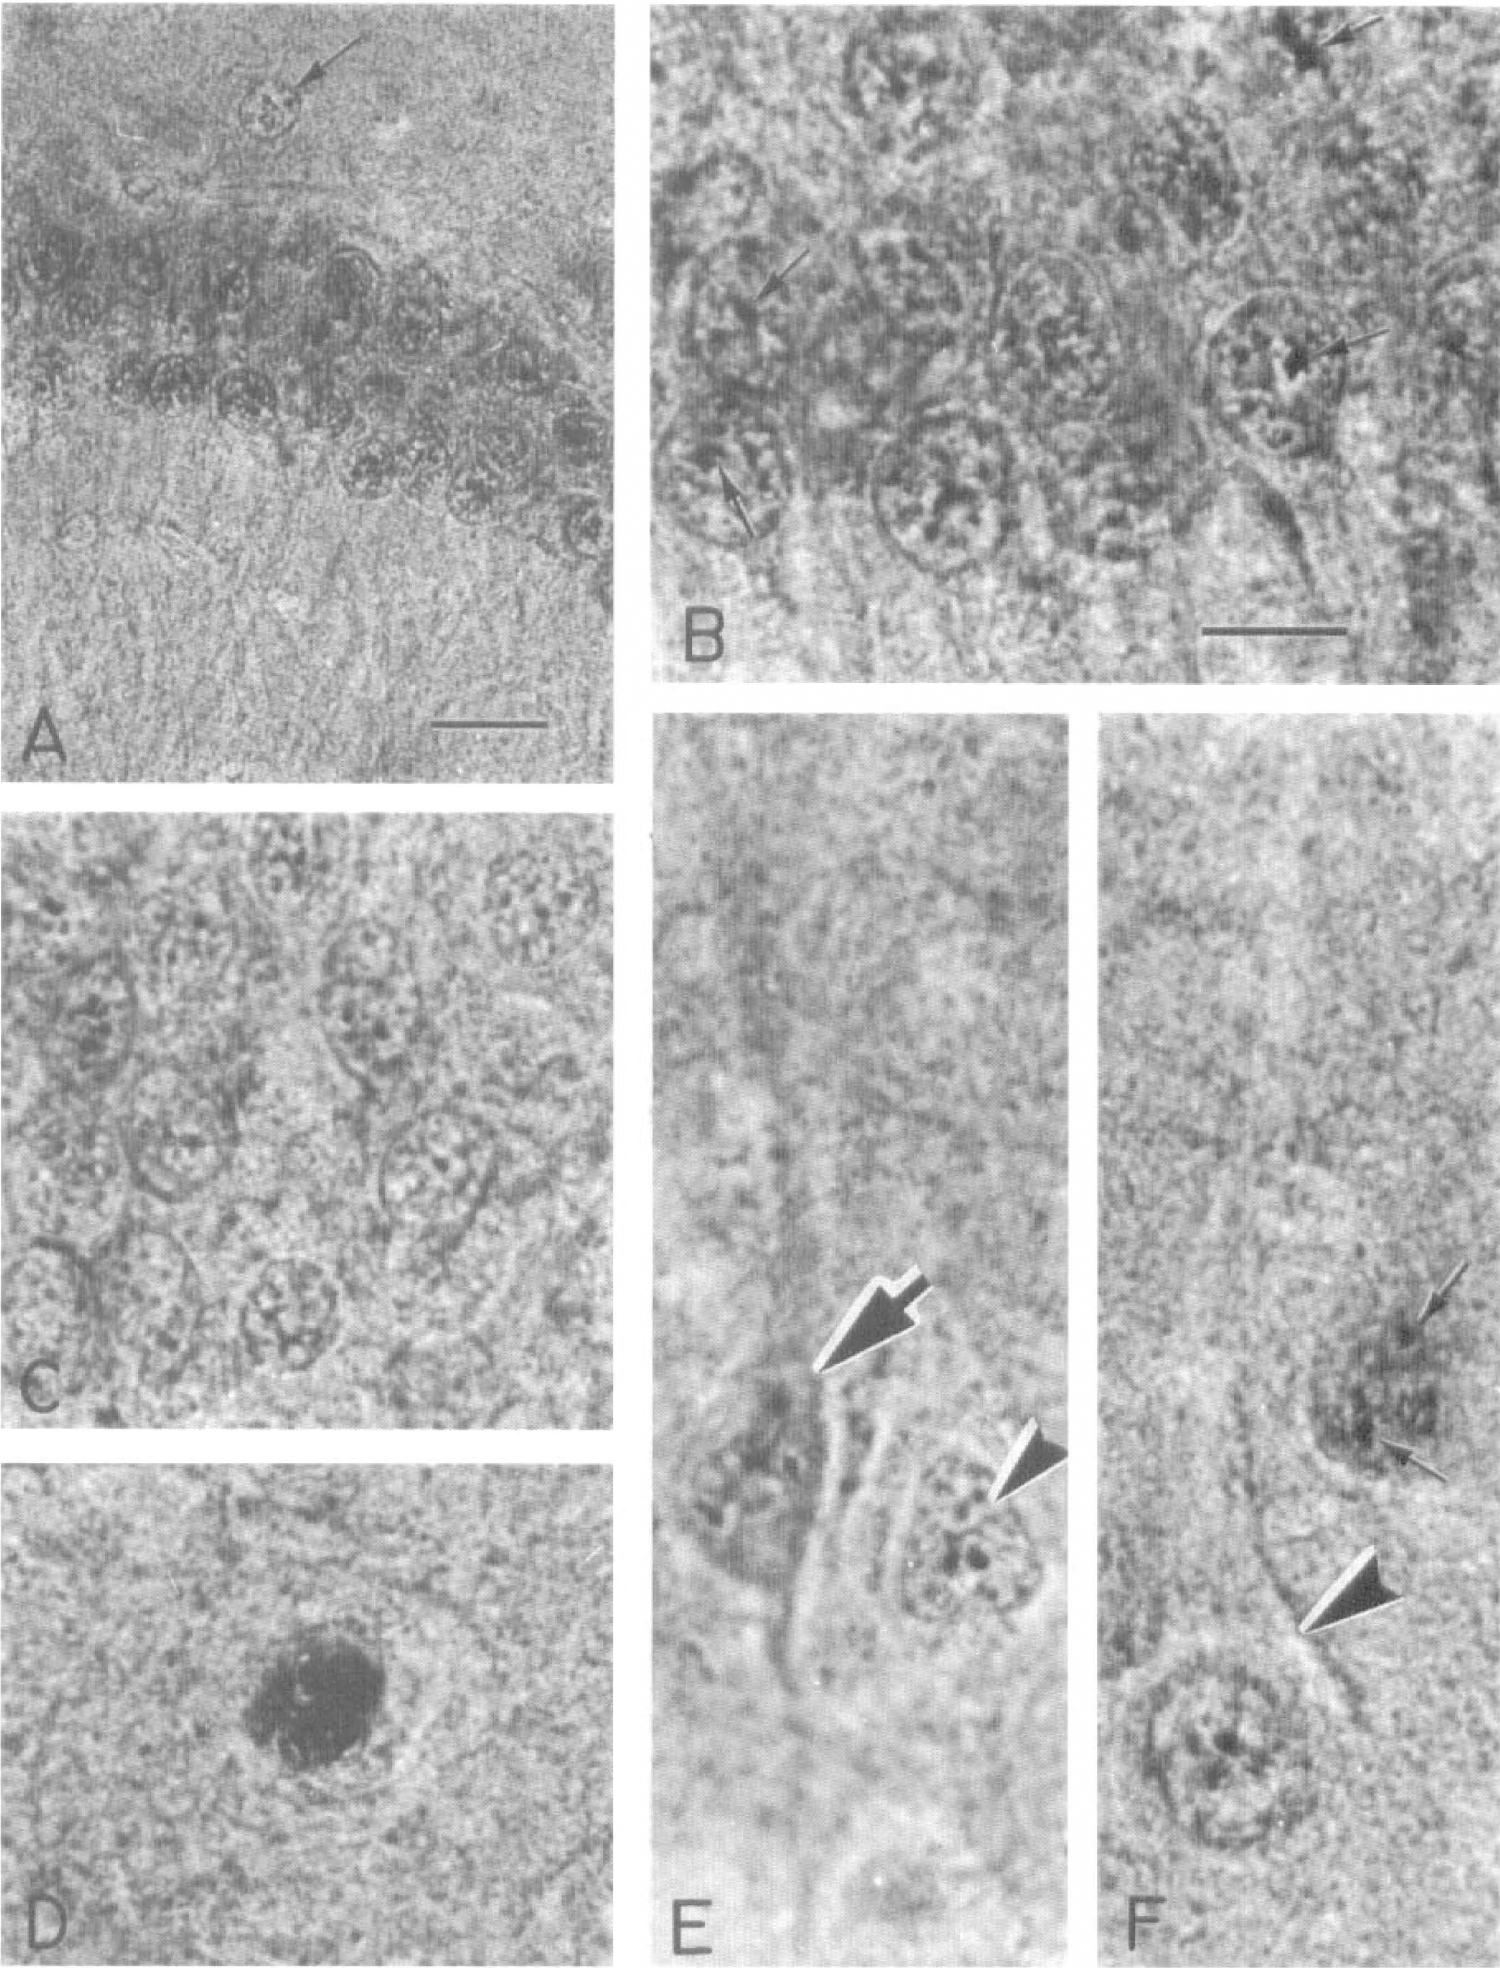
Tissue after 10 minutes of ischemia and 4 hours of reperfusion. By 4 hours of reperfusion most of the eIF-2(αP) label is confined to the nuclei of selectively vulnerable neurons of the same areas as above (Fig. 8). Thus the labeling at this time point is found among neurons in CA1, CA3, hilus, and layers III, V, and VI of the cerebral cortex. In contrast no immunostaining is found among the granule cells of the dentate gyrus. However high-power analysis of the nuclei of CA1 neurons at this time reveals that the heterochromatin has become coarse and seemingly condensed (Fig. 8B, arrows, compare also with Fig. 7B). A minor enhancement of the heterochromatin in granule cells of the dentate gyrus (Fig. 8C) and in cortical neurons (Fig. 8E, 8F) is also distinguished. Extreme condensation of the heterochromatin is found among cells of the hilus, giving the nucleus a pyknotic appearance (Fig. 8D). In addition, lightly labeled neurons in the cerebral cortex often lack their characteristic pyramidal shape and their overall volume appears diminished compared with that of unlabeled neighboring neurons (Figs. 8E, 8F). The apparent condensation of the nuclear heterochromatin of both the labeled cortical and CA1 neurons is suggestive of a state of pyknosis or an early stage of programmed cell death.
DISCUSSION
In this work we have shown (1) an antibody specific for serine-51-phosphorylated eIF-2α, (2) localization of eIF-2(αP) to astrocytes in normal brains, (3) a massive increase in eIF-2(αP) in the cytoplasm of neurons within the first 10 minutes of reperfusion, (4) accumulation of eIF-2(αP) in the nuclei of selectively vulnerable neurons after 1 hour of reperfusion, and (5) morphology suggesting pyknosis or apoptosis in neuronal nuclei that continue to display eIF-2(αP) after 4 hours of reperfusion. These observations, together with the fact that eIF-2(αP) inhibits translation initiation (Merrick, 1992), make a compelling case that eIF-2(αP) is responsible for reperfusion-induced inhibition of protein synthesis in vulnerable neurons (Thilmann et al., 1986). Furthermore, potential interrelations involving accumulation of eIF-2(αP) and apoptosis or pyknosis are suggested by the morphology of neurons that continue to exhibit eIF-2(αP) after 4 hours of reperfusion.
The temporal and spatial profiles of eIF-2(αP) closely follow the expected inverse relationship to postischemic brain protein synthesis reported by others. Thilmann et al. (1986) studied regional protein synthesis in autoradiograms of gerbil forebrains after 5 minutes of ischemia and 30, 90, 180, or 360 minutes of reperfusion. They found that protein synthesis was almost completely suppressed after 30 minutes of reperfusion in all areas of the forebrain, but with longer reperfusion, protein synthesis gradually recovered, except in the CA1. The most resistant areas (e.g., dentate gyrus) recovered first, and the more sensitive areas (e.g., hilus) recovered last. We found gradual reduction in cytoplasmic eIF-2(αP) at 60 minutes and 4 hours of reperfusion with the dentate gyrus showing the earliest recovery, but eIF-2(αP) remained elevated in CA1 after 4 hours of reperfusion.
We were surprised to note eIF-2(αP) immunostaining in nuclei of selectively vulnerable neurons after 1 and 4 hours of reperfusion. Although in very early reperfusion cytoplasmic eIF-2(αP) was seen in vulnerable as well as ischemia-resistant neurons, we never observed eIF-2(αP) in the nuclei of nonvulnerable neurons. To verify that the nuclear staining was not caused by a protein other than eIF-2(αP), we immunoblotted unfractionated forebrain homogenates from tissue after 1 hour of reperfusion with anti-eIF-2(αP) and again observed only one band migrating at 36 kDa (not shown). Although eIF-4E (Lejbkowicz et al., 1992) and eIF-5A (Ruhl et al., 1993) have been previously observed in the nucleus, eIF-2 has not. While eIF-2α has no sequence elements expected to react with nucleotides, the β-subunit of eIF-2 possesses a C2/C2 zinc finger motif (Donahue et al., 1988) and contains three blocks of six to eight lysine residues that may be involved in binding nucleic acids (Pathak et al., 1988). Indeed the zinc finger region of eIF-2β binds tRNA (Flynn et al., 1994) and also appears to be involved in recognition of the start codon on mRNA (Donahue et al., 1988). These characteristics of the β-subunit and our observation of eIF-2(αP) in the nuclei of selectively vulnerable neurons after 1 hour of reperfusion raise the possibility that eIF-2 interacts with DNA under conditions of cellular stress.
Potential mechanisms involved in the accumulation of eIF-2(αP) during reperfusion
The increase in eIF-2(αP) during early reperfusion requires an active eIF-2α kinase; the only three known are GCN2, HCR, and PKR (Samuel, 1993). GCN2 is found in yeast, but a mammalian analog has not been reported (Wek, 1994). Studies in the rabbit reticulocyte translation system revealed an eIF-2α kinase now known as HCR (heme-controlled repressor). The activity of this enzyme is stimulated by heavy metals (e.g., iron [Hurst et al., 1987]) and lipoperoxides (De Herreros et al., 1985), and this suggested HCR could be activated by radical-mediated iron delocalization and lipid peroxidation during brain reperfusion (White et al., 1993). Because oxidized glutathione is known to activate HCR (Clemens et al., 1975), we examined in vitro translation systems (DeGracia et al., 1996) in which oxidized glutathione was added to either a rabbit reticulocyte lysate or to a normal rat brain homogenate. We obtained the expected translation inhibition in the rabbit reticulocyte system, but oxidized glutathione had no effect on translation in the rat brain homogenate (unpublished data). This result and the studies of Pal et al. (1991) argue against HCR as a major regulator of eIF-2α phosphorylation in the brain.
PKR (formerly DAI, p68 kinase, PKds, or Pl/eIF-2α protein kinase) is widely distributed in various tissues, including the brain (Haines et al., 1993). It is tightly associated with ribosomes (Samuel, 1993) and in ultrastructural studies is seen on the rough endoplasmic reticulum (ER) (Schwemmle et al., 1992) with a small fraction present in the nucleolus (Jeffrey et al., 1995). The eIF-2α kinase function of PKR is activated by auto- and transphosphorylation on several serine and threonine sites (Thomas and Samuel, 1995; Taylor et al., 1996), and a number of endogenous activators and inhibitors of PKR have been identified (Jagus, 1994).
One mechanism by which PKR could be activated during brain ischemia and early reperfusion involves arachidonate-mediated depletion of calcium from the ER. Free arachidonic acid exceeds 100 μmol/L within 10 minutes of brain ischemia and does not recover to baseline levels for at least the first 30 minutes of reperfusion (Abe et al., 1989). Arachidonate can induce release of calcium from ER stores (Wolf et al., 1986; Katsuki and Okuda, 1995), and several studies have shown that depletion of Ca2+ from the ER induces activation of PKR (Prostko et al., 1995) and a rapid suppression of protein synthesis (Brostrom et al., 1983, 1985, 1989; Chin et al., 1987; Kumar et al., 1989). Indeed, free arachidonate concentrations greater than 10 μmol/L in cell culture models lead to PKR activation, eIF-2α phosphorylation, and suppression of protein synthesis (Rotman et al., 1992; Fleming and Mellow, 1995). PKR activity is not directly affected by Ca2+, and the mechanisms responsible for PKR activation as a consequence of Ca2+ depletion from the ER are unknown. PKR activation is possible despite the rapid loss of ATP during ischemia because the 1 μmol/L ATP needed for PKR autophosphorylation (Hu and Conway, 1993) is three orders of magnitude less than the 3 mmol/L ATP in normal neurons (Lowry et al., 1964). This situation could allow PKR activation during ischemia with the majority of phosphorylation of eIF-2α delayed until ATP recovers during reperfusion. Our data showed a trend, which did not reach statistical significance, suggesting that there is an increase in eIF-2α kinase activity during ischemia, which might explain in part the very rapid phosphorylation of eIF-2α we have observed during reperfusion.
The persistently enhanced phosphorylation of eIF-2α during brain reperfusion might also reflect inappropriately low phosphatase activity against eIF-2(αP). There are four major classes of serine-threonine protein phosphatases (PP) based on their catalytic subunits and responsiveness to various inhibitors (Cohen, 1989). PP1 and PP2A, but not PP2B or PP2C, dephosphorylate eIF-2(αP) in vitro (Ingebritsen and Cohen, 1983), and the addition of okadaic acid (an inhibitor of PP1 and PP2A) to cells results in shutdown of protein synthesis (Redpath and Proud, 1990). PP1 appears to be the dominant phosphatase for eIF-2(αP) (Babu and Ramaiah, 1996) and also dephosphorylates PKR (Szyszka et al., 1989). PP1, but not PP2A, is specifically inhibited by two peptides (I-1 and I-2) (Cohen, 1989), and in the reticulocyte lysate, addition of either I-1 or I-2 leads to increased phosphorylation of eIF-2α and inhibition of translation (Ernst et al., 1982).
The catalytic subunit of PP1 (PP1C) is regulated by phosphorylation of targeting subunits or interactions with I-1 and I-2 (Cohen, 1989). Targeting subunits direct PP1C to the proper subcellular location, enhance the activity of PP1 toward substrates, and confer sensitivity to extracellular signals (Hubbard and Cohen, 1993). Conversely, dissociation of PP1 into its subunits (e.g., induced by arachidonate or epinephrine) is associated with inhibition of the activity of PP1C (MacKintosh et al., 1988; Hubbard and Cohen, 1989; Gong et al., 1992). There is a greater than 30-fold increase in epinephrine levels during reperfusion after cardiac arrest (Kern et al., 1989), and epinephrine activates I-1 (presumably through cAMP-induced protein kinase A activation; Dent et al., 1990). Interestingly, I-1 is found mostly in the pyramidal neurons in the hippocampus and layers II to III and V to VI in rat cerebral cortex (Hemmings et al., 1992; Lowenstein et al., 1995).
Potential involvement of eIF-2(αP) in the induction of apoptosis
The persistent accumulation of eIF-2(αP) that we have observed in vulnerable neurons during reperfusion may be related to the induction of apoptosis (Hale et al., 1996). Activated PKR induces transcription of the gene for FAS (Takizawa et al., 1995), and FAS protein is increased 131-fold at 2 hours of reperfusion after myocardial ischemia (Kajstura et al., 1996). In higher eukaryotes activation of the FAS and tumor necrosis factor (TNF) family of cell surface receptors has been shown to trigger intracellular signaling pathways leading to apoptosis (Nagata and Golstein, 1995). Moreover, mouse embryo fibroblasts from mice containing homozygous deletions in the PKR gene are resistant to TNF-α-induced apoptosis (Der et al., 1997). There is some evidence that PKR-dependent apoptosis may be mediated by eIF-2(αP) itself. Expression of the eIF-2α mutant protein Ser51 Ala (no phosphorylation possible) in NIH 3T3 fibroblasts blocked TNF-α induced apoptosis, whereas conditional expression of the Ser51 Asp mutant (which mimics permanent phosphorylation) induced immediate apoptosis (Kaufman and Srivastava, 1996).
Footnotes
Acknowledgments
We thank Drs. Susan Oldfield and Scot Kimball for their generous gifts of materials.