
Abstract
Cortical depolarization was investigated in a topographic gradient of ischemic density after 1-hour transient middle cerebral artery occlusion in halothane-anesthetized cats. A laser Doppler flow probe, an ion-selective microelectrode, and a nitric oxide (NO) electrode measured regional CBF (rCBF), direct current (DC) potential, extracellular Ca2+ concentration ([Ca2+]o), and NO concentration in ectosylvian and suprasylvian gyri of nine animals. Recordings revealed 12 of 18 sites with persistent negative shifts of the DC potential, severe rCBF reduction, and a drop of [Ca2+]o characteristic for core regions of focal ischemia. Among these sites, two types were distinguished by further analysis. In Type 1 (n = 5), rapid, negative DC shifts resembled anoxic depolarization as described for complete global ischemia. In this type, ischemia was most severe (8.9 ± 2.5% of control rCBF), [Ca2+]o dropped fast and deepest (0.48 ± 0.20 mmol/L), and NO concentration increased transiently (36.1 ± 24.0 nmol/L at 2.5 minutes), and decreased thereafter. In Type 2 (n = 7), the DC potential fell gradually over the first half of the ischemic episode, rCBF and [Ca2+]o reductions were smaller than in Type 1 (16.2 ± 8.2%; 0.77 ± 0.41 mmol/L), and NO increased continuously during ischemia (53.1 ± 60.4 nmol/L at 60 minutes) suggesting that in this type NO most likely exerts its diverse actions on ischemia-threatened tissue. In the remaining six recording sites, a third type (Type 3) attributable to the ischemic periphery was characterized by minimal DC shifts, mild ischemia (37.2 ± 13.3%), nonsignificant alterations of [Ca2+]o, but decreased NO concentrations during middle cerebral artery occlusion. Reperfusion returned the various parameters to baseline levels within 1 hour, the recovery of [Ca2+]o and NO concentration being delayed in Type 1. An NO synthase inhibitor (NG-nitro-
Keywords
The term anoxic depolarization has been used to describe a rapid and large negative shift of cortical direct current (DC) potential, which appears with a certain latency during a sustained insult of anoxia or global cerebral ischemia (Hansen and Zeuthen, 1981). It was reported in cerebral cortex of rats or cats with asphyxia (Vyskocil et al., 1972; Blank and Kirshner, 1977), cardiac arrest (Nicholson et al., 1977; Hansen and Zeuthen, 1981; Xie et al., 1995), or bilateral carotid artery occlusion plus induced hypotension (Harris and Symon, 1984). Focal cerebral ischemia, which is an animal model more relevant to clinical ischemic stroke, differs from global cerebral ischemia pathophysiologically in two major respects (Siesjö, 1992). First, regional CBF (rCBF) reduction in focal cerebral ischemia is less severe than that in global ischemia, and the rate of change in cerebral energy state may therefore differ among these two types of ischemia. Second, focal cerebral ischemia produces not only a core area of densely ischemic tissue, but also perifocal areas with less dense ischemia. The recent notion of focal cerebral ischemia also requires a dimension of time, since it has been demonstrated that penumbra tissue, which is metabolically impaired but still viable when reperfused, spreads out with time from the center of the ischemic focus to the neighboring tissue, leaving fatal tissue behind (Heiss and Graf, 1994; Heiss et al., 1994). The cortical DC potential is considered to be a gross potential reflecting membrane potentials of neurons and glia surrounding an extracellular electrode (O'Leary and Goldring, 1964; Higashida et al., 1974; Hansen, 1985; Obrenovitch et al., 1993). Because the membrane potential is susceptible to the cellular energy state (Martin et al., 1994), it is expected that the cortical DC potential in focal cerebral ischemia may show some variation from that in global cerebral ischemia regarding location, magnitude, and time of alteration.
Nitric oxide (NO) has been regarded as one of the mediators playing a key role in the pathophysiologic mechanism of focal cerebral ischemia (Dalkara and Moskowitz, 1994; Dawson, 1994). As expected from the complex and diverse actions of NO, studies attempting to modify NO production in focal cerebral ischemia report conflicting results (Dalkara and Moskowitz 1994; Dawson 1994). Nitric oxide acts as an intercellular messenger molecule in the brain; it simply diffuses out of a cell where it has been synthesized into the neighboring cells where its targets exist (Dawson and Snyder, 1994). Like authentic neurotransmitters, NO must diffuse across the extracellular space to exert its biological effects, and thus extracellular NO concentration probably is a good indicator of physiologic NO activity. With the inventions of NO-sensitive electrodes (Shibuki, 1990; Malinski and Taha, 1992), real-time measurement of extracellular NO concentration has become feasible. The first attempts to apply them to focal cerebral ischemia have reported an increase in tissue NO concentration (Malinski et al., 1993; Lin et al., 1996; Ohta et al., 1996). Nitric oxide is synthesized from
In the current experiments, we demonstrate topographic and chronological profiles of the cortical DC potential, and the extracellular Ca2+ and NO concentrations in relation to topographically graded cerebral blood flow (CBF) reduction in an ischemic focus. A hypothesis was raised as follows: In a gradient of ischemic density, tissue depolarization and events related to depolarization such as transmembrane Ca2+ influx or constitutive NO synthase activation may show regional variation, which, in turn, may result in variable regional outcomes in an ischemia–reperfusion model. All relevant parameters were continuously monitored in cerebral cortex in situ during 60 minutes of focal cerebral ischemia and 120 minutes of reperfusion.
MATERIALS AND METHODS
Animal preparation
Thirteen adult cats of both sexes weighing 2.4 to 4.3 kg were used. The study was approved by the local Animal Care Committee and the Regierungspräsident of Cologne and is in compliance with the German Laws for Animal Protection. Generalized anesthesia was induced with 25 mg/kg ketamine hydrochloride intramuscularly. The left femoral vein and artery were catheterized to administer drugs and to measure arterial blood pressure, arterial blood gases, hematocrit, and plasma glucose concentration. The animals were tracheostomized to ventilate artificially with a 70% nitrous oxide −30% oxygen gas mixture, and expiratory end-tidal gases were monitored. Generalized anesthesia was maintained by 0.8% to 1.5% halothane inhalation. The animals were immobilized with 0.2 mg/kg pancuronium bromide (bolus) and 5 mg/kg/h gallamine triethiodide continuous (injection) both administered intravenously. Artificial ventilation was controlled, keeping arterial and expiratory gases within normal physiologic ranges. Deep body temperature was kept at 37.0°C using a heating blanket feedback controlled by a rectal temperature probe.
Proximal middle cerebral artery (MCA) occlusion was employed for induction of focal cerebral ischemia. After enucleation, a small burr hole of 3-mm diameter was drilled transorbitally above the optic foramen in the posterior wall of left orbit. The trunk of the left MCA was prepared just above the optic nerve by cutting dura and arachnoid membranes under microscopic control, and an occluding device (Graf et al., 1986) was implanted around the MCA trunk. This device consists of an outer cannula whose tip forms a hook to be put around the MCA, and an inner occluder, which can be slid into the hook through the cannula. By pushing the inner occluder toward the silicon-coated wall of the hook, the MCA is compressed gently and firmly between the occluder and the hook wall, yielding total arterial occlusion, and by pulling back the occluder, the MCA occlusion is easily relieved. The burr hole was filled with gelfoam, and the orbit was sealed with dental cement to avoid CSF leakage and to make the intracranial space a closed system.
Stereotactic coordinates (Reinoso-Suárez, 1961) for measurement sites were 8 mm anterior/15 mm lateral in the ectosylvian gyrus, and 4 mm anterior/8 mm lateral in the suprasylvian gyrus in the left cerebral cortex. Both sites are located in the territory of MCA, the ectosylvian gyrus being more proximal to the MCA trunk than the suprasylvian gyrus (Fig. 1). Burr holes of 3-mm diameter were drilled in the skull above the measurement sites, and the dura was removed under microscopic control. In each site, an ion-selective microelectrode and an NO electrode were inserted adjacently 1.0 mm deep into cortex using a micromanipulator. Next to the electrodes, a thermocouple for measurement of regional brain temperature and a laser Doppler probe (tip diameter 800 μm, Moor Instruments, Axminster, England) for measurement of rCBF were placed on the cortical surface also by using a micromanipulator. The burr holes were filled with gelfoam containing CSF and closely covered with dental cement. Brain temperature was maintained at 37.0°C using feedback-controlled heating lamps above the animal's head and brain temperature monitoring on the surface of the ectosylvian gyrus.
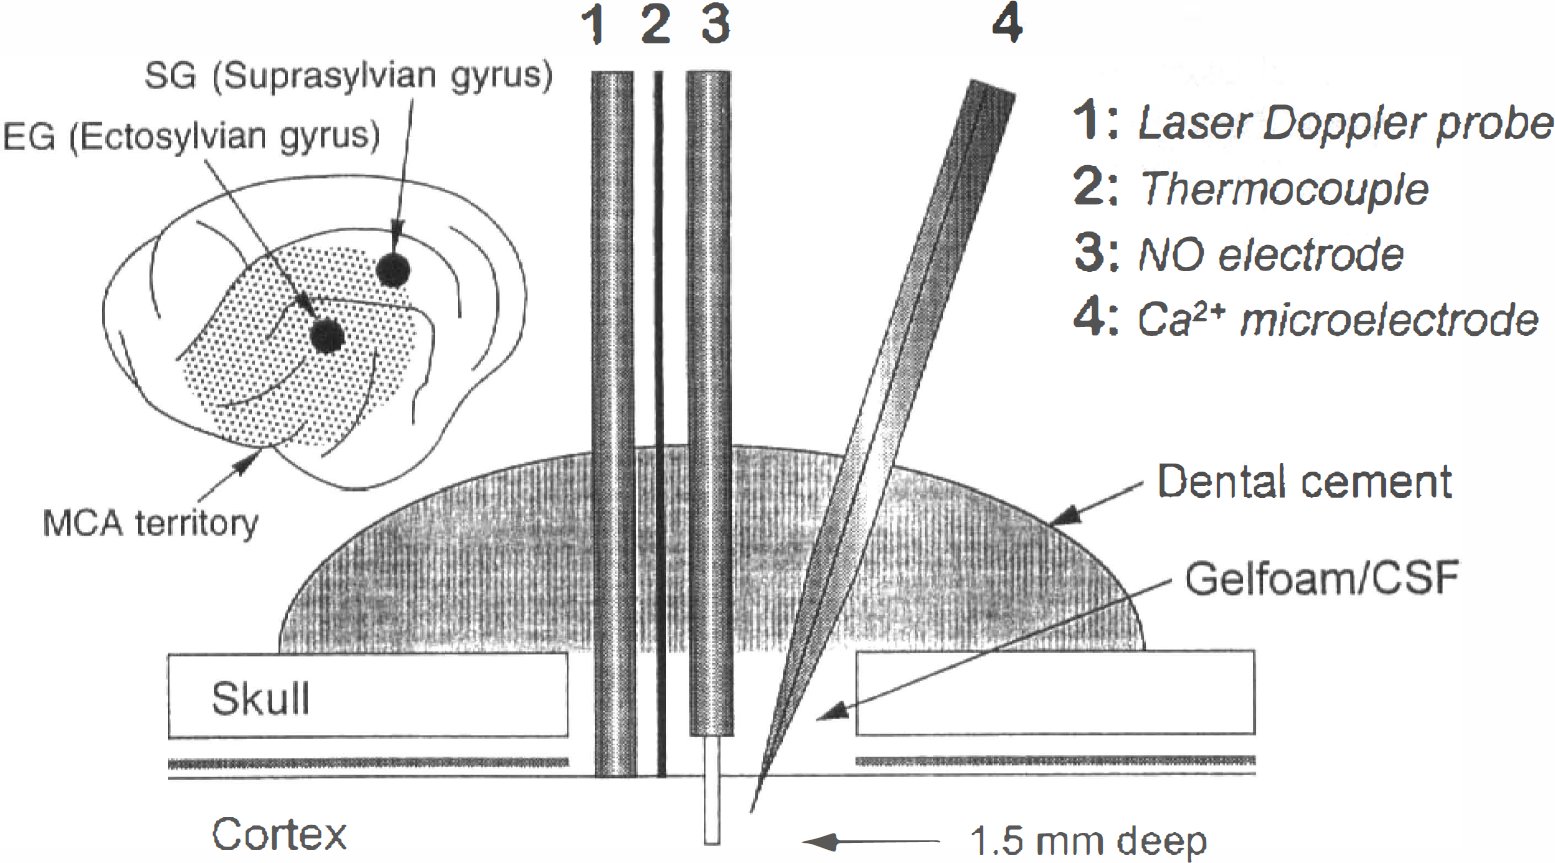
Lateral view of the left hemisphere with recording sites in ectosylvian and suprasylvian gyri as related to the territory of the middle cerebral artery (MCA), and schematic drawing of a multisensor array used in each of the two locations for intracortical or supracortical measurements.
Electrodes
Ion-selective microelectrodes were made according to a standard method (Ammann, 1986). A double-barrelled glass micropipette with a tip diameter ∼3 μm consisted of a reference barrel filled with 150 mmol/L NaCl and an ion-selective barrel filled with Ca2+ ionophore (Fluka, Neu-Ulm, Germany) and 150 mmol/L CaCl2. The former served for electrocorticogram (ECoG) and DC potential recording, and the latter for extracellular Ca2+ concentration ([Ca2+]o) recording. The DC potential was recorded against a calomel electrode (Shibata et al., 1977) placed on the nasion to avoid polarization. Calibration at 37°C was performed in 0.03 to 3.0 mmol/L CaCl2 solutions.
The NO electrodes inserted extracellularly in the cerebral cortex allowed real-time measurement of NO concentration in cortical tissue. This electrode type (ISO-NOP200, World Precision Instruments, Sarasota, FL, U.S.A.) (Tsukahara et al., 1994; Weyrich et al., 1994; Janigro et al., 1996; Ohta et al., 1996) has a single-sensor structure where a working electrode and an Ag/AgCl reference electrode are combined and covered with a hydrophobic gas-permeable membrane with a tip diameter of 200 μm. The electrode was inserted into the cortical tissue through a tiny incision of the arachnoid membrane. Because of separation of the sensor structure from the tissue by a hydrophobic gas-permeable membrane, only gases can react at the sensing electrodes. The electrode is kept at a constant potential of +0.85 V against the Ag/AgCl reference electrode. This potential determines the electrode specificity to NO among other gases in the tissue (Shibuki, 1990). The NO electrode put in Ringer's solution did not show any increase in redox current by bubbling with gases such as nitrogen, oxygen, or carbon dioxide, or by adding 1 nmol/L to 100 μmol/L ascorbic acid or dopamine. The redox current proportional to tissue NO concentration was measured with an amplifier (ISO-NO meter, World Precision Instruments). The NO electrodes were calibrated before each experiment by in vitro chemical generation of NO using 50 μmol/L NaNO2 (E. Merck, Darmstadt, Germany), 0.1 mol/L H2SO4, and 0.1 mol/L KI solutions at 37.0°C. The lower detection limit was 0.5 nmol/L NO.
Experimental protocol
The various parameters (e.g., blood pressure, brain temperature, rCBF, ECoG, DC potential, [Ca2+]o, NO concentration) were continuously recorded using a PC-based data acquisition system (DABAS, Hofheim, Germany). In the vehicle treatment group, nine cats received intravenous vehicle injections (20 mL of Ringer's solution in 10 minutes). In the
Statistical analysis
Data are presented as means ± SD. Cortical DC potential (mV) and tissue NO concentration (nmol/L) are shown as changes from the baseline levels, and a negative value indicates a decrease from baseline. Regional CBF by laser Doppler flowmetry was calculated as percentage of the baseline level. The significance of differences at P < 0.05 was tested between sequential measurements during ischemia and reperfusion, between groups, and between treatments using analysis of variance and multiple post hoc comparisons (Fischer's protected least significance difference) (Statistica, StatSoft, Inc., Tulsa, OK, U.S.A.) unless otherwise stated in the text.
RESULTS
Physiologic variables
As shown in Table 1, physiologic variables before treatment were within normal physiologic ranges in the two groups, and were not altered significantly during the course of experiments except for mean arterial blood pressure in the
Physiological variables
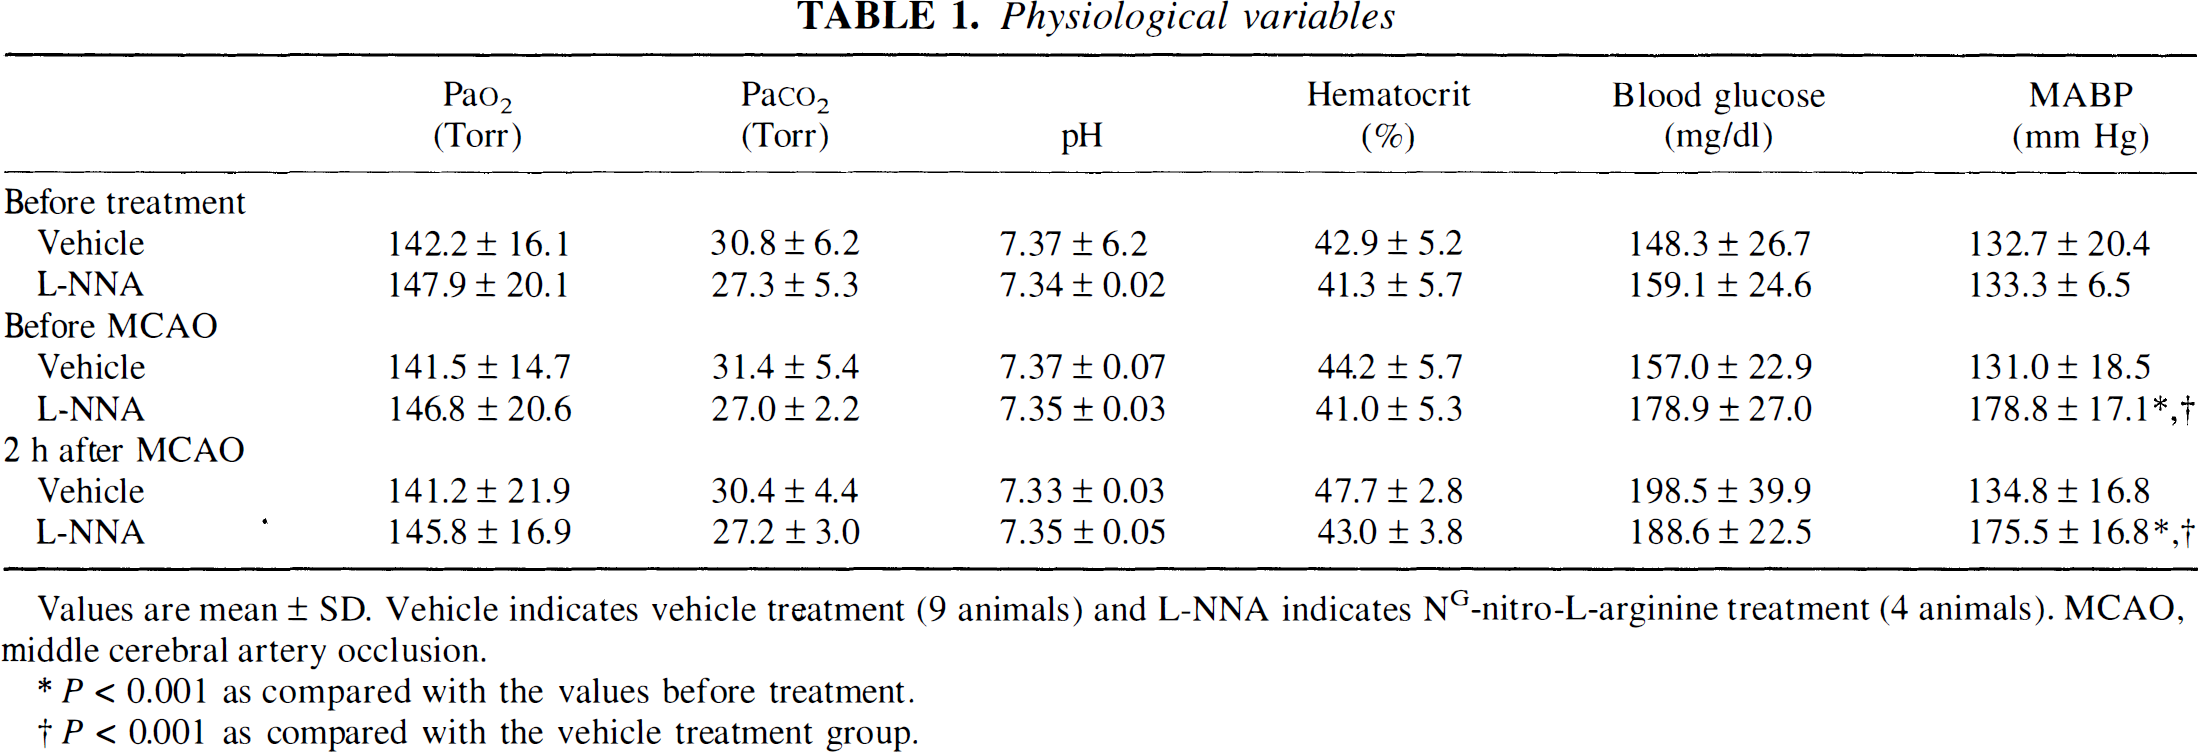
Values are mean ± SD. Vehicle indicates vehicle treatment (9 animals) and L-NNA indicates NG-nitro-L-arginine treatment (4 animals). MCAO, middle cerebral artery occlusion.
P < 0.001 as compared with the values before treatment.
P < 0.001 as compared with the vehicle treatment group.
Classification of cortical measurements according to direct current potential alterations
The MCA occlusion produced an immediate drop in rCBF in both ectosylvian and suprasylvian gyri. The extent of rCBF reduction at individual locations was, however, variable, as were cortical DC potential shifts and alterations of Ca2+ and NO concentrations (see individual recordings of the various parameters at three cortical sites in Fig. 2). Since the DC potential can be regarded as a variable into which various pathophysiologic processes are integrated, the time course of the negative DC potential deflection during the initial 20 minutes of MCA occlusion was chosen to classify the recordings. In particular, similarities or dissimilarities to “anoxic depolarization” as described in global cerebral ischemia (Hansen and Zeuthen, 1981) helped to distinguish between three types, as described below:
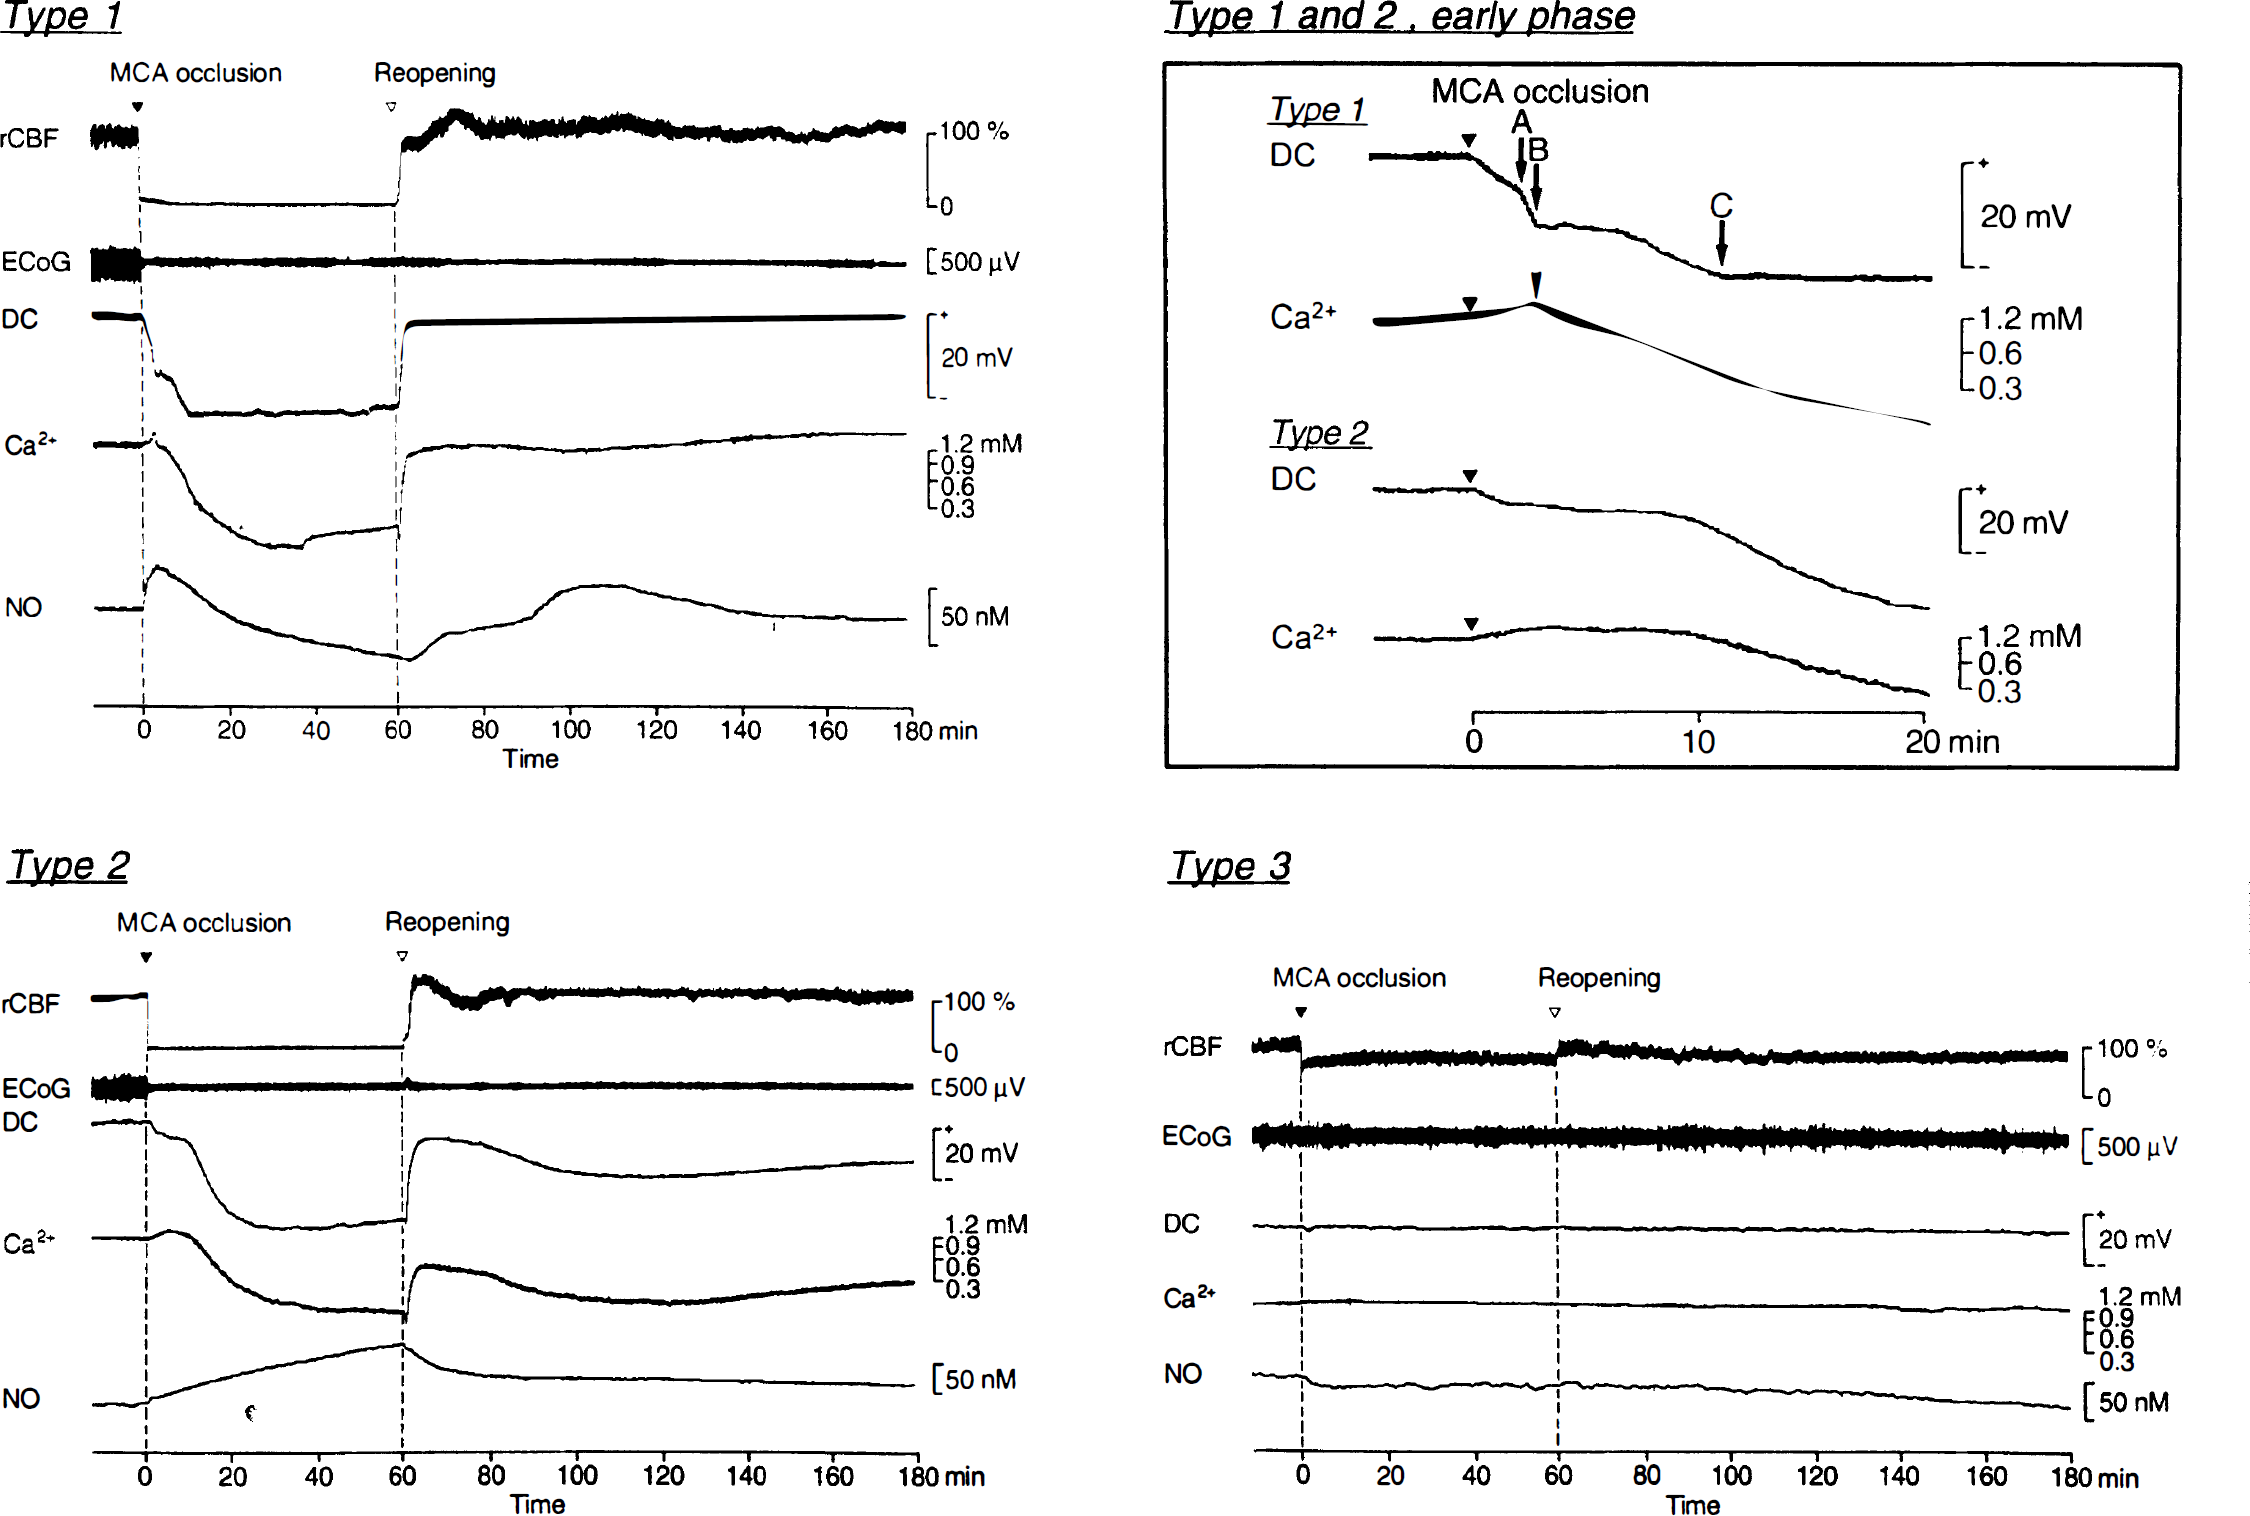
Examples of multiparametric recordings in cortical sites of Type 1 (top left), Type 2 (bottom left), and Type 3 (bottom right) during 60 minutes of MCA occlusion and 120 minutes of reperfusion. (Refer to text for definitions of types.) In Type 1 (top right), arrows A and B indicate the beginning of the second and third phase of DC potential changes, respectively; arrow C indicates the lowest level of the DC potential; and the arrowhead indicates abrupt drop of Ca2+ concentration. MCA, middle cerebral artery; rCBF, regional cerebral blood flow; ECoG, electrocorticogram; DC, cortical direct current potential; Ca2+, extracellular concentration of Ca2+; NO, extracellular concentration of nitric oxide.
Type 1 (Fig. 2, top): Cortical sites assembled in this type showed DC potential changes similar to “anoxic depolarization.” Shortly after MCA occlusion, the amplitude of the ECoG decreased markedly and the DC potential started to shift. The first phase of gradual negative deflection continued for at the most 5 minutes, followed by a steeper second phase during which at least −15 mV were reached (Fig. 2, arrow A, top right panel). Finally, a more gradual third phase (Fig. 2, arrow B, top right) terminated the steep shift, and the DC potential fell to a minimal level (Fig. 2, arrow C, top right panel) ∼12 minutes after MCA occlusion.
Type 2 (Fig. 2, bottom left and top right): Focal cerebral ischemia also induced DC potential changes, which were persistent but unlike “anoxic depolarization.” Cortical sites manifesting such changes were classified in Type 2. In this type, the cortical DC potential began to decline on MCA occlusion, as was the case in Type 1. However, the steep second phase was missing, and progression of negative shift was slower compared with Type 1. The bottom level of the DC potential was reached only 20 to 60 minutes after MCA occlusion.
Type 3 (Fig. 2, bottom right): Cortical sites that did not show negative DC shifts larger than ±2 mV were classified as Type 3.
In nine cats of the vehicle treatment group, the measurement was performed in a total of 18 cortical sites, which were separated into five Type 1 sites, seven Type 2 sites, and six Type 3 sites according to the criteria described earlier (Table 2). In this group, most (89%) of the cortical sites in ectosylvian gyrus showed persistent depolarization (Types 1 and 2). In suprasylvian gyrus, persistent depolarization of Types 1 and 2 (44%) was not so dominant as Type 3 (56%). This difference between ectosylvian gyrus and suprasylvian gyrus was statistically significant (P < 0.05, chi-square test). Among the total of eight cortical sites of the
Incidence of three types of changes in cortical direct current potential in vehicle and L-NNA treatment groups
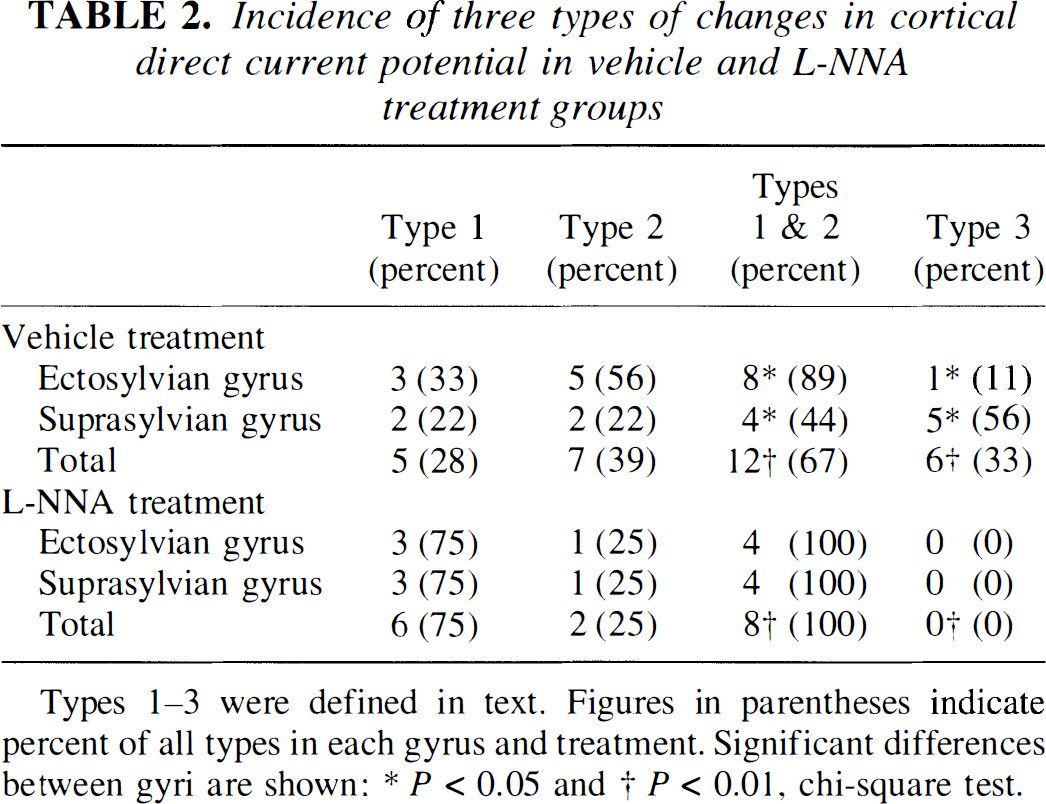
Types 1–3 were defined in text. Figures in parentheses indicate percent of all types in each gyrus and treatment. Significant differences between gyri are shown: * P < 0.05 and † P < 0.01, chi-square test.
The following analyses on each parameter were performed with respect to the type of cortical measurement sites irrespective of gyral location. Type 2 of the
Cortical direct current potential
In all cortical sites of Types 1 and 2 of the vehicle treatment group, depolarization of the DC potential began just after the initiation of MCA occlusion and persisted until MCA was reopened after 60 minutes (Fig. 2, top left and bottom left). Type 1 showed the most rapid negative deflection during ischemia, already reaching the bottom level (−23.4 ± 5.1 mV) at ∼12.5 minutes (P < 0.0005 versus baseline; Fig. 3A). At this time, Type 2 still remained −8.5 ± 9.0 mV higher than Type 1 (P < 0.0005). Type 2 gradually depolarized, reaching a final level of −16.8 ± 13.7 mV at 40 minutes (P < 0.0005). Different degrees of depolarization between Types 1 and 2 were significant throughout the ischemic period (P < 0.05 ∼ P < 0.0005). Type 3 did not show significant changes in cortical DC potential after MCA occlusion.
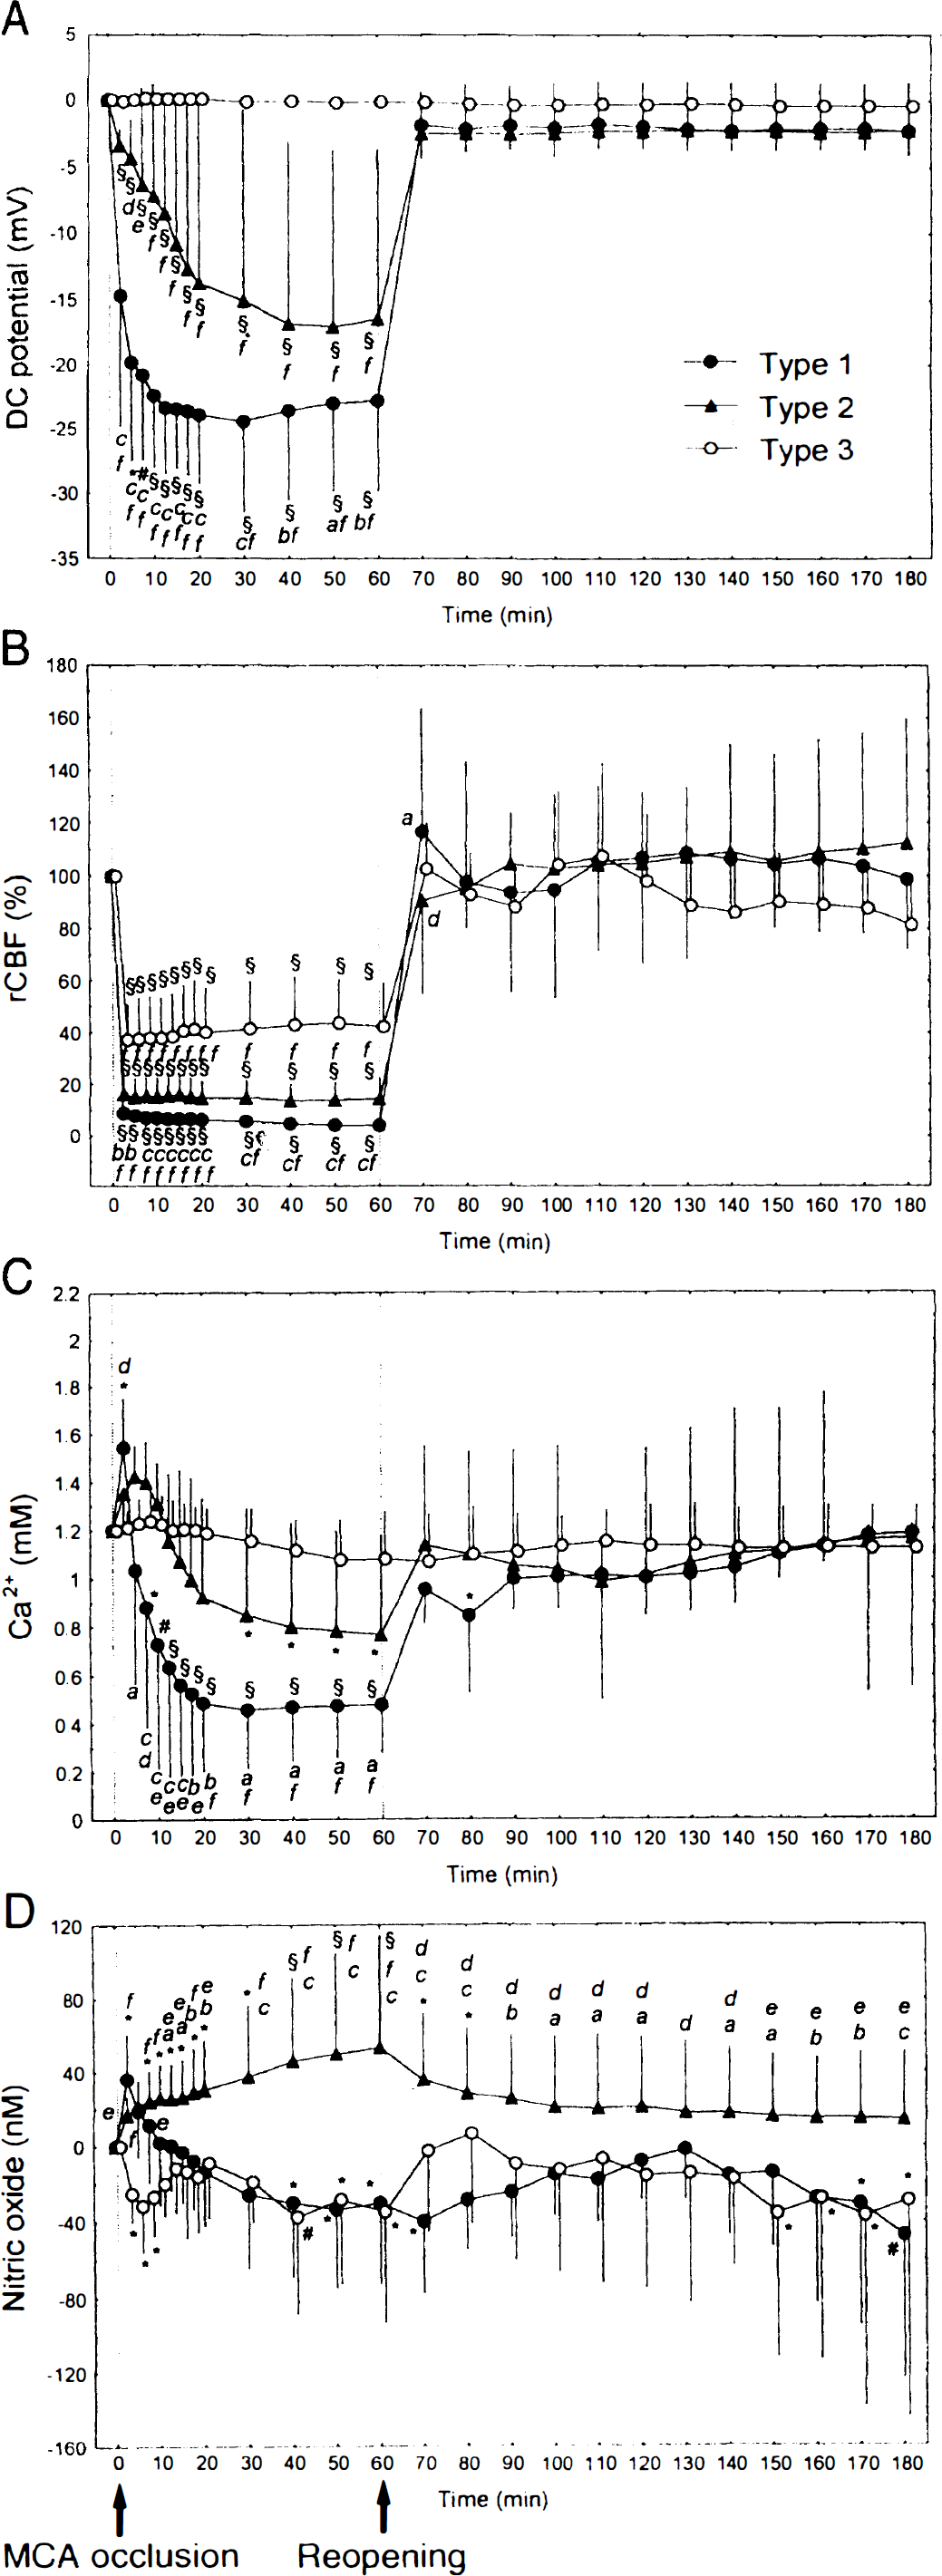
Changes in multiple parameters measured in cortical sites of Type 1 (n = 5), Type 2 (n = 7), and Type 3 (n = 6) during 60 minutes of MCA occlusion and 120 minutes of reperfusion in the vehicle treatment group. Data (means ± SD) are plotted every 2.5 minutes for the initial 20 minutes and every 10 minutes afterward. A negative value for nitric oxide concentration indicates a decrease from baseline. *P < 0.05, #P < 0.005, and §P < 0.0005: significantly different from baseline. P < 0.05
Reopening of the MCA restored the DC potential in Types 1 and 2 within some minutes (Fig. 2, top left and bottom left). Almost the same level a little below baseline was reached in both types and was kept throughout the 120 minutes of reperfusion (Fig. 3A). In Type 3, the DC potential was not affected by reopening of the MCA.
In Type 1 of the
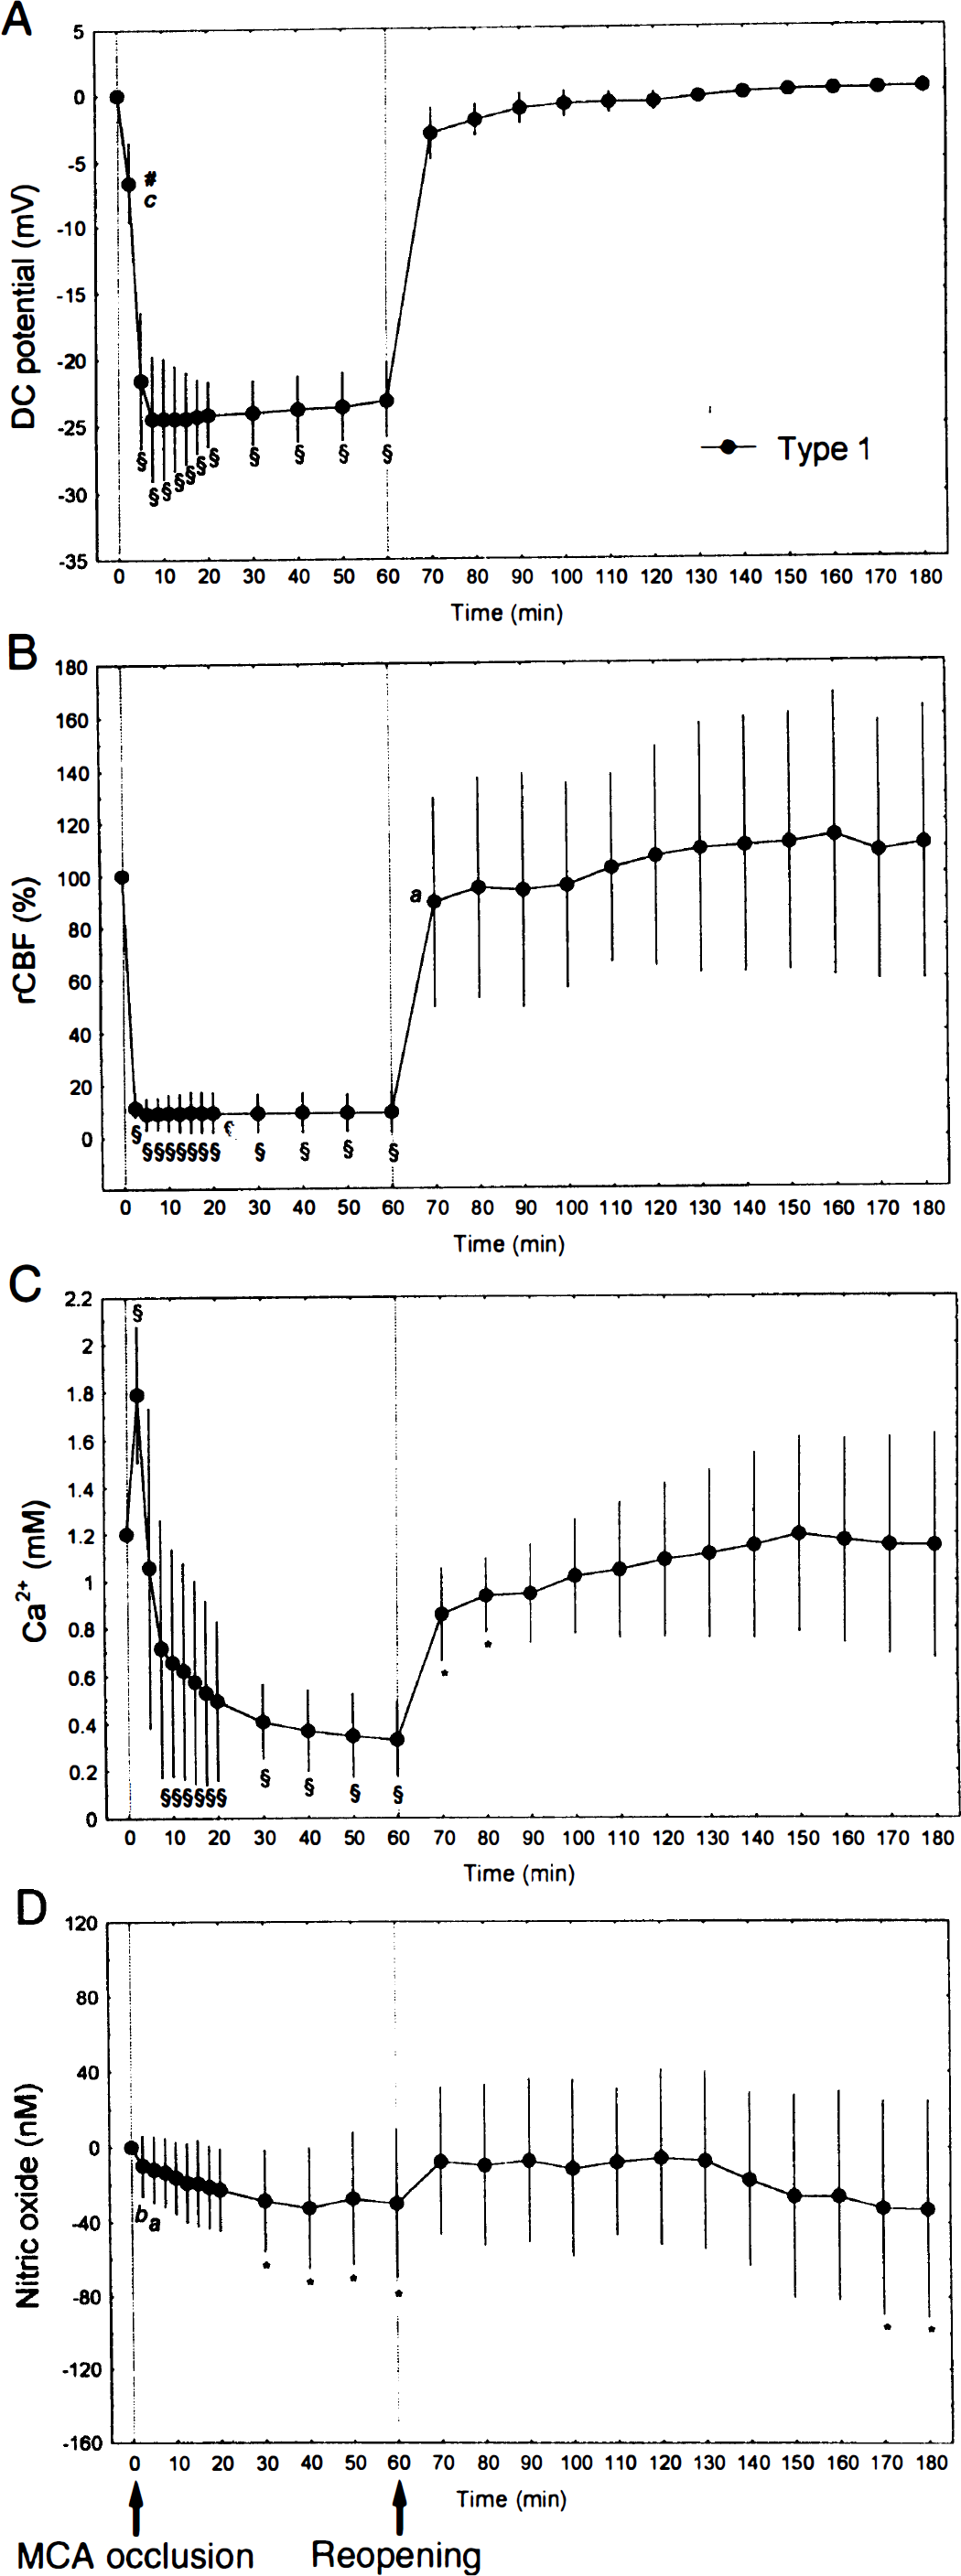
Changes in multiple parameters measured in cortical sites of Type 1 (n = 6) during 60 minutes of MCA occlusion and 120 minutes of reperfusion in the NG-nitro-
Latencies of DC potential changes into different phases after middle cerebral artery occlusion in Type 1 cortical sites of the two treatment groups
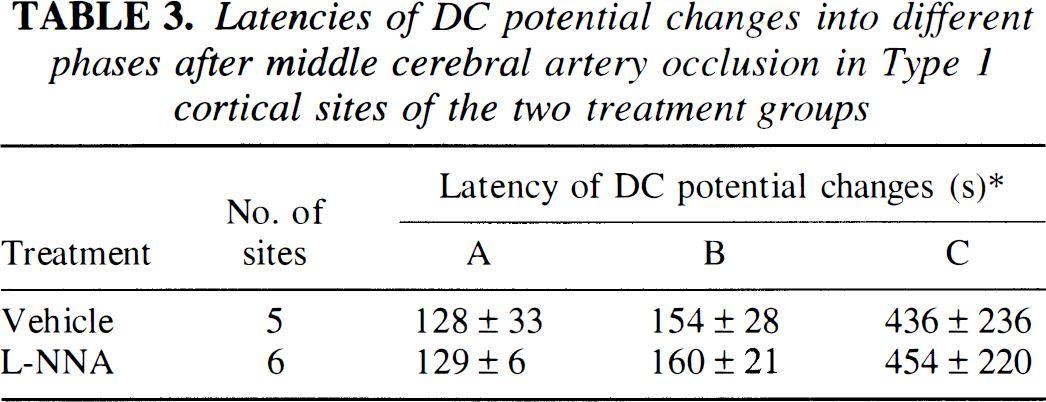
Type 1 was defined in text. L-NNA denotes NG-nitro-L-arginine treatment group. * Latency from induction of MCA occlusion to time points A, B, and C. A and B indicate the beginning of the second and third phase of DC potential change, respectively. C indicates the lowest level of the DC potential (see top right panel of Fig. 2). Values are mean ± SD. Note significant differences between the two treatment groups do not exist (unpaired t-test). In the vehicle treatment group, the latency to the point at which minimal DC levels (Latency C; see top right panel of Fig. 2) were reached was much shorter in Type 1 than in Type 2 (436 ± 236 s versus 1811 ± 1220 s; P < 0.05, unpaired t-test), confirming the rapid nature of tissue depolarization in Type 1.
Regional cerebral blood flow
In all cortical sites, MCA occlusion immediately reduced rCBF, and the level of rCBF reduction stayed constant over the 60-minute ischemic episode (Fig. 2). The different degrees of rCBF reduction were disclosed between three types during 60 minutes of MCA occlusion (P < 0.05 ∼ P < 0.0005 between types). The most severe ischemia was found in Type 1 (8.9 ± 2.5% at 2.5 minutes). Type 2 showed a higher rCBF (16.2 ± 8.2% at 2.5 minutes, P < 0.0005) than Type 1, and in Type 3, rCBF remained at a much higher level (37.2 ± 13.3% at 2.5 minutes, P < 0.0005) than in Types 1 and 2.
Reopening of the MCA was confirmed by recovery of rCBF in all cortical sites, although the degree of recovery showed a certain variety among local recordings, ranging from delayed recovery with a certain period of hypoperfusion to a rapid response with hyperperfusion. The mean rCBF value of the three types during 120 minutes of reperfusion did not differ significantly from baseline (Fig. 3B). Likewise, comparisons between types during reperfusion disclosed no difference except for a lower rCBF in Type 2 at 10 minutes after reopening than in Types 1 and 3 (P < 0.05).
Type 1 cortical sites of the
Extracellular Ca2+ concentration
In the initial phase after MCA occlusion, [Ca2+]o showed characteristic changes corresponding to DC potential changes found in the three types of cortical sites. In Type 1, [Ca2+]o began to increase gradually after the initiation of MCA occlusion, and it turned abruptly into a steep drop (Fig. 2, top right, arrowhead) just after the second phase of the DC potential shift. In Type 2, [Ca2+]o showed a gradual increase after MCA occlusion (Fig. 2, top right), similar to Type 1. This initial phase, however, continued for several minutes and thereafter [Ca2+]o declined gradually. Thus, Type 2 lacked not only a phase of an accelerated negative DC shift but also that of an abrupt, concomitant drop in [Ca2+]o, both being characteristic for the second phase of Type 1. In Type 3, [Ca2+]o changes were minimal, as were those of the DC potential (Fig. 2, bottom right).
Summation of the results (Fig. 3C) reveals in Types 1 and 2 that the early increase in [Ca2+]o reached 1.55 ± 0.20 mmol/L (P < 0.05 versus baseline) and 1.35 ± 0.14 mmol/L at 2.5 minutes, respectively. Thereafter, [Ca2+]o turned into a rapidly decreasing phase in Type 1, reaching a bottom level of 0.49 ± 0.28 mmol/L at 20 minutes (P < 0.0005). In Type 2, in contrast, the initial increase in [Ca2+]o persisted for several minutes, resulting in a wide peak around 5 to 7.5 minutes after MCA occlusion. Then, [Ca2+]o decreased gradually until the end of ischemic episode (0.77 ± 0.41 mmol/L at 60 minutes, P < 0.05), but it still remained at a higher level than that in Type 1 (P < 0.05). In Type 3, [Ca2+]o was not affected during this period.
On reopening of MCA, [Ca2+]o showed a small, transient drop followed by a rapid rise toward the baseline in Types 1 and 2 (Fig. 2, top left and bottom left). In Type 2, the baseline [Ca2+]o was restored at almost 10 minutes after reopening, whereas in Type 1, recovery was delayed until 30 minutes after reopening (Fig. 3C). In Type 3, [Ca2+]o remained unchanged during transition from MCA occlusion to reopening.
In Type 1 of the
Extracellular nitric oxide concentration
In Types 1 and 2 of the vehicle treatment group, NO concentration started to increase immediately after MCA occlusion (Fig. 2, top left and bottom left). During this early phase, [Ca2+]o also was increasing. In Type 1, the rise of NO started earlier than the decreasing phase of [Ca2+]o and was transient, forming a peak of 36.1 ± 24.0 nmol/L at 2.5 minutes (P < 0.05; Fig. 3D). At this time point, [Ca2+]o also was on its peak (Fig. 3C). After 5 minutes of ischemic episode, NO concentration gradually returned to the baseline level in Type 1 and decreased thereafter below baseline (−29.8 ± 39.0 nmol/L at 40 minutes, P < 0.05 versus baseline). In the
Reperfusion seemed to restore NO concentration in Type 3 as early as 10 minutes after reopening of the MCA (Fig. 3D). In Type 1, NO concentration stayed low during this early phase of reperfusion (P < 0.05 versus baseline) and thereafter it recovered gradually over 60 minutes. In Type 2, reperfusion allowed NO to decrease from its highest level, but NO concentration still was higher than the baseline level for the first 20 minutes (P < 0.05). Although Type 2 showed a gradual decrease in NO concentration over 120 minutes of the reperfusion period, it maintained higher levels than Types 1 and 3 (P < 0.05 ∼ P < 0.0005).
DISCUSSION
Changes in cortical DC potential during drastic insults such as cardiac arrest or asphyxia have been described to develop in three phases (Hansen and Zeuthen, 1981). In the first phase just after the initiation of anoxic or ischemic insult, the DC potential usually shows a gradual small hyperpolarization. Small depolarizations also have been reported (Blank and Kirshner, 1977; Harris and Symon, 1984). This phase lasts for 1.3 to 4 minutes, varying a little among reports (Vyskocil et al., 1972; Blank and Kirshner, 1977; Nicholson et al., 1977; Hansen and Zeuthen, 1981; Harris and Symon, 1984; Xie et al., 1995), and turns into the most dramatic phase of steep negative deflection. This second phase has been demonstrated as anoxic depolarization (Hansen and Zeuthen, 1981). It is followed by the third phase, which is characterized by a slower decrease in the DC potential before a final state of depolarization is reached. It has been revealed by ion-selective microelectrode recordings that these three phases of DC potential changes are accompanied by three phases of changes in extracellular potassium concentration ([K+]o) and [Ca2+]o: in the first phase, [K+]o and [Ca2+]o show slow and small increases; in the second phase, [K+]o manifests a rapid and large increase and [Ca2+]o shows an abrupt drop; and, finally, [K+]o gradually increases and [Ca2+]o gradually decreases in the third phase (Vyskocil et al., 1972; Blank and Kirshner, 1977; Hansen, 1977; Nicholson et al., 1977; Hansen, 1978; Harris and Symon, 1984; Xie et al., 1995). The latency of the beginning of the second phase can be affected by the age of animals (Hansen, 1977), blood glucose level (Hansen, 1978), and blockers of Na+ permeability (Xie et al., 1995). However, once the anoxic depolarization is initiated, it exhibits the same patterns of changes as described earlier.
Our findings indicate that in focal ischemia, the time course of changes in cortical DC potential are more variable. During analysis of the results, three types of DC potential alteration have been distinguished. They were accompanied by different degrees of rCBF reduction and distinctive changes in [Ca2+]o and NO concentration. Type 3 of DC potential changes is found in the cerebral cortex if rCBF reduction stays above the upper CBF threshold of ischemic penumbra amounting to 30% to 40% of control CBF (Heiss et al., 1976; Astrup et al., 1977). Absence of ion homeostasis disturbances is verified by stable DC potential and [Ca2+]o. Types 1 and 2 are observed in the core of focal cerebral ischemia with residual rCBF less than 20%, documenting that even in the core of focal ischemia, considerable variations exist with regard to the progression of ion homeostasis disturbances. The second phase of Type 1 DC potential change is similar to that described for anoxic depolarization in anoxia and global ischemia. The latency from onset of ischemia to this phase and the final extent of negative deflection are similar to those reported for anoxic depolarization in rat and cat brain (Blank and Kirshner, 1977; Hansen, 1978; Harris and Symon, 1984; Xie et al., 1995). Concurrent rapid decrease in [Ca2+]o as shown in Type 1 also is a typical finding in anoxic depolarization (Nicholson et al., 1977; Hansen and Zeuthen, 1981; Harris and Symon, 1984). The lowest [Ca2+]o in Type 1 (0.49 ± 0.28 mmol/L) is higher than that reported in rat brain during anoxic depolarization induced by cardiac arrest (0.06 to 0.07 mmol/L; Hansen and Zeuthen, 1981; Xie et al., 1995) and during bilateral carotid artery occlusion plus induced hypotension (0.11 mmol/L; Harris and Symon, 1984). This difference may be related to the fact that some residual rCBF exists in focal cerebral ischemia compared with complete ischemia in cardiac arrest and extremely low CBF in forebrain ischemia. In Type 2, the steep, large drop of the DC potential within some minutes of ischemia, which is an essential feature of anoxic depolarization, is missing, and cortical tissue instead manifests gradual persistent depolarization. The final DC deflection in Type 2 is smaller than that in Type 1 or anoxic depolarization. In Type 2, [Ca2+]o also lacks a rapid drop, indicative of massive concurrent influx of Ca2+ from the extracellular space into neurons and glia, but exhibits a slow transition to decreasing phase. The final [Ca2+]o in Type 2 remains higher than that in Type 1.
Only few reports measure the cortical DC potential in focal cerebral ischemia. Date and coworkers report thresholds of pial artery pressure and rCBF for the initiation of cortical depolarization in cat MCA occlusion (Date et al., 1984). Our findings demonstrate that even with lower rCBF than the threshold, cortical DC potential sometimes manifests a gradual decrease, which clearly is different from so-called anoxic depolarization. Koroleva and Bures report topographic difference in cortical depolarization in MCA occlusion of rats (Koroleva and Bures, 1996). They found that MCA occlusion evoked a steep, negative deflection of DC potential, which propagated with increasing latencies from the proximal to the distal territories of MCA. In the distal territory, depolarization recovered spontaneously within 60 minutes, and duration of such an initial depolarization decreased with distance from the focus of occlusion. In our experiment, the latency to the onset of the second steep phase of depolarization in Type 1 did not differ between ectosylvian gyrus and suprasylvian gyrus, although the latter gyrus is more distal in MCA territory. Also, Types 1 and 2 did not differ with regard to duration of depolarization, since depolarization continued throughout 60 minutes of ischemic period in all sites in both types, but with regard to the presence or absence of a steep drop of the DC potential. Strong and associates report variations in the time course of pial surface potassium activity during MCA occlusion in cats, which they assumed to reflect [K+]o in the cerebral cortical tissue (Strong et al., 1983). Sustained increases in potassium activity were found mainly in ischemic core such as ectosylvian gyrus and suprasylvian gyrus, and it ranged from monophasic gradual increases to polyphasic increases, including an accelerated phase. Judging from the close relation between [K+]o and cortical DC potential (Hansen, 1978; Harris and Symon, 1984; Hansen, 1985), their finding suggests that progression of tissue depolarization in the core of focal cerebral ischemia is not as homogeneous as that in global cerebral ischemia.
Cortical depolarization is a macroscopic multicellular expression of microscopic cellular electrophysiologic alterations in the tissue (Chen et al., 1993). Tissue depolarization may be determined as a function of the number of depolarized cells as well as the membrane potential of each cell. Therefore, a sudden drop of DC potential in the second phase of Type 1 indicates that most of the cells in the region have started to depolarize at this time point. This catastrophic change seems to distinguish Type 1 from Type 2. In type 2, the number of depolarized neurons and glia seems to increase more gradually than that in Type 1. At 2.5 minutes after the onset of ischemia, Type 1 sites showed 8.9 ± 2.5% (range of 6.5% to 13.0%, and four of five sites were 9.0%) of baseline rCBF, whereas Type 2 sites showed a higher rCBF (16.2 ± 8.2%, range of 4.5% to 28.3%, and five of seven sites were > 13.5%) than Type 1 (P < 0.0005). The CBF threshold for induction of Type 1, therefore, seems to be low (∼10%). This is in a good accordance with the results from cardiac arrest studies, which show the same pattern of steep anoxic depolarization together with complete ischemia. A large variability (6 to 22 mL/100 g/min) of the rCBF threshold for functional disturbance among neighboring neurons was disclosed even in a small cortical region, and selective necrosis of individual neurons in a certain cortical area was found in cerebral cortex in reversible MCA occlusion of cats (Heiss and Rosner, 1983). Cell-specific vulnerability to ischemia was dependent not only on residual rCBF but also on duration of ischemia. Accordingly, the progression of depolarization over a relatively long period after induction of ischemia found in Type 2 sites can be interpreted as an increasing number of disturbed neurons during prolonged ischemia.
The initial transient, small increase in [Ca2+]o before anoxic depolarization has been attributed to shrinkage of extracellular space (Hansen, 1985). Such an initial [Ca2+]o rise also was observed in Types 1 and 2 cortical sites in the current experiments. In cat focal cerebral ischemia, cortical impedance measurement has revealed that 5 minutes after MCA occlusion the extracellular volume in the cerebral cortex decreases from 23.8% to about 17% (Matsuoka and Hossmann, 1982). A simple calculation from this volume change predicts that [Ca2+]o will increase from basal 1.2 mmol/L to 1.6 mmol/L, which is similar to our result. Therefore, in the initial phase, Ca2+ influx does not yet seem to occur. The [Ca2+]o does not necessarily predict the behavior of intracellular Ca2+. However, a sudden drop of [Ca2+]o in Type 1 always happened concomitantly with the steep, negative deflection of the DC potential, suggesting that transmembrane Ca2+ influx was triggered by depolarization of plasma membrane. Both N-methyl-
Recovery of [Ca2+]o during the reperfusion phase was delayed by ∼30 minutes compared with the recovery of the DC potential in Type 1 cortical sites, and ECoG recovery was not present during the observation period. The same chronological order of recovery of parameters were reported in rat cerebral cortex during the recovery phase after 10-minute global cerebral ischemia by neck compression (Siemkowicz and Hansen, 1981). In this model, [K+]o recovered at 4 minutes and [Ca2+]o recovered later at 13 minutes, although EEG recovery was not fully obtained even at 60 minutes. Consequently, Type 1 cortex in focal cerebral ischemia also exerted a recovery phase that is comparable with that of anoxic depolarization in global ischemia.
We have reported an early and transient elevation in cortical NO concentration associated with tissue depolarization in the same cat model of focal cerebral ischemia (Ohta et al., 1996). In the current study, further grouping of the depolarized cortical tissues into two types according to chronological profiles of negative DC deflection extracted a group of cortical sites (Type 2) that exhibited a more persistent increase in NO concentration. In both Types 1 and 2, a rise in NO concentration starts just after MCA occlusion when [Ca2+]o still is increasing and Ca2+ influx is not yet initiated. Since this increase is inhibited by an NO synthase inhibitor,
Under such unfavorable circumstances for NO production, further increase in [Ca2+]i, which is suggested by a marked fall in [Ca2+]o starting 2.5 minutes after MCA occlusion, seems to be no more effective to increase NO production in Type 1. How is NO production sustained in Type 2 cortical sites? In Type 2, rCBF is higher than that in Type 1. It is thus suggested that only neurons that are highly vulnerable to moderate ischemia are depolarized in Type 2 cortical tissue, increasing the cytosolic Ca2+ level and activating constitutive NO synthase. These vulnerable neurons still can get a certain supply of substrates for NO synthesis because of larger residual blood flow. The more neurons are depolarized as the duration of ischemia is prolonged (Heiss and Rosner, 1983), the more NO will be produced in the tissue, which may explain a sustained increase in NO concentration in Type 2 cortical tissue.
A question of whether ischemic penumbra produces NO cannot be answered by the current experiments. Type 3 cortical sites lack both the negative shift of the DC potential and a reduction of ECoG amplitude, and the mean value of rCBF is more than 40%. This indicates that Type 3 sites are localized more peripheral than penumbra zones where there should be no depolarization but apparent reduction in EEG amplitude (Strong et al., 1983). Failure of catching penumbra zones in the current experiments is attributable to the fact that penumbra happens only in a narrow margin around the ischemic core (Obrenovitch, 1995). A possible trigger of [Ca2+]i elevation in ischemic penumbra is the transient passage of spreading depression-like depolarizations across the penumbra zone (Graf et al., 1995), although such depolarizations were not observed in the current experiments.
After reopening of the MCA, NO concentration in Type 1 increases slowly toward the baseline level, which can be explained by a balance among the increasing supply of substrates for NO synthase by recovered rCBF, the normalization of [Ca2+]i by pumping out cytosolic Ca2+ through recovered function of Ca2+-ATPase and 3Na+-Ca2+ exchanger, and the prolonged derangement of optimal conditions for NO synthase. For example, recovery of tissue pH after reperfusion of rat 10-minute global ischemia takes 30 minutes (Siemkowicz and Hansen, 1981). Elevated NO concentration in Type 2 returned to the baseline level in the reperfusion period, probably because of restoration of the normal cytosolic Ca2+ level relieving constitutive NO synthase from its rigorously activated state.
A few studies investigate concentration or production of NO in brain tissue in focal cerebral ischemia. In these reports, NO level was measured at single points in the ischemic cortex (Malinski et al., 1993; Zhang, et al., 1995; Lin, et al., 1996; Ohta et al., 1996) or in the whole hemispheric preparation (Kader et al., 1993; Sato et al., 1994). Therefore, NO levels were not compared between different places in cerebral cortex or between different densities of ischemia. We have for the first time provided multisite measurement in cerebral cortex of the relatively large brains of cats, which has enabled us to measure simultaneously and continuously rCBF, DC potential, ECoG, and [Ca2+]o together with NO concentration, and to disclose variations of NO concentration changes in the core and periphery of focal cerebral ischemia in relation to severity of ischemia and of ion homeostasis disturbance. The current experiments provide evidence that cerebral cortex in focal ischemia is heterogeneous in terms of NO production ranging from continuous reduction to sustained overproduction. This finding may explain diverse outcome of treatment of focal cerebral ischemia after application of NO synthase inhibitors (Dawson, 1994).
In conclusion, the results of the current study document that other than anoxia or global ischemia, various patterns of cortical depolarization exist in the core of focal ischemia. The close relation to patterns of alterations in rCBF, Ca2+ homeostasis, and NO production indicates the validity of this classification as a clue to analyze the topographic and chronological heterogeneity of the pathophysiologic mechanism of focal cerebral ischemia.