
Abstract
Cell membrane depolarization and tissue acidosis occur rapidly in severely ischemic brain. Preischemic hyperglycemia is recognized to increase ischemic tissue acidosis and the present studies were undertaken to correlate depolarization and tissue acidosis during acute focal cerebral ischemia and hyperglycemia. We used a dual-label autoradiography method to simultaneously measure the in vivo distribution of [3H]nimodipine and [14C]DMO (5,5-dimethyl-2,4-oxazolidinedione) in brain to identify regions of ischemic depolarization and measure regional net tissue pH. Regional cerebral blood flow (CBF) was measured in separate studies. Measurements were made 30 minutes after combined middle cerebral artery and ipsilateral common carotid artery occlusion in normoglycemic and hyperglycemic rats. Tissue pH in the ischemic cortex was depressed to 6.76 ± 0.11 in normoglycemic rats (n = 12) and 6.57 ± 0.13 in hyperglycemic rats (n = 12), with significantly greater acidosis in the hyperglycemic group (P < 0.001). In contrast the ratio of [3H]nimodipine uptake in the ischemic cortex relative to the contralateral nonischemic cortex was significantly greater in normoglycemic (1.83 ± 0.45) than hyperglycemic (1.40 ± 0.50) rats (P < 0.05). Within this region of ischemic cortex CBF was 31 ± 22 mL/100 g in normoglycemic rats (n = 8) and 33 ± 22 mL/100 g/min in hyperglycemic rats (n = 9). Cerebral blood flow did not differ between these two groups in any region. Thus hyperglycemia reduced the extent of ischemic depolarization within the cortex during the first 30 minutes of focal cerebral ischemia. This effect may be related to the increased tissue acidosis or to other factors that may lessen calcium influx and preserve cellular energy stores in the ischemic cortex of the hyperglycemic rats.
Keywords
Increased free intracellular calcium ([Ca2+]i) and tissue acidosis occur rapidly during severe cerebral ischemia. Ischemic depolarization and glutamate release elevate [Ca2+]i and injure the ischemic neuron (see reviews by Rothman and Olney, 1986; Siesjö and Bengtsson, 1989). Ischemia enhances glycolysis and, with hydrolysis of high energy phosphates, results in accumulation of lactate and H+, producing tissue acidosis that is also harmful to ischemic brain (see reviews by Katsura et al., 1992; Siesjö et al., 1993).
Preischemic hyperglycemia results in greater lactate levels and tissue acidosis in ischemic brain (Marsh et al., 1986; Coombs et al., 1990) and is well recognized to be detrimental in global cerebral ischemia (Ginsberg et al., 1980; Pulsinelli et al., 1982). It is assumed that this harmful effect is mediated through increased tissue acidosis (Siesjö et al., 1993). Similar levels of tissue acidosis caused by hypercapnia without hyperglycemia also worsen ischemic outcome after global ischemia (Katsura et al., 1994). Hyperglycemia is also detrimental in focal cerebral ischemia (Nedergaard, 1987; de Courten-Myers et al., 1988; Duverger and MacKenzie, 1988) but conflicting observations of a beneficial effect are also reported (Ginsberg et al., 1987; Zasslow et al., 1989; Kraft et al., 1990). Prado et al. (1988) have suggested that residual collateral perfusion of focally ischemic brain during hyperglycemia may be a factor in aggravating acidosis and ischemic injury.
The relationship between acidosis and calcium channel function may play an important role in determining the outcome of ischemic injury during hyperglycemia. In cortical cell cultures extracellular acidosis (pH 6.5) reduced N-methyl-
The current studies were undertaken to assess the effect of preischemic hyperglycemia on ischemic depolarization and to correlate this with tissue acidosis after 30 minutes of focal cerebral ischemia in the rat. Using a dual-label autoradiography technique we have simultaneously measured the in vivo distribution of the 1,4-dihydropyridine L-type voltage-sensitive calcium channel (VSCC) antagonist [3H]nimodipine and the volatile weak acid [14C]DMO (5,5-dimethyl-2,4-oxazolidinedione) in the rat brain. Increased brain tissue content of [3H]nimodipine has been reported previously in acutely ischemic cortex to be an early and sensitive indicator of impending injury (Hakim and Hogan, 1991) and a consequence of increased binding to the L-type VSCC (Hogan et al., 1991). As affinity of the L-type VSCC to bind 1,4-dihydropyridine VSCC antagonists increases many fold in depolarized cell membranes (Bean 1984; Wei et al., 1989), increased in vivo uptake of [3H]nimodipine in acute cerebral ischemia is postulated to identify regions of ischemic depolarization with prior and ongoing activation of L-type VSCC (Hakim and Hogan, 1991). Net regional brain tissue pH may be determined from measurements of in vivo distribution of [14C]DMO in brain (Kobatake et al., 1984), and the dual-label autoradiography measurements were used to correlate [3H]nimodipine uptake with tissue pH in both normoglycemic and hyperglycemic rats. We observed increased tissue acidosis and decreased [3H]nimodipine uptake in the ischemic cortex after preischemic hyperglycemia. Separate studies measuring regional cerebral blood flow (CBF) confirmed no difference in the ischemic insult between the normoglycemic and hyperglycemic groups. We conclude that hyperglycemia can delay ischemic tissue depolarization and calcium channel activation in acute focal ischemia.
METHODS
Adult male 250-g Sprague Dawley rats (Charles River, Montreal, QC, Canada) were fasted overnight and then anesthetized with halothane (4% induction, 0.75% maintenance) and ventilated with a 30% O2–70% N2O gas mixture. Intravenous succinylcholine at 0.25 mg/h was used to obtain partial neuromuscular blockade during ventilation.
Focal cerebral ischemia and hyperglycemia
Under anesthesia femoral arterial and venous cannulae were placed to measure mean arterial blood pressure, obtain blood samples and administer drugs, glucose and radiotracers. Arterial blood gases were monitored and ventilator settings adjusted accordingly. The left middle cerebral artery (MCA) was exposed (Tamura et al., 1981) and occluded by two microaneurysm clips (Sundt #1, Codman, Peterborough, Ontario, Canada) placed in tandem on the vessel proximal and distal to the olfactory tract. The ipsilateral common carotid artery (CCA) was simultaneously occluded with an aneurysm clip (George Tiemann and Co., Hauppauge, NY, U.S.A.) to produce a combined MCA + CCA occlusion. The clips were kept in place for 30 minutes, at which time the study was terminated by decapitation. Brain temperature was monitored using a 300-μm-diameter thermocouple probe placed into exposed cortex adjacent to the MCA occlusion site and a warming blanket and radiant heat were used to maintain this temperature between 36° and 37°C.
Hyperglycemia was established before MCA + CCA occlusion by continuous intravenous infusion of a 50% glucose solution in normal saline at an initial rate of 1.2 mL/h. The infusion was started 54 ± 9 minutes before MCA + CCA occlusion and the rate was adjusted to maintain blood glucose concentration between 2 and 3 times control levels. Normoglycemic rats were infused with normal saline intravenously at the same rate.
Cerebral blood flow measurements
Regional CBF was measured using the method of Sakurada et al. (1978). An intravenous ramp infusion of 30 μCi of [14C]iodoantipyrine ([14C]IAP) (57 mCi/mmol, Amersham International PLC, Little Chalfont, England) in 1.6 mL of normal saline was started 29 minutes after MCA + CCA occlusion and continued for 1 minute. The rats were then decapitated and the brains rapidly removed and frozen. Both normoglycemic (n = 8) and hyperglycemic (n = 9) rats were studied.
Simultaneous tissue pH and [3H]nimodipine uptake measurements
A dual-label autoradiographic technique was developed to simultaneously determine regional tissue pH and [3H]nimodipine uptake during focal cerebral ischemia. In vivo uptake of [3H]nimodipine was measured as described by Hakim and Hogan (1991). Net tissue pH was calculated from the in vivo uptake of the volatile radiotracer [14C]DMO (Kobatake et al., 1984), which has been previously used in dual-label studies with a second nonvolatile radiotracer (Hakim and Arrieta, 1986).
Preliminary studies. To determine the optimal dosage and sublimation period for [14C]DMO a normal rat was infused intravenously with either 2 or 20 μCi of [14C]DMO (51 mCi/mmol, Amersham) 1 hour before decapitation or with 250 μCi of [3H]nimodipine (130 Ci/mmol, NEN-DuPont, Boston, MA, U.S.A.) 30 minutes before decapitation. The brains were rapidly removed and frozen, and 20-μm cryostat sections were apposed to both Kodak SB5 film (Picker International, Brampton, Ontario, Canada) and tritium-sensitive Hyperfilm (Amersham, Etobicoke, Ontario, Canada). To assess for potential loss of [14C]DMO during the prolonged exposure to the Kodak SB5 film 85 μCi of [14C]DMO was infused intravenously and allowed to circulate for 1 hour in a normoglycemic and a hyperglycemic rat undergoing 30 minutes of focal ischemia. Twenty-micrometer brain sections were obtained and repeatedly apposed to a new Kodak SB5 film at 4°C every 5 to 6 days to obtain nine sequential image sets of [14C]DMO distribution for 47 days.
[3H]Nimodipine uptake and tissue pH. An intravenous bolus of 4 μCi of [14C]DMO in 500 μL of normal saline was infused 30 minutes before MCA + CCA occlusion. Plasma [14C]DMO concentration was measured 30 minutes and 1 minute before study termination. Immediately after MCA + CCA occlusion, 200 μCi [3H]nimodipine in 600 μL of carrier (BAY e9736 placebo, Bayer, Etobicoke, Ontario, Canada) was infused intravenously for 3 minutes and allowed to circulate for 30 minutes so that an equilibrium of distribution between plasma and brain was approached (Hogan et al., 1991). Plasma [3H]nimodipine concentration was measured 1 minute before study termination. All rats were decapitated 30 minutes after MCA + CCA occlusion and the brains were rapidly removed and frozen. Activity of 14C and 3H in plasma was determined using dual-label liquid scintillation counting with appropriate quench correction verified with internal standards. Both normoglycemic (n = 12) and hyperglycemic (n = 12) rats were studied.
Image analysis
Autoradiographic images at four coronal levels in the brain were digitized using a microcomputer-based image analysis system (Imaging Research Inc., St. Catharines, Ontario, Canada) and regional radiotracer content was measured using a standardized region of interest (ROI) template (Fig. 1). At each coronal level 14C activity was averaged over three adjacent aligned images and tritium activity was measured on one aligned image. Regional CBF and net tissue pH were calculated from the autoradiographs on SB5 film using the measured activity within each ROI along with plasma radiotracer and pH measurements. To normalize measurements of brain tissue [3H]nimodipine, regional volumes of distribution were calculated as the ratio of tissue [3H]nimodipine content in each ROI to the plasma [3H]nimodipine concentration at study termination. (Gjedde and Wong, 1990) Previously determined [3H]nimodipine metabolite correction factors for plasma and brain were applied (Hogan et al., 1991).
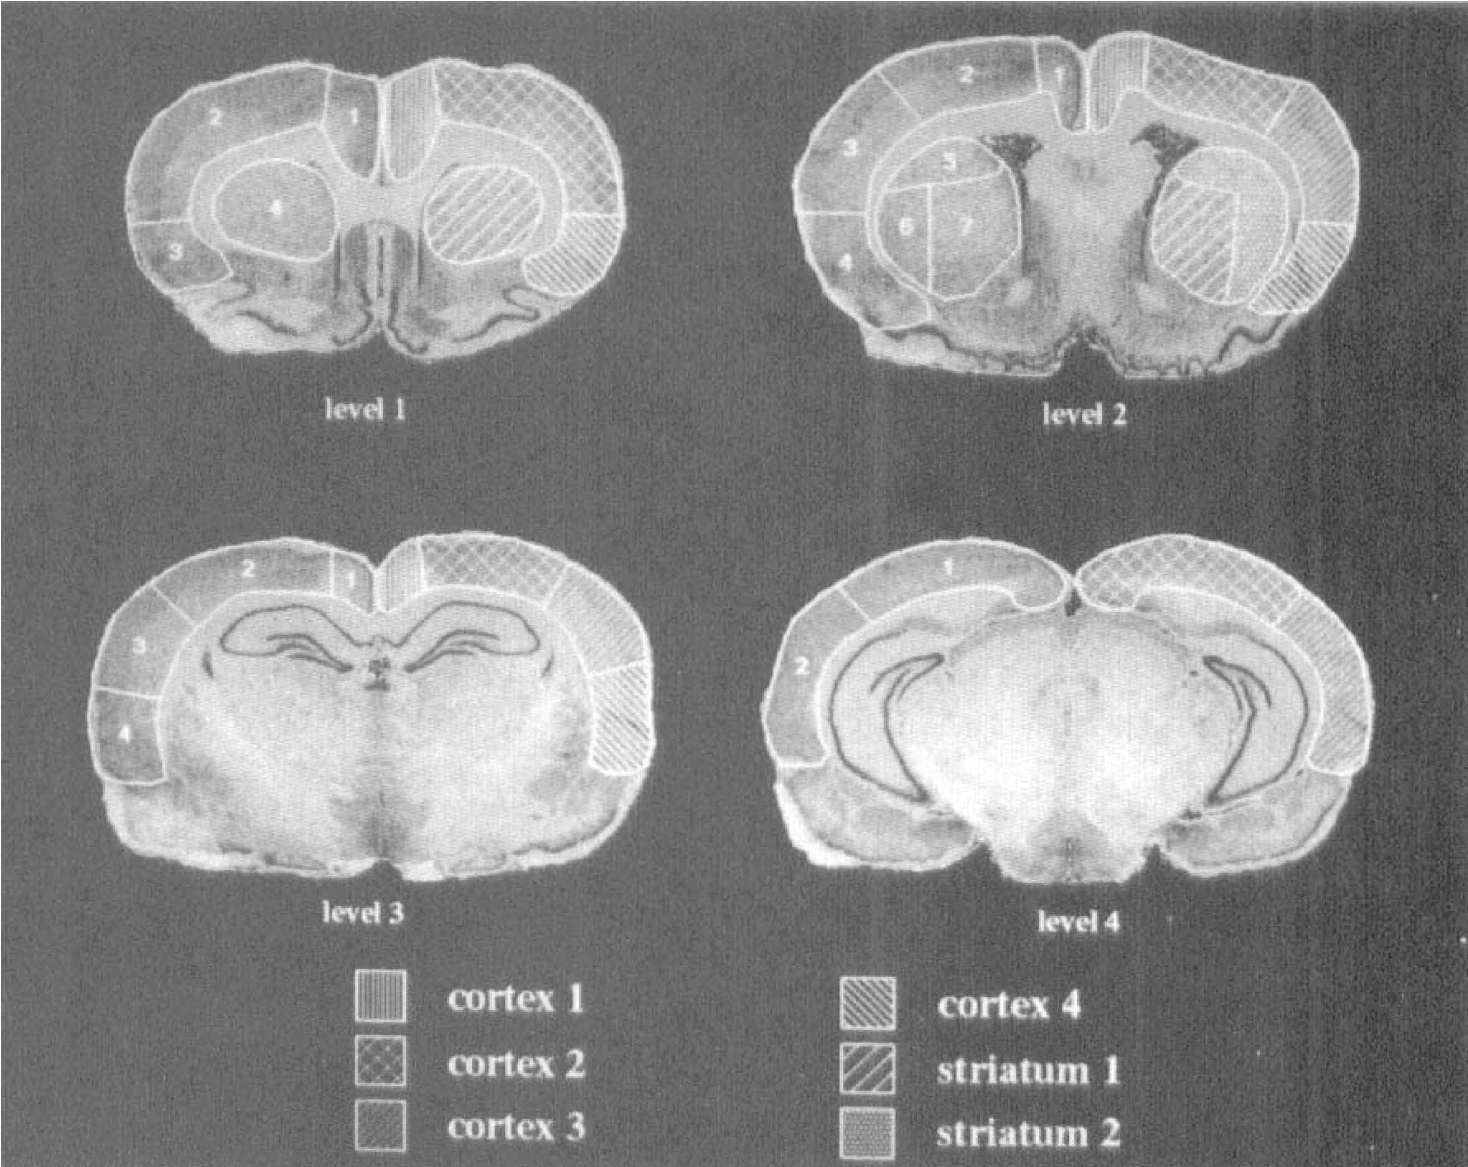
The region of interest (ROI) and volume of interest (VOI) templates at four coronal levels in the rat brain are shown. The ROI template is on the left side of the sections with arbitrary numbering used to identify each ROI within a section. The ROI groupings used to define the six volumes of interest (VOI) are on the right side of the sections and are labeled at the bottom of the figure.
A K-means cluster analysis was performed on the average of the logarithm of the ratio of ischemic to nonischemic hemisphere CBF values for all ROI on two variables representing the normoglycemic and hyperglycemic groups. The clusters of ROI obtained were further subdivided to separate cortical and striatal ROI. The resulting set of ROI clusters, termed volumes of interest (VOI), represented a fixed grouping of ROI for all studies over which CBF, pH, and [3H]nimodipine volume of distribution ROI measurements were averaged. Differences between groups were analyzed by repeated measures analysis of variance (ANOVA) (BMDP Statistical Software, Inc, Los Angeles, CA, U.S.A.). To control the level of type 1 error during multiple within-group comparisons, the Greenhouse-Geisser adjusted degrees of freedom and Neumann-Keuls procedures were used. For between-group comparisons, we used the pooled ANOVA error and adjustment to the degrees of freedom (Howell, 1992).
To more closely examine the relationship between tissue pH and [3H]nimodipine tissue content in ischemic cortex, paired pH and [3H]nimodipine volume of distribution measurements were obtained using a template consisting of a grid of contiguous 0.09-mm2 sampling regions. To obtain data over a wide range of severity of ischemia this template was applied within ROI 1, 2, and 3 within the ischemic cortex at coronal level 2. For each rat the slope of the linear fit to the paired [3H]nimodipine volume of distribution–pH measurements was determined. These were averaged for the normoglycemic and hyperglycemic groups and compared using a Student's t-test. To further assess differences in the relationship between [3H]nimodipine volume of distribution and tissue pH a subset of 10 measurement pairs was randomly selected from the set of paired measurements for each rat and analyzed using repeated measures multivariate ANOVA (SPSS Inc., Chicago, IL, USA).
All results are expressed as mean ± standard deviation.
RESULTS
Physiologic measurements
In the dual-label [14C]DMO – [3H]nimodipine studies average values for arterial blood gases in the normoglycemic group (pH = 7.40 ± 0.03, Pa
Plasma glucose levels before glucose infusion did not differ between normoglycemic and hyperglycemic groups in the dual-label [14C]DMO – [3H]nimodipine studies (6.2 ± 1.2 mmol/L; n = 24) or [14C]IAP CBF studies (6.8 ± 1.7 mmol/L; n = 17). Plasma glucose remained constant in the sham-perfused normoglycemic groups but increased to 17 ± 2.8 mmol/L (n = 12) in the dual-label studies and 16.4 ± 1.6 mmol/L (n = 9) in the CBF studies after glucose infusion (P < 0.01).
Cerebral blood flow measurements
Cluster analysis on the mean of the logarithm of the CBF ratio in the normoglycemic and hyperglycemic studies showed the within-cluster sum of squares to decline most rapidly up to four clusters. These four initial ROI clusters were further subdivided to separate cortical from striatal structures, resulting in six final VOI; cortex 1, cortex 2, cortex 3, cortex 4, striatum 1, and striatum 2, as shown in Fig. 1. Table 1 summarizes the CBF data from each VOI. Cerebral blood flow did not differ in corresponding VOI between normoglycemic and hyperglycemic rats. No significant regional differences in CBF were observed in the nonischemic hemisphere in either group. Compared with the contralateral hemisphere, CBF was significantly depressed in cortex 2, cortex 3, cortex 4, striatum 1, and striatum 2 in the ischemic hemisphere in both groups. Within the ischemic hemispheres CBF was significantly depressed in all VOI compared with cortex 1 (corresponding to the cingulate cortex). The lowest CBF values were observed in ischemic cortex 4, corresponding to the cortex just distal to the MCA occlusion site.
Average cerebral blood flow (mL/100g/min) after 30 minutes of focal cerebral ischemia for each volume of interest in the normoglycemic and hyperglycemic rats
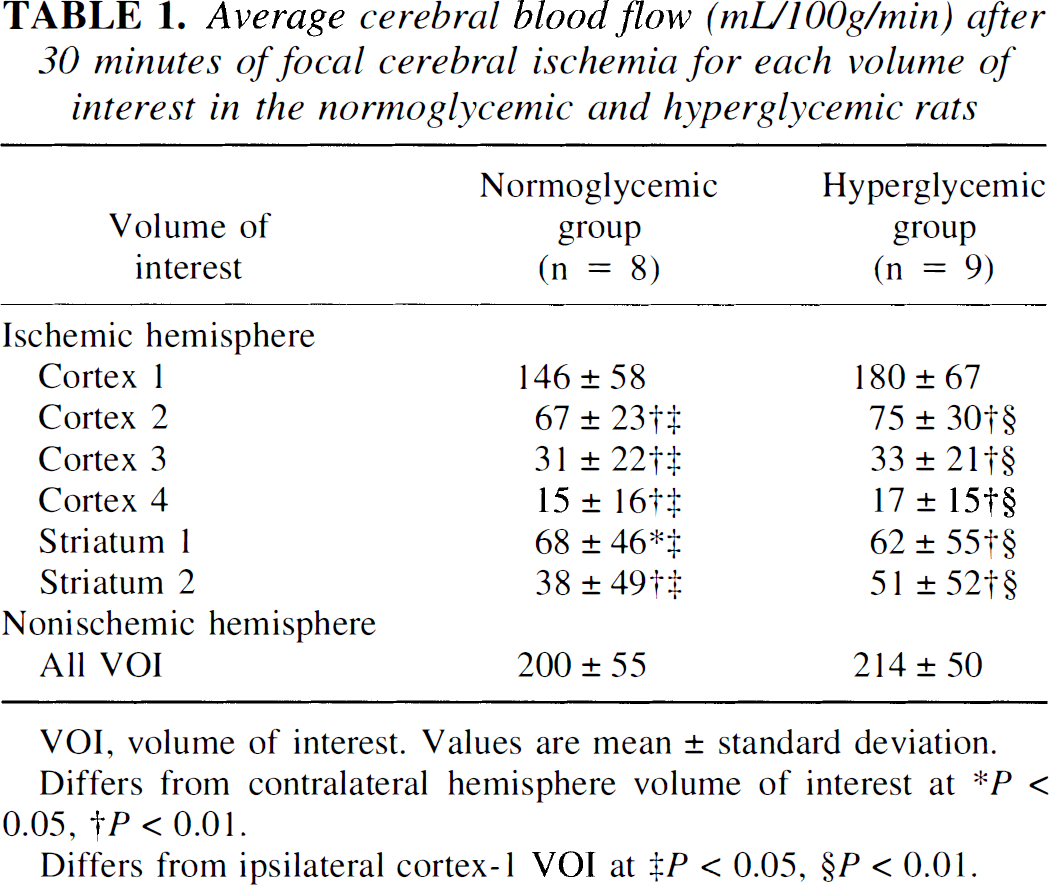
VOI, volume of interest. Values are mean ± standard deviation.
Differs from contralateral hemisphere volume of interest at *P < 0.05, †P <0.01.
Differs from ipsilateral cortex-1 VOI at ‡P < 0.05, §P < 0.01.
Dual-label methodology
Autoradiographs obtained by apposing 20-μm brain sections from a normal rat infused with 250 μCi [3H]nimodipine to SB5 film up to 60 days did not show any visible tritium signal. Sections obtained from a normal rat infused with either 2 or 20 μCi [14C]DMO that were exposed to the same film showed 14C activity; however, the signal was weak in sections from the rat infused with 2 μCi. After a 40- to 60-day sublimation period autoradiographs of 20- and 40-μm-thick sections obtained from a rat infused with 2 μCi [14C]DMO produced no visible signal after a 60- to 90-day exposure to Hyperfilm. However, similarly treated 20-μm sections from a rat infused with 20 μCi [14C]DMO resulted in a visible signal on Hyperfilm that averaged 14% of the nonischemic hemisphere [3H]nimodipine signal in two normoglycemic rats. Subsequent studies were performed using 4 μCi [14C]DMO to produce an adequate 14C signal for image analysis and negligible 14C activity on the tritium images after sublimation of [14C]DMO. Images calibrated using 14C standards in the studies in which both 14C and 3H standards were apposed to SB5 film demonstrated a tritium signal of 0.0015 ± 0.0002 (n = 11) nCi per actual nCi of 3H present. Thus, in the nonischemic cortex the percentage of activity measured in the SB5 image as a result of 3H was 3.6% ± 0.8% (n = 6) in the normoglycemic studies and 4.8% ± 1.2% (n = 5) in the hyperglycemic studies, resulting in an overestimation of tissue pH by 0.019 ± 0.005 and 0.027 ± 0.01 pH units in these groups. In the region of greatest [3H]nimodipine uptake in the ischemic hemisphere the activity resulting from 3H was 11.0% ± 2.7% in the normoglycemic group and 16.1% ± 5.3% in the hyperglycemic group. Net tissue pH in this region was overestimated by 0.065 ± 0.020 and 0.122 ± 0.048 pH units in these groups (P < 0.05). The two studies in which repeated measurements of [14C]DMO activity for 47 days were obtained demonstrated the average decrease in calculated tissue pH as a result of [14C]DMO loss to be 0.013 pH units in the normoglycemic study and 0.005 pH units in the hyperglycemic study.
[3H]Nimodipine–[14C]DMO uptake studies
Autoradiographs of [3H]nimodipine and [14C]DMO uptake at coronal levels 2 and 3 from a selected normoglycemic study are shown in Fig. 2. [3H]Nimodipine uptake was increased in the cortex and striatum of the ischemic hemisphere whereas [14C]DMO uptake was depressed in these regions indicating increased tissue acidosis.
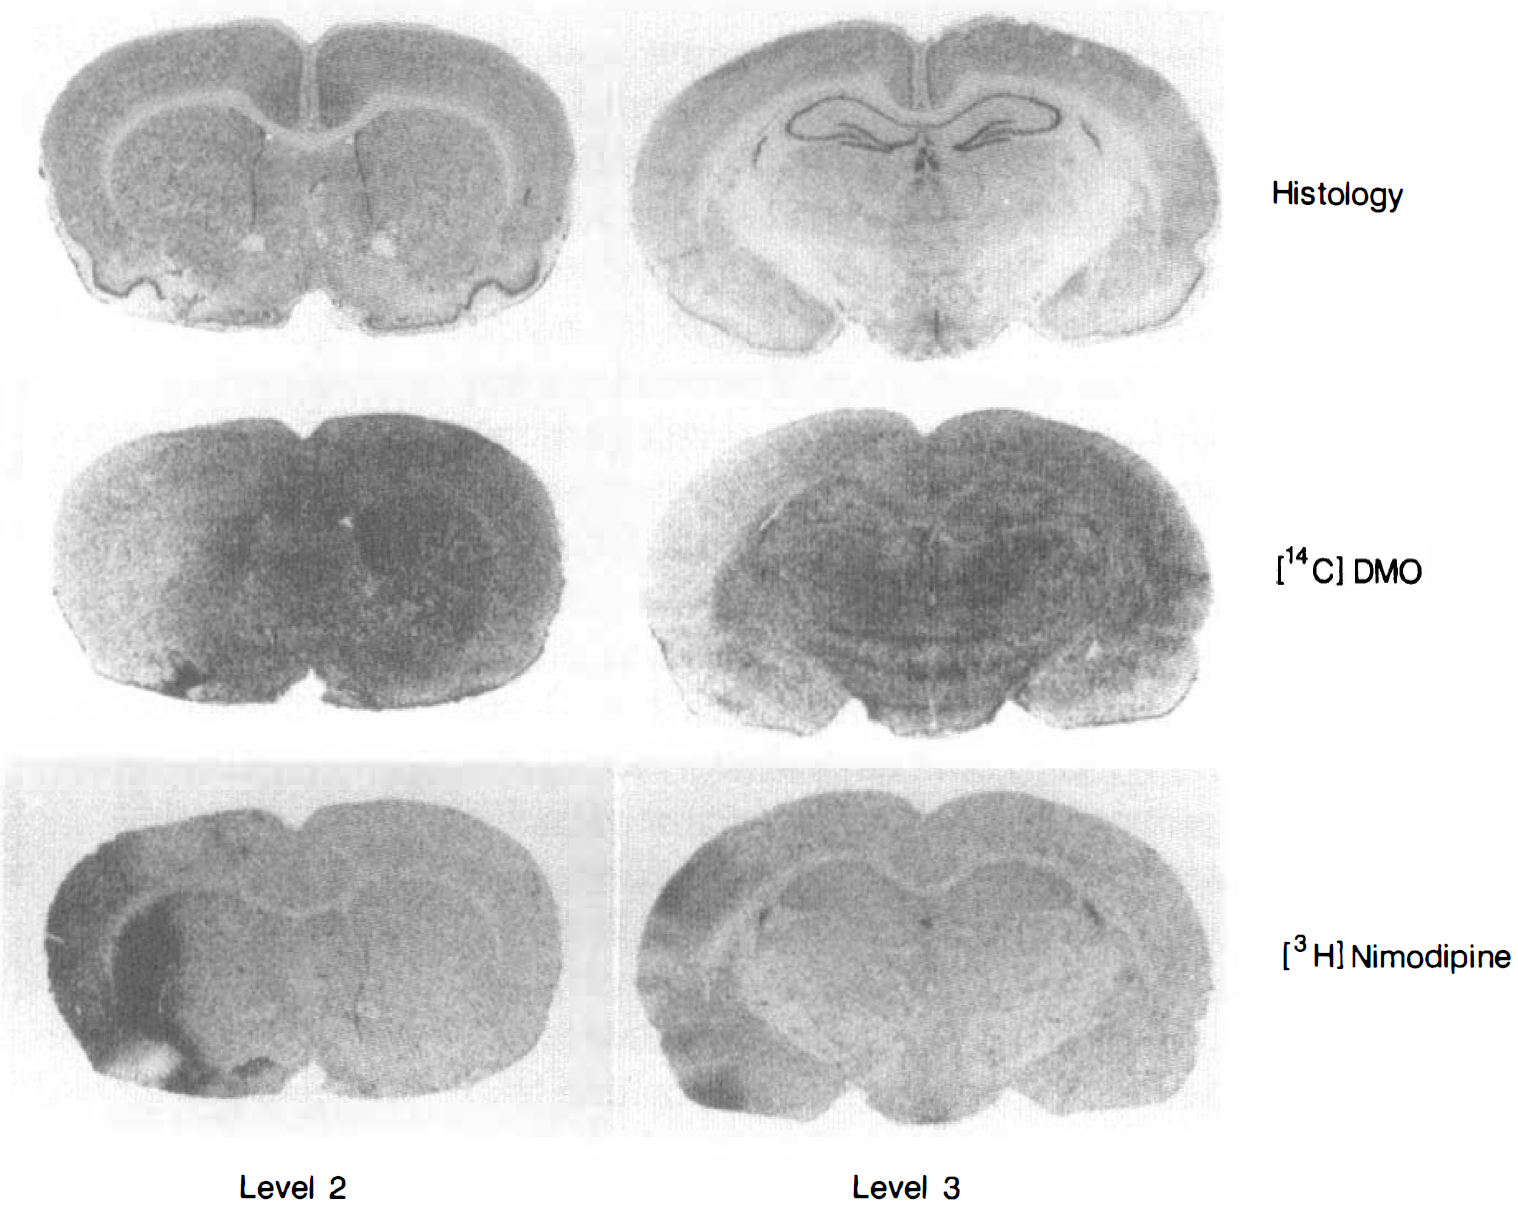
Histologic and autoradiographic sections at coronal level 2 (left column) and coronal level 3 (right column) from a selected normoglycemic rat. The images in the second row are averages of three adjacent [14C]DMO autoradiographs at the two coronal levels. The [3H]nimodipine autoradiographs shown in the third row were obtained after sublimation of [14C]DMO. The top row shows images of cresyl violet staining on nearby adjacent tissue sections and serves as an anatomic guide.
pH measurements. Figure 3A summarizes regional pH measurements obtained from the normoglycemic group of studies. Similar data from the hyperglycemic group are shown in Fig. 3B. Within VOI in the nonischemic contralateral hemisphere pH values ranged from 6.91 ± 0.13 to 6.97 ± 0.10 in the normoglycemic group and from 6.83 ± 0.13 to 6.93 ± 0.08 in the hyperglycemic group, with no significant differences found either within or between groups. In the ischemic cortex of the normoglycemic group, net tissue pH was most depressed in cortex 3 (6.76 ± 0.11) and cortex 4 (6.80 ± 0.14) and was significantly lower than that observed in cortex 1 of the ischemic hemisphere (P < 0.05). In the hyperglycemic group pH was significantly depressed in ischemic hemisphere cortex 3 (6.57 ± 0.13), cortex 4 (6.57 ± 0.15), and striatum 2 (6.73 ± 0.14) compared with the corresponding contralateral hemisphere VOI (P < 0.01). Within the ischemic hemisphere, cortex 3 and cortex 4 pH levels were significantly lower than pH in cortex 1 (P < 0.01). Comparison of tissue pH between the normoglycemic and hyperglycemic groups showed significantly greater acidosis in the ischemic hemisphere VOI of cortex 2 (P < 0.05) and cortex 3 and cortex 4 (P < 0.001) of the hyperglycemic group.
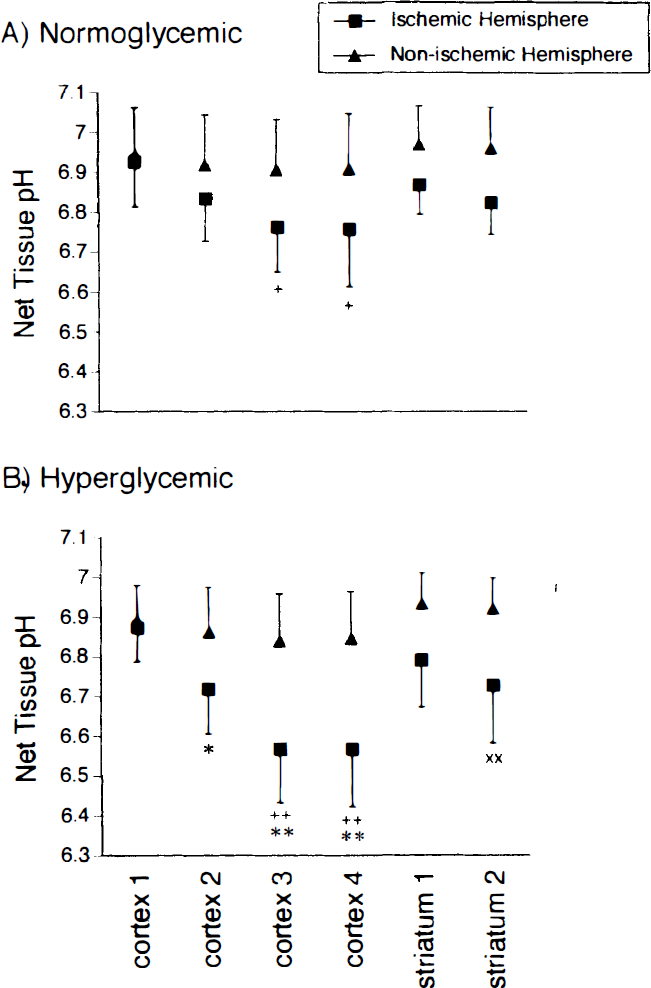
Net tissue pH calculated from [14C]DMO uptake into each volume of interest in
[ 3 H]Nimodipine uptake. In normoglycemic rats the volume of distribution of [3H]nimodipine ranged from 0.98 ± 0.16 to 1.14 ± 0.19 mL/g in nonischemic hemisphere VOI and increased to 1.74 ± 0.29 mL/g in ischemic hemisphere cortex 3 (P < 0.05). In hyperglycemic rats the volume of distribution ranged from 1.03 ± 0.15 to 1.20 ± 0.17 mL/g in the nonischemic hemisphere and was 1.42 ± 0.45 mL/g in cortex 3 of the ischemic hemisphere. To reduce between-subject variation in nimodipine volume of distribution data the ratio of [3H]nimodipine volume of distribution in the ischemic hemisphere relative to that in the nonischemic hemisphere ([3H]nimodipine uptake ratio) was calculated for each VOI and is summarized in Fig. 4 for both the normoglycemic and hyperglycemic groups. In the normoglycemic rats this ratio was increased in cortex 3 (P < 0.01) and cortex 4 (P < 0.05) compared with cortex 1 and striatum 2. In the hyperglycemic rats the ratio was highest in cortex 3 but this was not significantly different from the values observed in the other VOI. Comparing corresponding VOI in the two study groups demonstrated the uptake ratio to be greater in normoglycemic rats (1.83 ± 0.45) compared with hyperglycemic rats (1.40 ± 0.50) in cortex 3 (P < 0.05).
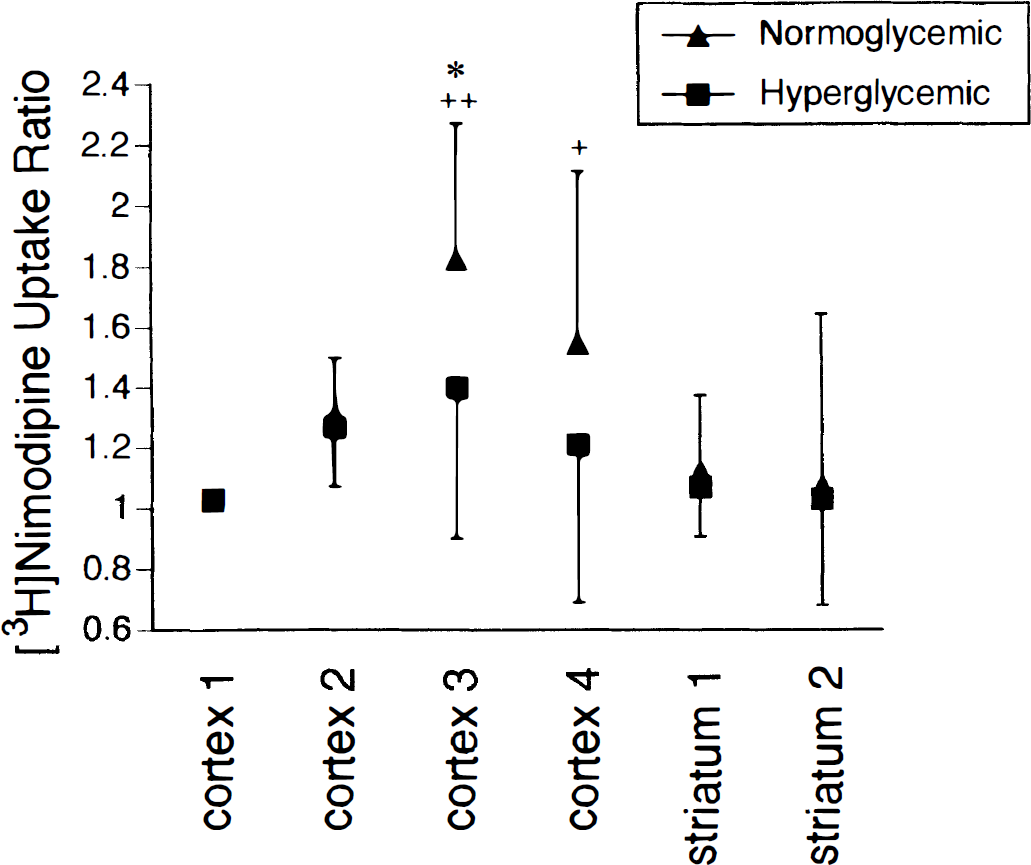
Ratio of [3H]nimodipine uptake in ischemic hemisphere volumes of interest (VOI) over corresponding nonischemic hemisphere VOI in normoglycemic (n = 12) and hyperglycemic (n = 12) studies (mean ± standard deviation). Within the normoglycemic studies this ratio differs from cortex 1 and striatum 2 values at +P < 0.05 and ++P < 0.01. Between the normoglycemic and hyperglycemic groups the ratio for cortex 3 differs at *P < 0.05.
An average of 138 ± 13 paired pH–[3H]nimodipine volume of distribution measurements were obtained from 0.09-mm2 sampling areas in ROI 1, 2, and 3 (coronal level 2) in the ischemic hemisphere cortex in each rat and these data are shown in Fig. 5. The volume of distribution of [3H]nimodipine was averaged over 0.1 pH units from pH 6.3 to 7.1 and was observed to increase with decreasing pH in the normoglycemic group. The average slope of the linear fit between [3H]nimodipine volume of distribution and pH differed significantly between the two groups and was −3.5 ± 1.5 mL/g per pH unit in the normoglycemic rats and −0.9 ± 1.3 mL/g per pH unit in the hyperglycemic rats (P < 0.01). Multivariate repeated measures ANOVA on the randomly selected subset of paired dependent measures (volume of distribution and tissue pH) demonstrated a significant difference (P = 0.006) between the normoglycemic and hyperglycemic rats. Univariate ANOVA showed a significant effect for both pH (P = 0.033) and nimodipine volume of distribution (P = 0.008) between these two groups. A stepdown analysis using pH as a covariate (Tabachnick and Fidell, 1989) demonstrated a significant effect for [3H]nimodipine volume of distribution between the groups independent of pH change (P = 0.014). Thus the relationship between nimodipine uptake and net tissue pH in ischemic brain, as estimated by the slope of a linear fit, differs between normoglycemia and hyperglycemia. Furthermore, changes in nimodipine uptake and tissue pH contribute independently to the observed difference between these two groups.
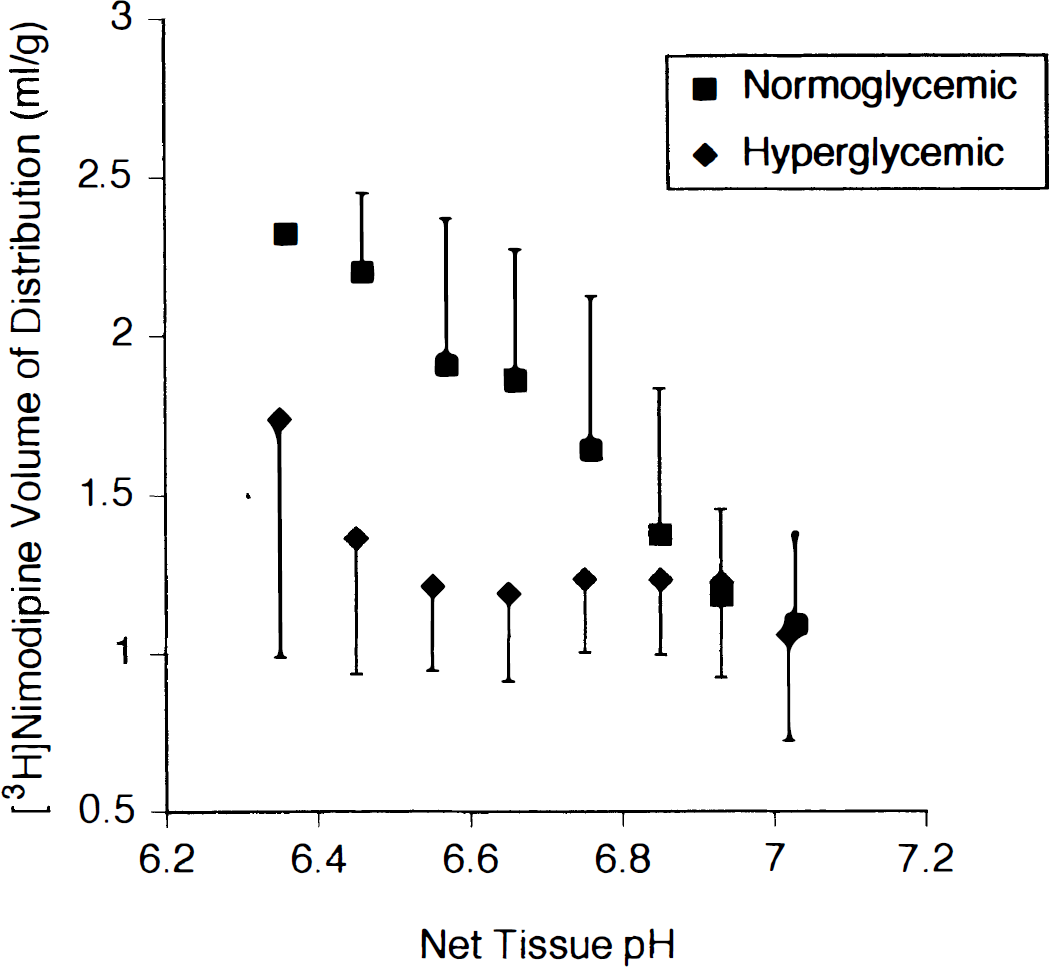
[3H]Nimodipine volume of distribution (mL/g) plotted against net tissue pH data from normoglycemic (n = 12) and hyperglycemic (n = 12) rats. Data were obtained from multiple paired measurements of [3H]nimodipine and [14C]DMO content in contiguous 0.09-mm2 sample regions in the cortex of the ischemic hemisphere at the level of the middle cerebral artery occlusion (coronal level 2). Within each study [3H]nimodipine volumes of distribution measurements are grouped in 0.1-pH unit bins and the mean value of each group then averaged across all studies to obtain the means and standard deviations shown.
DISCUSSION
Simultaneous measurements of regional brain tissue pH and [3H]nimodipine volume of distribution after 30 minutes of focal cerebral ischemia have been performed using dual-label autoradiography in both normoglycemic and hyperglycemic rats. Tissue acidosis was observed in ischemic brain in all studies but was significantly greater in hyperglycemic rats compared with normoglycemic rats. In contrast, in vivo uptake of [3H]nimodipine was significantly greater in the ischemic cortex of the normoglycemic rats. In the normoglycemic group [3H]nimodipine uptake was increased in cortical regions showing greater tissue acidosis, whereas in the hyperglycemic group [3H]nimodipine uptake did not increase with increasing acidosis. Regional CBF measurements did not differ between the normoglycemic and hyperglycemic groups. These data demonstrate that the relationship between [3H]nimodipine uptake and tissue pH is dependent on plasma glucose during acute focal cerebral ischemia, and that regional ischemic tissue depolarization is delayed with preischemic hyperglycemia.
Similar to previous reports (Nakai et al., 1988; Berger and Hakim, 1989), analysis of the VOI data showed no effect of plasma glucose on net tissue pH in nonischemic brain whereas tissue acidosis observed in ischemic brain regions was significantly greater in the hyperglycemic rats. The equilibrium volume of distribution of [3H]nimodipine in both ischemic and nonischemic brain in the normoglycemic rats was similar to previously reported observations (Hogan et al., 1991). Hyperglycemia did not change the [3H]nimodipine volume of distribution in nonischemic brain, but it significantly suppressed increased uptake into ischemic cortex. The multiple paired tissue pH and [3H]nimodipine volume of distribution measurements from the ischemic cortex demonstrated a significant effect of plasma glucose on the relationship between these measures. These data sets were obtained from cortex within the ischemic hemisphere with CBF values ranging from near normal to ischemic levels. The image sample size of 0.09 mm2 (81 pixels) was arbitrarily chosen to be large enough to reduce random variations arising from fluctuations in autoradiograph pixel intensity but small enough to avoid partial volume effects that occur when template regions encompass both normal and ischemic brain regions. In this manner the effect of between-subject variations in extent of ischemia inherent in the focal ischemia model was reduced when comparing the data between groups. The multivariate analysis of these data demonstrated that [3H]nimodipine uptake contributed to the difference between the normoglycemic and hyperglycemic groups independently of change in pH.
Regional CBF did not differ between normoglycemic and hyperglycemic rats in any VOI. Therefore the observed difference in [3H]nimodipine uptake between these groups cannot be attributed to altered distribution of ligand or differing severity of ischemic insult. We observed no change in plasma tritium activity nor differences in volumes of distribution of [3H]nimodipine in nonischemic brain regions between normoglycemic and hyperglycemic rats to indicate altered metabolism of [3H]nimodipine in the two groups. Differences in uptake of [3H]nimodipine cannot be attributed to a direct effect of pH on the association of this radioligand with the L-type VSCC because increased uptake was not suppressed in the normoglycemic group even when regional pH was as low as 6.4 (Fig. 5). Therefore, we conclude that the difference in [3H]nimodipine uptake between the normoglycemic and hyperglycemic rats represents a change in the physiologic state of the acutely ischemic cortex in the hyperglycemic rat. In view of the known dependence of 1,4-dihydropyridine binding to L-type VSCC on membrane polarization (Wei et al., 1989), we interpret the present results to indicate less cortical depolarization after 30 minutes of focal ischemia with hyperglycemia.
The delay in depolarization with hyperglycemia observed here is consistent with previous reports. Ekholm et al. (1993) observed depolarization, as measured by a sudden rise in extracellular potassium [K+]e, to occur at 66 seconds after the onset of global ischemia in normoglycemic rats compared with 111 seconds in hyperglycemic rats. Depletion of ATP was also delayed by hyperglycemia in these studies. However, ATP was ∼30% of control levels at the time of ischemic depolarization independent of plasma glucose concentration. Compared with normoglycemic rats, in hyperglycemic rats Silver and Erecińska (1994) reported less increase in [K+]e at 4 minutes after onset of global ischemia, but this difference disappeared after 10 minutes of ischemia. Similar studies in focal cerebral ischemia are limited. Cerebral blood flow reduction in focal ischemia is generally less severe than in global ischemia and the time to ATP depletion and ischemic depolarization may be more prolonged. Studies of in vivo [3H]nimodipine uptake in normoglycemic rats are consistent with depolarization occurring in the ischemic cortex between 5 and 15 minutes after MCA + CCA occlusion (Hakim and Hogan, 1991; Hogan and Hakim, 1992). Folbergrová et al. (1992) report a rapid fall in cortical ATP levels within 5 minutes of onset of focal ischemia in the normoglycemic rat although ATP levels were only partially depleted after 30 minutes of ischemia in the hyperglycemic rat. Thus the delay in depolarization in hyperglycemia may correlate with better preservation of ATP levels. Our observation of greater cortical tissue acidosis without increased [3H]nimodipine uptake in hyperglycemic rats is similar to the observation of Elkholm et al. (1993), who reported a fall in pH to ∼6.4 before the onset of ischemic depolarization in hyperglycemia.
The mechanism underlying slower depletion of cellular energy during hyperglycemia is not clear. Residual CBF will continue to deliver glucose to focally ischemic brain, which will enhance glycolysis and increase tissue lactate but generate little ATP compared with oxidative metabolism. Nedergaard and Astrup (1986) have observed fewer peri-infarct depolarizations during focal ischemia with hyperglycemia, which may result in less cell membrane ion currents and energy requirements for ischemic tissue when compared with normoglycemic cerebral ischemia. Thus, energy demands may be lessened in penumbral tissue during hyperglycemia. Our studies do not directly measure calcium influx into ischemic neurons, but taken together, these results suggest that hyperglycemia may initially limit cell membrane voltage-dependent calcium currents. However, because this occurs in the setting of greater tissue acidosis, any potential beneficial effect is uncertain. Many studies in both reversible and irreversible models of focal cerebral ischemia (Nedergaard, 1987; de Courten-Myers et al., 1988; Duverger and MacKenzie, 1988; Prado et al., 1988) report worse outcome with hyperglycemia, but there are conflicting observations in models of irreversible focal ischemia (Ginsberg et al., 1987; Nedergaard et al., 1987; Zasslow et al., 1989). Our current studies do not assess whether the delay in ischemic depolarization observed would provide any benefit to ischemic cortex if CBF was promptly restored.
In the dual-label method used, the calculations of net tissue pH and [3H]nimodipine volume of distribution have assumed complete separation of tritium and 14C signals on Hyperfilm and SB5 film. Measurements of activity from brain sections or tissue paste standards containing only a single radiolabel showed a cross-contamination of either isotope signal of less than 4% in nonischemic brain regions resulting in negligible changes in pH and [3H]nimodipine volume of distribution calculations. In ischemic brain regions, however, the simultaneous loss of 14C signal and increase in tritium signal results in a small overestimation of net tissue pH, indicating that the curves in Fig. 5 are actually separated by a slightly greater amount in pH than shown. No significant loss or redistribution of 14C signal occurred during the long exposure period necessary to obtain the [14C]DMO images on SB5 film. Changes in net tissue pH in ischemic brain during normoglycemia and hyperglycemia were comparable to previous observations (Nakai et al., 1988; Berger and Hakim, 1989). Therefore our pH and [3H]nimodipine measurements obtained from the dual-label procedure do not differ greatly from previous reports and thus accurately reflect changes induced by ischemia in both normoglycemic and hyperglycemic rats.
We conclude that in the model of MCA + CCA occlusion used here increased tissue acidosis in ischemic cortex produced by preischemic hyperglycemia is associated with decreased tissue depolarization during the initial 30 minutes of focal cerebral ischemia. The potential benefit of this delay in depolarization is uncertain and may be offset by increased tissue acidosis. These observations may be relevant to the management of human stroke with the recent advent of effective therapy to rapidly restore CBF to ischemic tissue.