
Abstract
The influence of hyperglycemic ischemia on tissue damage and cerebral blood flow was studied in rats subjected to short-lasting transient middle cerebral artery (MCA) occlusion. Rats were made hyperglycemic by intravenous infusion of glucose to a blood glucose level of about 20 mmol/L, and MCA occlusion was performed with the intraluminar filament technique for 15, 30, or 60 minutes, followed by 7 days of recovery. Normoglycemic animals received saline infusion. Perfusion-fixed brains were examined microscopically, and the volumes of selective neuronal necrosis and infarctions were calculated. Cerebral blood flow was measured autoradiographically at the end of 30 minutes of MCA occlusion and after 1 hour of recirculation in normoglycemic and hyperglycemic animals. In two additional groups with 30 minutes of MCA occlusion, CO2 was added to the inhaled gases to create a similar tissue acidosis as in hyperglycemic animals. In one group CBF was measured, and the second group was examined for tissue damage after 7 days. Fifteen and 30 minutes of MCA occlusion in combination with hyperglycemia produced larger infarcts and smaller amounts of selective neuronal necrosis than in rats with normal blood glucose levels, a significant difference in the total volume of ischemic damage being found after 30 minutes of MCA occlusion. After 60 minutes of occlusion, when the volume of infarction was larger, only minor differences between normoglycemic and hyperglycemic animals were found. Hypercapnic animals showed volumes of both selective neuronal necrosis and infarction that were almost identical with those observed in normoglycemic, normocapnic animals. When local CBF was measured in the ischemic core after 30 minutes of occlusion, neither the hyperglycemic nor the hypercapnic animals were found to be significantly different from the normoglycemic group. Brief focal cerebral ischemia combined with hyperglycemia leads to larger and more severe tissue damage. Our results do not support the hypothesis that the aggravated injury is caused by any disturbances in CBF.
Although the adverse effect of hyperglycemia on global ischemic insults seems to be indisputable, results from studies on focal ischemia show more variation, as exemplified below.
GLOBAL ISCHEMIA
Preischemic or intraischemic hyperglycemia increases neuronal injury after cardiac arrest (Myers and Yamaguchi, 1977) and also worsens the outcome after short-lasting total (Siemkowicz and Hansen, 1978) as well as forebrain ischemia (Kalimo et al., 1981; Pulsinelli et al., 1982; Smith et al., 1988; Voll and Auer, 1988; Warner et al., 1995; Li et al., 1996).
PERMANENT FOCAL ISCHEMIA
Published results of the effect of hyperglycemia on focal ischemia are more variable, but most publications indicate that hyperglycemia increases the final damage. Nedergaard and Diemer (1987) studied permanent middle cerebral artery (MCA) occlusion in rats with acute or chronic streptozocin-induced diabetes, and found an increased infarct size compared with normal animals only in the chronic state. Similar effects on the outcome after permanent MCA occlusion under hyperglycemic conditions have been shown in cats (de Courten Myers et al., 1988). Contrary to those studies, Zasslow et al. (1989) found a decrease of neuronal ischemic damage in cats receiving glucose before, and for 6 hours after, permanent MCA occlusion. Protection by hyperglycemia was also shown in studies in rats on permanent ischemia induced by photochemical arterial occlusion in the MCA territory (Ginsberg et al., 1987), and in rabbits (Kraft et al., 1990).
REVERSIBLE FOCAL ISCHEMIA
The results on transient focal ischemia are also variable. No effect on the infarct volume was found in some studies, e.g., in spontaneously hypertensive rats (Slivka, 1991) and in cats (de Courten Myers et al., 1989, 1994). However increased tissue damage was demonstrated in rats by Nedergaard (1987b) and by Robertson et al. (1992). The reasons for the variability in results might be related to differences between species, or to the degree and duration of hyperglycemia as well as of the ischemia. Possibly, glucose may improve the bioenergetic state of marginally perfused areas in some models studied (Folbergrová et al., 1992), and result in a protective effect during certain circumstances; alternatively, a moderately decreased pH may have a beneficial effect if special conditions are at hand (see below).
The mechanism behind aggravated damage, when occurring, is generally considered to be an increased formation of lactate and of H+ in the hyperglycemic animals, resulting in a decrease of intracellular or extracellular pH (Nordström et al., 1976; Myers, 1979; von Hanwehr et al., 1986). Changes in glucose metabolites during MCA occlusion have been studied, and an increase of lactate within the MCA territory to about 20 mmol/kg has been demonstrated in hyperglycemic animals (Folbergrová et al., 1992; Wagner et al., 1992; for recent review see Siesjö et al., 1996). The role of lactate is not undisputable, and brain lactate concentrations do not always seem to be a crucial determinant of ischemic brain injury (Lin et al., 1995).
Another factor to be considered is a possible decrease of the CBF in hyperglycemic animals. A generalized decrease in regional CBF has been shown in both acute and chronic hyperglycemia (Harik and LaManna, 1988). Wagner and coworkers (1992) showed that CBF was significantly decreased in cortex of the ipsilateral hemisphere of hyperglycemic cats after 3 hours of MCA occlusion as compared with normoglycemic animals. Similar indications were recently presented by Kawai et al. (1997).
The aim of the present investigation was to explore, in a model of transient focal ischemia, whether hyperglycemia has a negative effect similar to that observed in global ischemia, and whether the duration of ischemia influences the effect as assessed by histopathology after 7 days of recovery. We partly repeated the experiments of Nedergaard (1987b), who studied 5 to 15 minutes of MCA occlusion, by subjecting animals to 15 minutes of ischemia, but also extended the duration of ischemia to 30 and 60 minutes. Because hyperglycemia of 15 and 30 minutes did aggravate the outcome, the effect of hypercapnia on 30 minutes of MCA occlusion was studied as well. Finally, local cerebral blood flow (1-CBF) was measured to study the possible influence of changes in CBF as a factor modulating the damage.
MATERIALS AND METHODS
Male Wistar rats, weighing 320 to 360 g (Møllegaard Breeding Center, Copenhagen, Denmark), were used for all experiments. The experimental procedures were approved by the Malmö/Lund committee for ethical review of animal experiments. The animals were fasted overnight, but allowed free access to tap water before the day of experiment.
Experimental groups
Morphology. The histopathologic outcome 7 days after MCA occlusion of 15, 30, and 60 minutes' duration was studied in normocapnic, normoglycemic animals (n = 6 to 8). The volume of tissue damage was measured and compared with the result of corresponding times of MCA occlusion in animals with blood glucose elevated to about 20 mmol/L by intravenous infusion of 25% glucose (n = 7 to 9). Brain tissue damage was also analyzed after 30 minutes of ischemia in hypercapnic, normoglycemic animals (n = 7).
Local cerebral blood flow. At the end of 30 minutes of MCA occlusion, 1-CBF was measured in normoglycemic and hyperglycemic animals, and in hypercapnic animals (n = 4 in each group). In hyperglycemic animals 1-CBF was also measured after 5 minutes of recirculation (n = 8), and finally, in normoglycemic and hyperglycemic animals at 60 minutes of recirculation (n = 4 and 5, respectively).
Mortality. In the morphology study, five animals were excluded: two in the hyperglycemic groups because they did not show signs of successful occlusion, and one normoglycemic and two hyperglycemic animals because of subarachnoid hemorrhage. Four additional animals (one each in the normoglycemic and hyperglycemic groups, and two in the hypercapnic group) were found dead within 48 hours. In the flow study two animals were excluded because of technical problems. The final numbers examined are given above.
Operative procedures
In all animals, anesthesia was induced with 3% to 3.5% halothane in N2O and O2 (70:30). After intubation the animals were connected to a respirator, and the halothane concentration was reduced to 1% to 1.5%. The ventilation and the oxygen concentration were adjusted to obtain a CO2 tension of 35 to 40 mm Hg and an oxygen tension close to or greater than 100 mm Hg. Polyethylene catheters were introduced in the tail artery for sampling of blood gases and measurement of blood pressure, and in one tail vein for infusion of glucose. Thermistor probes were placed in the rectum and under the scalp to maintain rectal and scalp temperature close to 37°C. To achieve this, external heating was needed during the operation.
The MCA occlusion was made in accordance with the method described by Koizumi et al. (1986) and Longa et al. (1989) as modified by Memezawa et al. (1992). The MCA occluder consisted of a monofilament nylon thread covered with silicone to a diameter of 0.28 mm (Nagasawa and Kogure, 1989; Zhao et al., 1994). This filament was introduced into the internal carotid artery as described previously (Memezawa et al., 1992; Zhao et al., 1994). The animals with an occlusion time of 30 minutes were anesthetized and artificially ventilated throughout the occlusion period. The animals with 60 minutes of MCA occlusion were allowed to recover from anesthesia and were awake and spontaneously breathing during the main part of the occlusion. They were again briefly anesthetized for removal of the occluder.
Animals with an occlusion time of 15 minutes were anesthetized until the filament was removed. For rats with occlusion times of 30 and 60 minutes, the anesthesia was discontinued, neurology was checked, and finally they were given a short anesthesia to remove the occluder.
Glucose infusion. A glucose infusion was started 30 minutes before the occlusion. The glucose concentration was 25 g/100 mL of sterile water. The infusion rate was 85 μL/min and it was continued for 60 minutes, or until the end of the occlusion. Hence the animals subjected to 15 minutes of MCA occlusion had a total glucose infusion time of 45 minutes, whereas the 30- and 60-minute groups received an infusion during 1 hour. All normoglycemic animals received an infusion of saline.
Hypercapnia. In the hypercapnic animals carbon dioxide was added to the inhaled gas mixture to give an arterial PCO2 of 170 to 195 mm Hg, yielding an arterial pH of 6.85 to 6.92. The hypercarbic ventilation was started 30 minutes before occlusion, and continued until the removal of the occluder.
Judgment of a successful MCA occlusion. Successful occlusion was verified postoperatively in the animals exposed to 30 and 60 minutes of MCA occlusion. Animals circling or walking to the left were considered to have had an adequate occlusion. In the 15-minute group the occlusion time was so short that the animals were left under anesthesia throughout the occlusion period; hence no neurologic examination could be made until after removal of the occluder, at which time no distinct signs of MCA occlusion could be observed.
Perfusion fixation. After 7 days of recovery the animals were anesthetized, a tracheostomy was performed, and they were artificially ventilated. A thoracotomy was made, and the ascending aorta was cannulated through the left ventricle of the heart. The animal was perfused, first with saline, thereafter with phosphate-buffered 4% formaldehyde. The brains were removed, dehydrated and embedded in paraffin, sectioned coronally at 5 μm, and stained with a combination of celestine blue and acid fuchsin.
Microscopy and estimation of brain damage
Tissue damage appeared in two forms. One was of a milder type, and affected only neurons. It is here called selective neuronal necrosis (SNN). The SNN seen in this study was dense, affecting the majority of the neurons in a given area. The border of the SNN area was easily distinguished. Occasional necrotic neurons outside these areas were disregarded. The second form of damage was infarction, in which all tissue elements were destroyed. The lesions were usually combined with extensive macrophage infiltration and edema. Infarcted areas were always well demarcated from the surrounding tissue. Typical examples of SNN and infarction are presented in Fig. 1.
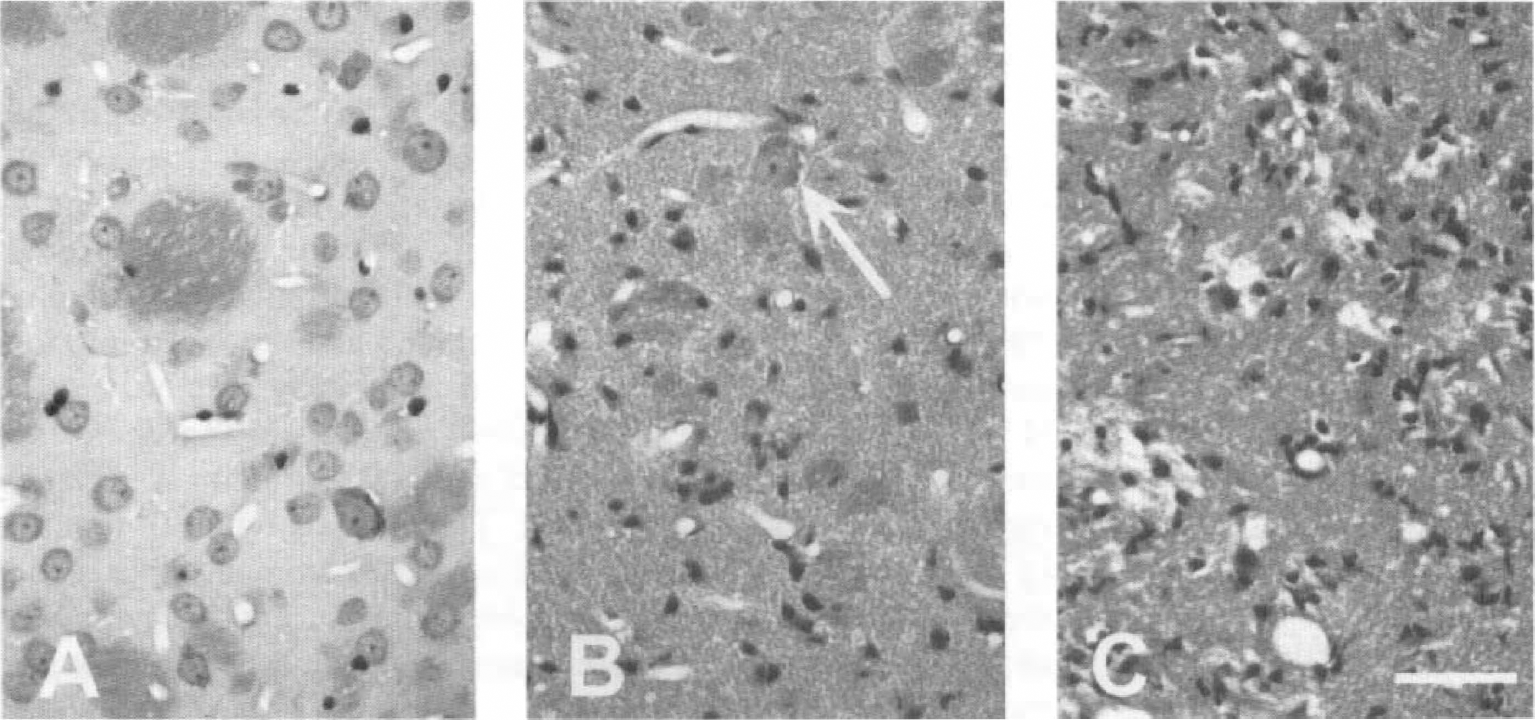
Photomicrographs from caudoputamen showing normal tissue
The brain damage was evaluated in 10 coronal brain sections, taken from easily identifiable levels from 4.2 mm anterior to and 6.8 mm posterior to bregma. The distance between each level varied between 1 and 2 mm. The brain sections were examined in the microscope and the area of infarction or SNN was sketched on copies from the rat brain atlas (Paxinos and Watson, 1982). The areas of damage in each section were calculated with the help of an image-analyzing system, and values from all levels were integrated to get the volume of SNN or infarction, as well as the total damage in the whole hemisphere.
Blood flow measurements
In animals designated to CBF studies, 1-CBF was measured with the autoradiographic technique described by Sakurada et al. (1978). 14C-Iodoantipyrine, specific activity 50 to 62 mCi/mmol was used as the diffusable tracer. The isotope (30 μCi) was infused intravenously at a constant rate for 45 seconds, after which the animals were decapitated. The brains were sectioned coronally at 20 μm in a cryostat at −20°C, and exposed to an x-ray film for 1 week together with a set of calibrated 14C standards. After development of the exposed film, 15 brain structures from each animal were analyzed on a Macintosh Quadra 950, using a public domain National Institutes of Health image program (written by Wayne Rasband at the U.S. NIH and available from the Internet by anonymous ftp from zippy.nimh.nih.gov). Local CBF was calculated according to Sakurada et al. (1978).
Statistics
All values are expressed as means ± SD. Student's t test was used when normoglycemic and hyperglycemic animals with the same occlusion times were compared. In experiments with 30 minutes of occlusion when hypercapnic animals were added, the three groups were compared with each other using analysis of variance followed by the Scheffé post hoc test. The latter two tests were also used to test for statistical differences within the physiologic parameters. A P value less than 0.05 was considered significant.
RESULTS
Physiologic parameters
There were no significant differences between the groups in general circulatory or respiratory parameters except for a small increase in PCO2 in the hyperglycemic animals and an elevated blood pressure in the hypercapnic animals.
Values from the animals in the morphology series with normoglycemia and hyperglycemia are shown in Table 1. Animals in the other groups had closely similar values, with the exception of the hypercapnic animals (see below).
Physiologic parameters, as measured just before and after MCA occlusion of 15, 30, and 60 minute duration
Values presented are mean ± SD. N, Normoglycemia; H, Hyperglycemia; MABP, mean arterial blood pressure.
P<0.05,
P<0.001, ANOVA foollowed by sheffés test.
Temperature. The temperature of animals exposed to 15 and 30 minutes of ischemia was measured 2 hours after the end of the occlusion. In the 30-minute groups, the temperature was 37.8°C ± 0.5°C in the hyperglycemic and 37.5°C ± 0.6°C in the normoglycemic animals. The difference was not significant.
Blood glucose. In animals receiving an infusion of saline, the blood glucose was approximately 6 mmol/L throughout the experiment. In the hyperglycemic groups blood glucose was 20 to 22 mmol/L at the time of occlusion. Glucose infusion was stopped when the filament was removed in animals exposed to 15 and 30 minutes of MCA occlusion. Five minutes later blood glucose was still greater than normal in these animals (not shown). In the group with 60 minutes of MCA occlusion, glucose infusion was terminated 30 minutes before the removal of the filament, and blood glucose levels were normal after 5 minutes of recirculation. Glucose was dissolved in sterile water, whereas a saline infusion was given to the controls. The effect of that difference on ischemic edema is regarded as negligible, as we earlier have shown postischemic edema to be of similar magnitude in normoglycemic and hyperglycemic animals, and as plasma osmolality in both groups were close to normal at 30 minutes' recirculation (Gisselsson et al., 1992).
Hypercapnic animals. Blood pressure was significantly higher (P < 0.05, see Table 1) before and after the occlusion in these animals. The PCO2 was 177 ± 16 mm Hg and pH was 6.9 ± 0.04 at the time of occlusion.
Distribution of brain tissue damage after transient MCA occlusion
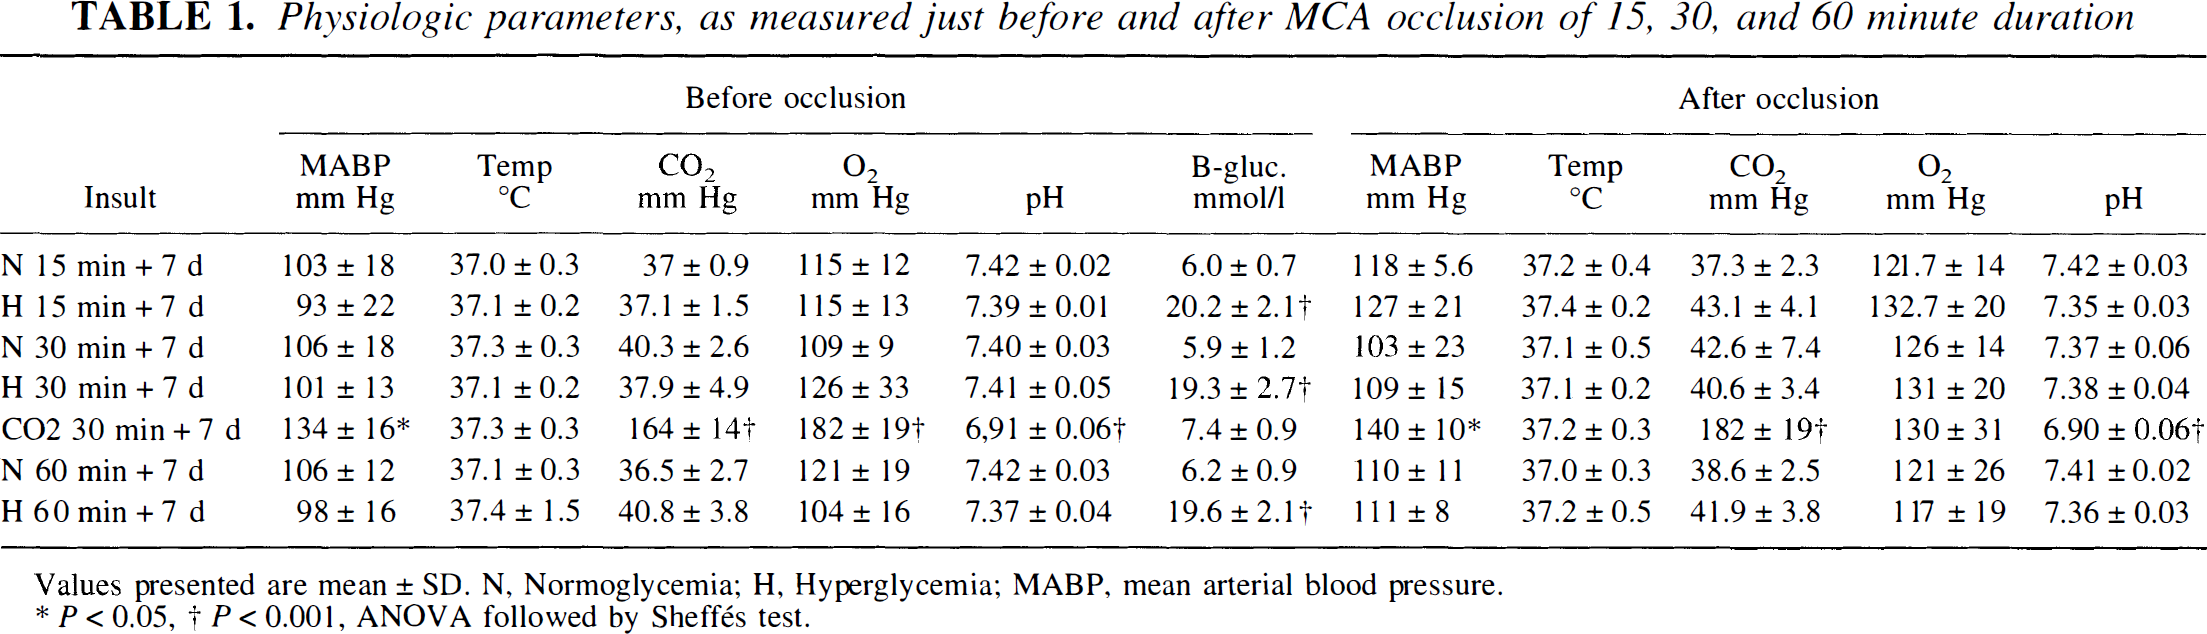
Difference between normoglycemic and hyperglycemic animals. Fifteen minutes of MCA occlusion in normoglycemic animals resulted in only SNN. In hyperglycemic animals, the volume of SNN decreased and areas of infarction dominated (Fig. 2). The total volume of damage tended to be larger in the hyperglycemic animals, but was not significantly different from that observed in normoglycemic controls. The center of the damage was found in the lateral part of the caudoputamen, which was involved in all animals except one.
Volumes of selective neuronal necrosis (SNN) and infarct after 15, 30, and 60 minutes of normoglycemic versus hyperglycemic middle cerebral artery (MCA) occlusion, and after 30 minutes of hypercapnic, normoglycemic occlusion (marked CO2). The total height of the columns represents the total damaged volume. Total damage = SNN + Infarct. For experiments with occlusion times of 15 and 60 minutes, hyperglycemic and normoglycemic animals were compared with Student's t test. The three different groups with 30 minutes of occlusion were compared with the Scheffé post hoc test. Significances between normoglycemic and hyperglycemic animals are indicated as * = P < 0.05, ** = P < 0.01, or *** = P < 0.001. No significant differences were found between normoglycemic and hypercapnic animals after 30 minutes of occlusion. Y error bars = ± SD. Bars directed downward represent SNN and those directed upward infarct volumes.
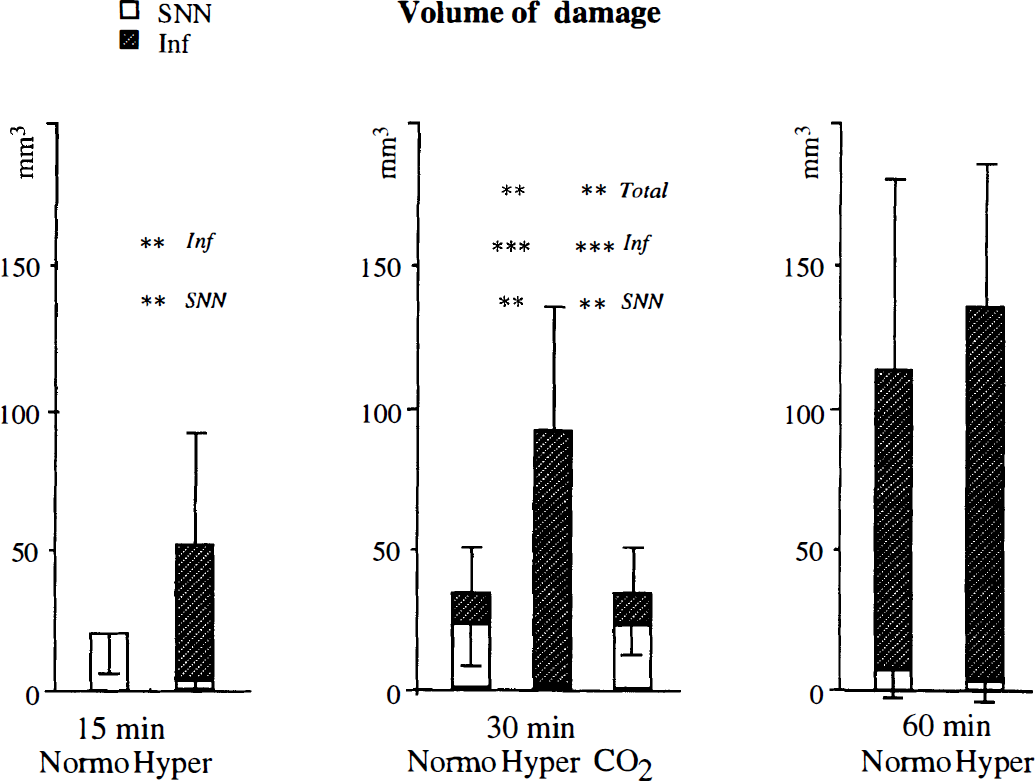
The most pronounced differences between normoglycemic and hyperglycemic animals were found after 30 minutes of occlusion. Hyperglycemia led to reduced SNN and increased infarct volume, and the total damaged area was significantly increased (P < 0.01). In the normoglycemic group, the damage was confined to the lateral caudoputamen. Hyperglycemia gave rise to increased involvement of the cortex, and an extension to more posterior parts of the brain (Fig. 3).
Drawings of tissue damage after 30 minutes of MCA occlusion followed by 7 days of recovery. Four out of 10 coronal sections from each animal are shown. Black areas represent infarct and hatched areas selective neuronal necrosis.
After 60 minutes of occlusion we found no significant differences between normoglycemic and hyperglycemic animals. In addition to the caudoputamen, large parts of the cortex, internal capsule, and hypothalamus were involved.
Difference between normoglycemic and hypercapnic animals. The morphologic changes after 30 minutes of MCA occlusion in normoglycemic, hypercapnic animals were similar to those observed after 30 minutes of occlusion in normoglycemic, normocapnic animals. The total volume of damage, as well as the size and distribution of SNN and infarction, was almost identical (Figs. 2 and 3).
Flow studies
During occlusion.
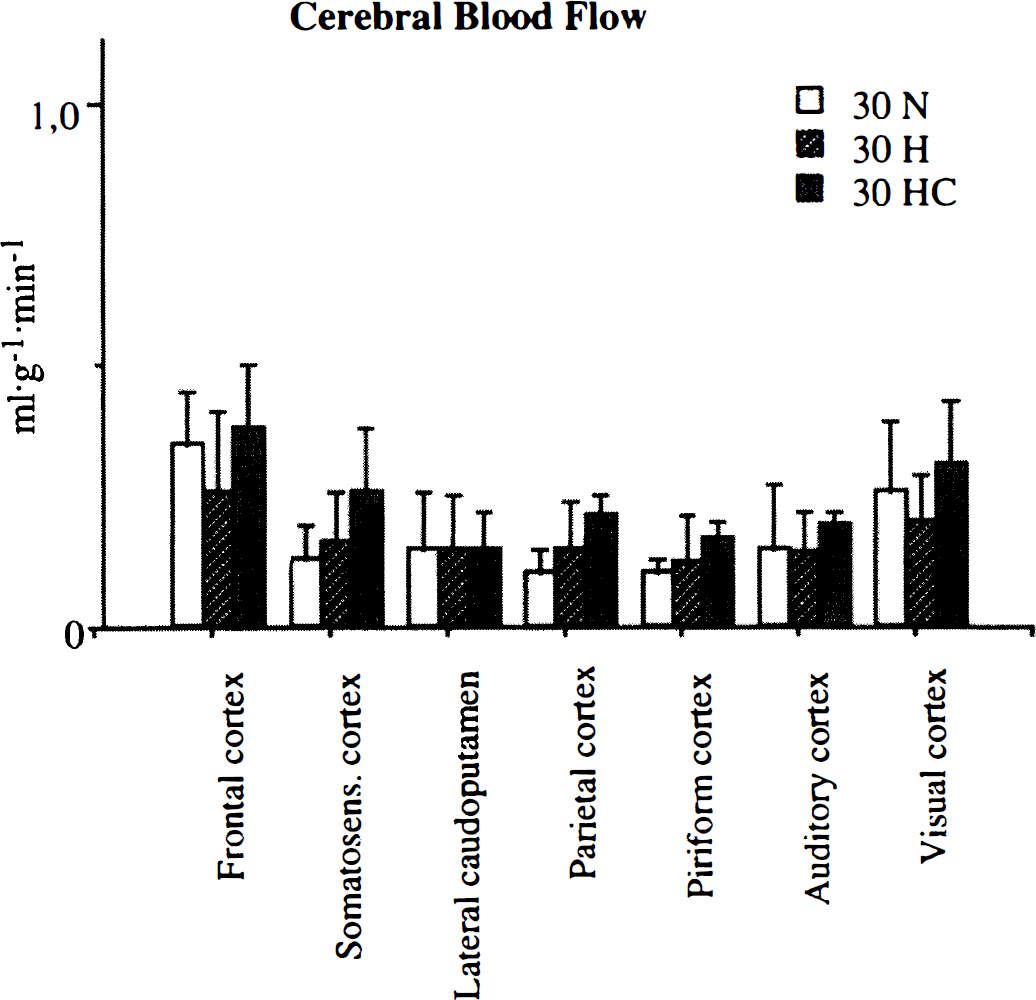
Blood flow in different structures after 30 minutes of MCA occlusion. 30N = normoglycemic, 30H = hyperglycemic, 30 HC = hypercapnic animals.
In hyperglycemic animals, blood flow rates at the end of occlusion were very close to what was found in the normoglycemic animals. No significant differences were found, but the numerical values were somewhat higher than in comparable structures in amygdala, parietal, piriform, and somatosensory cortex, but lower in frontal and in motor cortex.
After 5 minutes of recirculation in hyperglycemic animals. Hyperemia was found particularly in the lateral caudoputamen, which had a flow rate of 2.0 ± 0.6 mL·g−1·min−1, and, to some extent, in the somatosensory cortex. In other parts of the brain, blood flow was lower than normal, and lower than in the contralateral hemisphere. Recirculation was demonstrated in all structures, and no evidence of a lingering ischemia was seen.
After 60 minutes of recirculation. After 60 minutes of recirculation in the normoglycemic group (Fig. 5), blood flow rates in the lateral caudoputamen, as well as in the somatosensory, parietal, and piriform cortex were 0.35 to 0.45 mL·g−1·min−1. Blood flow rates of the same magnitude were found in the amygdala and auditory cortex. These values represent about 30% of the simultaneous flow rates in contralateral structures. Corresponding values in the hyperglycemic group were 0.45 to 0.60 mL·g−1·min−1. When hyperglycemic rats were compared with normoglycemic ones, the blood flow after 60 minutes of recirculation was not less in any region. If there was a difference, the local flow was somewhat greater in the hyperglycemic animals.
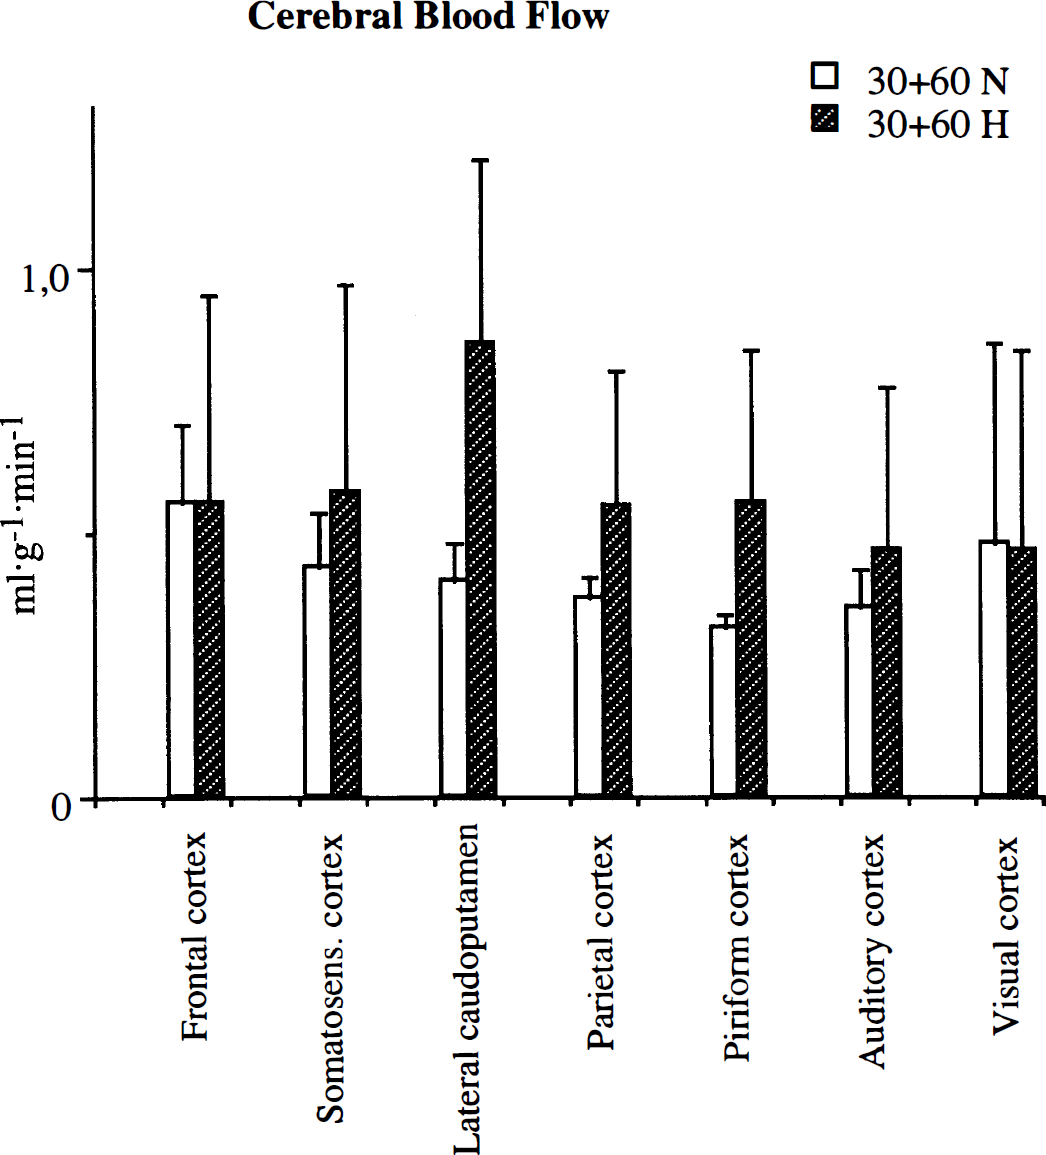
Blood flow in different structures after 30 minutes of MCA occlusion, followed by 60 minutes of recirculation. 30 + 60N = normoglycemic, 30 + 60H = hyperglycemic animals.
DISCUSSION
As stated in the introduction, hyperglycemia aggravates ischemic brain damage. Myers and Yamaguchi (1976, 1977) first demonstrated that the nutritional state of monkeys dramatically affected the neurologic outcome after cardiac arrest (see also Nordström et al., 1976). In the years to follow, the notions of a deleterious effect of hyperglycemia on brain damage was confirmed in different models of ischemia and in different animal species (Siemkowicz and Hansen, 1978; Ginsberg et al., 1980; Kalimo et al., 1981; Pulsinelli et al., 1982; Nedergaard, 1987b; de Courten Myers et al., 1988; Voll and Auer, 1988)
Most authors studying the effects of hyperglycemia in focal ischemia have used occlusion times longer than 1 hour. Augmentation of damage in hyperglycemic animals was found by, e.g., Yura (1991), who studied 2 hours of occlusion in rats receiving intraperitoneal injection of glucose, de Courten Myers and collaborators (1994) working with glucose-infused cats with occlusion times of several hours, and Huang and coworkers (1996), using 1 hour of MCA occlusion in streptozocin-treated rats.
An interesting observation is that the sensitivity to hyperglycemia appears to be quite unique for brain tissue. For myocardium, a moderate increase of the glucose concentration (≈22 mmol/L) during “warm” arrest (34°C) in isolated rabbit hearts enhances recovery (Ning et al., 1996). Also in brain tissues in vitro a protective effect of acidosis has been noted (Tombaugh and Sapolsky, 1993). However, a fall of pH is likely to have mixed and complex consequences for brain tissue (Trafton et al., 1996). For a discussion of differences between in vivo and in vitro conditions, see Kristián et al. (1994) and Siesjö et al. (1996).
Characteristically, both hyperglycemia and excessive tissue acidosis achieved by extreme hypercapnia in normoglycemic animals subjected to 10 minutes of forebrain ischemia yield enhanced neuronal necrosis, a damage that matures more rapidly during recirculation and that affects other neuronal populations than those damaged in normoglycemic subjects (Smith et al., 1988; Katsura et al., 1994; Li et al., 1995, 1996).
As Warner et al. (1995) point out, the glucose level is only one variable of importance during hyperglycemic ischemia, another one being the duration of the insult (see also Sieber et al., 1995, editorial comment). As a substantial decrease of pH occurs within the first minutes of ischemia (Kraig et al., 1986; Smith et al., 1986; Zauner et al., 1995), even severe states of acidosis might be tolerated if perfusion is rapidly restored. It should be recalled, though, that in forebrain ischemia, the adverse effects of hyperglycemia become evident when the duration of ischemia is only 5 minutes (Li et al., 1996).
The major objective of this work was to prolong the time of MCA occlusion to investigate how this extension influences the outcome in terms of type and density of injury, and to assess how the damaged area is enlarged with the duration of ischemia.
Morphologic examination after 1 week of recovery in normoglycemic and hyperglycemic rats
The most conspicuous difference between hyperglycemic and normoglycemic animals after 15 minutes of occlusion was the absence of infarction in the normoglycemic animals. In contrast, infarcts were found in six of seven animals in the hyperglycemic group. After 30 minutes of ischemia, infarcts occasionally occurred also in normoglycemic animals, but the hyperglycemic rats showed areas of total tissue necrosis in the caudoputamen as well as in overlying cortical regions. In fact, practically all of the damaged area in hyperglycemic animals was manifest as infarct, and SNN was rare. Nedergaard (1988) suggests that such a pattern could be related to the fact that hyperglycemia reduced the number of ischemic depolarizations in the infarct rim, thereby suppressing SNN. Our findings do not corroborate this view; we do find less SNN in hyperglycemia, but the infarcts encompass a larger volume than the total volume of damage in normoglycemic animals.
In other structures, such as the parietal and piriform cortex and anterior hypothalamus, SNN was found in normoglycemic animals but areas with intense damage were rare. In hyperglycemic rats infarcts in these structures were frequent.
In a study on brief transient ischemia Nedergaard (1987b) found increased infarct volumes in streptozocin-treated hyperglycemic animals after 10 and 15 minutes of ischemia followed by 4 days of recovery. Our results confirm such a conversion of selective neuronal injury into infarction, but we also found a significant difference in total damaged volume after 30 minutes of occlusion. As only minor differences in volume or density were found after 60 minutes of occlusion, it may be suggested that hyperglycemia only aggravates damage when the duration of occlusion is brief enough to yield a submaximal lesion in normoglycemic animals.
Considering that an infarct is a pan-necrotic lesion, it is tempting to conclude that acidosis affects glial cells (Plum, 1983; Kraig et al., 1986) or capillary endothelial cells, with obstruction of microvessels (Kalimo et al., 1981; Paljärvi et al., 1983). However, after very brief periods of ischemia (2.5 to 5 minutes) in hyperglycemic subjects, the typical lesion is still SNN (Li et al., 1996).
In some investigations streptozocin was used to induce hyperglycemia (Nedergaard, 1987a, 1987b; Palmon et al., 1995; Huang et al., 1996). In the present study, infusion of glucose was used to study the effects of hyperglycemia per se. Still, the morphologic outcome reported by Nedergaard (1987b) using streptozocin and the results of this study demonstrate a similar conversion of SNN to an injury involving all types of cells whether glucose is infused or diabetes is induced.
Measurement of local cerebral blood flow during and after 30 minutes of MCA occlusion in normoglycemic and hyperglycemic animals
The lateral caudoputamen was the structure most commonly affected by morphologic damage after MCA occlusion. Under normoglycemic as well as hyperglycemic conditions the mean blood flow in the caudoputamen was 0.15 mL·g−1·min−1. At the end of occlusion blood flow in the hyperglycemic animals was not significantly different from that in normoglycemic animals in any of the structures studied. After 5 minutes of reperfusion, which was only studied in hyperglycemic rats, reperfusion was demonstrated in all structures, with hyperemia in the core of the damaged area, indicating the absence of vascular occlusion in these animals. After 60 minutes of recovery, the blood flow in the lateral and medial caudoputamen and somatosensory cortex was notably lower in the right than in the left hemisphere, but no significant differences were found between normoglycemic and hyperglycemic animals. If anything, the tendency was that the blood flow was somewhat greater in the hyperglycemic animals.
A decrease of 1-CBF during recirculation could cause increased damage, or be secondary to a decreased need for blood supply in severely damaged areas. In those studies in which streptozocin was used to produce hyperglycemia (e.g., Palmon et al., 1995; Huang et al., 1996), the possibility that differences in blood flow were secondary to the effect of the induced diabetes must also be considered.
Severely reduced 1-CBF during ischemia has been suggested as one of the reasons for the bad outcome after hyperglycemic ischemia (Ginsberg et al., 1980; Yura, 1991; Kawai et al., 1997). Palmon et al. (1995) found that after global cerebral ischemia, early hyperemia was prolonged, but was followed by an extended hypoperfusion in diabetic dogs. In a study by Huang et al. (1996), a large “no-reflow” zone was found in the ischemic hemisphere in a hyperglycemic reperfusion group, supporting the theory that disturbances during reperfusion accelerates the evolution of early ischemic injury in short-term diabetic animals. Kawai et al. (1997) found, after 4 hours of MCA occlusion, that hyperglycemia induced marked cerebrovascular changes during ischemia and reperfusion.
In our study, none of the above notions could be confirmed as there were no differences in 1-CBF between the groups during ischemia and after 1 hour of recirculation. The diverging results may be explained by differences in occlusion time, blood glucose concentration, and mode of making the animals hyperglycemic.
Morphologic outcome after 30 minutes of ischemia combined with hypercapnic acidosis
In our study, hypercapnia initiated at the time of occlusion resulted in morphologic damage almost identical to that in normoglycemic animals. The absence of aggravation of damage by hypercapnia was obviously not caused by an increase in 1-CBF during ischemia (see below).
The formation of lactate has been supposed to contribute to ischemic brain damage (Rehncrona et al., 1981; Siesjö, 1988). However, evidence has been presented that lactate accumulation is not constantly a critical determinant of ischemic brain injury (Lin et al., 1995).
Ischemia leads to an increase of intracellular calcium, which contributes to the ischemic damage (for reviews see Kristián and Siesjö, 1996; Tymianski and Tator, 1996). Theoretically acidosis as such could have beneficial as well as adverse effects. In vitro mild acidosis inhibits the rise of intracellular calcium during oxygen-glucose deprivation (Ebine et al., 1994; Ouyang et al., 1994; Unno et al., 1997). In a study on the effect of hypercapnia on permanent MCA occlusion a carbon dioxide-induced decrease of arterial pH to 6.9 to 7.1 improved the outcome after permanent MCA occlusion. (Simon et al., 1993). The beneficial effect was supposed to be caused by an inhibition of calcium influx through N-methyl-D-aspartate receptor-operated and voltage-gated calcium channels. However, although hypercapnia retards calcium influx during forebrain ischemia (Kristián et al., 1994), it has been found to aggravate ischemic damage (Katsura et al., 1994). The decisive effect could be the actual fall in pH. Supposing this was the mechanism, the outcome after ischemia combined with hypercapnia or with hyperglycemia should be similar, provided that the same decrease of tissue pH was reached. In support of this contention are results showing that added hypercapnia also aggravates hypoglycemic coma (Kristián et al., 1995). However, it should be recalled that although hypercapnia aggravated the ischemic damage, the lesions were less “destructive” than those observed in hyperglycemic subjects, and postischemic seizures did not occur (Katsura et al., 1994).
Additional mechanisms of importance for the poor outcome after hyperglycemic ischemia could be caused by an effect of the glucose molecule per se, or to differences in iron-mediated production of reactive oxygen species. The latter also gives a possible explanation for the difference in outcome between hyperglycemic and hypercapnic animals (for recent review, see Siesjö et al., 1996). The influence of pH on iron-chelated production of reactive oxygen species was described more than 10 years ago (Siesjö et al., 1985), and Rehncrona and collaborators (1989) showed a reduced reactive oxygen species production in homogenates acidified by a rise in CO2 tension. This was interpreted to reflect the stabilizing influence of the HCO3− ion on iron binding to transferrin. A similar conclusion, i.e., that the higher [HCO3−] in hypercapnic compared with hyperglycemic animals decreases the iron availability for hydroxyl radical production, was made by Hurn et al. (1991), who recorded somatosensory potentials after incomplete ischemia in dogs that were rendered either hyperglycemic or hypercapnic to yield similar pH values.
The present results cannot, however, be interpreted to prove that hypercapnic acidosis is less harmful than that caused by hyperglycemia, because pH was not measured. Thus, because hypercapnic acidosis decreases glycolytic rate (Folbergrová et al., 1975; Miller and Hawkins, 1975), the effects of hyperglycemia on production of lactate plus H+ and those of hypercapnia are not necessarily additive. It seems justified, therefore, that intracellular and extracellular pH should be measured under the conditions of the present experiments.
Local cerebral blood flow during and after 30 minutes of hypercapnic ischemia
As tissue acidification because of hypercapnia did not, in the morphology study, show a similar aggravation of brain injury as in hyperglycemia, the possibility remained that excessive hypercapnia could influence the CBF during ischemia and improve the delivery of oxygen during the ischemic insult. To clarify this problem, 1-CBF was measured at the end of 30 minutes of MCA occlusion. The results showed that 1-CBF in the lateral caudoputamen was exactly the same as in normocapnic and hyperglycemic animals. However, in some of the surrounding cortical regions, blood flow during hypercapnia was somewhat higher, although not statistically different from normocapnic animals. As the flow in lateral caudoputamen was the same in all the groups, the conclusion must be drawn that conversion of the damage from SNN to necrosis was not prevented because of an increase of 1-CBF induced by hypercapnia. However, the somewhat higher flow in the penumbra zone during ischemia might have influenced the extension of the damage to cortical regions.
As postischemic energy balance in the tissue improves during recirculation, acidosis could contribute to an increased calcium load, generated by the activity of the Na+/H+ antiporter and the Na+/Ca2+ exchanger. Persisting high levels of intracellular calcium are, during recirculation, supposed to jeopardize recovery in myocardial tissue (Nomura et al., 1994; Duff, 1995; Karmazyn, 1996). Protective effects of blocking Na+/H+ exchange have been shown in neuronal tissue cultures as well (Voronov et al., 1996). The combination of acidosis and hypercapnia could, theoretically, contribute to a sustained or enhanced intracellular calcium load.
CONCLUSION
After 15 and 30 minutes of MCA occlusion, the difference between normoglycemic and hyperglycemic animals was expressed as a conversion of tissue damage from SNN to infarction as well as in a larger volume of damage, which was significant at 30 minutes. The difference between the two groups was most pronounced after 30 minutes of occlusion. Differences in 1-CBF did not appear to be a main contributor to the adverse outcome in hyperglycemic animals. The effect of MCA occlusion in hypercapnic animals was similar to the outcome after normoglycemic ischemia. Our results do not advocate the thesis that circulatory disturbances are the cause of the adverse outcome after an hyperglycemic insult, nor do they support the notion that exaggerated tissue acidosis during the ischemic insult is the explanation for the conversion of SNN to infarction after a focal hyperglycemic ischemia. However, the influence of acidosis can only be assessed by direct pH measurements.
Footnotes
Acknowledgements
The authors thank Lena Evergren for skillful technical work.