Dementia with Lewy Body and Alzheimer's disease exhibit degeneration of the cholinergic neurons, and currently, the primary target of treatment is the cholinergic neurotransmitter system. [123I]-IBVM is a highly selective radioligand for in vivo visualization of the vesicular acetylcholine transporter (VAChT) using single photon emission computed tomography. This study compares different noninvasive methods using the occipital cortex as a reference region for the quantification of [123l]-IBVM binding in six older, healthy volunteers: two kinetic analyses based on one-tissue (1TCM) or two-tissue compartment model (2TCM), one linear and one multilinear analysis, and a simplified peak equilibrium analysis. Time—activity curves were well described by a 1TCM for all regions. The 2TCM converged reliably only in the striatum. Goodness of fit was not improved by using a 2TCM as compared with a 1TCM. The multilinear analysis gave binding potentials similar to the 1TCM while being more robust. The peak equilibrium method might prove to be a useful simplified analysis. The binding potentials obtained with reference region methods strongly correlated with results from invasive blood-sampling analysis. Noninvasive quantification of [123I]-IBVM data provides reliable estimates of VAChT binding, which is most valuable to study neurodegenerative diseases with specific cholinergic alteration.
One of the critical features of dementia with Lewy Body (DLB) and Alzheimer's disease (AD) is degeneration of cholinergic neurons located in the basal forebrain nuclei, progressively depriving the brain of its cholinergic input. Although characterized by different clinical, structural, and neuropathological features, both senile dementias exhibit alteration in cognitive attentional processes, classically associated with acetylcholine (ACh). The cholinergic neurotransmitter system is currently the primary target of treatments that aim at replacing or enhancing cholinergic activity by inhibiting the enzyme acetylcholinesterase (AChE), which otherwise degrades ACh to metabolites extremely rapidly.
As cognitive functions of cortical cholinergic neurons are relatively well understood, determination of cholinergic impairment in disease processes, irrespective of their status in etiological theories, seems to be central to the development of a conclusive hypothesis about the neuronal mechanisms that underlie the cognitive deficits of these disorders. Presently, little is known about the status of the cholinergic system and the dynamic regulation of cholinergic transmission in residual, compromised, or degenerating neurons, as most of the studies have resulted from postmortem analysis in advanced stages of the disease and have generated confusing results, including evidence of preservation of cholinergic neurons (Gilmor et al, 1999) and of choline acetyltransferase activity, which is elevated in subjects with mild cognitive impairment and remain unchanged in mild AD patients (Dekosky et al, 2002). Because of the absence of definitive information about cholinergic impairment in dementia, the rationale that underlies the development of cholinomimetic therapeutic approaches to enhance cholinergic transmission in compromised neurons remains unsettled.
The different clinical, structural, and neuropathological characteristics of AD and DLB suggest heterogeneous ACh deficiency profiles in these two disorders. Nevertheless, this difference can be difficult to determine when based solely on clinical assessments and therapeutic efficacy. Thus, there is a strong incentive to explore ACh biochemical cerebral dysfunctions directly in patients by measuring the cholinergic system activity. Such an in vivo approach can be performed in the living human brain using positron emission tomography or single photon emission computed tomography (SPECT) and a suitable radioligand for cholinergic neurons. Positron emission tomography tracers exist ([11C]-PMP, [11C]-MP4A) for AchE, which is a marker enzyme for cholinergic neurons and synapses, and studies have found reduced cortical AChE activity in AD (Herholz et al, 2005). However, AChE was also found in amyloid plaques, present in normal aging as well as demented brains (Rees and Brimijoin, 2003).
In recent years, tracers such as benzovesamicol (BVM), an analogue of (—)vesamicol, which is a compound known to be a stereoselective inhibitor of ACh uptake into presynaptic cholinergic vesicles, have been developed for in vivo mapping of cerebral cholinergic neurons. In ex vivo studies, [123I]-IBVM binds with high affinity (subnanomolar range) and high selectivity to the vesicular ACh transporter (VAChT), with a good specific-to-nonspecific ratio and with a binding in ACh-rich brain areas that is both saturable and specific (Altar and Marien, 1988; Bahr et al, 1992; Zea-Ponce et al, 2005).
In a previous study, Kuhl et al (1994) have shown that in vivo regional distribution of [123I]-IBVM in human brain was concordant with the known densities of ACh neurons, suggesting that it might be a good ligand for imaging cholinergic neurons in patients. In other studies, it was shown that as the disease progresses in AD patients, the levels of VAChT change in a similar fashion and magnitude to other cholinergic marker proteins, in particular choline acetyltransferase, supporting the interest in [123I]-IBVM as an in vivo radioligand for imaging of neurodegenerative disease impairments, such as AD and DLB (Kuhl et al, 1996, 1999). More recently, using [123I]-IBVM SPECT imaging, we evidenced cholinergic degeneration in an early stage of AD (Mazere et al, 2008).
A better understanding of the involvement of ACh in cognitive impairments in AD and DLB requires quantification of [123I]-IBVM pharmacokinetic in human cortex, which is not performed nowadays, to derive physiologic and pathologic parameters. In previous studies, quantification was performed using invasive kinetic analysis with arterial blood sampling (Kuhl et al, 1994, 1996). Therefore, the aim of this study was to evaluate the feasibility of noninvasive in vivo [123I]-IBVM SPECT imaging quantification using several reference region methods, most valuable for the early detection and follow-up of ACh neuron damage in neurodegenerative diseases. Two kinetic analyses based on either one- or two-tissue compartments, one linear and one multilinear analysis, as well as a simplified peak equilibrium analysis, were used to determine the most appropriate method for quantification of [123I]-IBVM pharmacokinetic.
Materials and methods
Subjects
The subjects were six older, healthy volunteers (age 75 ± 4 years) without neuropsychiatric disorder based on a screening interview by an experienced senior neuropsychologist. Before signing a written consent, all subjects were presented with the basic design of the study approved by the Human Ethics Committee of the Faculty of Medicine of Bordeaux, and were informed they could withdraw at any time.
Radiochemistry
[123I]-IBVM was prepared for human use by oxidative radioiodination of a stannyl precursor, (—)-5-(tributyltin)-benzovesamicol (Van Dort et al, 1993), as described previously (Mazere et al, 2008). The tributyltin precursor was prepared from (−)-5-[127I]-IBVM (Jung et al, 1990). After radioiodination, [123I]-IBVM was purified by high-pressure liquid chromatography using a C18 Phenomenex Ultracarb ODS (30) 5 μm column. It was then loaded onto a Sep-Pack cartridge, washed with sterile water, and eluted with 95% ethanol for intravenous injection. This solution was made up to 8 mL with 0.9% sodium chloride and filtered with a 0.22 μm Millipore filter to obtain sterile [123I]-IBVM. Optical and radiochemical purities were checked by high-pressure liquid chromatography using a Chiralcel OD 10 μm column and a reverse phase C18 column, respectively.
Data Acquisition
Functional SPECT imaging: Single photon emission computed tomography imaging was performed on a dual-headed system (DST Sopha Medical) equipped with ultra high-resolution fan-beam collimators. To minimize iodine uptake in the thyroid gland, each subject was administered 400 mg of potassium Perchlorate orally, 30 mins before data acquisition. After an intravenous injection of 233 ± 33 MBq [123I]-IBVM, a dynamic sequence comprising of 17 frames (64 projections with a matrix of 64 times 64 over 360°) was acquired at four different times over a period of 6 h: 8 times 4 mins at 0 h after injection, 3 times 12 mins at 1 h after injection, 3 times 12 mins at 3 h after injection, and 3 times 12 mins at 6 h after injection. Between the four acquisitions, the subjects were allowed out of the gantry to rest.
Anatomic MRI: Each subject underwent a high-resolution 3D T1-weighted MR scan to identify individual anatomic structures and to normalize the functional SPECT images to the MNI (Montreal Neurological Institute) brain template space (Evans et al, 1993). All the MRI (magnetic resonance imaging) data were collected on a 1.5 T Gyroscan ACS NT Power track 6000 (Philips Medical System, Best, The Netherlands) using the following parameters: gradient-echo sequence, TR/TE = 7.11/3.49 ms, flip angle = 8°, matrix = 256 times 256 times 228, voxel size = 1 mm3.
SPECT Data Processing
The projections were filtered with a Butterworth filter (order 5; cut-off frequency, 0.25 cycles/pixel) before reconstruction on a 64 times 64 matrix by filtered back-projection with a ramp filter and a voxel size of 6.8 times 6.8 times 6.8 mm3. Attenuation correction was applied using a first-order Chang algorithm within an operator-determined ellipse around the skull, as identified on the MRI using a uniform, effective broad-beam attenuation coefficient μ = 0.115/cm, as recommended by the manufacturer to compensate for scatter as well.
All the reconstructed images were transferred to the PMOD software (http://www.pmod.com) for further processing and analysis. The 17 frames (acquired at four different times) were realigned and also coregistered to the MR scan as follows: (1) the images were summed up within each of the four acquisitions, (2) the summed images at 1, 3, and 6 h were realigned to the summed images at 0, 1, and 3 h, respectively, using normalized mutual information (Studholme et al, 1999), (3) the transformations determined in the previous step were combined and all the images were realigned to the image at Oh and summed up again, (4) the final summed image was coregistered to the MR scan using normalized mutual information, (5) for each of the 17 individual frames, the transformation combining realignment and coregistration was calculated and applied, (6) accuracy of the coregistration was visually checked by superimposing each frame on the MR, and (7) the 17 processed images were merged to obtain a realigned 4D [123I]-IBVM SPECT data set coregistered to the MR scan. Next, the MR scan was spatially normalized (12-parameter global affine transformation followed by a nonlinear local warping) to the MNI space using the generic MNI T1-weighted brain template, and the transformation thereby determined was applied to the 4D SPECT data set.
Regional Time-Activity Curves
We created a template in the MNI space based on anatomic automatic labeling (Tzourio-Mazoyer et al, 2002) brain segmentation. We built the template by merging some of the anatomical automatic labeling regions to define the following anatomic regions of interest (ROIs): striatum, occipital cortex, frontal cortex, parietal cortex, temporal cortex, hippocampus, thalamus, cerebellar hemisphere, and cerebellar vermis. We applied this template to each frame of the normalized 4D data set to obtain average regional activities that were decay corrected and plotted versus time to get regional time—activity curves (TAC).
Theory of Model-Based Analysis
Model-based methods for in vivo quantification of neuroreceptors can be divided into kinetic, linear, and equilibrium methods (Slifstein and Lamelle, 2001). Kinetic methods yield quantitative information about receptors from the rate constants that characterize tracer transfer between plasma, brain, and receptors (Mintun et al, 1984). In the linear approaches, data are transformed to new variables and the parameters of interests are derived by linear (or multilinear) regression analysis (Logan et al, 1990; Patlak et al, 1993; Ichise et al, 1996). Equilibrium methods derive kinetic parameters from the analysis of activity distribution at equilibrium when the receptor—ligand association and dissociation rates are equal (Farde et al, 1989; Ito et al, 1998).
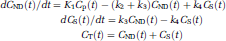
Compartment modeling describes brain uptake and binding of radiotracer and is essential to model-based methods or their interpretation. Only relatively simple models with 2 to 4 parameters (two-tissue (2TCM) and one-tissue (1TCM) compartment models) are feasible in practice because of the limited statistical quality of the dynamic acquisitions. Following the consensus nomenclature (Innis et al, 2007), the 2TCM comprises the radioactivity concentration of tracer in plasma (Cp), of nondisplaceable (ND) (nonspecifically bound (NS) plus free (F)) tracer in tissue (CND), and of specifically bound (S) tracer to receptor sites (CS). The rate constants K1 (mL/g per min) and k2 (per minute) describe the influx and efflux of the tracer through the blood—brain barrier, respectively, and the rate constants k3 (per minute) and k4 (per minute) describe tracer transfer between the nondisplaceable (CND) and the specific binding (CS) compartment, respectively. The ordinary differential equations describing the 2TCM in a receptor-rich region are
where CT is the regional TAC of the tissue of interest, and the constants K1 to k4 are the parameters to be determined.
In a reference region (a region devoid of receptor sites), k3 = 0 and the model reduces to a one-tissue compartment described by the equation
where C'ND is the regional TAC of the reference region and K'1 and k'2 are the parameters of interest.
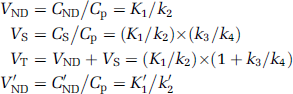
From equations (1 and 2), the distribution volumes (the ratio of tissue to plasma concentration at equilibrium when dCND/dt = 0, dCS/dt = 0 and dC'ND/dt = 0) of the receptor-rich and reference regions can be related to the transfer constants by
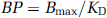
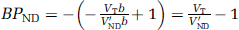
In vitro, the binding potential is defined as
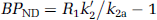
(Mintun et al, 1984) where Bmax is the total concentration of binding sites and KD, the reciprocal of the affinity of the ligand for the receptor, is the equilibrium dissociation constant. An in vivo measurement used in practice is BPND, which is defined as
where fND is the free fraction in the ND compartment and Bavail is the concentration of available binding sites. BPND is the maximum that can be inferred at tracer dose and is the outcome measure as it is proportional to the density of receptor sites.
When a reference region exists and under the assumption that the distribution volume of the nondisplaceable compartment is the same across all brain regions, that is, VND = V'ND, BPND can also be evaluated as
where DVR is the distribution volume ratio.
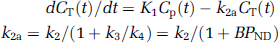
Finally, a simplification of the 2TCM into a 1TCM can be made by assuming that the concentrations CND and CS equilibrate rapidly and can be combined into one single compartment noted as CT with a reduction from four to only two transfer constants to be determined by fitting. This model is described by the equations
Several noninvasive methods were performed with the PMOD software to derive the [123I]-IBVM binding potential, BPND. The reference region was the occipital cortex where choline acetyltransferase levels from postmortem studies (McGeer et al, 1980; Araujo et al, 1988) and [123I]-IBVM specific binding from an in vivo study (Kuhl et al, 1994) were found to be lowest.
Full reference tissue model: In this model (Lammertsma et al, 1996), the regions with specific binding are described by a 2TCM and the reference region by a 1TCM. Under the assumption that VND = V'ND, equations (1 and 2) can be combined to obtain the following equation in a receptor-rich region:
where R1 = K1/K'1 is the ratio of tracer delivery, CT is the TAC of the tissue of interest and a, b, c, and d are functions of the four unknown parameters R1, k2, k3, and BPND. These four parameters were determined for all the regions by NLSF (nonlinear least square fitting) of the TAC using Marquardt algorithm (Marquardt, 1963).
Simplified reference tissue model: Kinetic modeling is simplified and both the region with specific binding and the reference region are described by a 1TCM (Lammertsma and Hume, 1996). Under the same assumption as for the full reference tissue model (FRTM, VND = V'ND), equations (2 and 6) are combined to get the equation:
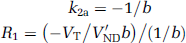
where R1, k2a, and k'2 are the three parameters of interest determined by NLSF of CT using Marquardt algorithm. Because of noise, an accurate determination of the parameters is difficult in particular for the regions with low binding potential, and this is all the more true for SPECT acquisitions. However, as the same reference region is used, k'2 should be the same for all the regions. Therefore, to improve the stability of the parameters, the binding potential was determined using the simplified reference tissue model (SRTM)2 two-step approach (Wu and Carson, 2002): (1) k'2 was calculated by fitting the striatum TAC (highest binding potential) and (2) all the TAC were fitted for R1 and k2a, fixing k'2 to the value previously determined (reducing the number of fitted parameters from three to two). Finally, the binding potential was calculated as
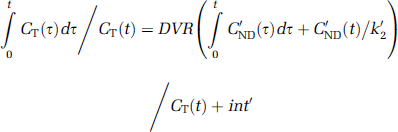
Logan noninvasive graphical analysis: Transformation of the data yields the Logan noninvasive linear equation (Logan et al, 1996) that was applied to all the regions:
that contain DVR as the regression slope, an intercept int, which becomes constant after an equilibration time t*, and the reference region tissue-to-plasma clearance k'2, which has to be determined. The k'2 resulting from either SRTM or multilinear reference tissue model (MRTM) is a good estimate. In this study, we used the value determined with SRTM. Finally, the binding potential BPND is calculated using equation (5). This method does not make any assumption about the underlying model (1TCM or 2TCM), but for radioligands with true one-tissue kinetics, t* < = 0.
Multilinear reference tissue model: Another transformation of the data yields the MRTM equation (Ichise et al, 2003)
which is valid after an equilibration time t* when b becomes constant.
Again, no assumption is made about the underlying model but for radioligands with one-tissue kinetics, the multilinear equation is correct from t* = 0 and only then we have
Similar to SRTM, MRTM can be turned into the more robust MRTM2 method (Ichise et al, 2003): (1) calculation of k'2 in a region with high binding potential (striatum) and (2) multilinear regression analysis of equation (11) for all the regions using SVD (singular value decomposition) with k'2 fixed to the value previously determined, yielding two regression coefficients. Finally, the binding potential can be calculated from the ratio of these two coefficients:
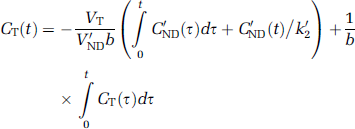
Simplified method: peak equilibrium analysis: The peak equilibrium (PE) is when the specific binding is maximum, that is dCs/dt = 0 (Farde et al, 1989; Ito et al, 1998). Assuming that CND = C'ND, (a stronger assumption than VND = V'ND, which is unlikely to be perfectly true), from equation (1) we have:
A set of two decreasing exponential functions was fitted to the occipital cortex and striatum TAC, and BPND was calculated using the fitted curves.
Model comparison: Goodness of fit for 2TCM (FRTM) and 1TCM (SRTM2) were compared using the AIC (Akaike information criterion) (Akaike, 1974). A smaller value of this criterion is indicative of a better fit and of a model being more appropriate. Both FRTM and SRTM2 were solved by NLSF using Marquardt algorithm, which accumulates information about the covariance matrix and MRTM2 was solved by SVD, which also provides the covariance matrix. Therefore, for these three methods, an estimate of the s.e. of the fitted parameters (square root of the covariance matrix diagonal elements) could be calculated. It was expressed as a percentage of the parameter value (coefficient of variation, %COV) and was used to assess the identifiability of the parameters. Finally, the parameters' value dispersion among the group of volunteers was expressed by %VAR, defined as the s.d. over the mean (100 × s.d./mean).
Results
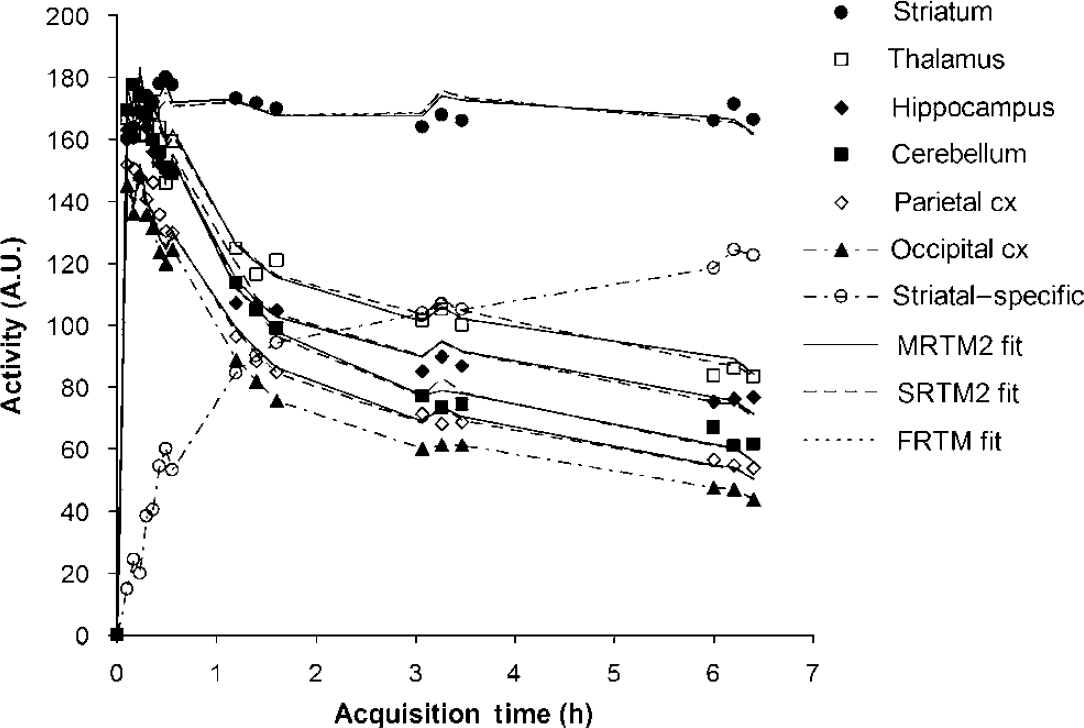
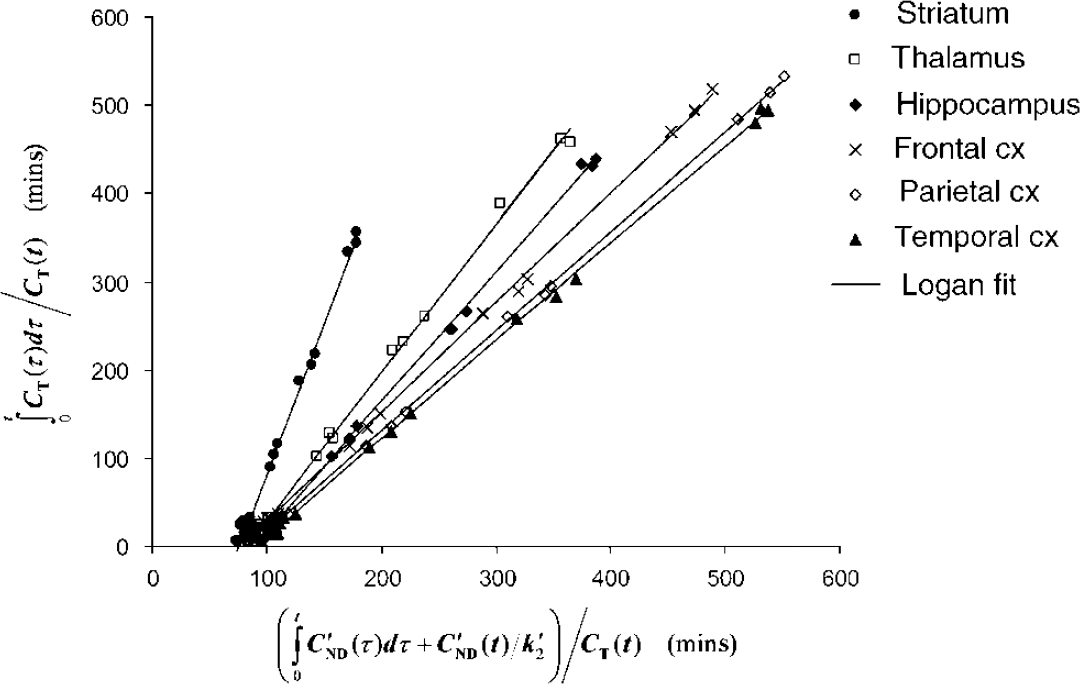
For a representative subject, Figure 1 shows TAC for only some ROIs for clarity as well as the difference (striatum—occipital cortex), which represents striatal-specific binding under the assumption stated previously (CND = C'ND). The uptake was found to peak within the first 30 mins for all regions and was highest in the striatum; intermediate in the thalamus, hippocampus, and cerebellum; and low in the cortical regions. The lowest uptake was found to be in the occipital cortex, chosen as our reference region. The Logan noninvasive plots are shown in Figure 2 for some of the brain regions where three groups can be distinguished: striatum, thalamus, and hippocampus, and the frontal, parietal, and temporal cortices. It is to be noted that all the plots are linear from the first data point, that is, t* = 0 for all regions. Curve fits obtained with FRTM in the striatum and with SRTM2 and MRTM2 in all regions are shown in Figure 1. In the striatum, the 1TCM SRTM2 method resulted in a fit (dashed line) that was visually indistinguishable from the 2TCM FRTM fit (dotted line), and on statistical grounds, the goodness of fit was not significantly improved by using FRTM as compared with SRTM2, as assessed by AIC (AIC = 56 ± 13 and 54 ± 12 for FRTM and SRTM2, respectively; paired sample t-test: t5 = 2.3, P < 0.05).
Characteristic time—activity curves for some of the brain regions as well as of striatal-specific binding. The symbols correspond to the experimentally measured values. The solid lines, dashed lines, and dotted line (striatum only) correspond to the fitted curves using MRTM2, SRTM2, and FRTM, respectively. It is noteworthy that the 2TCM FRTM (dotted line) and 1TCM SRTM2 (dashed line) fits to the striatum are indistinguishable from each other.
Logan noninvasive plots for some of the brain regions, where the slope of the linear regression line correspond to the DVR.
Results obtained for all the regions from NLSF analyses using FRTM and SRTM2, SVD multilinear regression analyses using MRTM2, and linear regression analyses using Logan are presented in Tables 1 to 3 for BPND, R1, and k2, respectively. For FRTM, the results are presented only for the striatum, as for some subjects, the parameters failed to reach convergence in the other regions (non physiologic value or very large %COV), and k3 is not presented at all as it failed to converge for some subjects even for the striatum. For MRTM2, the multilinear equation was found to be valid from the first data point in all brain regions, that is, t* = 0, and R1 and k2 were therefore estimated using equations (6 and 12).
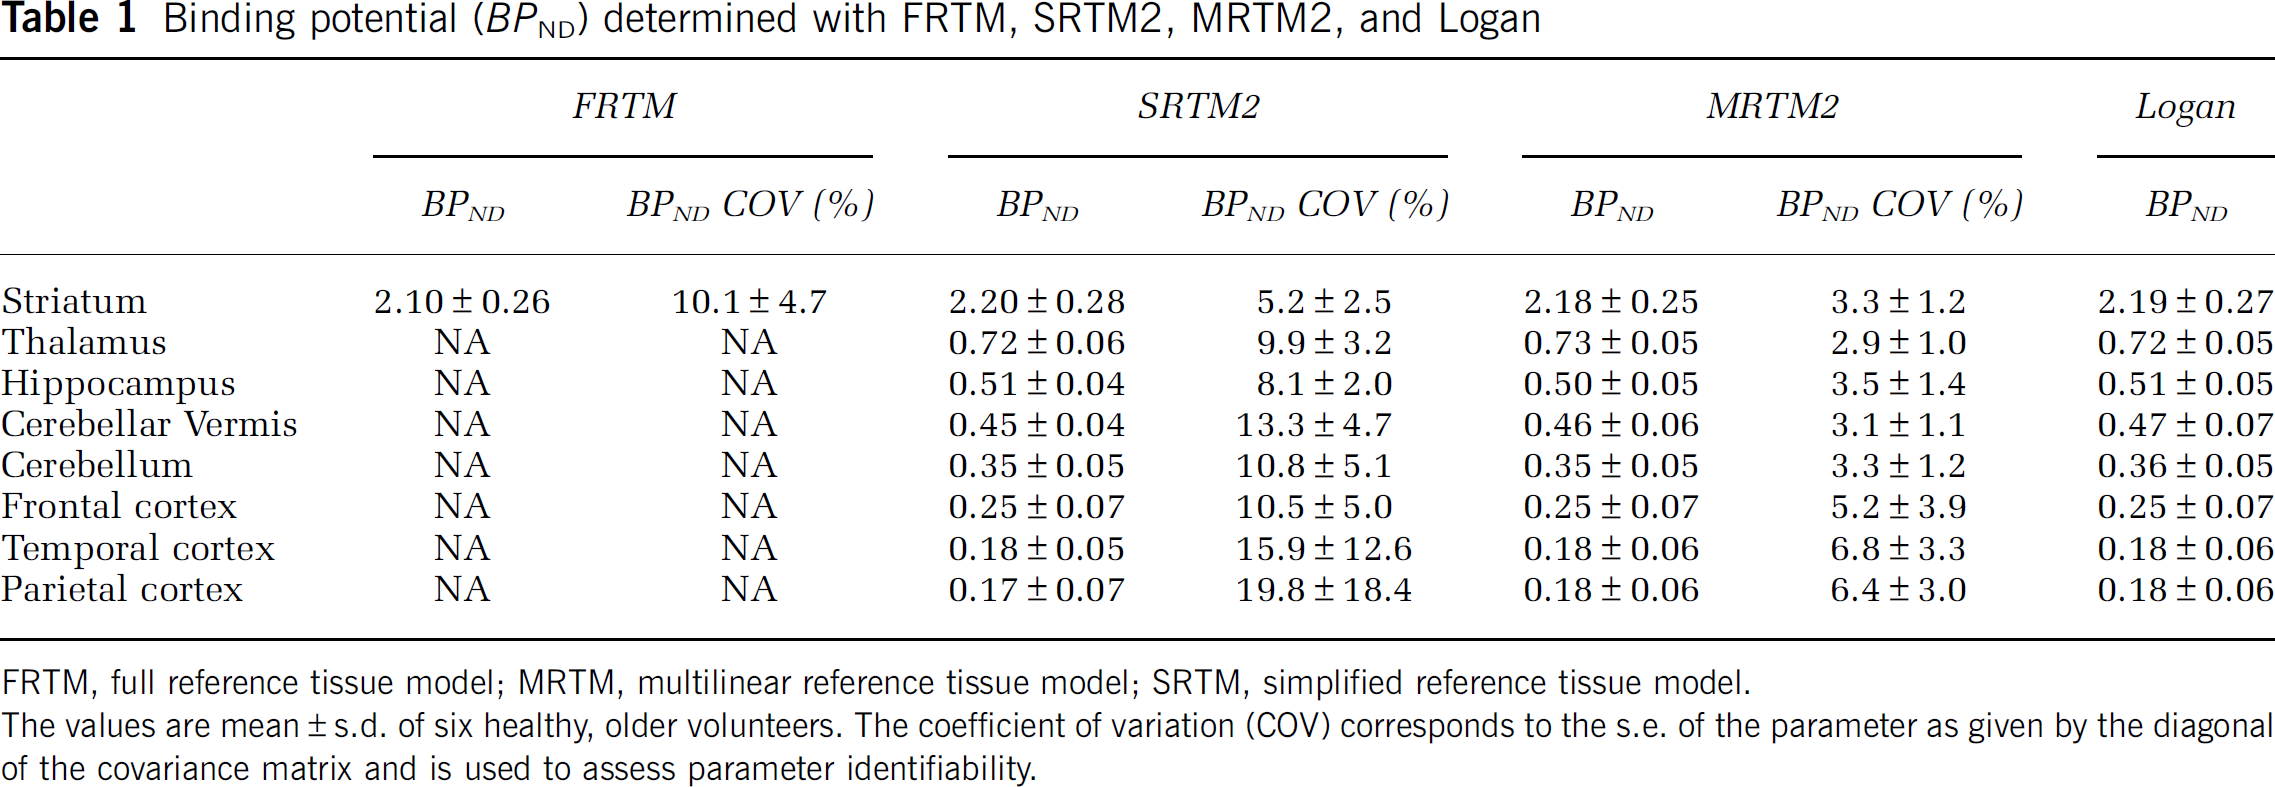
Binding potential (BPND) determined with FRTM, SRTM2, MRTM2, and Logan
The values are mean ± s.d. of six healthy, older volunteers. The coefficient of variation (COV) corresponds to the s.e. of the parameter as given by the diagonal of the covariance matrix and is used to assess parameter identifiability.
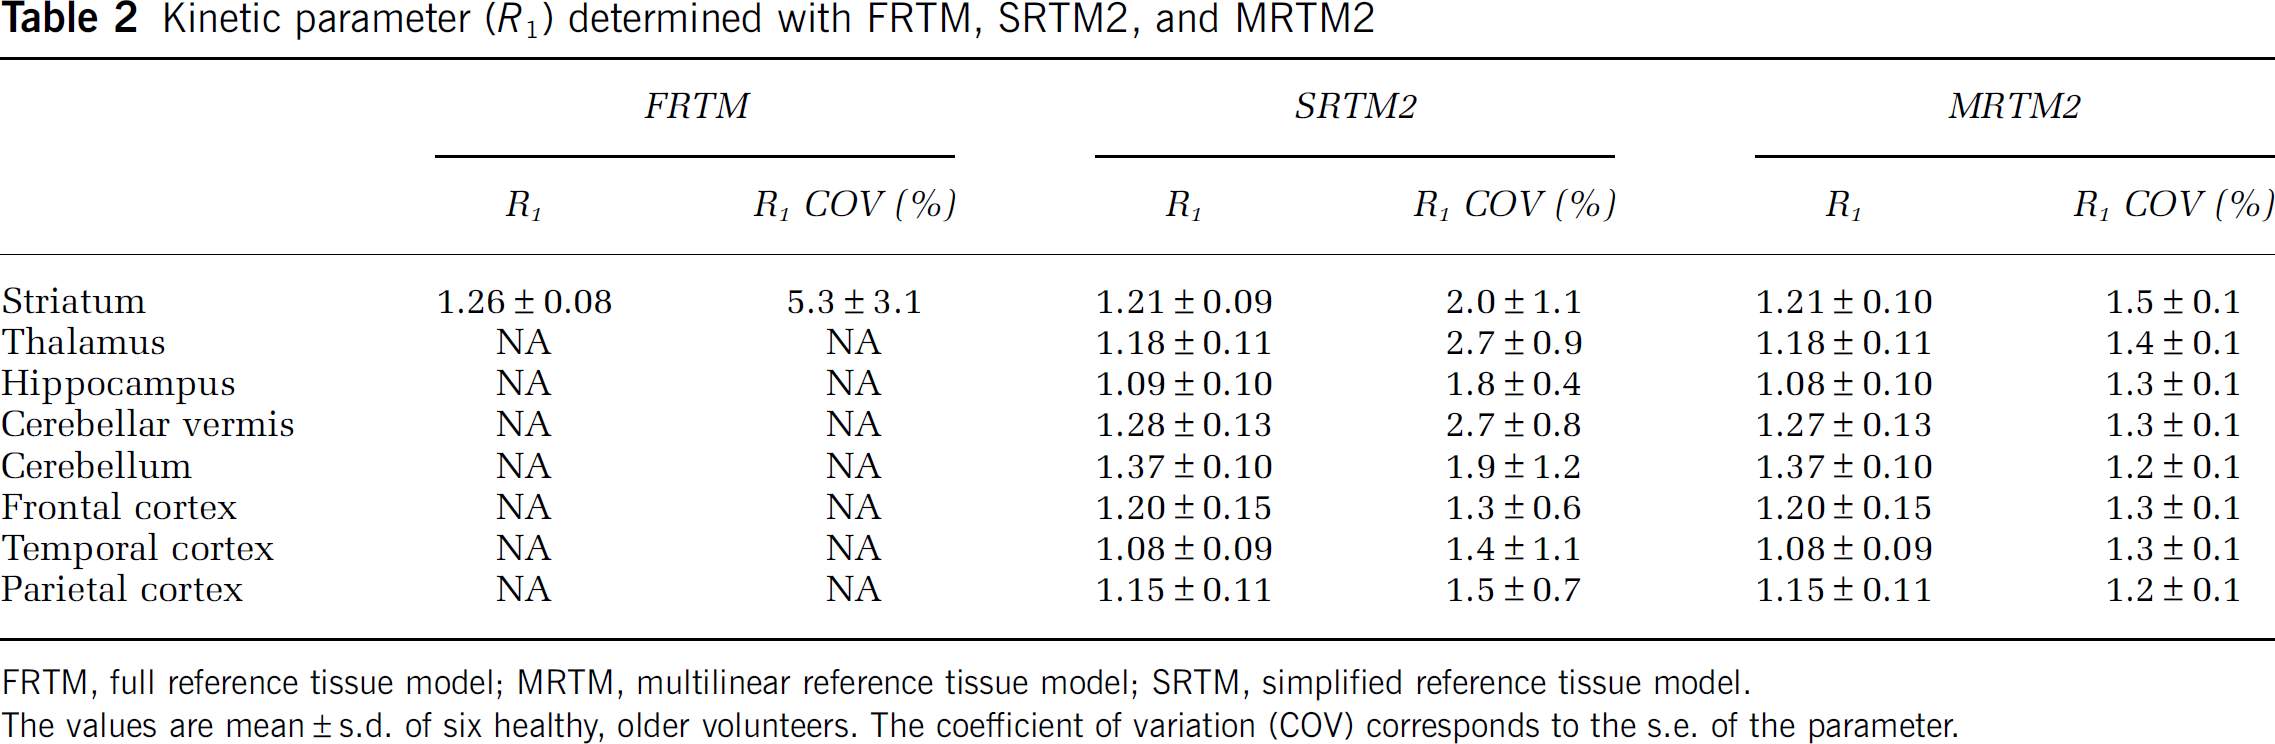
Kinetic parameter (R1) determined with FRTM, SRTM2, and MRTM2
The values are mean ± s.d. of six healthy, older volunteers. The coefficient of variation (COV) corresponds to the s.e. of the parameter.
As mentioned previously, both SRTM2 and MRTM2 methods rely on a previous estimation of the k'2 parameter, which was obtained in the striatum using SRTM and MRTM, respectively. The value of k'2 in the striatum was also evaluated with FRTM as k2/R1 to assess the method or model dependence for the estimation of the parameter. The k'2 values obtained with FRTM, SRTM, and MRTM were 0.0130 ± 0.0024, 0.0118 ± 0.0024, and 0.0117 ± 0.0023, respectively, and a repeated-measures ANOVA revealed no significant difference (F2,10 = 3.85, P > 0.05) and therefore no significant model or method dependence.
The binding potential, BP1ND, was high in the striatum with values close to 2.2 and ranged from around 0.7 in the thalamus to around 0.2 in the cortex (Table 1). A repeated-measures ANOVA showed no significant difference between the FRTM, SRTM2, MRTM2, and Logan methods in the striatum (F3,15 = 2.38, P > 0.05) and between SRTM2, MRTM2, and Logan in all the regions (F2,94 = 0.89, P > 0.05). The BPND %COV was found to be significantly higher in the striatum (F2,10 = 13.24, P < 0.005) with FRTM (10.1% ± 4.7%) than with SRTM2 (5.2% ± 2.5%) or MRTM2 (3.3% ± 1.2%) and to be overall significantly higher in all brain regions (F1,47 = 40.93, P < 0.001) with SRTM2 (11.7% ± 9.0%) than with MRTM2 (4.3% ± 2.6%). It is also noteworthy that the BPND %COV increases with decreasing BPND and varies from 5.2% in the striatum to 19.8% in the parietal region for SRTM2, and from around 3% in the striatum to 6% to 7% in the cortex for MRTM2.
A repeated-measures ANOVA for R1 between FRTM, SRTM2, and MRTM2 in the striatum showed a significant difference (F2,10 = 13.26, P < 0.05) and post hoc tests revealed that R1 was significantly higher (+ 4.0%, P < 0.05) with FRTM than with SRTM2 or MRTM2, and a paired sample t-test between SRTM2 and MRTM2 in all regions showed a difference of 0.3% (t47 = 4.68, P < 0.001). A paired sample t-test for R1 %COV between SRTM2 and MRTM2 in all regions showed that it is significantly higher (+ 45%, F1,47 = 19.13, P < 0.001) with SRTM2 (1.9% ± 1.0%) than with MRTM2 (1.3% ± 0.1%).
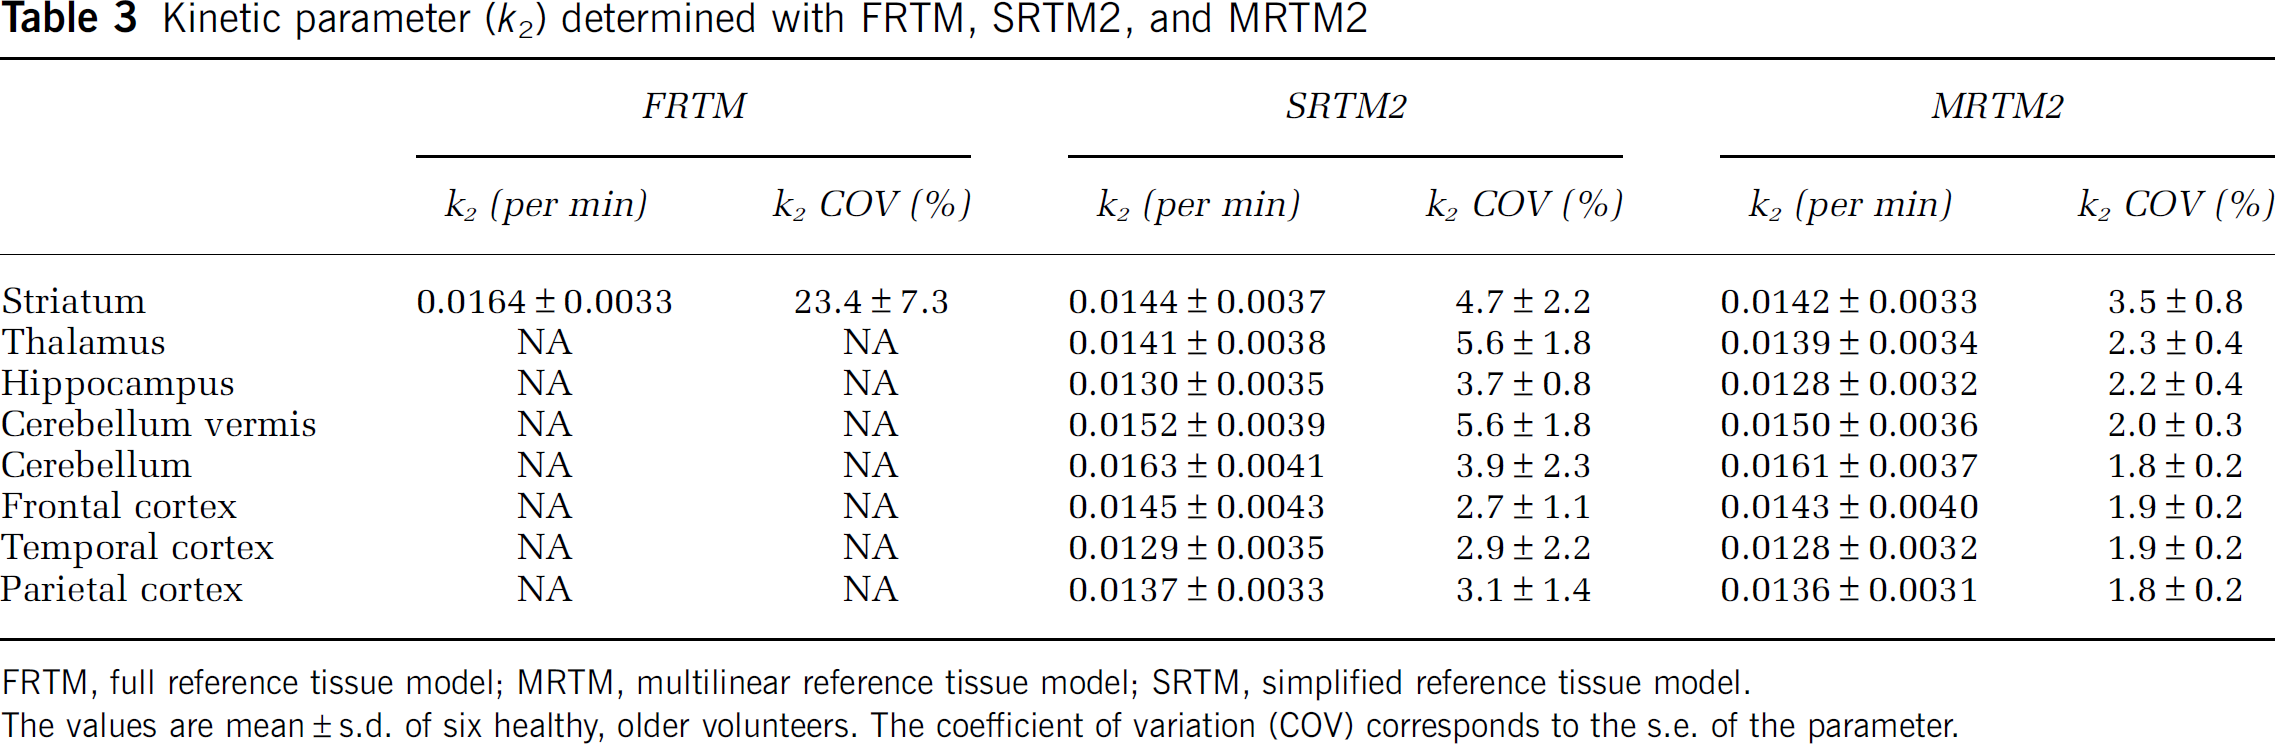
A repeated-measures ANOVA for k2 between FRTM, SRTM2, and MRTM2 in the striatum showed no significant difference (F2,10 = 3.74, P < 0.05) and between SRTM2 and MRTM2 in all regions showed that k2 is significantly higher (+ 1.1%, F1,47 = 4.90, P < 0.05) with SRTM2 (0.0143 ± 0.0036 per min) than with MRTM2 (0.0141 ± 0.0034 per min). A repeated-measures ANOVA between the regions showed no significant difference with both SRTM2 (F7,47 = 0.56, P > 0.05) and MRTM2 (F7,47 = 0.62, P > 0.05). The k2 %COV in the striatum is of 23.4% ± 7.3% with FRTM, indicating that the k2 parameter could not be very reliably estimated with this method, and is significantly higher (F2,10 = 48.22, P < 0.001) than with SRTM2 (4.7% ± 2.2%) or MRTM2 (3.5% ± 0.8%). It goes from around 3% in the frontal, temporal, and parietal cortices to 5.6% in the thalamus and cerebellar vermis for SRTM2 and from around 2% in the cortical regions to 3.5% in the striatum for MRTM2, and a paired sample t-test showed that it is significantly higher (+ 85%, F1,47 = 43.14, P < 0.001) with SRTM2 (4.0% ± 2.0%) than with MRTM2 (2.2% ± 0.6%).
The SRTM2, MRTM2, and Logan methods have similar BPND %VAR, increasing with decreasing binding potential and ranging from around 7% for the thalamus to around 35% for the parietal cortex, with around 12% for the striatum (12.9%, 11.6%, and 12.1% for SRTM2, MRTM2, and Logan, respectively), and a repeated-measures ANOVA revealed no significant difference between the three methods (F2,14 = 0.11, P > 0.05). For R1 and k2, a similar variance was found across the brain regions, with a mean R1 %VAR of 9.3% ± 1.5% for both SRTM2 and MRTM2, and a mean k2 %VAR of 26.4% ± 1.8% and 24.5% ± 1.7% for SRTM2 and MRTM2, respectively. A paired sample t-test showed no difference between SRTM2 and MRTM2 for R1 %VAR (t7 = 0.17, P > 0.05) and a higher k2 %VAR (+ 7.4%, t7 = 13.4, P < 0.05) with SRTM2 than with MRTM2.
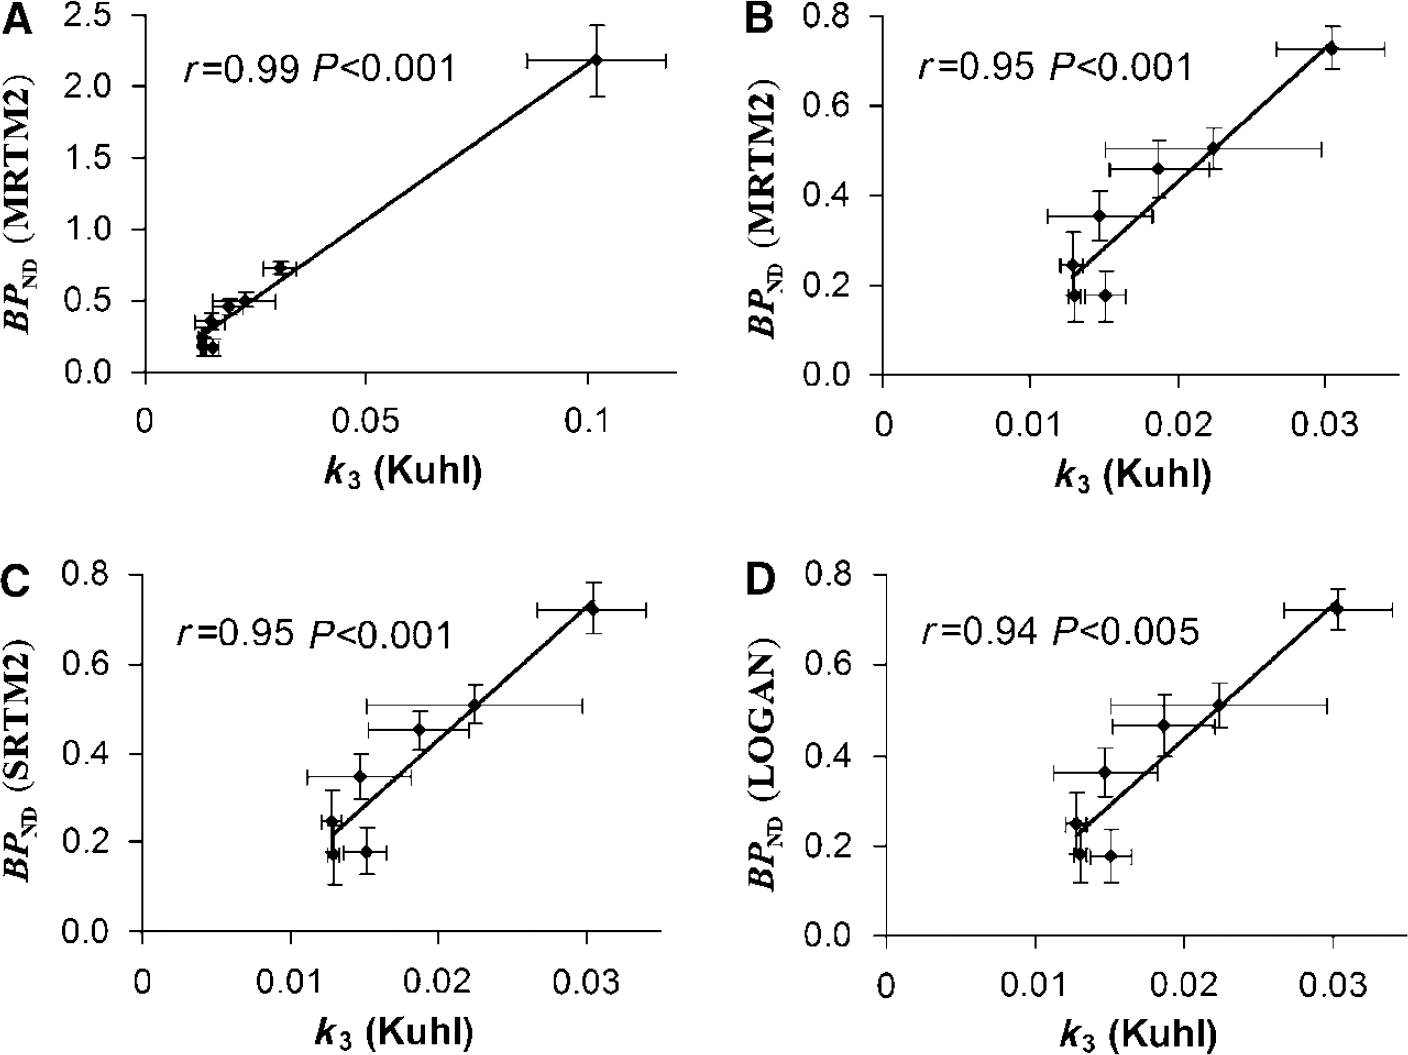
A correlation study was performed between BPND evaluated with MRTM2, SRTM2, and Logan and the k3 binding index reported by Kuhl et al (1994), where they used a 2TCM with blood sampling to obtain the kinetic parameters. A very good correlation was found for all three methods: r = 0.99, P < 0.001; r = 0.99, P < 0.001; and r = 0.99, P < 0.001, respectively. To ensure that this high correlation was not because of the striatum data point being very far from the others (Figure 3A) and very influential (leverage value of 0.84 and Cook's Distance of 34 (Cook, 1979)), the correlation coefficients were recalculated after exclusion of the data point (Figures 3B to D) and the results were still found to be highly correlated: r = 0.95, P < 0.001; r = 0.95, P < 0.001; and r = 0.94, P < 0.005, respectively. The rank order for BPND values estimated with any of the three methods was striatum > thalamus > hippocampus > cerebellar vermis > cerebellum > frontal cortex > temporal cortex > parietal cortex (see Table 1), which agrees reasonably well with Kuhl et al (1994), who estimated the order as striatum > thalamus > hippocampus > cerebellar vermis > temporal cortex > cerebellum > parietal cortex > frontal cortex. No significant correlation was found between R1 estimated with SRTM2 and MRTM2 and R1 determined by Kuhl et al (1994) (r = 0.69, P > 0.05 and r = 0.70, P > 0.05, respectively), and no correlation was found for k2 between the findings of Kuhl et al (1994) and the SRTM2 and MRTM2 models.
Correlation between BPND estimated with MRTM2 (A and B), SRTM2 (C), and Logan (D) and the k3 binding index reported by Kuhl et al (1994).
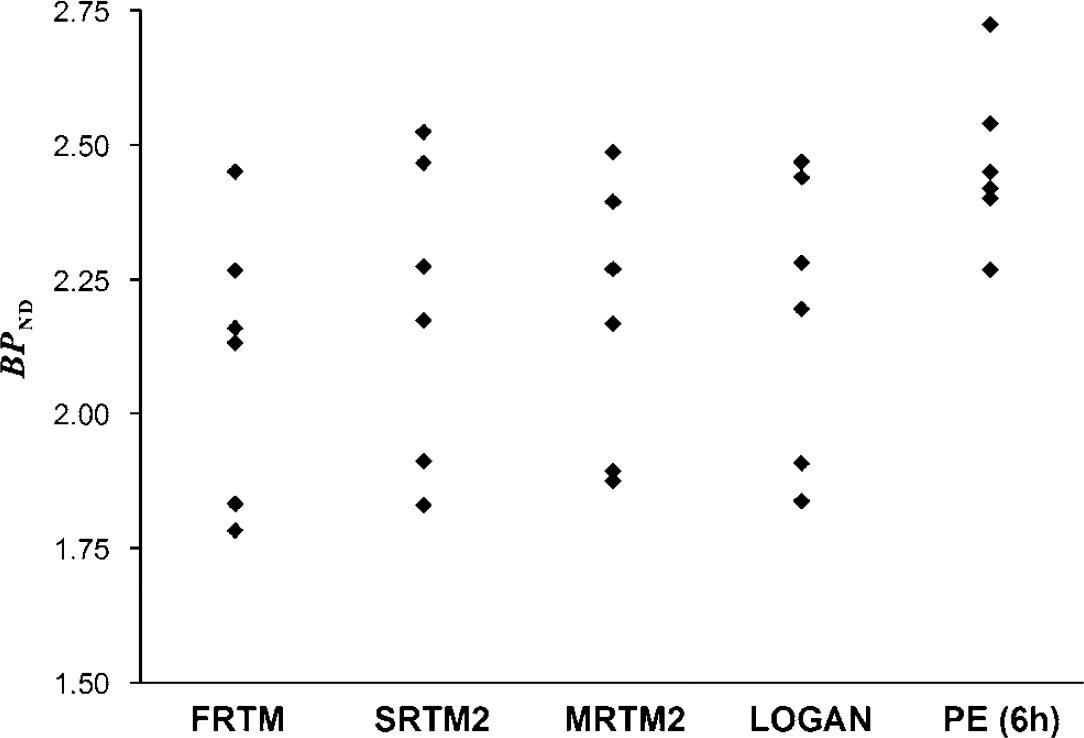
As can be seen in Figure 1, PE was not quite reached in the striatum at 6 h after injection, and the time of equilibrium could therefore not be derived. Nevertheless, BPND was calculated at different times from the fitted curves using equation (14) to evaluate a simplified quantification methodology and was found to be 2.23 ± 0.11, 2.35 ± 0.13, and 2.47 ± 0.15 at 5, 5.5, and 6 h after injection, respectively. A significant correlation (P < 0.05) was found between PE and the FRTM, SRTM2, MRTM2, and Logan methods, increasing from 0.6, 0.62, 0.66, and 0.70 at 5 h after injection, respectively, to 0.76, 0.78, 0.82, and 0.84 at 6 h after injection, respectively. Figure 4 shows the binding potential of each subject estimated with the various methods. The PE method at 6 h after injection gave results systematically higher (paired sample t-test, P < 0.05) by 17%, 12%, 13%, and 13% compared with FRTM, SRTM2, MRTM2, and Logan, respectively, but had the smallest %VAR of 6.2% compared with 12.2%, 12.9%, 11.6%, and 12.1% for FRTM, SRTM2, MRTM2, and Logan, respectively.
BPND estimated in the striatum with the FRTM, SRTM2, MRTM2, Logan, and peak equilibrium methods for the six healthy, older volunteers.
Discussion
[123I]-IBVM has already been used as a molecular imaging probe in patients with dementia (Kuhl et al, 1994), but to date [123I]-IBVM has only been quantified using a four-parameter kinetic analysis with arterial plasma input function, and the most important result of the present study was therefore to show that noninvasive in vivo methods are useful to obtain reliable estimates of VAChT binding parameters from the analysis of [123I]-IBVM brain uptake curves in humans. The extended acquisition time required to obtain PE, beyond 6 h after injection, limits BVM application as a positron emission tomography imaging tracer in vivo. Conversely, because of the half-life of iodine-123 (13.2 h), [123I]-IBVM is a promising radiotracer for molecular SPECT imaging in humans, with efficient quantification possibilities.
As previously described (Kuhl et al, 1994), the regional distribution of [123I]-IBVM uptake was concordant with the known densities of ACh sites in the brain (McGeer et al, 1980; Bird et al, 1983; Araujo et al, 1988). The highest levels of uptake were observed in the striatum; intermediate levels in the thalamus, hippocampus, and cerebellum; and low levels in the cortical regions, the lowest being in the occipital cortex, which was used as the reference region for the estimation of the nondisplaceable compartment uptake.
The 2TCM FRTM method with the estimation of four kinetic parameters failed to reach convergence in all subjects and all brain regions. These convergence problems, which have already been reported (Lammertsma and Hume, 1996), lead to parameter estimates with large %COV or with unlikely values from a physiologic point of view. Also, this method did not allow the identification of k3 but was found to provide reasonably precise estimates of BPND. The difficulty in deriving reliable individual estimates of k3 and k4 from a 2TCM while obtaining a relatively stable ratio between both parameters (BPND = k3/k4) has already been reported (Koeppe et al, 1991; Hume et al, 1992; Carson et al, 1993; Lamelle et al, 1994; Lammertsma et al, 1996; Gunn et al, 1998). The problem faced with convergence and parameter identifiability is because of the poor separation between nondisplaceable and specific compartments because of the rapid equilibration occurring between these two compartments, as indicated by the small difference between the 2TCM FRTM and 1TCM SRTM2 fits of the striatal TAC. This rapid equilibration led Koeppe et al (1991) and Lammertsma et al (1996) to propose a 1TCM kinetic analysis for [11C]flumazenil and [11C]raclopride, respectively, and this appears to be the method of choice for [123I]-IBVM. Indeed, the results do not show any statistical difference between the kinetic analyses of [123I]-IBVM brain uptake curves in the striatum using a 1TCM or 2TCM, as assessed by the repeated-measures ANOVA on BPND and the paired t-test on AIC. This indicates that the simpler 1TCM is more appropriate for the analyses of [123I]-IBVM data than the more complex 2TCM, as both give identical results for the striatal data, whereas at the same time the 1TCM SRTM2 gives a significantly lower %COV and reaches convergence in all brain regions. Indeed, the relative insensitivity to starting values and the greater stability of the 1TCM SRTM2 method allow for fitting data with relatively higher noise levels, and, therefore, this method is more appropriate for SPECT data (Lammertsma and Hume, 1996). Moreover, the MRTM2 and Logan methods, both not making any assumption about the number of underlying compartments to be used, found a t* = 0, and this is in support of a 1TCM.
Good correlation was observed between the SRTM2, MRTM2, and Logan method and the results of Kuhl et al (1994) as far as the binding potential is concerned. However, no correlation or significant correlation was found with their results for R1 and k2. Kuhl et al (1994) determined a distribution volume VND of the rapidly equilibrating nondisplaceable compartment ranging from about 3.0 to 3.5 in cortical regions to about 6.0 to 7.0 in the basal ganglia. This varying VND (unconstrained model) is in contradiction with one of the assumptions of reference models of equal nondisplaceable distribution volume (constrained model) across the brain (VND = V'ND) and explains the absence of correlation for B1 and k2. However, Kuhl et al (1994) stated that the larger VND in the striatum where greater binding occurs may be caused by the inability of the kinetic model to completely separate the specific compartment from the free plus nonspecific compartment. Furthermore, their results display a strong correlation (r = 0.73, P < 0.05) between the clearance rate k2 and the binding index k3 and therefore between VND and k3. Although this correlation can be explained by variable nonspecific binding across the brain regions, the linear relationship strongly suggests the inability of their kinetic model to properly separate the nondisplaceable and the specific compartment in all regions. The discrepancy in the rank order at low BPND between our results and the findings of Kuhl et al (1994) is most certainly partly attributable to this effect as well as to the loss of parameter estimates accuracy at low BPND (larger %COV), and to some extent possibly to a different definition of the ROIs.
Since the PE was not reached, it is theoretically contestable to use this method for the calculation of BPND. Nevertheless, this methodology was applied and several points are noteworthy. (1) A significant correlation between the simplified PE methodology and the other methods was found, and this correlation increases with the time of evaluation. It may therefore be indicated to extend the acquisitions beyond 6 h after injection. (2) This method gave results systematically higher than with the other methods and this effect tends to increase with time (data not shown) and therefore an overestimation of BPND is to be expected at the time of PE. Indeed, although the total area under the curves CND and C'ND are equal because of the VND = V'ND constraint, the kinetics of the two curves are different (CND ≠ CND), and the time when they are maximally different from CT (that is, the time of maximum specific binding) as well as the value of this difference do not in general agree, and this leads to an overestimation of BPND (Carson et al, 1993). Finally, it should be noted that this method gave the smallest %VAR and might therefore prove to give a useful index for [123I]-IBVM quantification. The ideal method for the analysis of clinical data is often a tradeoff between accuracy and simplicity. Therefore, although theoretically arguable, this simple method should not be discarded and should be tested on a bigger population of volunteers and patients, possibly at slightly later times.
No significant difference was observed in all brain regions between SRTM2, MRTM2, and Logan for the estimation of BPND. A difference was found between SRTM2 and MRTM2 for the estimation of B1 and k2 but it remained very small, 0.3% and 1.1% respectively. No difference was found for BPND %VAR between SRTM2, MRTM2, and Logan, implying that all three methods would be as sensitive in detecting potential changes in BPND between healthy subjects and patients. However, BPND %COV, R1 %COV, and k2 %COV were found to be significantly lower with MRTM2 compared with SRTM2, and this is indicative of a better stability of MRTM2. Therefore, we found that MRTM2 was the method of choice for the quantification of [123I]-IBVM data, as it gives more similar results than SRTM2 for VAChT binding parameters while at the same time having a smaller %COV and, therefore, being more stable. Also, MRTM2 is more advantageous than the noninvasive Logan method as it provides the relative blood flow measurement parameter R1. This parameter is of great interest in patients with dementia, as temporoparietal perfusion is more affected in the early stage of AD and an increase in striatal perfusion in DLB was postulated to be a compensatory change related to decreasing striatal dopaminergic input from the substantia nigra (for review, see Burn, 2006).
The MRTM2 method takes into account perfusion differences between the ROIs and the reference region, and [123I]-IBVM binding estimation with this model is therefore independent of blood flow. However, it should be noted that it is affected by potential atrophy. Indeed, because of partial volume effects, atrophy will result in an underestimation of K1 but not of k2, and the assumption of equal nondisplaceable volume of distribution across brain regions will no longer be valid. There is specific atrophy localization depending on the dementia type, with, for instance, atrophy in the medial temporal lobe being more pronounced in AD than in DLB. In this older population, MRI is used to note any abnormalities that may be relevant to interpretation of the SPECT data. The PE method will be affected by atrophy as well, but contrary to MRTM2, it will also be affected by regional cerebral blood flow changes, since BPND estimated by this method was found to be blood flow-dependent (Hume et al, 1992; Ginovart et al, 2001). Consequently, for this method, alteration of regional cerebral blood flow by the pathology under study will have to be estimated, as, otherwise, BPND changes will no longer solely reflect changes of VAChT binding.
In conclusion, we showed in this study that MRTM2 is the method of choice for the in vivo quantification of [123I]-IBVM without arterial measurement, and that it provides a perfusion measurement that will be useful in patients with dementia exhibiting specific distribution of hypo- and/or hyperperfusion.
Footnotes
Acknowledgements
We thank Denis Guilloteau (INSERM U619, Université François Rabelais, Tours, France) for providing IBVM, and the Centre d'Investigation Clinique (CHU de Bordeaux, France) for supporting this research project.
References
1.
AkaikeH (1974) A new look at the statistical model identification. IEEE Trans Automat Contr19:716–23.
2.
AltarCAMarienMR (1988) [3H]Vesamicol binding in brain: autoradiographic distribution, pharmacology, and effects of cholinergic lesions. Synapse2:486–93.
3.
AraujoDMLapchakPARobitailleYGauthierSQuirionR (1988) Differential alteration of various cholinergic markers in cortical and subcortical regions of human brain in Alzheimer's disease. J Neurochem50:1914–23.
4.
BahrBAClarksonEDRogersGANorembergKParsonsSM (1992) A kinetic and allosteric model for the acetylcholine transporter—vesamicol receptor in synaptic vesicles. Biochemistry31:5752–62.
5.
BirdTDStranahanSSumiSMRaskindM (1983) Alzheimer's disease: choline acetyltransferase activity in brain tissue from clinical and pathological subgroups. Ann Neurol14:284–93.
6.
BurnDJ (2006) Cortical Lewy Body disease and Parkinson's disease dementia. Curr Opin Neurol19:572–9.
7.
CarsonREChanningMABlasbergRGDunnBBCohenRMRiceKCHerscovitchP (1993) Comparison of bolus and infusion methods for receptor quantitation: application to [18F]cyclofoxy and positron emission tomography. J Cereb Blood Flow Metab13:24–42.
8.
CookRD (1979) Influential observations in linear regression. J Amer Stat Ass74:169–74.
9.
DeKoskySTIkonomovicMDStyrenSDBeckettLWisniewskiSBennettDACochranEJKordowerJHMufsonEJ (2002) Upregulation of choline acetyltransferase activity in hippocampus and frontal cortex of elderly subjects with mild cognitive impairment. Ann Neurol51:145–55.
10.
EvansACCollinsDLMillsSRBrownEDKellyRLPetersTM (1993) 3D statistical neuroanatomical models from 305 MRI volumes. Proc IEEE NSS/MIC Conf1813–7.
11.
FardeLErikssonLBlomquistGHalldinC (1989) Kinetic analysis of central [11C]raclopride binding to D2-dopamine receptors studied by PET: a comparison to the equilibrium analysis. J Cereb Blood Flow Metab9:696–708.
12.
GilmorMLEricksonJDVaroquiHHershLBBennettDACochranEJMufsonEJLeveyAI (1999) Preservation of nucleus basalis neurons containing choline acetyltransferase and the vesicular acetylcholine transporter in the elderly with mild cognitive impairment and early Alzheimer's disease. J Comp Neurol411:693–704.
13.
GinovartNWilsonAAMeyerJHHusseyDHouleS (2001) Positron emission tomography quantification of [11C]-DASB binding to the human serotonin transporter: modeling strategies. J Cereb Blood Flow Metab21:1342–53.
14.
GunnRNSargentPABenchCJRabinerEAOsmanSPikeVWHumeSPGrasbyPMLammertsmaAA (1998) Tracer kinetic modeling of the 5-HT1A receptor ligand [carbonyl-11C]WAY-100635 for PET. Neuroimage8:426–440.
HumeSPMyersRBloomfieldPMOpacka-JuffryJCremerJEAhierRGLuthraSKBrooksDJLammertsmaAA (1992) Quantitation of carbon-11-labeled raclopride in rat striatum using positron emission tomography. Synapse12:47–54.
17.
IchiseMBallingerJRGolanHVinesDLuongATsaiSKungHF (1996) Noninvasive quantification of dopamine D2 receptors with iodine-123-IBF SPECT. J Nucl Med37:513–20.
18.
IchiseMLiowJSLuJQTakanoAModelKToyamaHSuharaTSuzukiKInnisRBCarsonRE (2003) Linearized reference tissue parametric imaging methods: application to [11C]DASB positron emission tomography studies of the serotonin transporter in human brain. J Cereb Blood Flow Metab23:1096–112.
19.
InnisRBCunninghamVJDelforgeJFujitaMGjeddeAGunnRNHoldenJHouleSHuangSCIchiseMIidaHItoHKimuraYKoeppeRAKnudsenGMKnuutiJLammertsmaAALamelleMLoganJMaguireRPMintunMAMorrisEDParseyRPriceJCSlifsteinMSossiVSuharaTVotawJRWongDFCarsonRE (2007) Consensus nomenclature for in vivo imaging of reversibly binding radioligands. J Cereb Blood Flow Metab27:1533–9.
20.
ItoHHietalaJBlomqvistGHalldinCFardeL (1998) Comparison of the transient equilibrium and continuous infusion method for quantitative PET analysis of [11C]raclopride binding. J Cereb Blood Flow Metab18:941–50.
21.
JungYWVan DortMEGildersleeveDLWielandDM (1990) A radiotracer for mapping cholinergic neurons of the brain. J Med Chem33:2065–8.
22.
KoeppeRAHolthoffVAFreyKAKilbournMRKuhlDE (1991) Compartmental analysis of [11C]flumazenil and kinetics for the estimation of ligand transport rate and receptor distribution using positron emission tomography. J Cereb Blood Flow Metab11:735–44.
23.
KuhlDEKoeppeRMinoshimaSSnyderSEFicaroEPFosterNLFreyKAKilbournMR (1999) In vivo mapping of cerebral acetylcholinesterase activity in aging and Alzheimer's disease. Neurology52:691–9.
24.
KuhlDEKoeppeRAFessierJAMinoshimaSAckermannRJCareyJEGildersleeveDLFreyKAWielandDM (1994) In vivo mapping of cholinergic neurons in the human brain using SPECT and IBVM. J Nucl Med35:405–10.
25.
KuhlDEMinoshimaSFessierJAFreyKAFosterNLFicaroEPWielandDMKoeppeRA (1996) In vivo mapping of cholinergic terminals in normal aging, Alzheimer's disease, and Parkinson's disease. Ann Neurol40:399–410.
26.
LammertsmaAABenchCJHumeSPOsmanSGunnKBrooksDJFrackowiakRS (1996) Comparison of methods for analysis of clinical [11C]raclopride studies. J Cereb Blood Flow Metab16:42–52.
27.
LammertsmaAAHumeSP (1996) Simplified reference tissue model for PET receptor studies. Neuroimage4:153–8.
28.
LamelleMBaldwinRMRattnerZAl-TikritiMSZea-PonceYZoghbiSSCharneyDSPriceJCFrostJJHofferPB (1994) SPECT quantification of [123I]iomazenil binding to benzodiazepine receptors in nonhuman primates: I. Kinetic modeling of single bolus experiments. J Cereb Blood Flow Metab14:439–52.
29.
LoganJFowlerJSVolkowNDWolfAPDeweySLSchlyerDJMacGregorRRHitzemannRBendriemBGatleySJ (1990) Graphical analysis of reversible radioligand binding from time-activity measurements applied to [N-11C-methyl]-(—)-cocaine PET studies in human subjects. J Cereb Blood Flow Metab10:740–7.
30.
LoganJFowlerJSVolkowNDWangGJDingYSAlexoffDL (1996) Distribution volume ratios without blood sampling from graphical analysis of PET data. J Cereb Blood Flow Metab16:834–40.
31.
MarquardtDW (1963) An algorithm for least-squares estimation on non-linear parameters. J Soc Ind Appl Math11:431–41.
32.
MazèreJPrunierCBarretOGuyotMHommetCGuilloteauDDartiguesJFAuriacombeSFabrigouleCAllardM (2008) In vivo imaging of vesicular acetylcholine transporter using [123I]-IBVM in early Alzheimer's disease. Neuroimage40:280–8.
33.
McGeerPLEcclesSJCMcGeerEG (1980) Molecular neurobiology of the mammalian brain. New York: Plenum Press.
34.
MintunMARaichleMEKilbournMRWootenGFWelchMJ (1984) A quantitative model for the in vivo assessment of drug binding sites with positron emission tomography. Ann Neurol15:217–27.
35.
PatlakCSBlasbergRGFenstermacherJD (1993) Graphical evaluation of blood-to-brain transfer constants from multiple-time uptake data. J Cereb Blood Flow Metab3:1–7.
36.
ReesTMBrimijoinS (2003) The role of acetylcholinesterase in the pathogenesis of Alzheimer's disease. Drugs Today (Barc)39:75–83.
37.
SlifsteinMLamelleM (2001) Models and methods for derivation of in vivo neuroreceptor parameters with PET and SPECT reversible radiotracers. Nucl Med Biol28:595–608.
38.
StudholmeCHillDLGHawkesDJ (1999) An overlap invariant entropy measure of 3D medical image alignment. Pattern Becognition32:71–86.
39.
Tzourio-MazoyerNLandeauBPapathanassiouDCrivelloFEtardODelcroixNMazoyerBJoliotM (2002) Automated anatomical labeling of activations in SPM using a macroscopic anatomical parcellation of the MNI MRI single-subject brain. Neuroimage15:273–89.
40.
Van DortMEJungYWGildersleeveDLHagenCAKuhlDEWielandDM (1993) Synthesis of the 123I- and 125I-labeled cholinergic nerve marker (—)-5-iodobenzovesamicol. Nucl Med Biol20:929–37.
41.
WuYCarsonRE (2002) Noise reduction in the simplified reference tissue model for neuroreceptor functional imaging. J Cereb Blood Flow Metab22:1440–52.
42.
Zea-PonceYMavelSAssaadTKruseSEParsonsSMEmondPChalonSGiboureauNKassiouMGuilloteauD (2005) Synthesis and in vitro evaluation of new benzovesamicol analogues as potential imaging probes for the vesicular acetylcholine transporter. Bioorg Med Chem13:745–53.