
Abstract
We compare region of interest (ROI) analytical approaches with statistical parametric mapping (SPM) of 11C-diprenorphine positron emission tomography findings in five patients with Huntington's disease (HD) and nine age-matched controls. The ROI were placed on caudate, putamen, and an occipital reference area. Ratios of striatal–occipital uptake from averaged static images centered at 60 minutes showed a mean 20% reduction in caudate (P = 0.034) and 15% reduction in putamen (P = 0.095) receptor binding in the HD patients. Dynamic data from caudate and putamen ROI, together with a plasma tracer input function, were analyzed using spectral analysis to give regional impulse response functions. Regional data at 60 minutes after impulse showed a mean 29% decrease in caudate (P = 0.006) and 23% decrease in putamen (P = 0.029) opioid binding in the HD cohort. Parametric images of tracer binding also were produced with spectral analysis on a voxel basis. The images of the unit impulse response function at 60 minutes showed a mean 31 % decrease in caudate (P = 0.005) and a 26% decrease in putamen binding (P = 0.011) in HD. The voxel-based parametric images were transformed into standard stereotactic space, and a between-group comparison (patient versus controls) was performed with SPM. This approach revealed symmetrical decreases in caudate (peak 40% decrease, z score = 4.38) and putamen opioid binding (peak 24% decrease, z score = 4.686) with additional nonhypothesized changes in cingulate, prefrontal, and thalamic areas. The significance and precision of changes measured with spectral analysis applied to dynamic data sets were superior to ROI-based ratio analysis on static images. The SPM replicated the striatal reductions in opioid binding in HD and detected additional nonpredicted changes. This study suggests that SPM is a valid alternative to conventional ROI analytical approaches for determining binding changes with positron emission tomography and may have advantages over region-based analyses in exploratory studies.
Keywords
Positron emission tomography (PET) studies of ligand binding in brain tissue can be analyzed in several ways. These range from relatively simple ratio techniques involving comparisons of summated activity in tissue regions of interest with that in a reference region, through to the analysis of dynamic data using more complex mathematical models. Whereas the latter approaches may give better and more physiologically relevant measures of receptor–ligand interactions, they involve more data processing and usually require invasive sampling of arterial blood to generate an input function. Whether fitted dynamic data is superior compared with simple ratio analysis in detecting pathologic change is uncertain. We therefore compare results from a region-based ratio analysis of static data with results obtained with spectral analysis (Cunningham and Jones, 1993) of dynamic data from the same regions.
The manual definition of tissue regions and the subsequent kinetic analysis of mean regional data require an a priori choice of the regions of interest (ROI). Whereas this approach has been successful in addressing several scientific issues, it is not without problems. Frequently, the size, shape, and number of regions chosen for analysis and the number of planes of data on which they were placed has been subjective. Coregistered magnetic resonance imaging and semiautomated routines can be used to help define region size, shape, and location and so eliminate the subjective component of region placement, but do not fully overcome the problems in identifying functionally distinct areas of cortex. In addition, the coregistration procedure transforms the PET data set and so introduces errors. These limitations of conventional ROI analysis have led us to assess the feasibility of using other techniques to analyze PET ligand scans.
Statistical parametric mapping (SPM) has been widely used to localize regions of activation in cerebral blood flow studies when tasks are performed by individuals and groups. Recently, it has been applied to the analysis of changes in radioligand binding (Richardson et al., 1996; Koepp et al., 1996; Frey et al., 1996). We compare ROI analysis with SPM for 11C-diprenorphine PET in controls and patients with Huntington's disease (HD).
Huntington's disease is an autosomal dominant, neurodegenerative condition that affects 1 in 20,000 of the population (Harper, 1992). Postmortem studies in HD demonstrate reduced concentration of pallidal, striatal, and nigral enkephalin and dynorphin and also loss of basal ganglia opioid receptors (Seizinger et al., 1986; Rostene et al., 1988; Gulya, 1990). These findings indicate that the opioid system is extensively involved in the degenerative process of HD.
METHODS
Subjects
Five HD patients were recruited for the study (four men, one woman; mean age 46 years, range 31 to 68 years; mean disease duration 2.7 years). All patients had adult-onset chorea and mutation-confirmed Huntington's disease with a CAG trinucleotide repeat length over 37 (Simpson and Harding, 1993). The patients had never taken neuroleptic medication or medication known to interact with the opioid system. The results from the HD patients were compared with those of nine age-matched healthy volunteers with normal neurologic status. None of the patients or healthy volunteers was in pain during the scan. The patients had only mild chorea and when resting supine did not exhibit axial or head movements. No data, therefore, had to be rejected from the study because of head movement artifacts.
All subjects gave informed written consent. The studies were approved by the Hammersmith Hospital Medical Ethics Committee, and permission to administer radioactivity was obtained from the Administration of Radioactive Substances Advisory Committee of the Department of Health, UK.
Scanning procedure
11C-diprenorphine was prepared as described previously (Luthra et al., 1994). The PET scans were performed on an ECAT 953B (Siemens/CPS, Knoxville, TN) brain tomograph in three-dimensional acquisition mode using a protocol based on a “tracer alone” study (Jones et al., 1994). Before administration of 11C-diprenorphine, a 10-minute transmission scan was performed using rotating 68Ga/68Ge rod sources for subsequent correction for attenuation of radiation in tissue. After the transmission scan, the interplane septa were removed for three-dimensional data acquisition (Spinks et al., 1992). The scatter component was estimated using a dual-energy window approach, and data were corrected for scatter by performing a weighted subtraction of low-energy events (200 to 380 keV) from the high-energy window (380 to 850 keV) (Grootoonk et al., 1992).
An average of 9.8 mCi of 11C-diprenorphine in 5 mL of normal saline was injected as a bolus intravenous injection. Dynamic emission data were then collected over the following 90 minutes in 17 time frames and reconstructed into 31 contiguous horizontal image planes. Data were reconstructed using a three-dimensional reconstruction algorithm (Townsend et al., 1989) to obtain images with resolution of 6.0 × 6.0 × 5.0 mm (full-width half-maximum) at the center of the field of view.
Radioactivity in arterial blood was assayed continuously on-line (Ranicar et al., 1991), and intermittent blood samples were taken for calibration and for assay of radiolabeled metabolites in plasma. The derivation of a plasma input function from the data obtained from arterial blood has been described (Jones et al., 1994). The ratio of the concentration of total radioactivity in plasma to that in whole blood, as measured in the discrete blood samples, was fitted to a linear function of the time of sampling. The proportion of radioactivity in plasma recovered in the parent (nonmetabolized) fraction was fitted to a function describing an exponential approach to a constant fraction. These two fitted functions then were applied to the continuous on-line arterial data, which, after appropriate cross-calibration with the camera, gives a plasma parent input function for subsequent kinetic analyses. It was assumed that only the parent tracer crosses the blood-brain barrier.
Analysis of images
Image analysis was performed using Analyze software (version 6.1, Mayo Foundation, Rochester, MN, U.S.A.) (Robb, 1990). Other software included PRO MATLAB (MathWorks, Natick, MA, U.S.A.) and routines developed in house.
The analysis of data was carried out in four ways. First, a ratio method was used comparing counts averaged over 30 to 90 minutes of scanning in predetermined ROI with those in an occipital reference region. Second, dynamic regional data obtained with the same ROI template was fitted using spectral analysis (Cunningham and Jones, 1993) to give 60-minute tissue impulse response functions (IRF) reflecting regional volume of distribution of the tracer. Third, spectral analysis was performed on voxel-based dynamic data to produce images of the IRF to which ROI were then applied. Finally the voxel-based parametric images were submitted to SPM. These methods are described in detail as follows.
Ratio method
Placement of ROI was determined by inspection of an image of summated tracer activity collected over the last 60 minutes of scanning, centered at the 60-minute time point. The ROI were placed on three areas: head of caudate, dorsal putamen, and an occipital reference area. The ROI for each of these structures were defined on the four adjacent horizontal planes, which showed maximal striatal activity. The striatal regions consisted of four circular ROI of 8.2-mm diameter, one placed over the head of caudate on each side and three placed contiguously over the putamen on each side. The occipital ROI comprised a circular region of 32.8-mm diameter placed over each hemisphere. Mean caudate- and putamen-occipital uptake ratios for the normal and HD groups were calculated and compared using the Student's t statistic.
Spectral analysis
Spectral analysis (Cunningham and Jones, 1993) was applied to ROI and also to voxel by voxel time–activity curves from the dynamic scan sequence. This technique fits each of the observed tissue time–activity curves to a sum of basis functions spanning the expected tissue response. The basis functions were formed by convolving the measured plasma parent input function, Ca(t), with exponential terms of the form [exp(−b.t)] with a logarithmic range of 64 values of b. The data was fitted in nondecay-corrected form with values of b from 5.7 × 10⁻⁴ sec−1 (corresponding to the isotopic decay rate as the slowest expected component) to 1.0 sec−1. Estimates subsequently were corrected for decay of the isotope. This approach can be viewed as a smoothed deconvolution that allows the extraction of the unit IRF from the tissue data. The IRF is independent of the particular plasma input function in any one study and thus enables the subsequent comparisons and combinations of data sets. The integral of the curve of best fit, extrapolated to time point infinity, provides the total volume of distribution of the ligand. Images of time points along the derived tissue response also can be generated. In practice, the volume of distribution images are noisy, and a 60-minute tissue impulse response image (IRF60) was used for further analysis. This is discussed later.
First, time–activity curves for the caudate and putamen regional data defined by the ROI template were fitted to create regional tissue response functions. Second, voxel-based time–activity curves were submitted to spectral analysis, and the ROI template was applied to the voxel-generated IRF60 parametric images. In effect, the two analytical techniques are similar, other than the fitting procedure and the region placement steps being reversed. However, the data from the region-based spectral analysis allow for a more appropriate comparison with the region data obtained from the static ratio analysis. Comparisons of caudate and putamen activity in the patient and controls cohorts were made.
Statistical parametric mapping analysis
Voxel-based IRF60 images from the patient and control cohorts were compared using the technique of SPM (SPM-95, Wellcome Department of Cognitive Neurology, London, U.K.). To facilitate group analysis, the intercommissural (anterior commisure-posterior commissure) line was identified and the volume of each data set transformed into standard stereotactic space (Friston et al., 1991; Talairach and Tournoux, 1988). These stereotactically normalized images contained 26 planes of 2 × 2 × 4 mm voxels corresponding to the horizontal sections in the Talairach atlas.
An analysis of covariance was applied to remove the effect of variance in global activity. Normalized mean activity and the associated variance of such values were determined for each voxel. Each image was smoothed with an isotropic Gaussian kernel of 10 mm. The resulting set of voxel values for the between-group contrasts constitute statistical parametric maps of the t statistic SPM{t}. The SPM{t} maps were transformed to the unit normal distribution (SPM{Z}) and thresholded at Z > 3.09 (equivalent to an uncorrected P < 0.001). The resulting foci then were characterized in terms of peak height estimations. The significance of each region was estimated using distributional approximations from the theory of Gaussian Fields. This characterization is in terms of the probability that the peak height observed could have occurred by chance over the entire volume analyzed (i.e, corrected P value). Assessment of the peak height significance, therefore, included a correction for the number of independent voxels giving a final Z score for peak height significance of 4.35. The PET data set contained 36,417 voxels, 2 × 2 × 2 mm. After smoothing, there were 299 independent resolution elements of resolution 13.1, 14.4, and 10.4 mm (full-width half-maximum).
RESULTS
The results from the ROI analysis using the ratio method on static images centered at 60 minutes after injection and ROI- and voxel-based fits of the IRF60 are shown in Table 1. All of these approaches show decreases in caudate and putamen opioid binding in HD. The results from the parametric data obtained by spectral analysis of the regional time–activity data demonstrate larger differences between patients and controls and greater statistical significance than the static ratio analysis of the same regions. Spectral analysis, regardless of whether applied to ROI or voxel dynamic data sets, gave similar results. The coefficients of variability (standard deviation/means as a percentage [Woolson, 1987]) are shown for the control group for each method and show smaller variability with spectral analysis. The coefficients of variance from the ratio and fitted data were statistically compared using an F test. The results indicate significantly larger variability for putamen measurements in the ratio compared with the fitted data with nonsignificant differences for caudate values.
Comparison of striatal opioid receptor binding assessed using static ratios and spectral analysis fitted on a voxel and on a regional basis
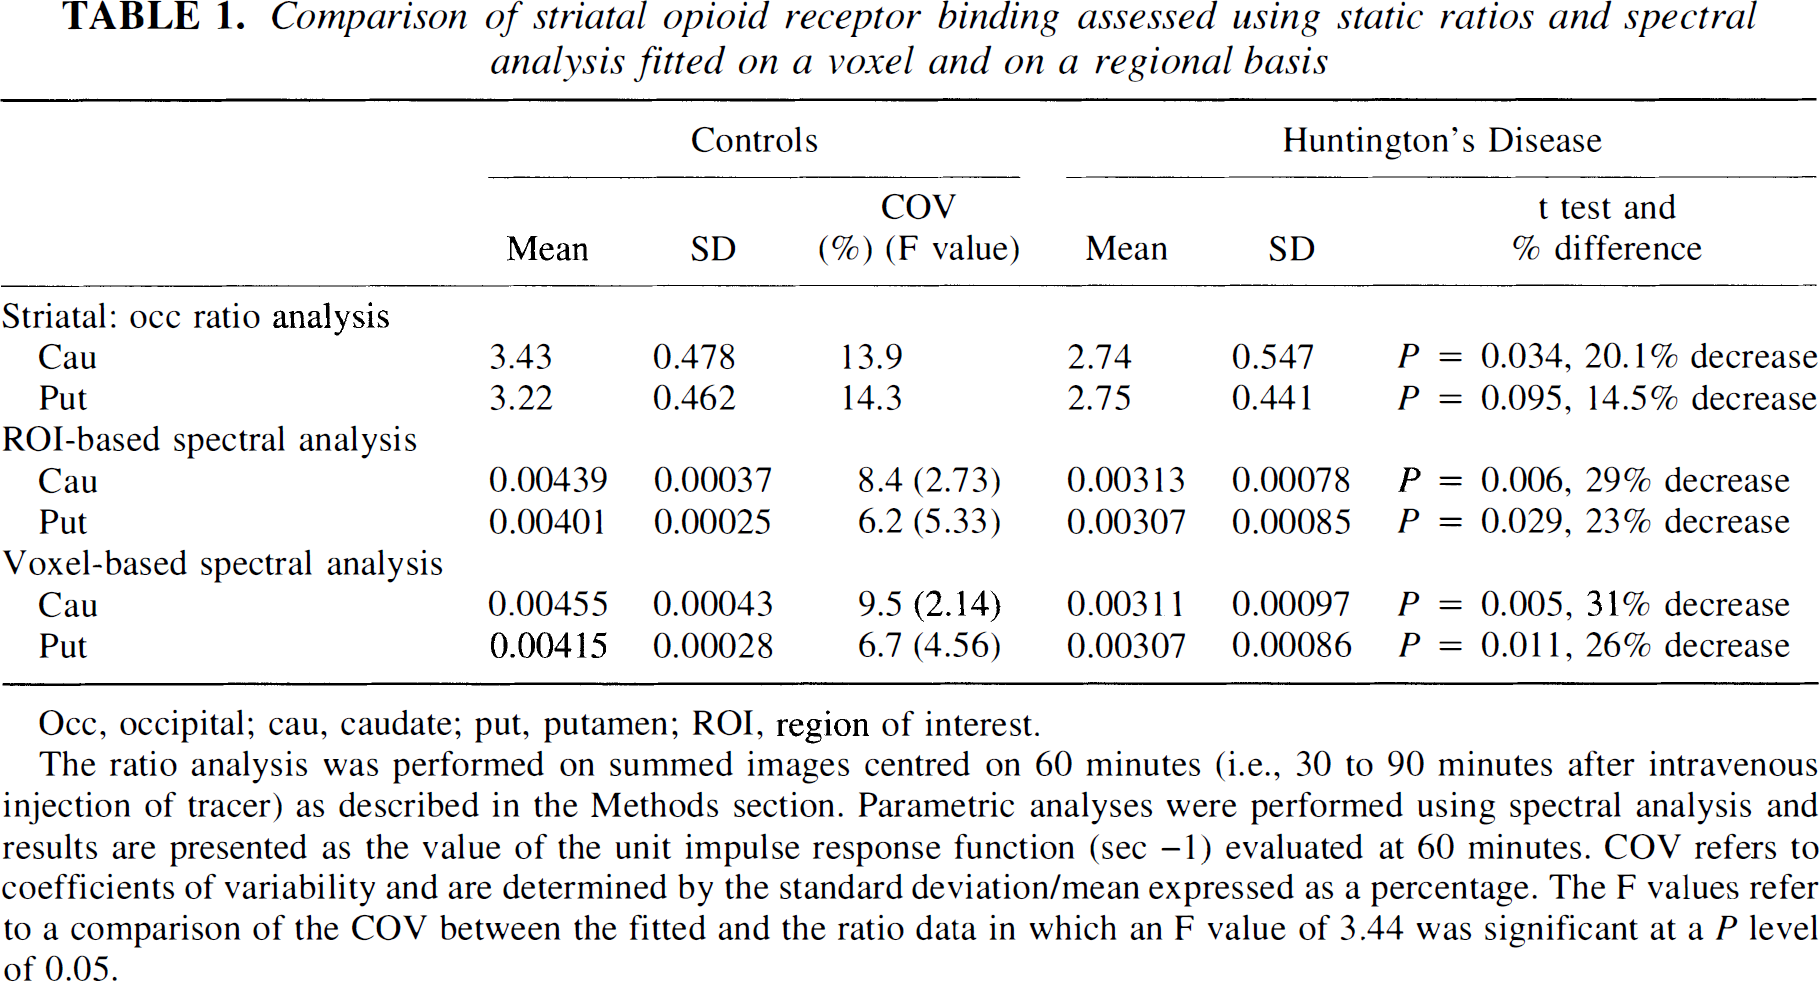
Occ, occipital; cau, caudate; put, putamen; ROI, region of interest.
The ratio analysis was performed on summed images centred on 60 minutes (i.e., 30 to 90 minutes after intravenous injection of tracer) as described in the Methods section. Parametric analyses were performed using spectral analysis and results are presented as the value of the unit impulse response function (sec −1) evaluated at 60 minutes. COV refers to coefficients of variability and are determined by the standard deviation/mean expressed as a percentage. The F values refer to a comparison of the COV between the fitted and the ratio data in which an F value of 3.44 was significant at a P level of 0.05.
The results from the two between group SPM contrasts are given in Table 2, and the SPM projections are illustrated in Figures 1 and 2. Table 2 lists the cerebral regions of statistical change along with the coordinates of the maximal peaks, the Z scores, and the percentage differences between the normalized opiate binding values. Highly significant symmetrical decreases in caudate and putamen opioid receptor binding were evident in the patient group. Additionally, nonhypothesized decreases of binding in cingulate cortex with increases in thalamic and prefrontal receptor binding were observed. The data set initially was thresholded at Z > 3.09 with a Bonferoni-like correction for multiple comparisons. All areas of decreased binding are significant at this level, as are increases of binding in the left thalamus and right ventral prefrontal area. Symmetrical increases in thalamus and prefrontal binding were evident when the threshold was reduced to an uncorrected threshold of Z > 2.576 (equivalent to P < 0.005).
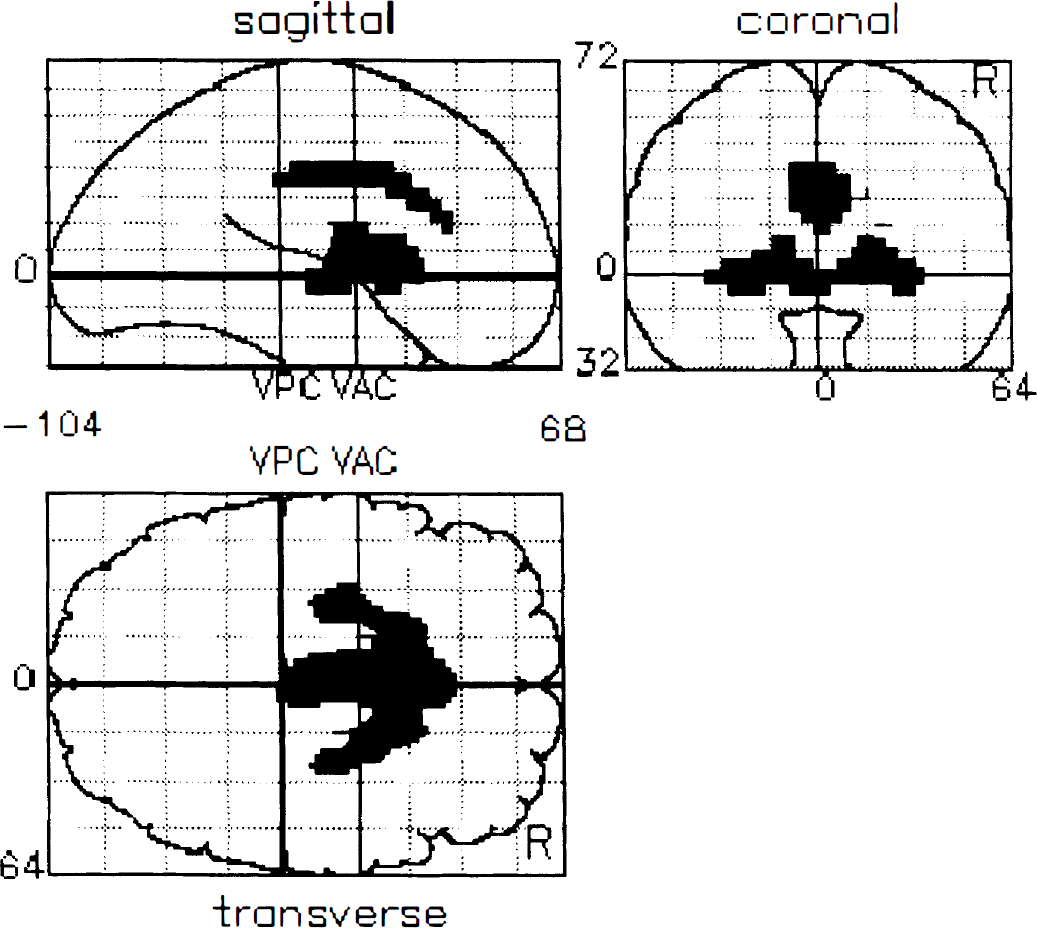
Statistical parametric mapping projections of decreases in opioid receptor binding in Huntington's disease compared with controls. This figure contains a statistical map of the group differences between patients and controls of voxel-based, 60-minute impulse response functions. The voxels of significant decreased activity are projected on three orthogonal views of three-dimensional brain volume (coronal, sagittal, and transverse projections). All changes shown are significant at a threshold of Z > 3.09 with a Bonferoni correction for multiple comparisons.
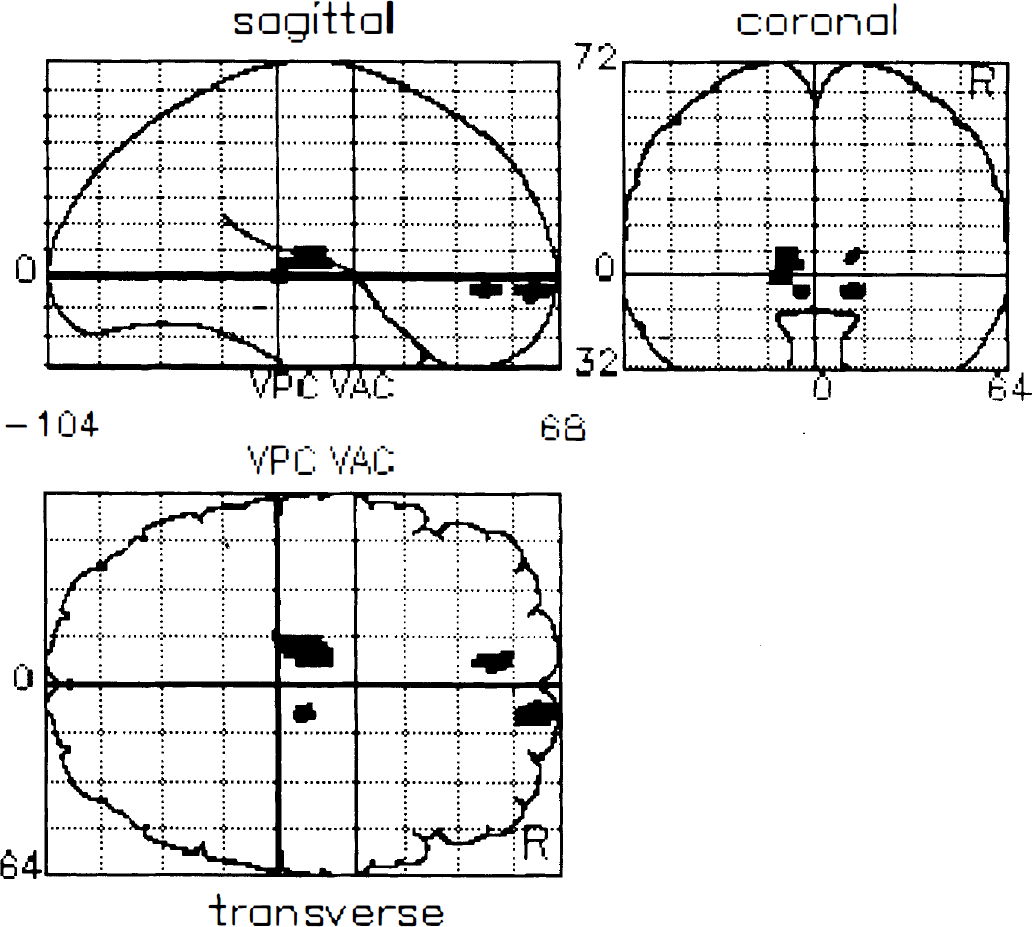
Statistical parametric mapping projections of increases in opioid receptor binding in Huntington's disease compared with controls. Voxels of increased opioid receptor binding are projected on three orthogonal views of three-dimensional brain volume (coronal, sagittal, and transverse projections). All areas shown are significant at the uncorrected threshold Z > 2.56 equivalent to P < 0.005.
Areas with altered opioid receptor binding in patients with Huntington's disease compared with controls using SPM
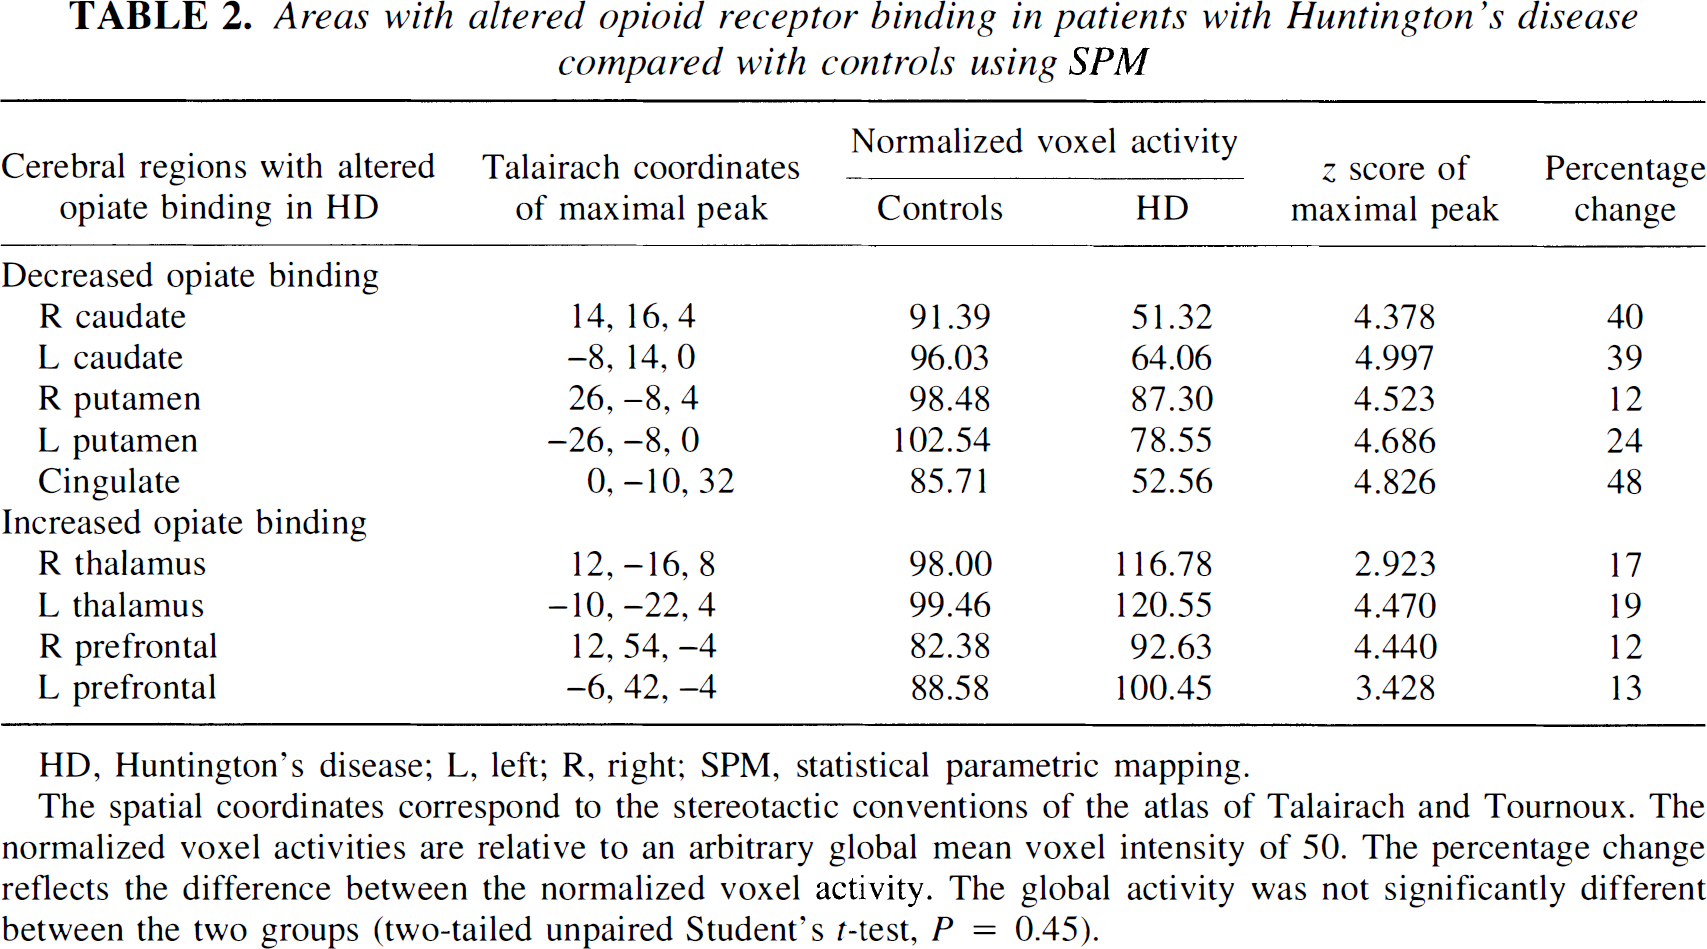
HD, Huntington's disease; L, left; R, right; SPM, statistical parametric mapping.
The spatial coordinates correspond to the stereotactic conventions of the atlas of Talairach and Tournoux. The normalized voxel activities are relative to an arbitrary global mean voxel intensity of 50. The percentage change reflects the difference between the normalized voxel activity. The global activity was not significantly different between the two groups (two-tailed unpaired Student's t-test, P = 0.45).
DISCUSSION
Opioid receptors are widely distributed throughout the human CNS (Goodman et al., 1988). Diprenorphine is a synthetic partial receptor agonist with equal affinity for the three major opioid receptor subtypes: mu, kappa, and delta receptors (Frost et al., 1985; Sadzot et al., 1991). The ligand has high binding in the striatum and thalamus and little specific uptake in primary visual and sensorimotor cortices. Validation studies of the use of radiolabeled diprenorphine in vivo as a quantitative marker of cerebral opioid receptor sites have been carried out in rats and in humans using PET. The work in rats showed a close correlation between estimates of the regional concentrations of binding sites obtained from tracer studies in vivo with those obtained from studies in vitro on brain tissue homogenates (Cunningham et al., 1991). The analysis of the data in vivo was based on a compartmental model that subsequently was adapted for application to studies in humans using PET. Likewise, these studies in humans established a close correlation between the regional binding potential of radiolabeled diprenorphine, based on displacement and presaturation studies, with its total volume of distribution as estimated from tracer alone studies (Jones et al., 1994).
Tracer alone studies do not allow robust estimates of individual rate constants or characterization of individual compartments, particularly at the voxel level. In the current work, spectral analysis was chosen to generate IRF reflecting diprenorphine total volume of distribution, since it makes no assumptions regarding the number of physical compartments that are required to describe tracer kinetics. Early time points on the IRF are dominated by the delivery of the tracer to brain and rCBF, whereas later images are increasingly dominated by binding and reflect the regional concentration of opioid receptor sites (Tadokoro et al., 1993). Whereas the integral of the IRF, extrapolated to time point infinity, equals the total volume of distribution of the tracer, this function tends to be noisy (Cunningham et al., 1993). The IRF60 parametric images were therefore chosen for the analyses carried out in the current work, since (unpublished) computer simulations based on the rate constants in a study by Jones and others (1994) show that IRF60 parametric images correlate strongly with the regional total volumes of distribution, are relatively insensitive to regional differences in flow and delivery of diprenorphine, and are well defined by the measured data.
We analyzed opioid receptor binding data from caudate and putamen using three techniques: (1) a ratio method of regional–reference activity in a static, averaged scan centered at 60 minutes after injection; (2) spectral analysis of dynamic data on a voxel and on a regional basis generating IRF at 60 minutes; and (3) a group comparison of voxel-based parametric images using SPM.
Spectral analysis of ROI-generated dynamic data and ROI analysis of parametric data generated with spectral analysis both produced a pattern of results similar to the simple reference ratio method. However, the significance and magnitude of change in caudate and putamen binding were greater when dynamic time–activity curves were fitted using spectral analysis compared with the ratio analysis of averaged counts from a static image. In addition, the coefficients of variance from the ratio method were significantly larger than those with the fitted data. This suggests that ROI analysis of parametric images is superior in terms of precision in normal subjects and for distinguishing pathologic variation from normality compared with ROI analysis of static ratio images.
There are several reasons why the fitted data may be better than the ratio method. The ratio analysis includes data from an occipital reference region, which contains a low numbers of counts and is noisy. This adds variance to the ratio approach in comparison with spectral analysis, which is based on striatal counts alone. The ratio method generally is used because of the lack of a measurable input function, and thus it may seem obvious that the measurement of a physiologically meaningful input function would lead to improved results; however, this has to be balanced against the introduction of further measurements and their associated noise into the model.
Spectral analysis, regardless of whether applied at a regional or voxel level, gave nearly identical results. As noted previously, the two procedures are similar in principle, and so similar results would be expected. However, the analysis does confirm that spectral analysis performed at a voxel level does not result in degradation of image quality or loss of statistical power.
It is difficult to directly compare the ROI analysis with SPM, since they analyze different aspects of receptor binding. The ROI techniques compare mean binding in predefined regions, whereas SPM measures peak differences on a voxel-by-voxel basis. It is, therefore, not surprising that the peak percentage difference and statistical significance in the SPM analysis was greater than the differences found with ROI analysis. Given the differences of the two approaches, if mean binding estimate is desired such as putamen opioid receptor binding, an ROI-based techniques probably is most appropriate, whereas if an approach that objectively locates areas with maximal binding difference between two data sets is desired, SPM has advantages. The two techniques are not mutually exclusive, and, as in this study, a combination of approaches may be revealing.
The SPM technique can be used to directly compare quantitative PET data or can assess the relative regional distribution of a PET measured parameter after a normalization procedure has removed the effect of global variance. In PET ligand studies, appropriate modeling of tracer behavior allows quantitative measurement. However, inaccuracies in scaling, input functions, and metabolite corrections still can give rise to global variance, which can mask biological variation in regional uptake. We therefore have included an analysis of covariance adjustment in this analysis and report the relative regional distribution of binding changes. The use of analysis of covariance and the sterotactic normalization also can be applied to data obtained with ROI, and so these techniques are not exclusive to SPM.
As an indirect validation of SPM, this approach more sensitively replicated the striatal opioid binding changes independently demonstrated with ROI analysis. The striatal changes detected with SPM were symmetrical, greater, and statistically more significant than those generated using ROI. Statistical parametric mapping also detected additional opioid binding changes in cortical areas that would have been difficult to predict a priori (cingulate, thalamus, and prefrontal). This method of analysis may be of considerable importance in future PET ligand work, since SPM is sensitive to change, avoids potential difficulties in region selection, and maximizes the ability to detect differences between data sets. The ROI analysis still has a major role in measuring ligand binding, but this study suggests that SPM is a viable alternative and has advantages, particularly in exploratory studies.
We now briefly discuss the biological significance of the regionally changed opioid receptor binding in the HD cohort.
Striatum
The earliest histochemical change in asymptomatic HD mutation carriers is reported to be loss of enkephalin binding in striatal projection neurons to the external globus pallidum (Albin et al., 1992). Postmortem studies in patients dying of HD have shown that the proenkephalin group of opioids is reduced in caudate, putamen, and internal and external pallidal tissue, whereas the prodynorphin family is reduced in striatal, external pallidal, and nigral areas (Seizinger et al., 1986). In the current study, the mean striatal opioid receptor binding of the HD patients was reduced by between 20% and 40%, depending on the analytical approach. We have previously demonstrated that both striatal dopamine D1 and D2 receptor binding are reduced by an average of 60% in symptomatic cases of HD (Turjanski et al., 1995) and that 50% of adult asymptomatic mutation carriers show a significant 20% to 30% loss (Weeks et al., 1996). Thus, it appears that opioid receptor sites are less vulnerable to the disease process than dopamine sites, possibly because of preservation of presynaptic opioid sites.
Thalamus
Statistical parametric mapping detected significantly increased thalamic opioid receptor binding in HD. The finding of increased thalamic availability for 11C-diprenorphine binding may reflect decreased occupancy by endogenous opioids, although up-regulation of thalamic receptors also is a possibility. Postmortem studies on patients with advanced disease have shown a 50% decrease in the small cell population of the ventrolateral group of the thalamus (Dom et al., 1976). It is conceivable that with further disease progression and resulting thalamic degeneration, opioid receptor loss would follow. In fact, we have subsequently scanned a patient with disease duration of 8 years who had significantly reduced individual thalamic–occipital ratios, adding weight to this hypothesis. Unfortunately, the patient was not able to tolerate arterial cannulation and so parametric images could not be generated.
Cortex
There has been debate over whether the cerebral cortex is involved in the pathophysiologic mechanism of HD (Bruyn et al., 1979; Cudkowicz and Kowall, 1990). We have demonstrated significant bilateral decreases in cortical opioid receptor binding in the anterior cingulate with increases in the prefrontal areas. However, the nonspecific nature of 11C-diprenorphine and the lack of knowledge of receptor subtype localization in cortical areas makes further interpretation of the cortical changes in this study difficult.
CONCLUSION
We have compared different ROI-based analytical approaches and SPM of 11C-diprenorphine PET scans in five patients with early HD and nine age-matched healthy volunteers. Our findings suggest that the different ROI approaches and SPM lead to similar findings for striatal opioid binding, although the significance and precision of ROI analysis when coupled with spectral analysis of dynamic data sets is superior to ratio analysis of static images. Statistical parametric mapping also demonstrated additional unpredicted changes in opioid binding in cingulate and prefrontal cortex. This study suggests that SPM analysis of PET ligand studies is a viable alternative to conventional ROI analysis and may in exploratory studies reveal unexpected regional binding changes.