
Abstract
We investigated the effects of varying the injected dose, speed of injection, and scan duration to maximize the sensitivity of noninvasive activation studies with 15O-water and three-dimensional positron emission tomography. A covert word generation task was used in four subjects with bolus injections of 2.5 to 30 mCi of 15O-water. The noise equivalent counts (NEC) for the whole brain peaked at an injected dose of 12 to 15 mCi. This was lower than expected from phantom studies, presumably because of the effect of radioactivity outside of the brain. A 10 mCi injection gave an NEC of 92.4 ± 2.2% of the peak value. As the scan duration increased from 60 to 90 to 120 seconds, the areas of activation decreased in size or were no longer detected. Therefore, we selected a 1 minute scan using 10 mCi for bolus injections. We then performed simulation studies to evaluate, for a given CBF change, the effect on signal-to-noise ratio (S/N) of longer scan duration with slow tracer infusions. Using a measured arterial input function from a bolus injection, new input functions for longer duration injections and the corresponding tissue data were simulated. Combining information about image noise derived from Hoffman brain phantom studies with the simulated tissue data allowed calculation of the S/N for a given CBF change. The simulation shows that a slow infusion permits longer scan acquisitions with only a small loss in S/N. This allows the investigator to choose the injection duration, and thus the time period during which scan values are sensitive to regional CBF.
Optimization of scan duration and radiotracer injection speed using 15O-water for CBF measurement has often been discussed with regard to the accuracy of CBF estimation (Lammertsma, 1990). However, in activation studies the signal-to-noise ratio (S/N) is more relevant than the quantitative accuracy of the measured CBF, because the significance of activation is measured by the change in pixel values between scans divided by the SD of that pixel (Kanno et al., 1991). There have been few systematic evaluations of injection method and scan duration based on tissue radioactivity images, particularly for three-dimensional (3-D) positron emission tomography (PET) which has different noise characteristics than two-dimensional (2-D) PET (Cherry et al. 1993; Silbersweig et al. 1993). In this study, we evaluated the effects of injected dose, speed of injection, and scan duration on the S/N of tissue activity changes caused by CBF changes. We used both simulation studies and measurements obtained in humans.
MATERIALS AND METHODS
Human study
Subjects were four right-handed volunteers (3 men and 1 woman) aged 22 to 65 years. All subjects gave informed written consent and the study was approved by the clinical research subpanel of the National Institute of Neurological Disorders and Stroke.
Three subjects each had 10 scans (5 control and 5 task scans), performed at 10-minute intervals. Varied doses of 15O-water (2.5; 5 [×2]; 7.5 [×2]; 10 [×2]; 12.5; 15 [×2] mCi) were injected as a bolus. A letter fluency task (Rueckert et al., 1994) was used in which subjects were required to generate as many words as they could that began with a given letter without overtly pronouncing the words. At the beginning of each word generation condition, 20 seconds before 15O-water injection, subjects were verbally given a letter and commenced word generation. After 30 seconds, they were given a different letter, and after another 30 seconds, a third letter that was used to generate words until the end of the scan. For the control scans, subject were asked to visualize a “night sky” to avoid thinking of words. Subjects were given the verbal command of “night sky” with the same timing as the letters in the word generation condition. During the series of 10 scans, control and word generation tasks were alternated, with the first scan being in the control condition. To evaluate the S/N at higher doses, one subject received 12 scans (6 resting and 6 task scans), with two bolus injections each of 5, 10, 15, 20, 25, and 30 mCi of 15O-water. A rigid thermoplastic face mask was used to immobilize each subject's head, and the subjects' eyes were covered.
Scans were acquired with a GE Advance tomograph (General Electric, Waukesha, WI, U.S.A.) with the interslice septa retracted. The physical characteristics of this scanner have been described in detail by DeGrado et al. (1994) and Lewellen et al. (1996). This scanner acquires 35 slices with an interslice spacing of 4.25 mm. In the 3-D mode, the scanner acquires oblique sinograms with a maximum cross-coincidence of ± 11 rings. A 10-minute transmission scan using two rotating 68Ge sources was performed in 2-D (septa extended) mode. Attenuation correction of emission data acquired in 3-D was performed using transmission data acquired in 2-D. Dynamic scans (60 seconds, 30 seconds × 2) were acquired starting automatically on detection of a sharp increase in the true count rate above a predefined threshold. The images were reconstructed with the Kinahan-Rogers reconstruction algorithm (Kinahan and Rogers, 1989). Hanning filters with cutoffs at the Nyquist frequencies were used, giving transaxial and axial resolutions for 3-D of 6 and 10 mm full-width at half-maximum, respectively. The transverse field of view and pixel size of the reconstructed images were 256 mm and 2 mm, respectively. Summed images corresponding to 60, 90, and 120 seconds of data were generated from the dynamic frames. All images were aligned to the first scan on a voxel-by-voxel basis using a 3-D automated algorithm (AIR) (Woods et al., 1992).
The noise equivalent counts (NEC) for each scan was calculated with the following formula (Strother et al., 1990):
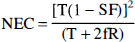
where T is the number of true counts (unscattered + scattered), R is the number of random counts, SF is the scatter fraction (0.35), and f is the fraction of the field of view subtended by the head (0.36).
To characterize regionally specific effects of the letter fluency task, intersubject analysis was performed with Statistical Parametric Mapping (using software from the Wellcome Department of Cognitive Neurology, London, U.K.; Friston, et al. 1989, 1990, 1991, 1994) implemented in Matlab (Mathworks Inc., Sherborn MA, U.S.A.). After realignment, all images were transformed into a standard space (Talairach and Tournoux, 1988) with a 10 mm FWHM isotropic Gaussian kernel. The significance threshold was determined with a three-dimensional Bonferroni-type correction to keep the false-positive rate at the defined level (P < 0.05) for the entire brain (Worsley et al., 1992).
Simulation study
The goal of the simulation study was to determine, for a given change in regional CBF (rCBF), the S/N of the predicted change in tissue radioactivity as a function of injection duration and scan acquisition time, in order to choose optimum scanning parameters.
Input function.
A typical arterial input function b(t) obtained with a temporal resolution of 1 second from a bolus intravenous injection of 15O-water (Fig. 1) and the rCBF image obtained in the same study were used for the simulation. The rCBF image was calculated from dynamic PET data using the arterial input function with a correction for external delay and dispersion, and fitting for CBF and partition coefficient (μ) on a pixel-by-pixel basis. To simulate slow infusions of duration T minutes, decay-corrected input functions, bT(t), were calculated as follows:
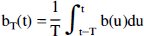
where b(t) is the decay-corrected input function obtained from a bolus injection. These functions were scaled so that the injected dose of 15O-water would remain fixed, independent of T. The simulated input functions for slow infusions are shown in Fig. 1.
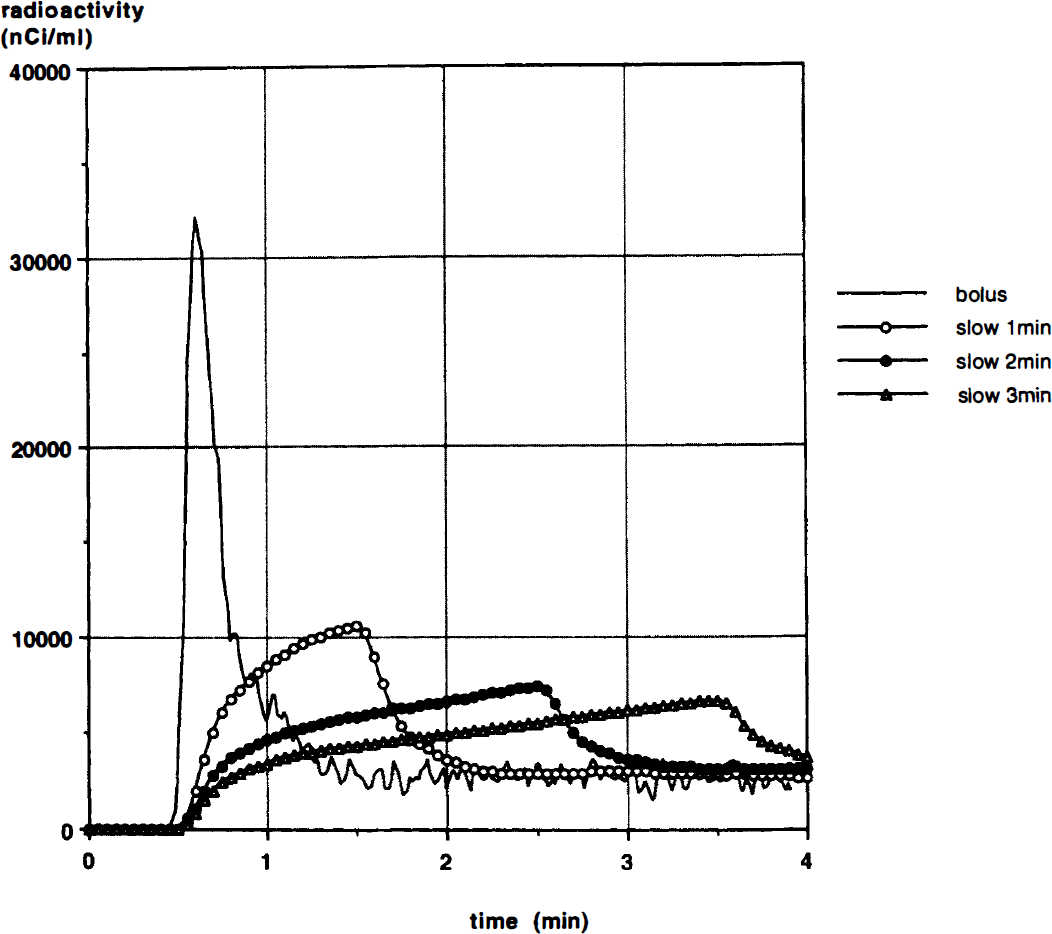
A typical arterial input function b(t), corrected for decay, resulting from a bolus intravenous injection of 42 mCi of 15O-water (solid line). Simulated input functions for slow infusions of duration 1 minute (open circle), 2 minutes (closed circle) and 3 minutes (open triangle) are also shown.
The PET value of radioactivity (CS,T) for an S-minute scan with a slow infusion of T-minute duration was then calculated:
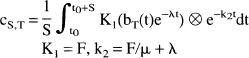
where F is regional cerebral blood flow (mL/min/g), μ is partition coefficient (0.80 mL/g), λ is physical decay constant of 15O, t0 is the scan start time, and ⊗ is the convolution operator. For each CBF value from 0 to 100 mL/min/100 g in steps of 5 mL/min/100 g, the corresponding PET value CS,T was calculated. For each value of S and T, this look-up table relating CS,T to F was approximated by a fourth-order polynomial equation, CS,T = GS,T(F).
Estimation of whole brain radioactivity.
A histogram of rCBF values over the whole brain was generated from the human image data, and the volume of brain w(Fi) (units of mL) having an rCBF value of Fi was determined. The PET radioactivity value corresponding to each rCBF value was calculated from the function GS,T(F). CS,T, the whole brain radioactivity in mCi for each scan duration-infusion time pair, was then calculated with the following formula:
Pixel standard deviation evaluation.
To obtain data on the pixel SD, multiple 3-D scans were performed with a Hoffman brain phantom (Hoffman et al., 1990). Whereas the Hoffman brain phantom differs somewhat from the human head, primarily in the distribution and amount of attenuating media and in the lack of activity outside the field of view of the scanner, it has been the phantom of choice for studying the noise characteristics of brain activation experiments (Cherry et al., 1993). The phantom was filled with 10 mCi of 11C-bicarbonate solution. Consecutive scans were acquired as the activity decayed. A set of subtraction images was generated from paired scans with the closest “whole brain” radioactivity. Before subtraction, the whole brain mean of each image was normalized to 1000 mCi/mL. The coefficient of variation was calculated from the standard deviation of the subtraction images across the whole brain, divided by the whole brain mean (1000). Coefficient of variation values were scaled to an equivalent scan duration of 60 seconds. The coefficient of variation of the difference images was then used as a measure of the average noise caused by count statistics. The coefficient of variation was then plotted against averaged total radioactivity (mCi) in the phantom to obtain the relationship CV(CS,T) between coefficient of variation and whole brain radioactivity CS,T. The pixel SD for whole brain radioactivity CS,T corresponding to a scan duration of S minutes and a slow infusion of T minutes is then given by:
where V is the brain volume.
Pixel signal-to-noise ratio of a simulated change in regional cerebral blood flow.
The S/N of the change in tissue activity in a pixel of tissue activity c, (S/Npix), is:
where Δc is the change in counts produced by a change in flow ΔF and can be approximated as:
The S/Npix values corresponding to a 5% change in rCBF (ΔF/F = 0.05) at F = 80 mL/min/100 g were calculated over a range of S and T. Here we assume that the SD of the noise is independent and uniform over all pixels in all image planes, and that the pixel SD calculated here from paired subtraction images across the whole brain is the same as the value that would be obtained from multiple replicate scans at a constant activity level.
RESULTS
Human study
As expected, a linear relationship between injected dose and whole brain radioactivity was observed (Fig. 2). With a bolus injection and a 60-second scan, the mean activity in the brain during the scan (not corrected for decay) was 5.3 ± 0.6% (mean ± SD, N = 4) of the total injected dose. The NEC from the human studies reached a plateau at 0.6 to 0.7 mCi of whole brain radioactivity (Fig. 3A). As a function of the injected dose, a 10 mCi injection gave an NEC of 92.4 ± 2.2% of the peak value that was achieved at an injected dose of 12 to 15 mCi. Interestingly, the NEC of the Hoffman brain phantom data reached its peak at 3.7 mCi in the field of view, a much higher value than that observed in the studies in humans (Fig. 3A). The ratio of NEC measured from human data to that from the Hoffman brain phantom showed a linear decrease as whole brain radioactivity increased (y = 1.247 – 0.599 x; r2 = 0.917, Fig. 3B) over the range of 0.2 to 1.0 mCi.
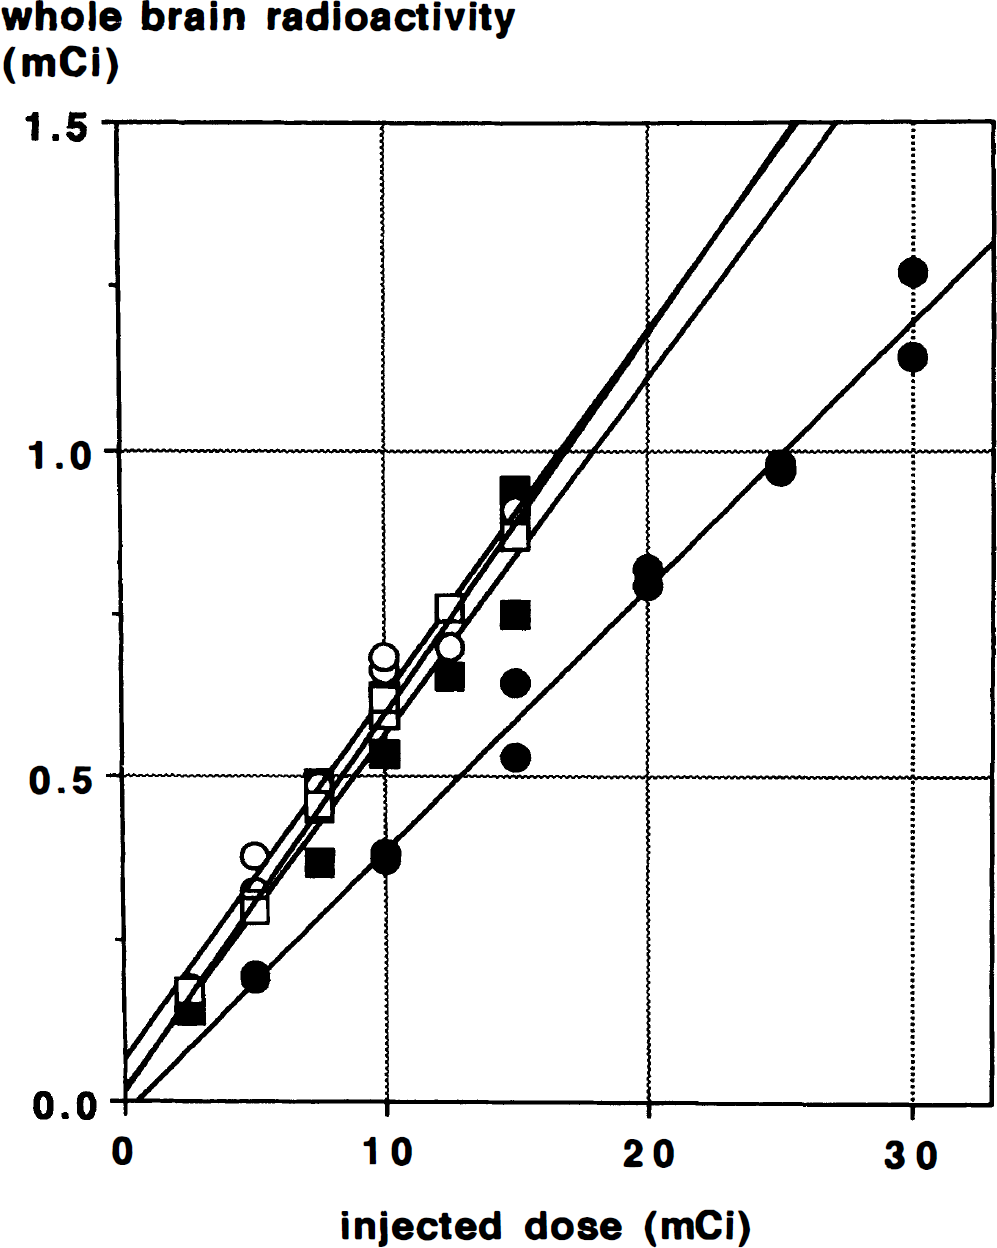
Whole brain radioactivity measured during a 60-second scan after a bolus injection, plotted against injected dose in four subjects. Each symbol represents a different subject. Decay of the radiotracer during the scan was not corrected. Regression lines are shown for each subject; the mean value of the slope of these regression lines is 0.053 ± 0.006 (SD).
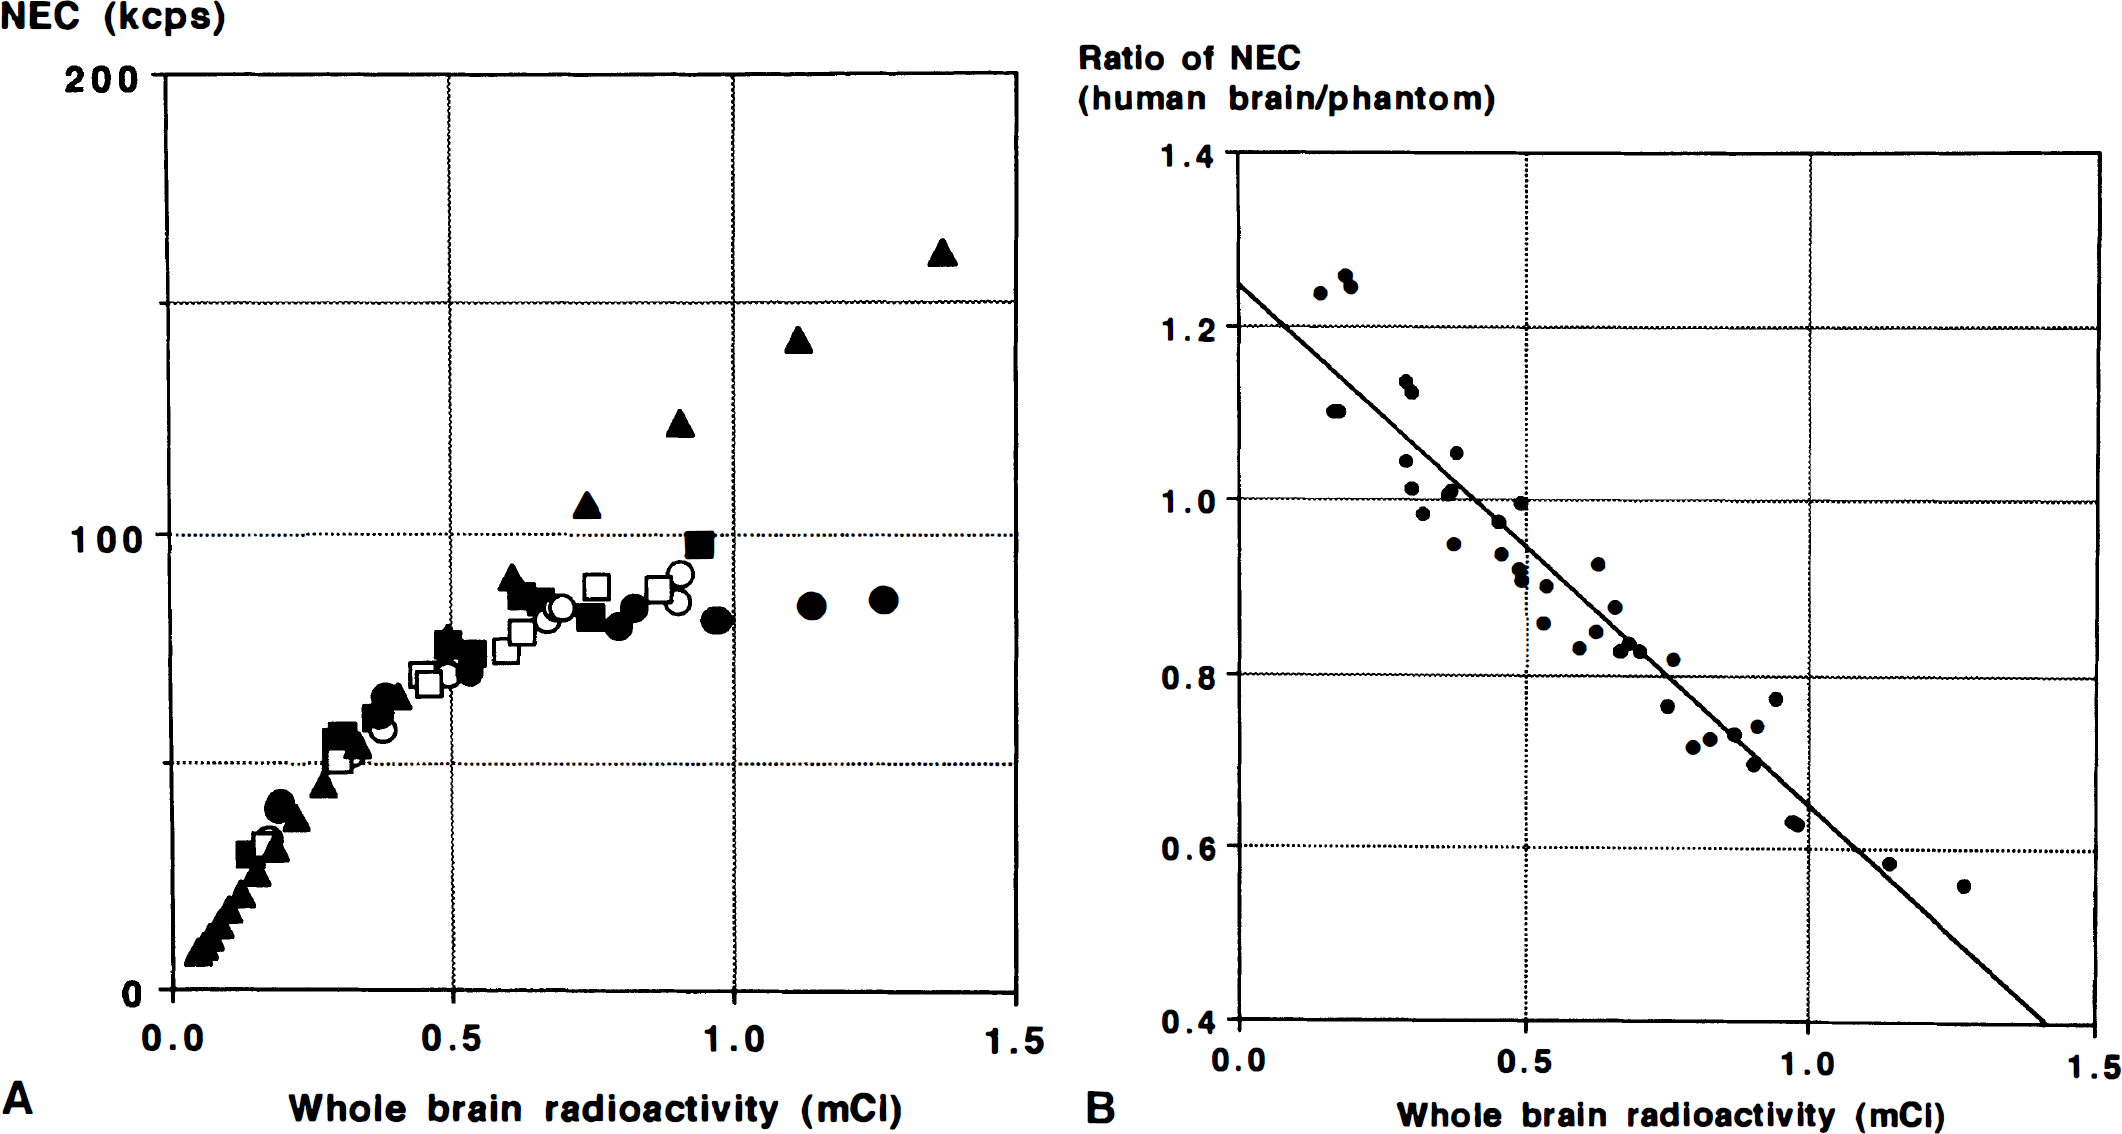
(A) Noise equivalent count rate (kcps) in four subjects (open and closed circles and squares) plotted against whole brain radioactivity. Noise equivalent count rate of the Hoffman brain phantom (closed triangle) was also plotted. (B) Ratio of the NEC of the human data to that of the Hoffman brain phantom, plotted against whole brain radioactivity. A linear relationship was found (y = 1.247 – 0.599 x; r2 = 0.917). NEC, noise equivalent counts.
The ratio NEC/whole brain radioactivity is shown in Fig. 4. This ratio is linearly related to whole brain radioactivity over the range of 0.2 to 1.0 mCi (y = 213.4 – 213.4 – 129.9 x; r2 = 0.94). This observation agrees with previous results and shows that dividing one large dose into multiple smaller doses can produce a higher total NEC (Cherry et al., 1993).
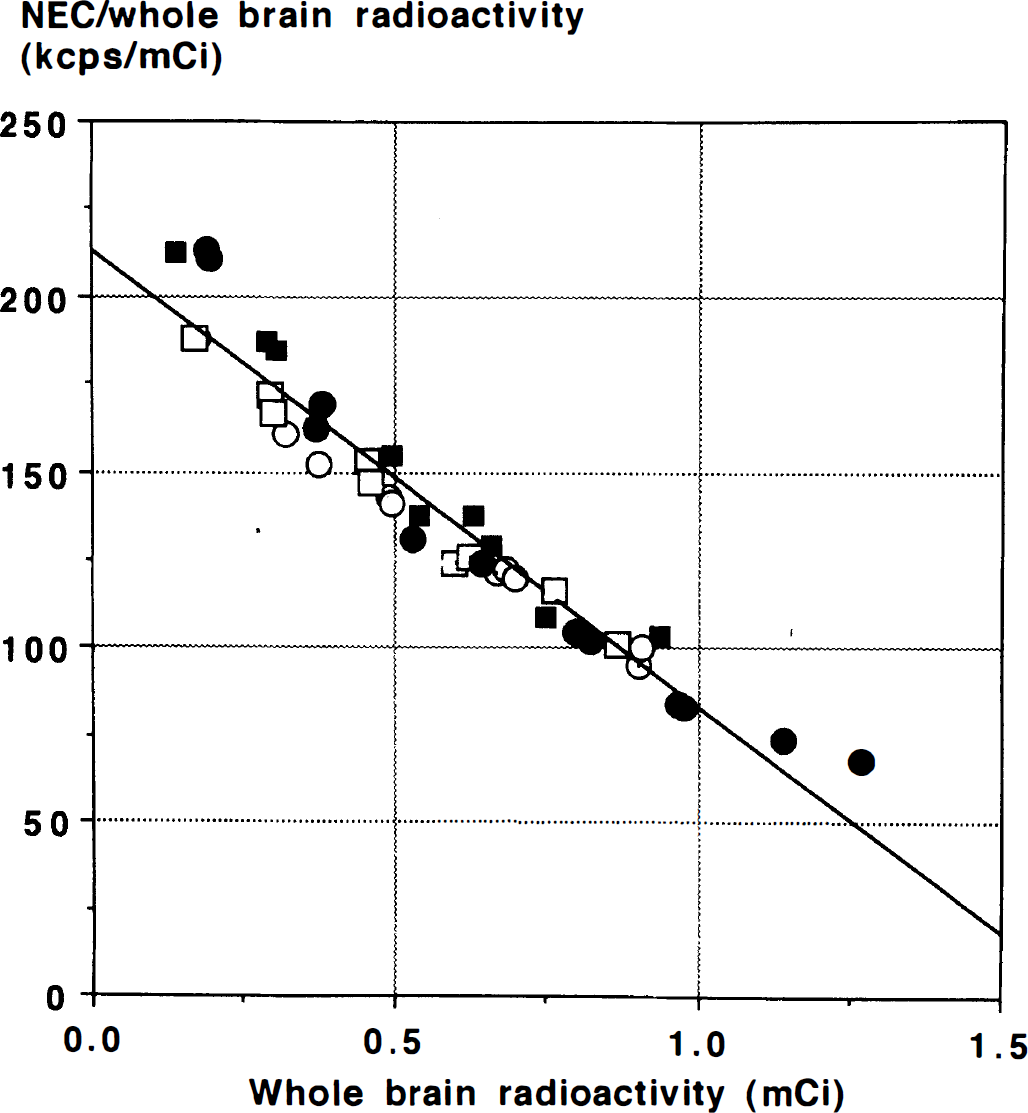
Noise equivalent count rate per mCi for the range of whole brain radioactivity in four subjects (open and closed circles and squares) from a 60-second acquisition. Lower doses produce a higher S/N per mCi. Linear regression reveals the relationship y = 213.4 – 129.9 × (r2 = 0.94).
Group analysis showed areas of activation that tended to decrease in number or extent as scan duration increased (Fig. 5, and Table 1). Activation was seen in Broca's area of the left inferior frontal gyms–in Brodmann areas 44 and 45 in the 60-second scans, coalescing to a single region with a local maximum in area 44 with 90-second scans, and decreasing to a small portion of area 45 with 120-second scans. The large area of activation in the left precentral gyrus observed with a 60-second scan was smaller in the 90-second scans and was not detected with 120-second scans.
Regional effects of covert word generation in Broca's area (left inferior frontal gyrus, Brodmann area 44/45) and left premotor area
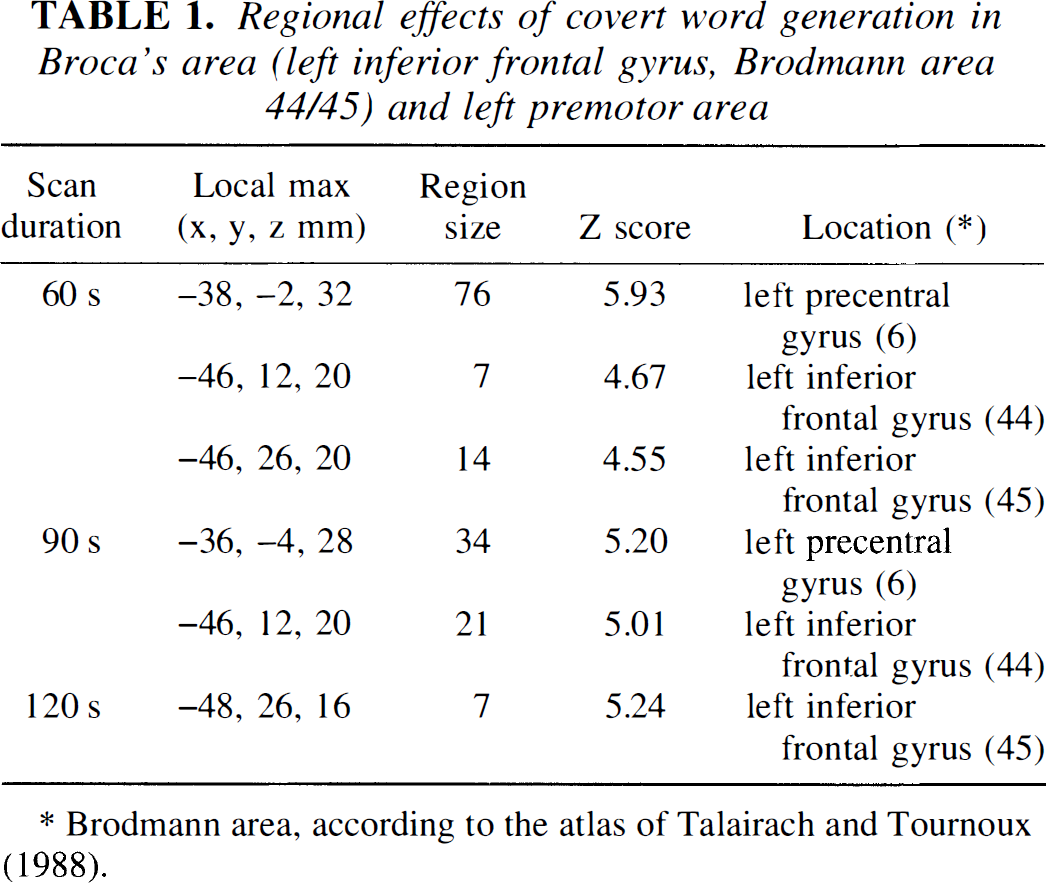
Brodmann area, according to the atlas of Talairach and Tournoux (1988).
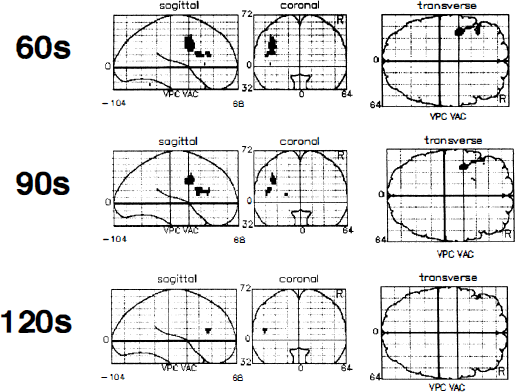
Effect of scan duration on the activated areas. Scans of 60, 90, and 120 seconds were used for comparison of adjusted mean rCBF between rest and covert word generation task, displayed as a statistical parametric map in three projections with the maximal pixel value displayed along each “line of sight”. The grid is the standard, proportional, stereotaxic grid of Talairach and Tournoux (1988), which defines the three-dimensional space into which all the subjects' scans have been normalized. The anterior commissural–posterior commissural lines are set at zero on the sagittal and coronal projections. Vertical projections of the anterior commissure and the posterior commissure are depicted on the transverse and sagittal projections. Only pixels that are significantly different between conditions at p < 0.05 with a Bonferroni-type correction are displayed. There was activation in Broca's area in the 60-, 90-, and 120-second scans–in Brodmann area 44 and 45 with 60-second scans, but only in area 44 with 90-second scans and only in area 45 with 120-second scans. The area of activation in the left premotor area observed with a 60-second scan was smaller with 90-second scans and was not detected with 120-second scans. VAC, vertical projection of the anterior commissure; VPC, vertical projection of the posterior commissure.
Simulation study.
A plot of SDS,T normalized to the whole brain mean radioactivity with CBF = 80 mL/min/100 g, as a function of the scan duration S for different infusion durations, is shown in Fig. 6. SDS,T, increases with increasing injection duration and with decreasing scan duration. The peak S/Npix for a bolus injection was achieved with a scan duration of 1 minute (Fig. 7). For simulated injection durations of 1, 2, and 3 minutes, the scan durations that produced the peak S/Npix were 1.5, 2, and 3 minutes, respectively (Fig. 7). The maximum signal-to-noise value for a 1-minute injection was 1.3% less than that of a bolus injection, with declines of 11.0% and 19.5% for 2- and 3 minute injections, respectively. The simulation also showed that these relative relationships between peak S/N values for the different injection methods persisted over a wide range of injected doses (10 to 30 mCi; Fig. 8). The relationship among the peak S/N values for the different injection methods is shown in Fig. 8 for a wide range of injected doses (10 to 30 mCi). Note that the simulation shows increasing S/N with increasing dose, unlike the NEC data shown in Fig. 3A (see Discussion).
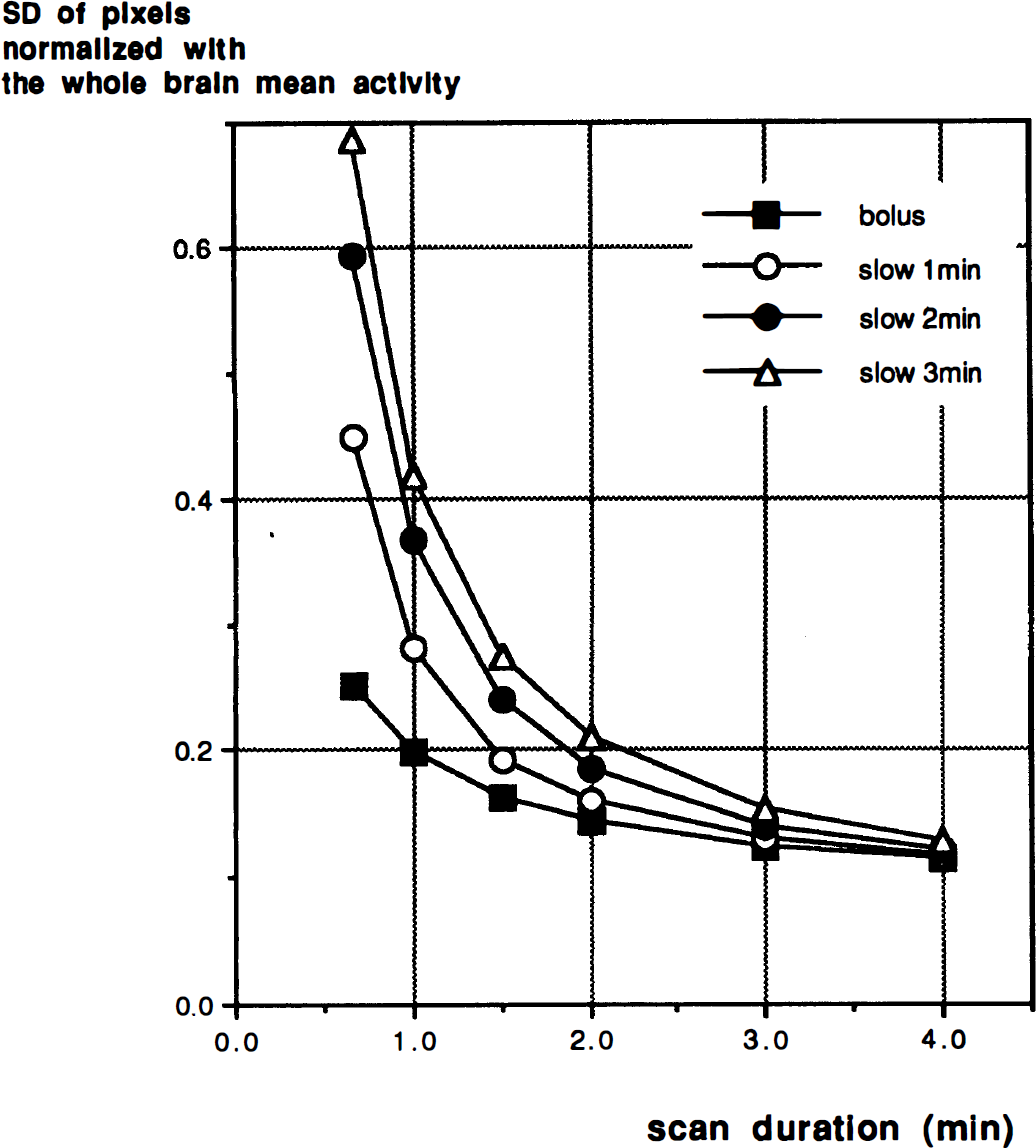
A plot of SDS,T, normalized to the whole brain mean radioactivity, as a function of the scan duration S for different infusion durations. Bolus injection (closed square), and slow infusions of 1 minute (open circle), 2 minutes (closed circle), and 3 minutes (open triangle) are shown.
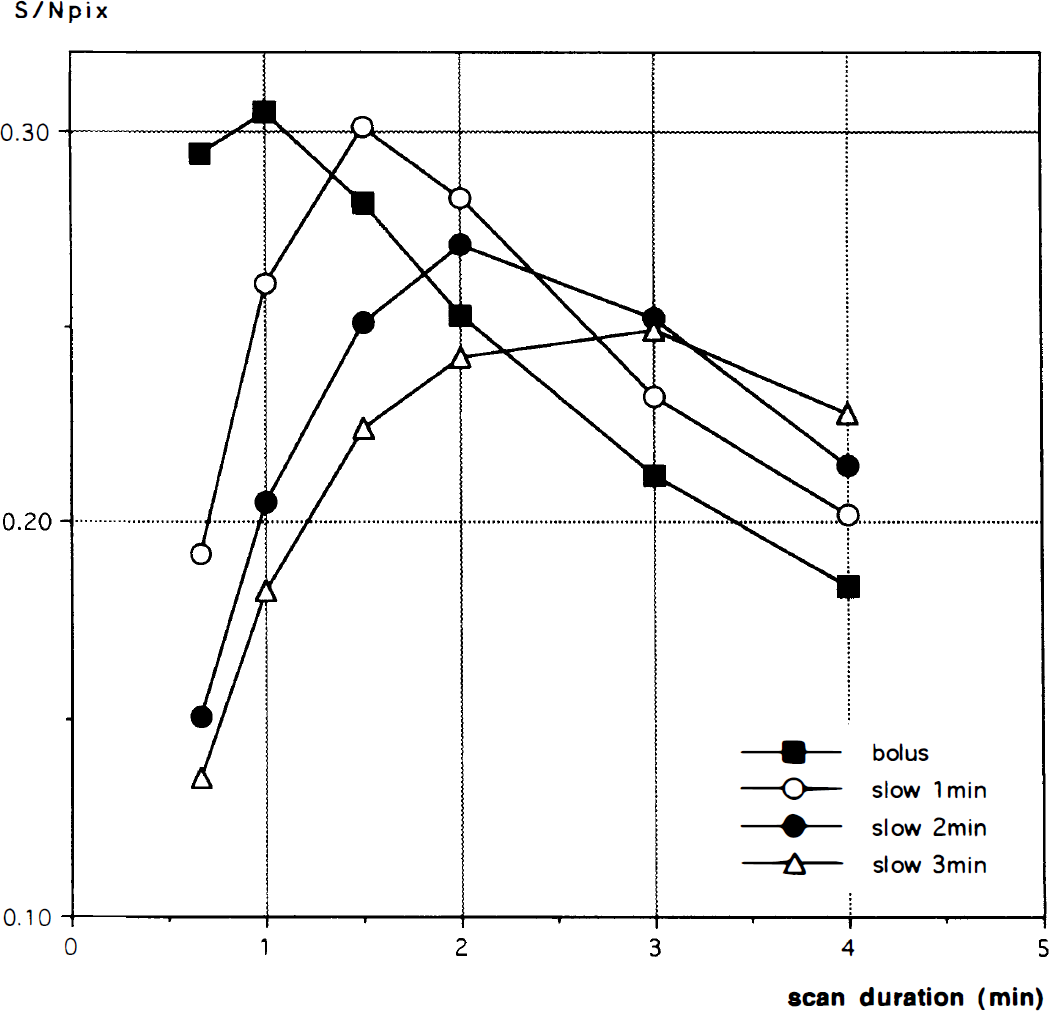
S/Npix for a 5% change in rCBF at rCBF = 80 mL/min/100 g with various durations of injection of 10 mCi of 15O-water. Data for a bolus injection (closed square), and slow infusions of 1 minute (open circle), 2 minutes (closed circle), and 3 minutes (open triangle) are plotted versus scan duration. The peak value of S/Npix for a 1 minute-injection is very similar to that of a bolus injection given the same total radioactivity dose. With longer injection durations of 2 and 3 minutes, the peak S/Npix declined.
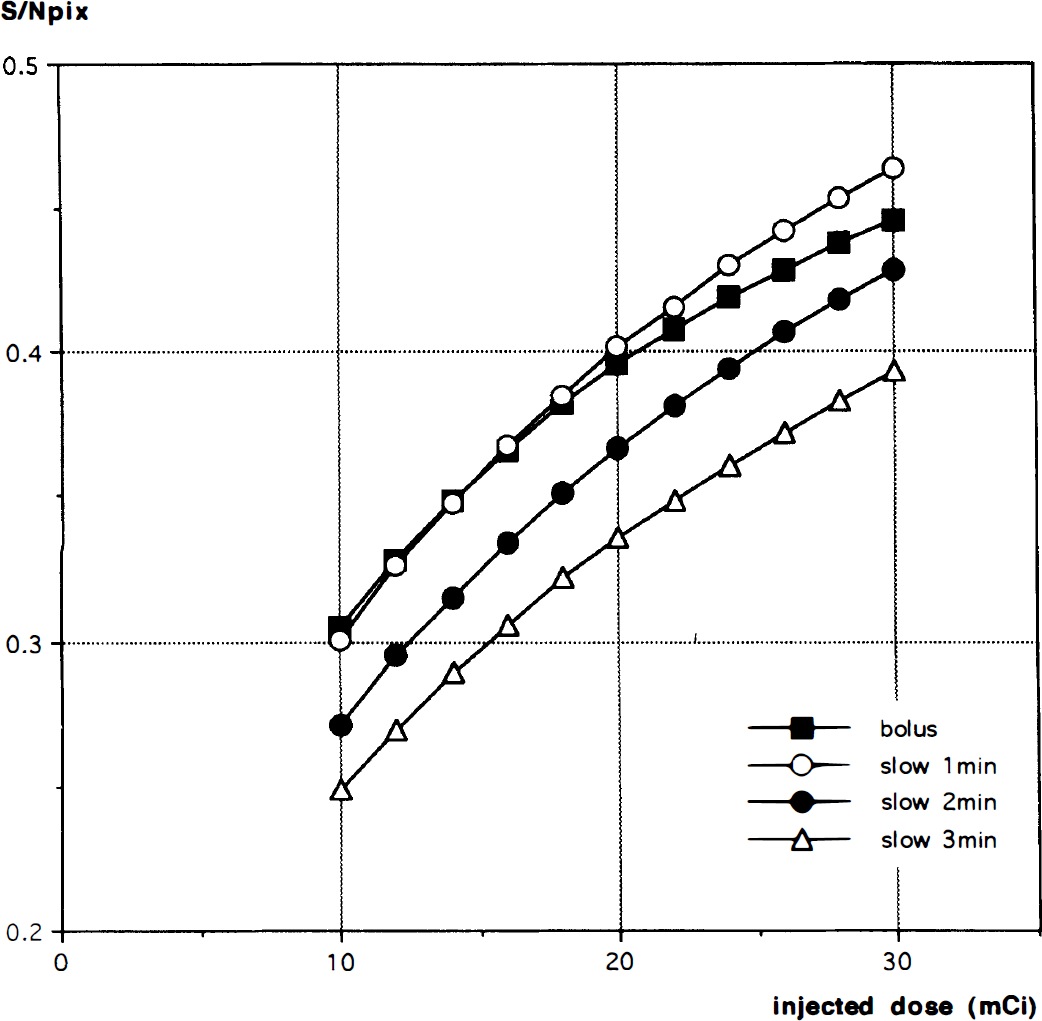
The peak S/Npix for 5% change in rCBF at rCBF = 80 mL/min/100 g with various doses of 15O-water obtained by scans of varying durations. Data for a bolus injection (closed square), and for slow infusions of 1 minute (open circle), 2 minutes (closed circle), and 3 minutes (open triangle) are shown. Scan durations were 1 minute for the bolus injection, and 1.5, 2.0, and 3.0 minutes for the simulated slow injections of 1, 2, and 3 minutes, respectively.
DISCUSSION
Dose per scan and fractionation
With a bolus injection of 15O-water, using more than 12 mCi per injection on the GE Advance tomograph will not produce an improvement in S/N, as measured by NEC. This is consistent with the previous report of Cherry et al. (1993) (using a different scanner) based on the measured pixel standard deviation of gray matter in the Hoffman brain phantom with 3-D PET. Using the relationship between the injected dose of 15O-water and the resulting accumulation of radiotracer in the brain, Cherry et al. concluded that the S/N of the tissue activity image reached its peak with a 14 mCi injection as a bolus. The linear reduction of NEC/injected dose with increasing injected dose indicates that performing multiple injections and acquiring multiple scans yields better results than a single injection and scan, given the same total injected dose. This effect is caused by the increase in deadtime and random coincidences at higher count rates that can be reduced with fractionated smaller doses (Cherry et al., 1993; Silbersweig et al., 1993). In stating that multiple scans are superior, we assume there is no misregistration among the scans, or that it is eliminated by an appropriate registration program (Woods et al., 1992), and also that multiple scans are practicable.
Noise equivalent counts of phantom and human brain
Fig. 3A shows a large discrepancy between the NEC values obtained from a Hoffman brain phantom and those from human brains above 0.5 mCi of total radioactivity in the field-of-view. As approximately 5% of total injected dose is retained in the brain during the first 60 seconds (not correcting for decay), this is equivalent to a 10 mCi injection. The main cause of this difference is the presence of radioactivity in the subject's body outside of the brain. Because of the removal of the interslice septa in the 3-D mode, the detector singles rates are much higher than for acquisitions with the septa in place. This produces a significant increase in deadtime and randoms over situations where there is no activity outside the axial field-of-view. Daube-Witherspoon et al. (1995) measured these effects with a phantom study. For 1 mCi in a “brain” phantom inside of the scanner and 3 mCi outside the scanner, the randoms rate increased by 15%. The calculated NEC decreases as extrabrain radioactivity increases (Daube-Witherspoon et al., 1995). Other potential explanations of the differences between our human and phantom data include scatter and attenuation. However, different scatter fractions and attenuation would produce changes in the slope of the entire NEC versus activity curve because these effects are independent of count rate. Note that the somewhat higher attenuation of the Hoffman phantom compared to human heads reduces the NEC at low whole brain activities. In summary, for higher dose bolus injections on this scanner, extrabrain singles become the limiting factor of image S/N. Note that this effect could possibly be reduced by additional shielding of the gantry.
Scan duration
Group analysis of the human studies obtained with bolus injections of 15O-water showed that there was no improvement in the results as the scan duration increased from 60 to 90 to 120 seconds. As shown in Fig. 5, with increasing scan length the activation in left precentral gyms became smaller then dropped out, while the activations in Broca's area coalesced and became smaller. Not unexpectedly, there was also some variation in the precise location of the local maxima as well. The reduction in the areas of activation occurred because the reduction in noise produced by longer scanning is canceled out by the smaller signal change caused by the increasing nonlinear relationship between CBF and tissue activity. Because 15O-water is a diffusible tracer, uptake of the tracer and the subsequent washout rate are highly flow dependent. The amount of tracer washout is small at early times, hence initial uptake is approximately linearly related to rCBF (Herscovitch et al., 1983). As the scan duration increases, the washout component increases, magnifying the nonlinear relationship between CBF and tissue activity. This leads to a decrease in the signal difference between control and activated states (Δc) (Volkow et al., 1991; Cherry et al., 1995). The scan duration could be increased without diminishing Δc by modifying the activation paradigm. By limiting the activation stimulus to the uptake phase in the activation condition, and the same stimulus to the clearance phase in the baseline condition, Cherry et al. (1995) showed a 20 to 30% improvement in S/N. As mentioned in their report, however, the additional cognitive requirements involved in the switching procedure might interact with the primary tasks, making data interpretation more difficult. Therefore, for bolus injections and 3-D PET, we chose a 60 second scan.
Our result is somewhat different from that reported by Kanno et al. (1991) who showed that the optimal scanning time, as measured by the S/N of the CBF image, is 90 to 120 seconds for bolus injections. This difference can be attributed to several factors. First, Kanno et al. (1991) aimed to maximize the S/N of absolute measurements of rCBF (the ratio of mean rCBF to CBF standard deviation). In that case, noise introduced in the measurement of the input function will affect S/N, with larger effects for shorter scan durations. In our study, we only considered maximizing the detectability of a regional change in tissue counts. Second, the PET scanner used in their study is 2-D whereas we used a 3-D tomograph that has different noise characteristics. Using 3-D PET and a slow bolus injection of 15O-water (approximately 30 seconds), Silbersweig et al. (1993) showed that a 90 second acquisition produces greater significance of activation that a 60 second acquisition. This is consistent with our simulation which showed that the peak S/Npix was obtained by longer scans as the infusion time was increased (Fig. 7).
It should be noted that the values obtained for S/Npix depend on the value assumed for the partition coefficient. A larger partition coefficient value results in modest increases in S/Npix, especially as the scan duration increases, because of slower clearance of tracer from tissue, e.g., changing μ from 0.8 to 0.9 mL/g increases the S/Npix by 7 to 15% for a bolus injection, and by 5 to 12% for a 3-minute slow infusion.
Injection duration: slow versus bolus
The simulation study shows that a slow infusion permits longer scan acquisitions with only a small loss of S/N (Fig. 7). The maximum signal-to-noise value for a 1-minute injection almost equaled that of a bolus injection, with modest declines for 2- and 3-minute injections. This allows the investigator to choose the injection duration, and thus the time period during which scan values are sensitive to rCBF, with only a slight (1-minute infusion) or modest (2- to 3-minute infusion) increase in statistical noise. Depending on the task of interest, the slow infusion method has the advantage of averaging possible fluctuations in rCBF over a longer period (Iida et al., 1991). For the bolus injection procedure, the measured tissue activity is almost completely determined by the flow pattern in the first 20 seconds after arrival of the bolus in the brain. Hence, the measured response is likely to vary depending on the timing of the peak of the 15O-water input (Iida et al., 1991; Hurtig et al., 1994). The slow infusion method permits averaging of the response during a longer task period while maintaining the detectability of activation.
The simulation study also suggests that increasing the dose above 10 mCi would improve the S/Npix (Fig. 8) for both bolus injections and slow infusions. This differs from the measured NEC values for the bolus injections (Fig. 3A) that flatten out for doses above 10 mCi. This discrepancy occurred because our simulation study used phantom measurements for noise estimation, and therefore did not include the effects of radioactivity from outside the field-of-view. It is possible that the impact of extrabrain activity is less for slow infusions than bolus injections. If so, then a higher dose could improve the S/N for the slow infusion approach; this may argue for a reduced number of injections, each with higher dose per injection. To test this hypothesis, actual measurements of the slow infusion method are necessary, as the effects of radioactivity outside of the field of view would be difficult to simulate accurately.