
Abstract
Magnetic resonance imaging (MRI) techniques were used to determine the effect of preexisting hyperglycemia on the extent of cerebral ischemia/reperfusion injury and the level of cerebral perfusion. Middle cerebral artery occlusion (MCAO) was induced by a suture insertion technique. Forty one rats were divided into hyperglycemic and normoglycemic groups with either 4 hours of continuous MCAO or 2 hours of MCAO followed by 2 hours of reperfusion. Diffusion-weighted imaging (DWI) was performed at 4 hours after MCAO to quantify the degree of injury in 6 brain regions. Relative cerebral blood flow (CBF) and cerebral blood volume (CBV) were estimated using gradient echo (GE) bolus tracking and steady-state spin echo (SE) imaging techniques, respectively. Brain injury correlated with the perfusion level measured in both SE CBV and dynamic GE CBF images. In the temporary MCAO model, mean lesion size in DWI was 118% larger and hemispheric CBV was reduced by 37% in hyperglycemic compared with normoglycemic rats. Hyperglycemia did not significantly exacerbate brain injury or CBV deficit in permanent MCAO models. We conclude that preexisting hyperglycemia increases acute postischemic MRI-measurable brain cellular injury in proportion to an associated increased microvascular ischemia.
Keywords
Preexisting hyperglycemia exacerbates brain damage resulting from experimental focal cerebral ischemia (Seisjo et al., 1993). In previous studies, we showed an accelerated rate of brain injury in hyperglycemic rat models of middle cerebral artery occlusion (MCAO) compared with normoglycemic cohorts (Huang et al., 1996). Hyperglycemic exacerbation of brain injury is especially prevalent in reperfusion models, but has also been reported in permanent models in brain regions that are collaterally perfused (Prado et al., 1988).
Using magnetic resonance imaging (MRI) techniques, we studied whether hyperglycemia increases brain cellular injury in proportion to a more severe perfusion deficit. Diffusion-weighted imaging (DWI) shows regions with significant increase in intracellular water fraction, and/or cytotoxicity (LeBihan et al., 1986; Mosley et al., 1990). Diffusion-weighted imaging is an indicator of ischemic brain cellular damage that becomes irreversible without prompt intervention (Minematsu et al., 1992; Lo et al., 1994; Muller et al., 1995). A superparamagnetic intravascular tracer was detected by dynamic gradient echo (GE) bolus tracking (Villringer et al., 1988) and spin echo (SE) MRI techniques (Kent et al., 1990) to assess the perfusion deficit in the ischemic region. Bolus tracking MRI perfusion measurements have been shown to be proportional to 14C-iodoantipyrene autoradiographical cerebral blood flow (CBF) measurements in rat MCAO models of focal cerebral ischemia (Whittlich et al., 1995; Bradley et al., 1989). Using these MRI techniques, we measured cerebral perfusion and brain injury in each animal in order to determine whether the increased brain cellular injury in hyperglycemic rats is proportional to a decreased level of perfusion.
METHODS
Animal model
Male Sprague-Dawley rats weighing 300 to 350 g were allowed free access to food and water before the experiment. Anesthesia was induced with 3% halothane, and a 14-0 catheter was used for endotracheal intubation. Rats were artificially ventilated with 0.5 to 1.0% halothane in 30% O2/70% N2 during surgery and MRI procedures. The tail artery and vein were cannulated with PE-50 polyethylene catheters for monitoring MABP, blood pH, Pa
Focal cerebral ischemia was induced by occluding the origin of the middle cerebral artery using the intraluminal suture insertion method (Longa et al., 1989; Nagasawa and Kogure, 1989) with some modifications (Quast et al., 1995). Through a 10-mm oblique incision on the right ventral lateral neck, the internal carotid artery was isolated and ligated at the base of the common carotid artery bifurcation. The pterygopalatine artery was then ligated. An incision was made in the internal carotid artery and a 3-0 monofilament nylon suture with the inserted end coated with silicone was introduced into the lumen of the internal carotid artery. The insertion length of the suture was 15 mm from the base of the pterygopalatine artery. The right middle cerebral artery was occluded either permanently or transiently for 2 hours, at which time the suture was removed and the internal carotid artery was tied off to allow recirculation via the circle of Willis. A sham-operated group was prepared by ligation of the internal carotid artery only. Hyperglycemia was induced by injection of streptozotocin intraperitoneally (60mg/kg, Nedergaard, 1987) 2 days before MCAO. The rats were divided into 5 groups: 1) hyperglycemia with permanent MCAO (n = 8); 2) hyperglycemia with a 2-hour MCAO (n = 13); 3) normoglycemia with permanent MCAO (n = 10); 4) normoglycemia with a 2-hour MCAO (n = 10); 5) sham-operated with no MCAO (n = 4).
Data acquisition
Proton MRI was performed with a 4.7 T horizontal bore imaging system (SISCO/Varian, Palo Alto, CA, U.S.A.). At 3.5 hours after occlusion, rats were placed supine in an acrylic carriage with a 2-in saddle-style radio frequency coil tuned to 200 MHz. The MRI protocol consisted of diffusion-weighted spin echo imaging (LeBihan et al., 1986; Moseley et al., 1990), T2-weighted spin echo-based plasma volume imaging (Kent et al., 1990; Quast et al., 1993), and dynamic GE-based hemodynamic imaging including the first moment and relative cerebral blood flow images (Quast et al., 1993; Weisskoff et al., 1993). The complete MRI protocol was completed in 50 minutes. Our previous studies (Huang et al., 1996) indicate that the DWI-measured lesion size changes less than 5% during the 20 to 30 minutes between DWI and cerebral blood volume (CBV)/CBF measurements. The plasma volume imaging and relative cerebral blood flow images were based on the T2 shortening effect of a superparamagnetic iron oxide (SPIO) nondiffusible, intravascular tracer (Weissleder et al., 1990; AMI227, Advanced Magnetics Inc, Cambridge, MA, U.S.A.). This SPIO tracer consisted of a suspension of magnetite particles with a 12-nm diameter. Brain transverse relaxation rate (1/T2) increases linearly with SPIO concentration in the cerebral vasculature (Quast et al., 1994). T2-weighted imaging, DWI, and plasma volume imaging were acquired with an 80-mm field of view, 128 phase encode steps and a 256 × 256 digital matrix, in a multislice mode with 12 contiguous transverse slices covering a 20-mm length from the cerebellum to the olfactory lobe with a slice thickness of 1.7 mm. Echo time was 65 milliseconds, repetition time was 3.0 seconds. In DWI, the b factor (LeBihan et al., 1986) was 1500 s/mm2, based on 5.3 gauss/cm diffusion gradients placed symmetrically around the refocusing pulse. Each diffusion gradient pulse was 18 milliseconds, and the separation between leading edges of the gradients was 29 milliseconds.
Single-slice dynamic MRI in the area of the caudate putamen detected the passage of SPIO through the cerebrovasculature. Each image frame consisted of a refocused fast low-angle shot (FLASH) (Frahm et al., 1987) GE image with an 80-mm field of view, 48 phase-encode steps, an echo time of 2.5 milliseconds, a repetition time of 7 milliseconds, and 2 acquisitions per phase-encode step. Thirty frames were acquired during 21 seconds. A bolus of SPIO tracer (2.0 mg Fe/kg body weight) was injected after the third frame. The bolus was carefully delivered during a 1.0 second duration to ensure reproducibility (Quast et al., 1993).
Data analysis
Digital image intensity analysis was performed to correlate the volume of the DWI-detected ischemic lesion with the degree of residual perfusion within a 1.7-mm slice of interest. The volume of injury in each ipsilateral region was determined from the number of pixels in DWI with intensities higher than the 95th percentile in the corresponding contralateral region, minus the 5% exceeding this threshold in the contralateral region. The injury volume was expressed as a percent of hyperintense pixels in the measured region. This technique using threshold values was used in previous studies in our laboratory (Quast et al., 1993, 1995; Huang et al., 1996). Injury volume was calculated either in the whole hemisphere or in six regions per hemisphere (Fig. 1). Referring to stereotaxic coordinates (Paxinos and Watson, 1986), the six regions corresponded to 1) cingulate, frontal, hindlimb and forelimb cortices, 2) parietal cortex, 3) piriform and insular cortex, 4) preoptic area, 5) caudate putamen and septal nuclei, and 6) globus palladus and basal forebrain area including bed nucleus.
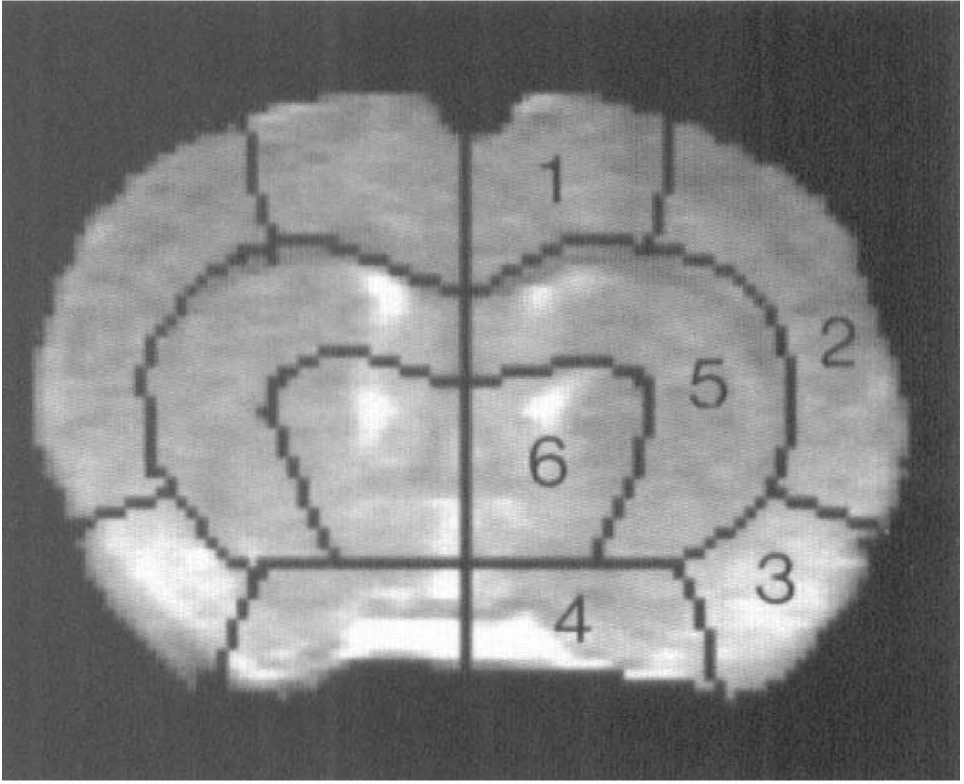
Segmented coronal MRI slice in the region of the caudate putamen showing the regions used for digital signal intensity analysis. Referring to Paxinos and Watson (1986) coordinates, the six regions correspond to 1) cingulate, frontal, hindlimb and forelimb cortices, 2) parietal cortex, 3) piriform and insular cortex, 4) preoptic area, 5) nuclei caudate putamen and septal nuclei 6) globus palladus and basal forebrain area including bed nucleus.
Single-slice digital image analysis was performed using indicator dilution methods (Zierler, 1962, Axel, 1980) to estimate CBF from CBV and mean transit time (MTT). Parametric images were constructed based on pixel-by-pixel calculation of hemodynamic parameters. Time concentration (TC) curves representing the passage of the SPIO tracer were constructed based on the observed signal intensity changes during the dynamic GE acquisition. Tracer concentration was determined from equation 1 (Davis et al., 1989; Rosen et al., 1990):
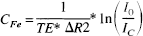
where CFe is the tissue concentration of magnetite iron in the voxel or region of interest, ΔR2 is the proportionality constant relating signal intensity to tracer concentration at a given echo time, IC is the signal intensity after tracer injection, and I0 is the baseline signal intensity. Gamma variate analysis was used to estimate curve parameters and correct for recirculation (Thompson et al., 1964; Starmer and Clark, 1970). The first moment of the TC curves provides an estimate of the MTT (Weisskoff et al., 1993; Wittlich et al., 1995). Our regions of interest in the ipsilateral and contralateral forebrain are fed by the same main artery (the nonoccluded internal carotid artery feeding into the circle of Willis) and therefore have similar arterial input functions. Wittlich et al. (1995) showed the validity of this assumption using a similar MRI bolus tracking approach in rat MCAO models. Therefore, differences in the first moment between ischemic and corresponding contralateral regions reflect differences in MTT. Relative MTT mean transit time was estimated from equation 2:

where C(t) is the time-dependent tracer concentration at time t after injection. Cerebral blood volume was estimated from the equation (Wittlich et al., 1995):
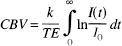
where k is a proportionality constant summarizing the arterial input function and ΔR2, I(t) is the time-dependent signal intensity and I0 is the baseline signal intensity. Relative CBF was estimated as the ratio CBV/MTT.
Microvascular cerebral plasma volume was also estimated from brain SPIO concentrations determined using conventional SE images. Because SPIO has a vasculature half-life of 350 minutes (Quast et al., 1994), the vascular washout of the tracer is negligible during the 13-minutes postinjection image acquisition. With sufficient time after SPIO injection (5 minutes) to allow for mixing in the blood plasma, brain SPIO concentration (calculated from equation 1) is proportional to cerebral plasma volume (Kent et al., 1989, 1990).
The levels of CBV and CBF were expressed as a percent of that measured in the contralateral hemisphere or brain region. Group r-tests were performed in order to determine the statistical significance of the exacerbation of brain injury by hyperglycemia in permanent MCAO and reperfusion groups. Linear regression analysis was performed to determine the correlation between extent of DWI-measured brain injury and residual perfusion. Analysis of variance was performed for comparison of contralateral hemispheric CBF and CBV. P < 0.05 was considered to be significant in all analyses.
RESULTS
No significant differences were detected in physiological variables except for serum glucose levels (Table 1). Using values calculated from equations 1, 2, and 3, no significant differences in raw CBV or CBF values were detected in the contralateral hemispheres between any experimental or sham-operated group (P > 0.10 in all hemispheric and regional comparisons).
Physiological variables for experimental animal groups
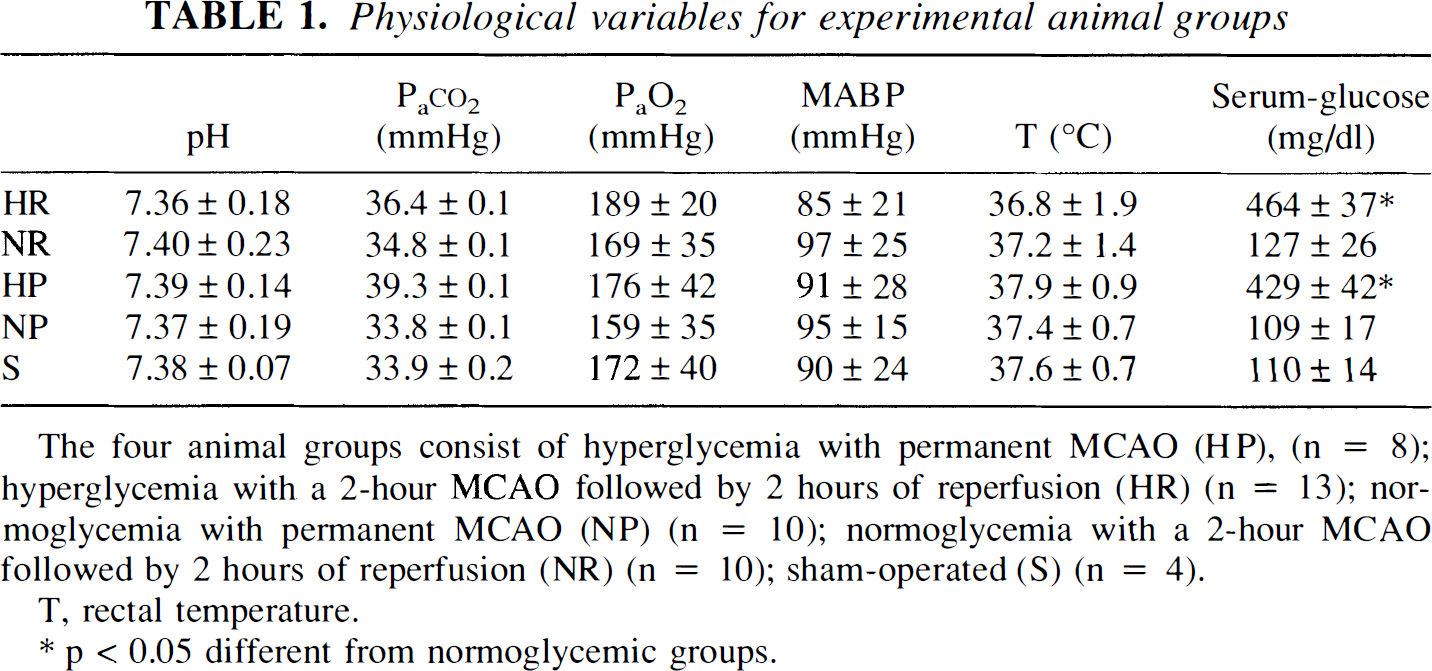
The four animal groups consist of hyperglycemia with permanent MCAO (HP), (n = 8); hyperglycemia with a 2-hour MCAO followed by 2 hours of reperfusion (HR) (n = 13); normoglycemia with permanent MCAO (NP) (n = 10); normoglycemia with a 2-hour MCAO followed by 2 hours of reperfusion (NR) (n = 10); sham-operated (S) (n = 4).
T, rectal temperature.
p < 0.05 different from normoglycemic groups.
Representative images from the four experimental groups are shown in Fig 2. Hyperglycemia increased the volume of DWI-detected brain injury by 118% in the reperfusion model. Likewise, relative SE CBV was 37% lower in temporarily occluded hyperglycemic rats compared with normoglycemic cohorts. No significant increase in the total lesion volume or CBV deficit was detected in permanently occluded hyperglycemic rats compared with normoglycemic rats. Injury volumes and CBV levels for the different regions are shown in Tables 2 and 3, respectively. In the permanently occluded model, the largest increased injury volumes are measured in the parietal cortex and caudate putamen areas; however, neither is statistically significant. In contrast, hyperglycemia exacerbated the DWI-detected lesion volume in all areas except the caudate putamen in reperfused models.
Brain injury volume for the four different groups
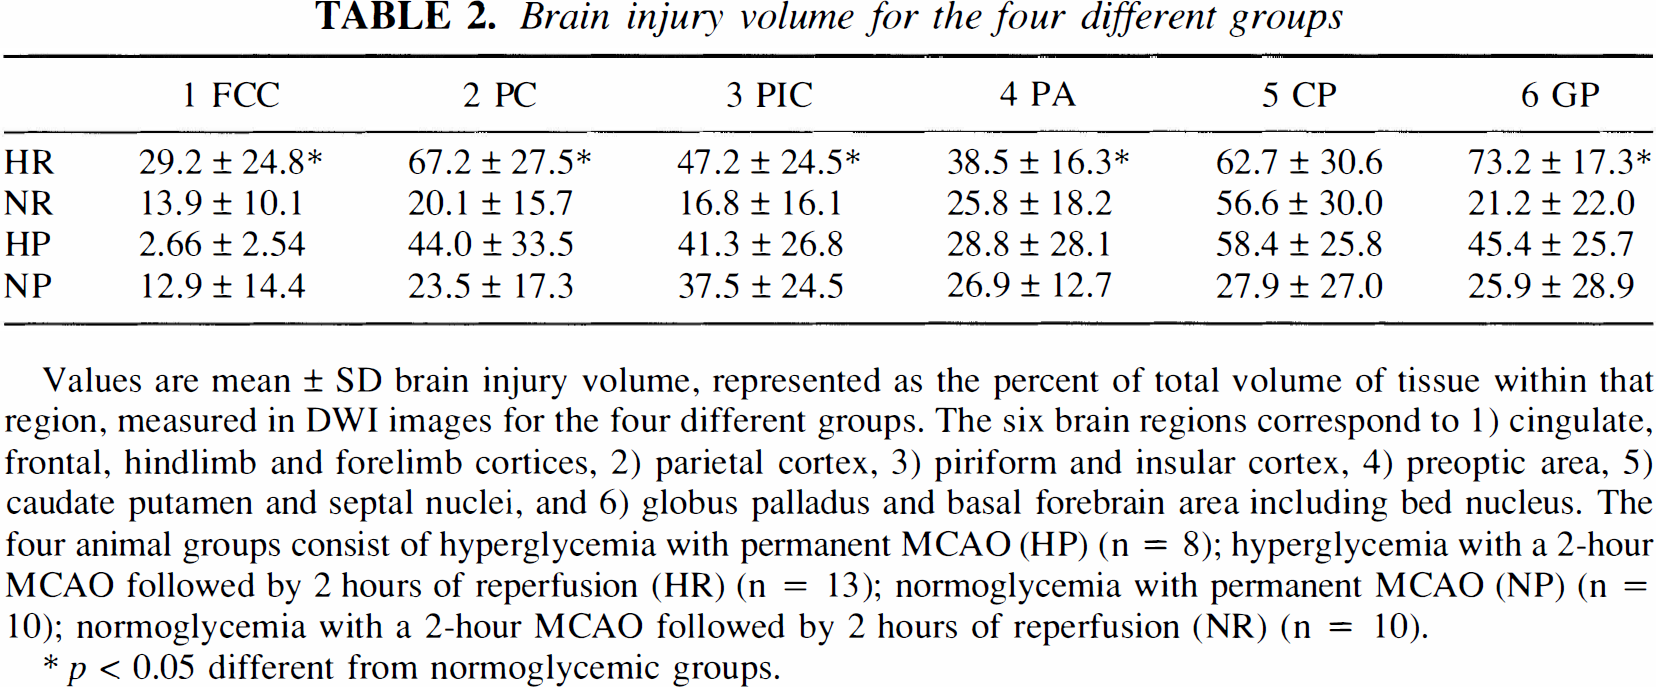
Values are mean ± SD brain injury volume, represented as the percent of total volume of tissue within that region, measured in DWI images for the four different groups. The six brain regions correspond to 1) cingulate, frontal, hindlimb and forelimb cortices, 2) parietal cortex, 3) piriform and insular cortex, 4) preoptic area, 5) caudate putamen and septal nuclei, and 6) globus palladus and basal forebrain area including bed nucleus. The four animal groups consist of hyperglycemia with permanent MCAO (HP) (n = 8); hyperglycemia with a 2-hour MCAO followed by 2 hours of reperfusion (HR) (n = 13); normoglycemia with permanent MCAO (NP) (n = 10); normoglycemia with a 2-hour MCAO followed by 2 hours of reperfusion (NR) (n = 10).
p < 0.05 different from normoglycemic groups.
Cerebral blood volume for the four different groups
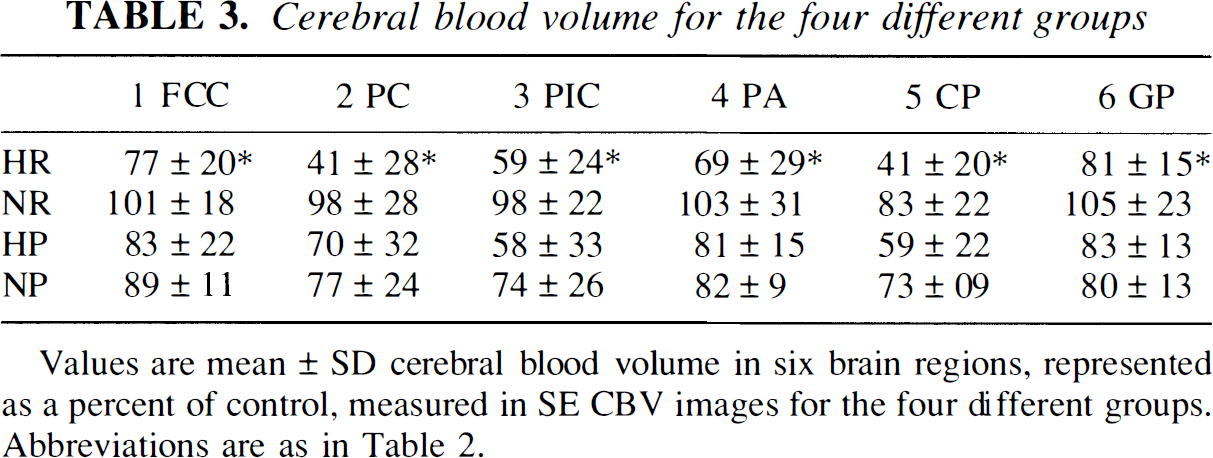
Values are mean ± SD cerebral blood volume in six brain regions, represented as a percent of control, measured in SE CBV images for the four different groups. Abbreviations are as in Table 2.
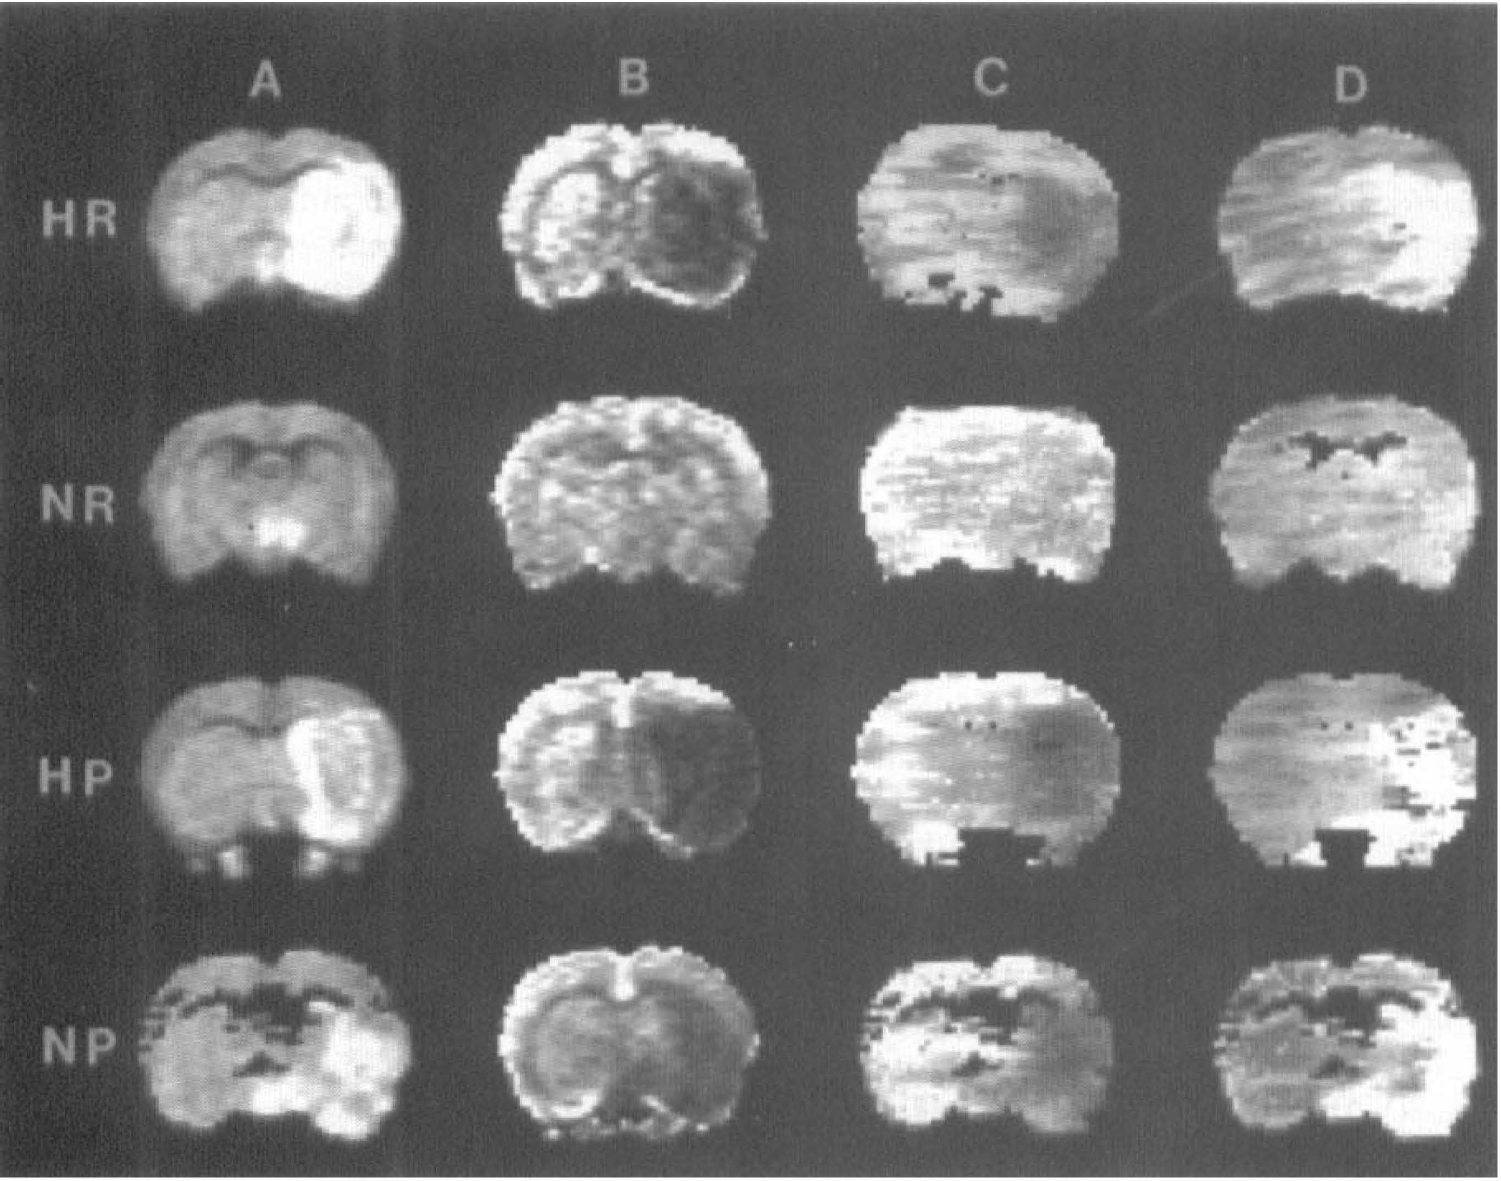
Representative coronal forebrain images in the caudate region from four experimental groups studied. Each column represents a different imaging modality: (A) diffusion-weighted imaging (DWI); (B) spin echo CBV; C) gradient echo CBF; (D) mean transit time (MTT). Each row represents a different experimental group: hyperglycemic (HR) and normoglycemic (NR) reperfused with 2 hours of MCAO followed by 2 hours of reperfusion, and permanently occluded hyperglycemic (HP) and normoglycemic (NP). The injured brain tissue appears hyperintense in DWI. In CBV images, signal intensity is proportional to volume of circulating blood, so areas with a perfusion deficit are represented by low-signal intensity. Likewise, low CBF is indicated by low image intensity. In the MTT images, intensity is proportional to first moment of the bolus transit curve and prolonged MTT is indicated by high intensity.
The greater extent of injury measured in hyperglycemia seems to be inversely proportional to the level of residual perfusion (Fig. 3). Scatter plots revealed a significant negative linear correlation of DWI-detected hemispheric injury and time averaged (SE) residual CBV (r = −0.62; p < 10–5). Likewise, the size of the ischemic lesion in DWI correlated with residual CBF measured using dynamic GE (r = −0.46; p = 0.002). We also observed good agreement between residual perfusion levels measured in the dynamic GE CBF versus those measured by the time averaged spin echo method (r = 0.78; p < 10–7; Fig. 4).
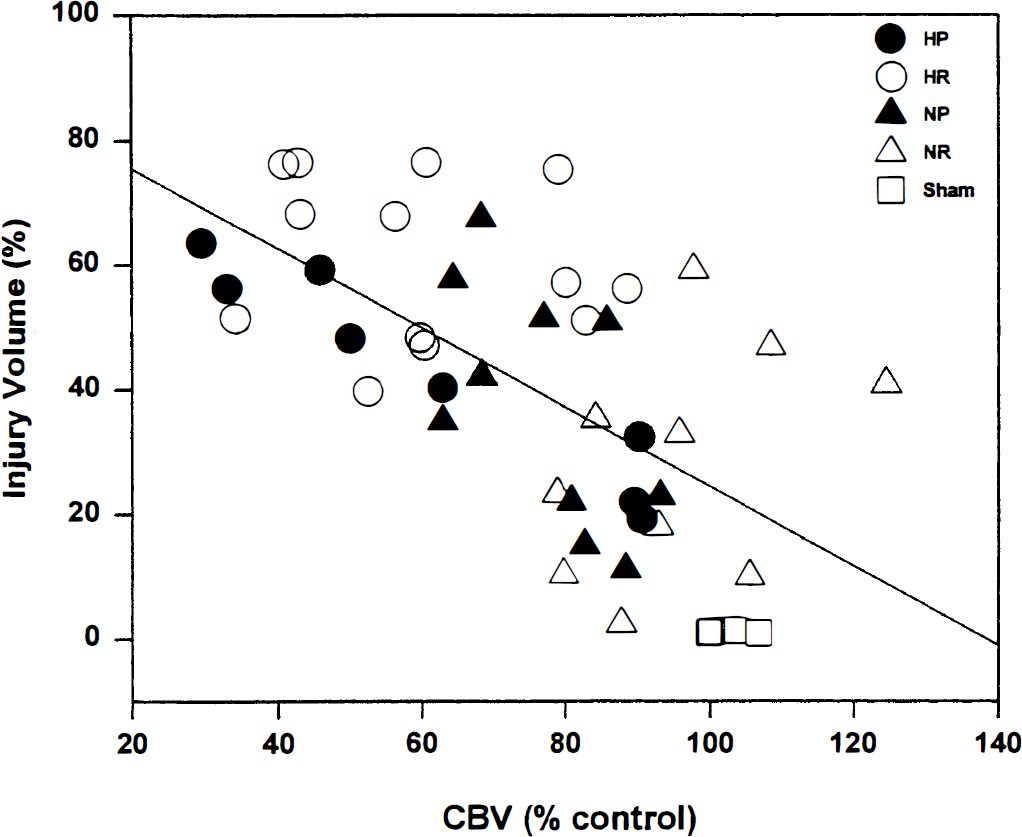
Scatter plot showing the relationship between injury volume and spin echo plasma volume within the slice of interest. Each point represents one animal in the study, categorized into the four different experimental animal groups. The rat groups consist of ÷ hyperglycemia with permanent MCAO (HP) (n = 8); hyperglycemia with a 2 hour MCAO followed by 2 hours of reperfusion (HR) (n=13); normoglycemia with permanent MCAO (NP) (n = 10); normoglycemia with a 2 hour MCAO followed by 2 hours of reperfusion (NR) (n = 10). A regression line through all points reveals a significant linear correlation of the data (r2 = −0.62, p < 10–5).
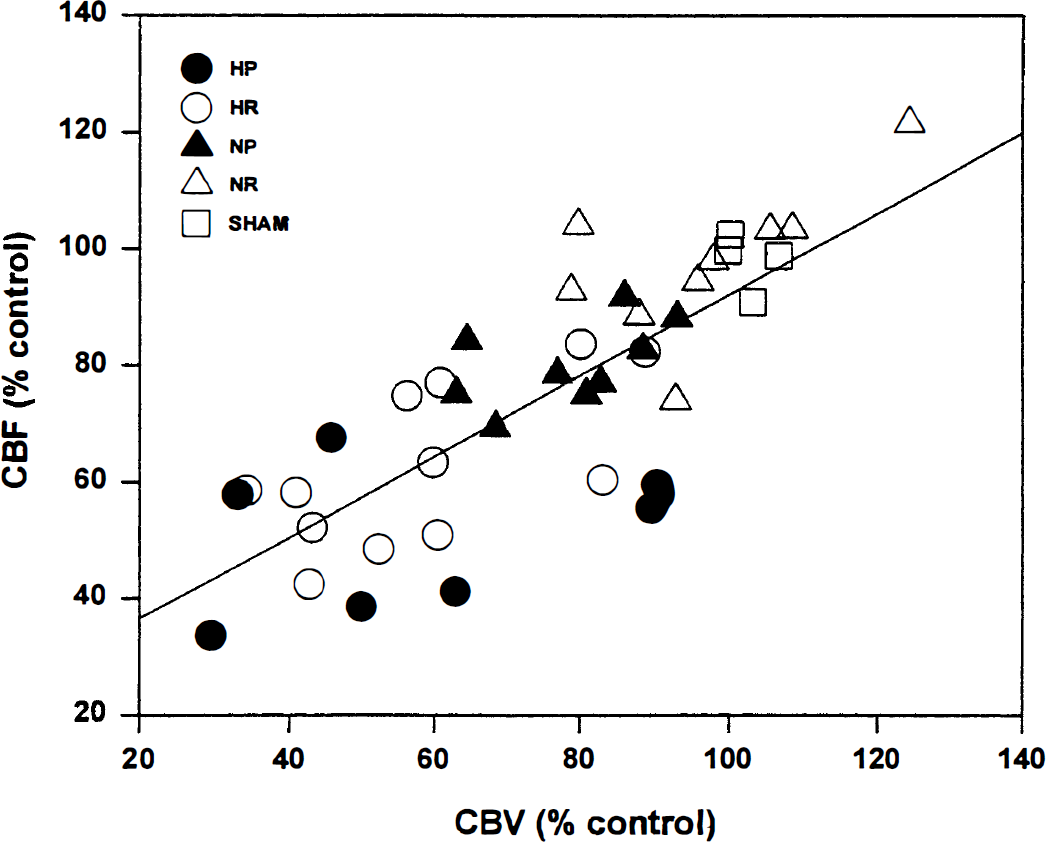
Scatter plot showing the correlation between spin echo residual CBV versus residual CBF for all groups: hyperglycemia with permanent MCAO (HP) (n = 8); hyperglycemia with a hour MCAO followed by 2 hours of reperfusion (HR) (n = 13); normoglycemia with permanent MCAO (NP) (n = 10); normoglycemia with a 2 hour MCAO followed by 2 hours of reperfusion (NR) (n = 10). Spin echo CBV was measured from the signal intensity changes in spin echo images after injection of intravascular superparamagnetic iron oxide tracer. Residual CBF was measured from analysis of dynamic GE bolus tracking. Spin echo CBV is significantly correlated with GE CBF (r = 0.78, p < 10–7).
DISCUSSION
We used single-slice DWI to delineate the injured brain tissue, which provides excellent contrast at lesion borders (Fig. 2). We have previously reported (Huang et al., 1996; Quast et al., 1995) excellent agreement between the DWI-determined area of acute ischemic brain injury and that measured by 2,3,5-triphenyltetrazolium chloride-stained tissue sections (a standard assessment technique for delineation of infarcted brain tissue, Bederson et al., 1986) in these models. Whereas no significant hyperglycemic exacerbation of DWI-detected brain injury was measured in the permanent MCAO model, the injury volume was significantly larger in the reperfusion model.
The size of the DWI-determined ischemic lesion correlated with the degree of perfusion deficit. Correlations between areas of MRI-measured restricted diffusion with autoradiographically measured CBF have recently been reported in normoglycemic MCAO models (Hoehn-Berlage et al., 1995; Mancuso et al., 1995; Perez-Trepichio et al., 1995). Our results particularly agree with those of Perez-Trepichio et al., (1995), who found that CBF level correlated linearly with the degree of brain injury in normoglycemic rats. Other studies have compared DWI with MRI perfusion measurements in normoglycemic MCAO models (Muller et al., 1995; Jiang et al., 1994; Maeda et al., 1993); however, no direct animal by animal correlations were presented.
There was generally quite good agreement between SE CBV and GE CBF measurements (Fig. 4). We observed a tighter correlation of injury volume with SE CBV images than with CBF measurements made using dynamic GE imaging. In practice, the SE CBV allows higher spatial resolution because it is a steady-state technique requiring no dynamic scans. In the bolus transit GE technique, spatial resolution is typically compromised to maximize temporal resolution. The SE CBV imaging method has the added advantage of being more sensitive to the microvascular blood volume than the dynamic GE method, which is most sensitive to blood flow in large vessels (Boxerman et al., 1995). These results emphasize the importance of observing the microvasculature with high- spatial resolution as the best indicator of tissue injury and impending brain damage (Dirnagl, 1993).
Our techniques presently measure relative rather than absolute CBF and CBV. The validity of relative CBF and CBV measurements to make intergroup comparisons depends on the assurance that the control measurements (contralateral to the ischemic hemisphere in this study) do not excessively vary within and between groups. There were no significant differences between the measured CBV or CBF in contralateral hemispheres (SEM ∼15%) of any of the experimental groups or the sham-operated control group. Therefore, our residual CBF measurement is likely valid when compared with normal CBF in that region.
Our studies are consistent with previous cerebral ischemia studies in rats (Nakai et al., 1988) and baboons (Obrenovich et al., 1988) documenting reduced CBF in hyperglycemic compared with normoglycemic animals. It was shown in the latter studies that reduced CBF is correlated with the reduction in tissue pH associated with preexisting hyperglycemia. Histological studies document stagnated blood (Kalimo et al., 1981) possibly caused by endothelial cell swelling (Nedergaard, 1987) in the postischemic brain tissue in hyperglycemic rats. Reduced CBF has recently been shown in chronically hyperglycemic rats (7 days after streptozotocin) in similar MCAO models (Kittaka et al., 1996). These authors attribute reduced CBF in postischemic brain in hyperglycemic rats to an associated downregulation of endogenous tissue plasminogen activator, a thrombolytic enzyme. These previous results, combined with the present study implicate damage to the microvasculature as the primary culprit in hyperglycemic exacerbation of focal ischemia/reperfusion brain injury. Whether excess damage to the vasculature is primarily caused by the effects of streptozotocin-induced chronic diabetes (Kittaka et al., 1996) or effects of acute hyperglycemia was not specifically addressed in the present study. However, our recent unpublished studies using glucose infusion to maintain similar serum glucose levels indicate that in our models, the exacerbation we observed is caused by acute hyperglycemia rather than effects of chronic diabetes or streptozotocin injection.
CONCLUSION
In these MCAO models, both dynamic GE CBF and time-averaged SE CBV measurements indicate that preexisting hyperglycemia exacerbates 4 hours postocclusion, MRI-measurable brain cellular injury in proportion to increased ischemia.
Footnotes
Acknowledgment:
We thank Donald Deyo and Edward L. Ezell for their technical assistance.