
Abstract
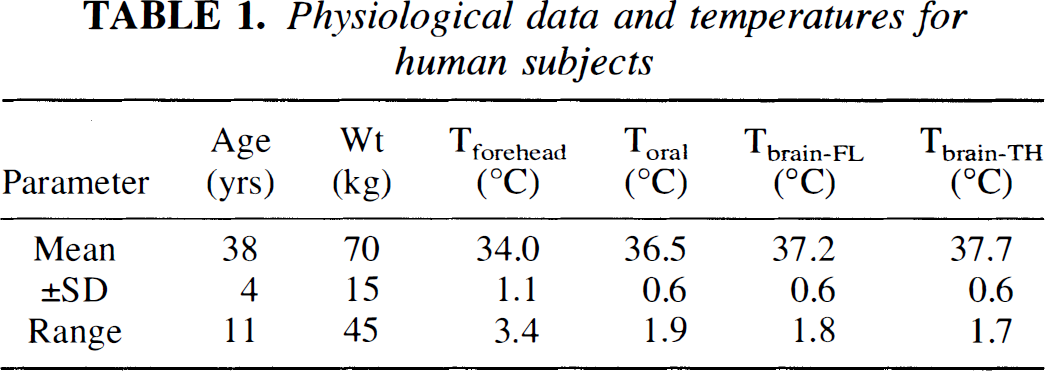
Elucidation of the role of cerebral hyperthermia as a secondary factor that worsens outcome after brain injury, and the therapeutic application of modest brain hypothermia would benefit from noninvasive measurements of absolute brain temperature. The present study was performed to evaluate the feasibility of using 1H magnetic resonance (MR) spectroscopy to measure absolute brain temperature in human subjects on a clinical imaging spectroscopy system operating at a field strength of 1.5 T. In vivo calibration results were obtained from swine brain during whole-body heating and cooling, with concurrent measurements of brain temperature via implanted probes. Plots of the frequency differences between the in vivo MR peaks of water and N-acetyl-aspartate and related compounds (NAX), or water and choline and other trimethylamines versus brain temperature were linear over the temperature range studied (28–40°C). These relationships were used to estimate brain temperature from 1H MR spectra obtained from 10 adult human volunteers from 4 cm3-volumes selected from the frontal lobe and thalamus. Oral and forehead temperatures were monitored concurrently with MR data collection to verify normothermia in all the subjects studied. Temperatures determined using N-acetyl-aspartate or choline as the chemical shift reference did not differ significantly, and therefore results from these estimates were averaged. The brain temperature (mean ± SD) measured from the frontal lobe (37.2 = 0.6°C) and thalamus (37.7 ± 0.6°C) were significantly different from each other (paired t-test, p = 0.035). We conclude that 1H MR spectroscopy provides a viable noninvasive means of measuring regional brain temperatures in normal subjects and is a promising approach for measuring temperatures in brain-injured subjects.
Keywords
In recent years there has been a rejuvenation of interest in the monitoring and therapeutic modulation of brain temperature for the treatment of head trauma and cerebral ischemia. This follows from studies on animal models showing that 1–3°C reductions in intra- or post-insult brain temperature, significantly reduce traumatic or ischemic injury (Clifton et al., 1991; Laptook et al., 1994; Wass et al., 1995). Equally important as the protective role of hypothermia, is the deleterious influence of modest hyperthermia, which worsens pathologic outcome and accelerates the evolution of ischemic necrosis (Ginsberg, 1992). The potential diagnostic and therapeutic implications of brain temperature measurements are suggested by clinical observations that post-infarct brain mortality and morbidity is exacerbated by an elevated systemic temperature (Castillo et al., 1994; Ginsberg, 1992), and that moderate systemic hypothermia improved outcome after severe traumatic brain injury (Clifton et al., 1993). Previous direct measurements of brain temperature via invasive thermocouples have been limited to small numbers of neurosurgical patients (Ginsberg, 1992), and the validity of indirect measurements of brain temperature, such as tympanic membrane temperature, are controversial (Brengelmann, 1993; Cabnac, 1993). Nevertheless, the possibility that cerebral hyperthermia after ischemia or trauma may exacerbate the primary injury (Ginsberg, 1992), underscores the potential importance of direct measurement of brain temperature. An accurate noninvasive measurement of brain temperature with the ability to measure multiple regions of the brain could resolve fundamental questions concerning brain temperature regulation under normal and pathological conditions. In addition, the efficacy of different brain cooling strategies to reduce injury could be evaluated.
We (Corbett et al., 1994; Corbett et al., 1995) and others (Cady et al., 1995; Kuroda et al., 1993; Kuroda et al., 1994) have shown that temperature-dependent changes in the magnetic resonance (MR) frequency of water can be used to measure absolute brain temperature in vivo. Previously (Corbett et al., 1995), we validated the use of 1H MR to measure absolute brain temperature in swine brain at a magnetic field strength of 4.7 T, based on measuring the difference between the 1H MR frequencies of water and N-acetyl-aspartic acid (Δ δH2O − δNAX). The present study extends this approach to the measurement of human brain temperature on a clinical system operating at 1.5 T. The goals of the study were to validate this technique on a clinical MR system, and characterize and compare the brain temperature of normal adults for two regions, corresponding to deep and superficial volumes in the cerebrum. We also compare the use of choline and other trimethylamines (TMA) and NAX as reference signals, and compare brain MR temperature with oral and forehead temperature measurements.
METHODS
Experimental Protocol
The surgical procedures and experimental protocol on swine were approved by the University of Texas Southwestern Medical Center Institutional Review Board for Animal Research and were in accordance with the NIH Guide for the Care and Use of Laboratory Animals. The study of humans was approved by the Institutional Review Board for use of human subjects at the University of Texas Southwestern Medical Center at Dallas.
To provide in vivo calibration data for human brain temperature determinations, three swine aged 1 to 14 days were studied. The surgical preparation was the same as described previously (Corbett et al., 1995). Briefly, animals were tracheotomized and ventilated with 70:30 N2O:O2, and D-tubocurarine Cl (0.10 mg/kg) and nalbuphine (0.1 mg/kg) were administered intravenously for muscle relaxation and analgesia, respectively. Intravascular catheters were placed in the abdominal aorta and inferior vena cava via a femoral artery and vein respectively, for the administration of drugs, drawing blood samples and monitoring blood pressure and heart rate. Body temperature was controlled by adjusting the temperature of water circulating through a blanket wrapped around the animal. Brain temperature was measured directly, using one or two 0.5 mm-diameter fiber optic temperature sensor and monitor (Model MIA probe and 750 monitor, respectively, Luxtron, Mountain View, CA, U.S.A.) implanted 1 or 2 cm into the cerebral cortex through a burr hole drilled 0.5 mm lateral to midline and adjacent to coronal sutures. On the day of the study, the temperature monitor was moved into the room housing the magnet and sensors were calibrated at room temperature, relative to a type T copper/constantan thermocouple and thermometer (Cole-Palmer, Chicago, IL, U.S.A.). Separate experiments were performed to determine that sensors calibrated in this manner gave accurate temperature readings at 38–39°C to within ±0.1°C. The average precision of temperature readings from sensors held at a fixed temperature ranged from ±0.06 to 0.08°C.
Before collecting MR data, arterial pH, P
The experiments to measure brain temperature in humans were performed on 10 healthy adult volunteers. Oral (Toral) and forehead (Tforehead) temperature were measured throughout the experiment using two fiber optic temperature sensors held under the tongue and taped to the forehead, respectively. Toral and Tforehead were recorded at the beginning and end of each data collection interval for imaging and spectroscopy. The experimental protocol consisted of first obtaining survey T1 weighted images, and then selecting a 4 cm3-voxel at one of two locations: either close to the edge of the skull in the frontal lobe (1.6 × 1.6 × 1.6 cm voxel shape) or situated posteriorly around the left or right lobe of the thalamus (1 × 2 × 2 cm voxel shape). The instrument was prepared for proton spectroscopy as described above, and then two to five spectra were sequentially recorded. Next, the second location was selected, the preparation procedures repeated, and two to five spectra recorded sequentially. The total time to acquire the entire data set was no longer than 1 h per subject.
MR Imaging and Spectroscopy
All experiments were performed on a 1.5 T Philips NT system (Philips Medical Systems, Shelton, CT, U.S.A.) using manufacturer-supplied knee and quadrature head imaging coils to obtain volume localized spectra from the brains of swine and human subjects, respectively. Imaging of swine brain consisted of a modified RARE turbo spin echo pulse sequence to give T2-weighted images (2.0 × 0.6 × 0.7 mm resolution) in the sagittal and coronal (perpendicular to the corpus callosum) planes (10 and 20 slices, respectively). These images were used for positioning of a 1- × 2- × 1-cm voxel regions of the thalamus/hypothalamus and temporal lobes. Imaging of human brain consisted of a T1-weighted fast field echo pulse sequence for a low resolution image (2 × 2 × 5 mm) in the sagittal plane (13 slices with 0.7-mm gap thickness), and a spin echo pulse sequence for higher resolution (0.8 × 0.8 × 4 mm) coronal and axial views (40 slices with no gap). Triplane images allowed the selection of single- or double-obliqued voxels for MR spectroscopy in order to exclude cerebrospinal fluid-containing spaces. The anteriorly positioned voxel was placed in the paramidline frontal lobe (FL) and included primarily frontal white matter radiations and gray matter of the frontal lobe to a lessor extent. The deep central voxel was positioned primarily in the thalamus (TH) with small amounts of white matter from the internal capsule cerebral peduncle and decussations included.
Non-H2O-suppressed 1H MR spectra were obtained using a PRESS sequence with a sweep width of 750 Hz and 1024 data points per spectrum. The delay time between excitation pulses was 2.7 s, and echo time was 136 ms. After four dummy scans to establish partial saturation, 32 to 64 free induction decays were accumulated for each spectrum (i.e., 1.5 to 3 min/spectrum). The accumulated 1H free induction decays was processed by baseline correction to remove DC offsets, 1 Hz Exponential apodization, zero-filling to 4,096 data points (final digital resolution = 0.0029 ppm/data point), Fourier transformation, and zero order phased manually, to give the maximal positive intensity for both the H2O and NAX MR peaks. The chemical shift scale of all spectra were calibrated with respect to the location of the NAX 1H MR peak set to 2.020 ppm. The exact chemical shift corresponding to H2O, TMA and NAX peaks were determined using the “single peak analysis” software routine supplied with the MR system (version 4.0 and 4.3 spectroscopic operating system). Repeated data processing and analysis of raw data collected for two human subjects (six spectra collected per subject) showed that the reproducibility of chemical shift differences between H2O and NAX (Δ δH2O − δNAX) and H2O and TMA (Δ δH2O − δTMA) between analysis sessions agreed to within ±.001 ppm or less.
RESULTS
In vivo MR of swine brain
The heart rate, blood pressure arterial pH, and gases were all within normal ranges for animals of this age range as compared with data presented in previous studies using this species, and the changes in these variables during whole-body heating or cooling was similar to that reported previously (Laptook et al., 1995). Preliminary studies on phantoms suggested that there was no need to actively suppress the MR signal from H2O through the use of binomial or chemical shift selective pulse sequences, in order to view the relatively smaller signals of TMA, creatine and phosphocreatine, and NAX. The H2O signal from swine brain was sufficiently narrow (0.1 ppm) and partially suppressed (by virtue of incomplete spin-lattice recovery [T1] and spin-spin [T2] losses, that it did not obscure the signal from these metabolites (Fig. 1). The absence of a MR signal from lactate at 1.33 ppm, suggests that the implanted temperature probes did not cause tissue injury sufficient to alter the metabolic status of brain tissue measured within the voxel. Typical signal to noise ratios for water and the metabolite MR peaks obtained from a 2 cm3 volume in 3 min were 4,000–5,000:1 and 10–20:1, respectively. Because the intensity of the NAX and TMA MR signals were 0.2–0.5% of the intensity of the water peak, there were concerns that analog to digital conversion would be insufficient to accurately define their peak shapes. However, the manufacturer's specification states that 32 bits words are used for analog to digital conversion, which is more than sufficient to define peaks whose intensities differ to this degree.
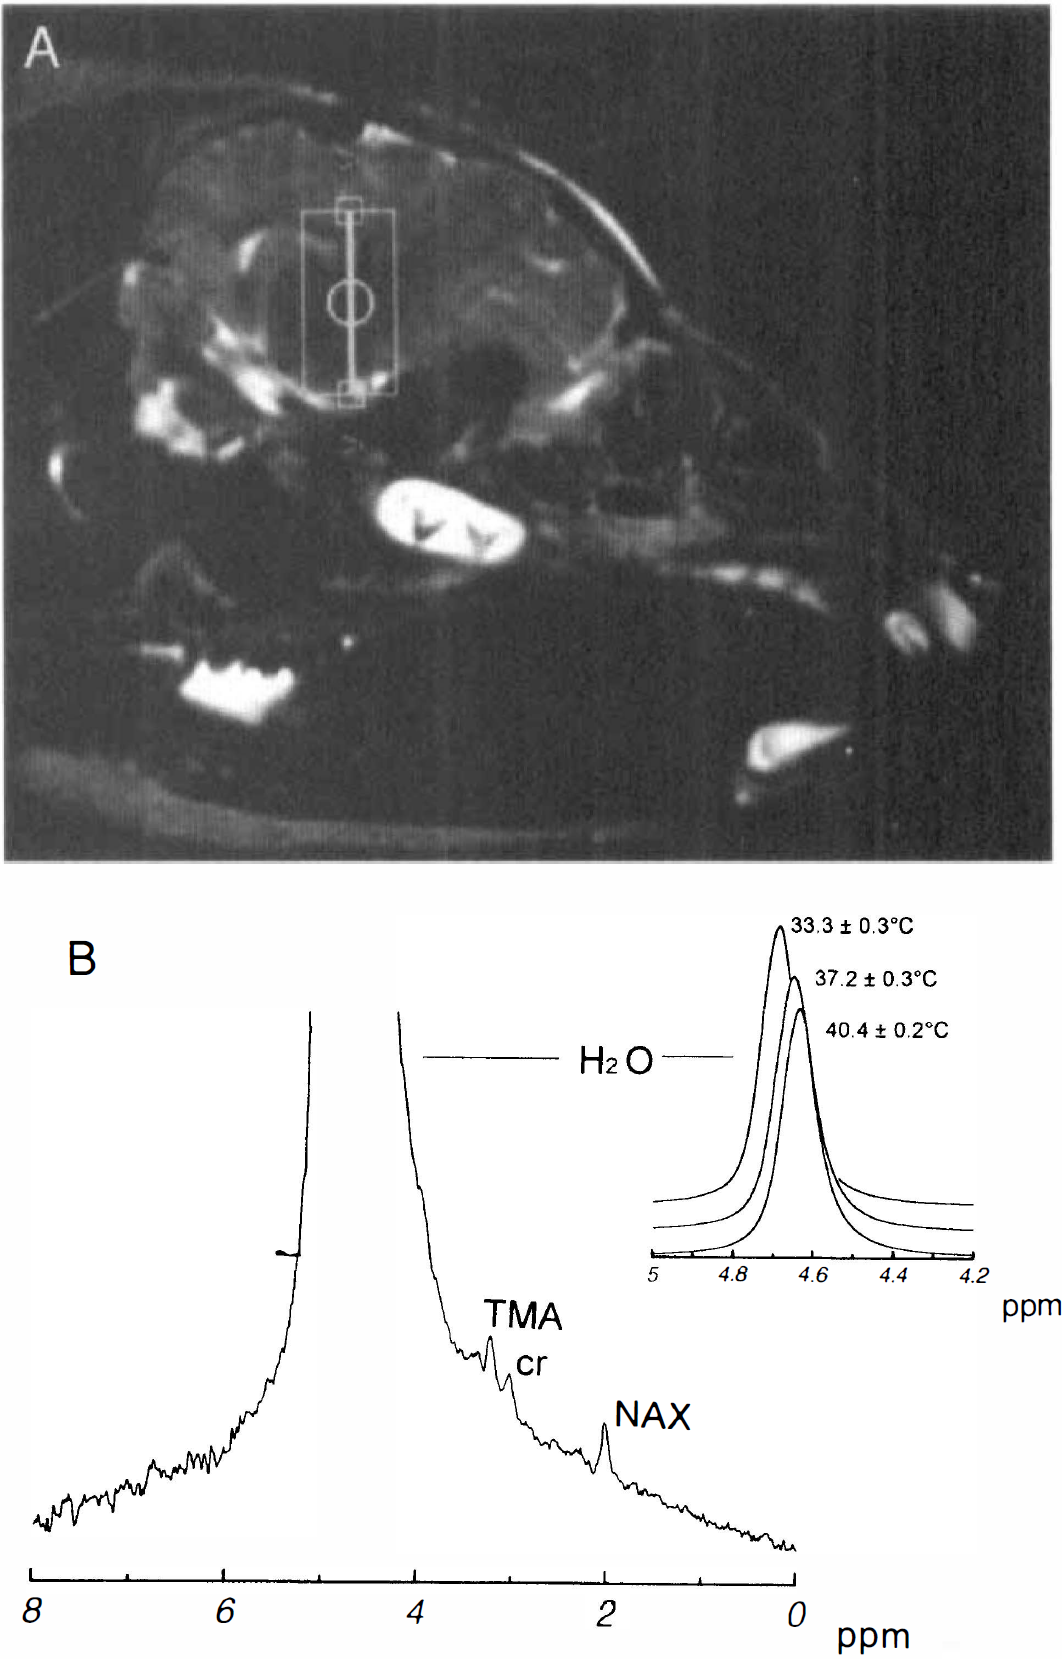
1H MR images and spectra from swine brain. Sagittal image showing the location of the voxel selected for volume localized spectroscopy (box) (
The MR signal from both TMA and NAX were clearly discernible, and therefore, we decided to investigate the use of either as a reference for temperature-induced changes in the MR frequency of water. Because creatine and phosphocreatine appeared as a small shoulder on TMA, we elected not to attempt a similar quantification for this peak. Plots of the frequency difference between H2O and NAX (Δ δH2O − δNAX) versus temperature and the frequency difference between H2O and TMA (Δ δH2O − δTMA) versus temperature (Figure 2) were both linear (r = 0.93). It is noteworthy that this relationship was not altered substantially for data collected from the brain 1–2 h after the killing of the animal (Fig. 2, diamonds).
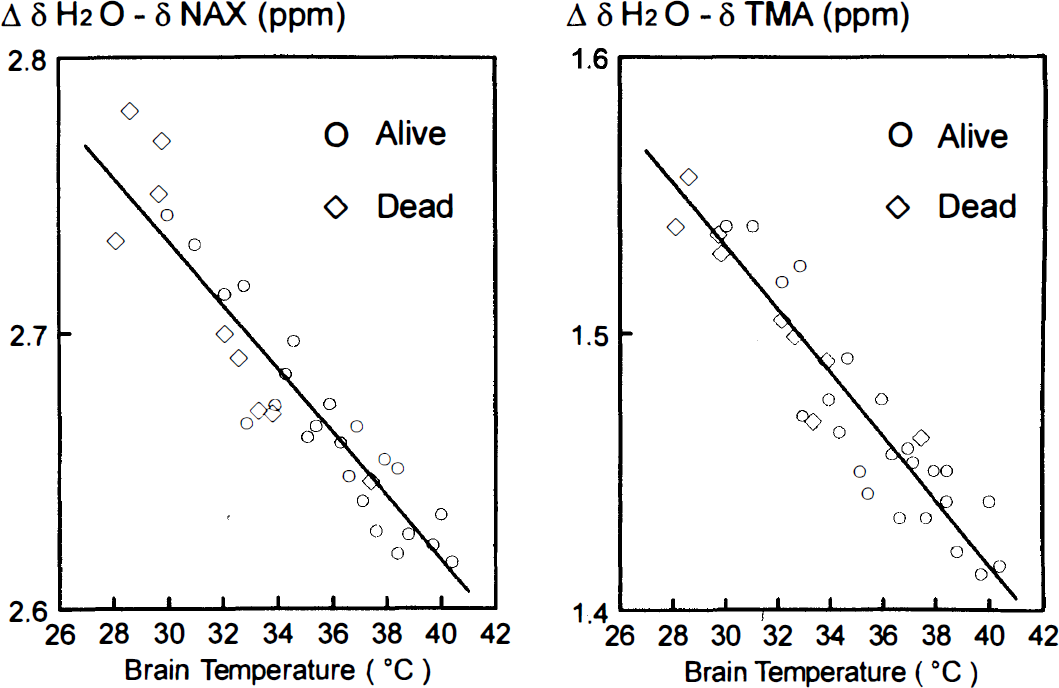
Relationship between mean brain temperature measured from implanted temperature sensors and Δ δH2O − δNAX (left) and Δ δH2O − δTMA (right). The combined results are shown for three swine while alive (circles) and dead (diamonds); the solid line represents the best fit by linear regression analysis, where T
In vivo MR of human brain
The 1H MR spectra obtained from human subjects also showed distinct MR signals from TMA, creatine and phosphocreatine, and NAX (Fig. 3). The line width of H2O from voxels centered in either FL or TH were similar to that obtained for swine brain, with higher signal-to-noise ratios corresponding to the larger voxel size (i.e., 4 cm3 for humans versus 2 cm3 for swine). There was a trend for lower absolute signal intensities from the TH voxel as compared with the FL voxel, possibly reflecting regional differences in MR receiver coil sensitivity. The slope and intercept from the relationships shown in Figure 2 were used as calibration curves to calculate brain temperature in human subjects. For subjects in which 3 to 5 spectra were obtained for a voxel, the average within subject variation in temperature was 0.8°C. Brain temperatures calculated from the Δ δH2O − δNAX versus temperature relationship for FL (37.0 ± 0.9°C) and TH (37.6 ± 0.7°C) were not significantly different than temperatures calculated from the ΔδH2O − δTMA versus temperature relationship (37.3 ± 0.9 and 37.7 ± 0.6°C, respectively; paired t-test, p > 0.05), and therefore the results from these two measures were averaged (Table 1). Brain temperature from TH (T
Physiological data and temperatures for human subjects
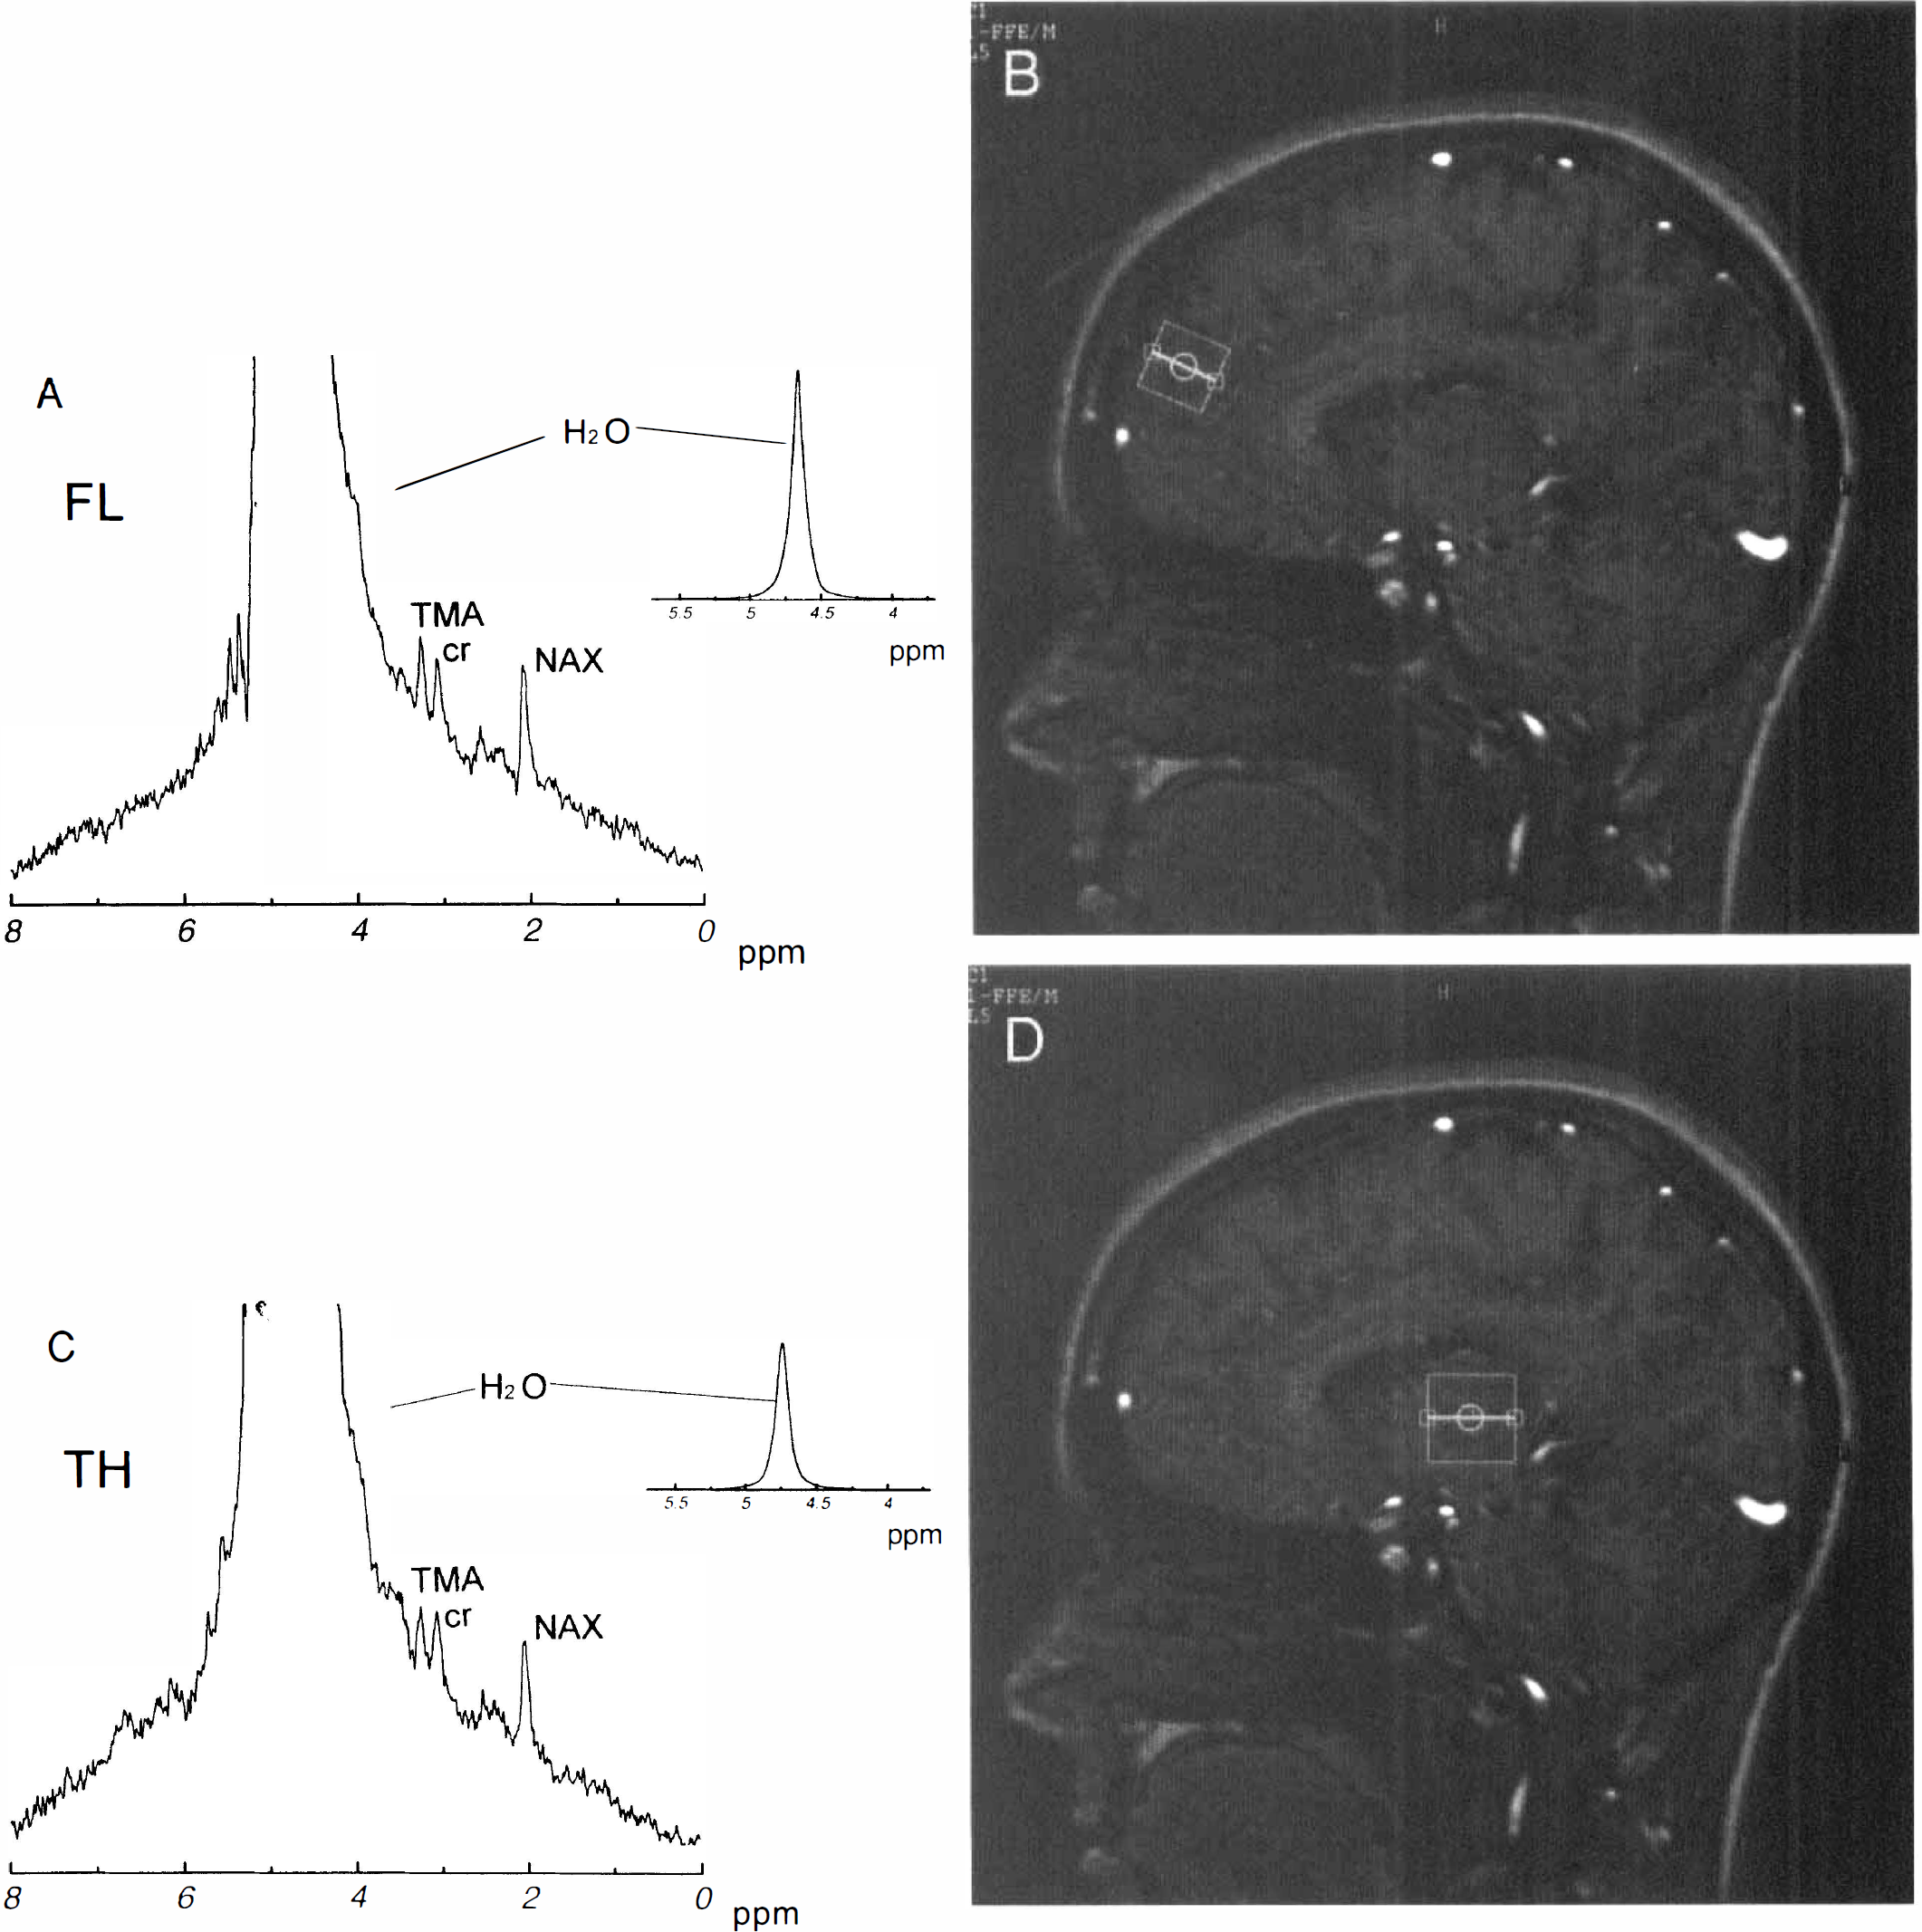
1H MR images and spectra from human brain. The upper panels show an sagittal image with the voxel for spectroscopy located in the anterior frontal lobe on the right and corresponding spectrum on the left (
With the magnitude of temperature change during the course of the experiment limited to 0.1–0.4°C, oral (Toral) and forehead (Tforehead) remained constant for all 10 subjects during the collection of individual MR spectra. A comparison of brain temperature and Toral revealed significant differences with respect to FL (0.6 ± 0.8°C; p = 0.032) and TH (1.2 ± 0.5°C; p < 0.0005), this difference remained constant during the temperature range observed (Fig. 4A). Significant differences between Tforehead and brain temperature were also present (3.2 ± 1.4 and 3.6 ± 0.9°C, for FL and TH, respectively). However, unlike Toral, the difference between brain temperature and Tforehead decreased as a function of increasing temperature (Figure 4B; r = 0.58, p < 0.1, and r = 0.65, p < 0.05 for FL and TH, respectively). Additional comparisons revealed no linear relationships between brain temperature versus age or weight, and no differences in the brain temperatures of male (n = 5) versus female (n = 5) subjects.
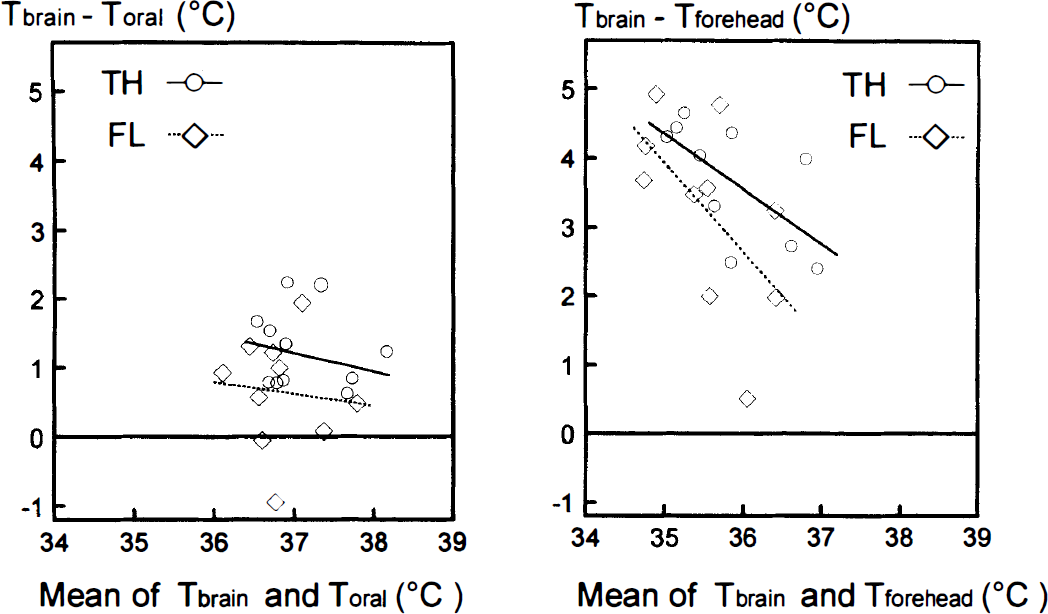
Relationship between brain temperature measured via 1H MR spectroscopy and oral (left) or forehead (right) temperatures measured via optical fiber sensors during MR data collection. The difference between brain temperature and oral or forehead temperature is plotted versus the mean of these two quantities for measurements made from both the frontal lobe (diamonds) and the thalamus (circles). The lines represent best fit by linear regression analysis.
DISCUSSION
The present study shows that noninvasive brain temperature measurements on humans can be obtained from 4-cm3 volumes for virtually any region of brain in 1.5 to 3 min, using a clinical imaging/spectroscopy system operating at 1.5 T. This is consistent with earlier findings reported for neonatal human brain (Cady et al. 1995) and swine brain (Corbett et al. 1994, 1995). One of our early concerns was that the resolution of chemical shift differences between water and NAX, would suffer by virtue of the lower field strength of a clinical system operating at 1.5 T, as compared with our previous work performed on a research system operating at 4.7 T (Corbett et al., 1995). However, this was not a problem because of the high magnetic field homogeneity achieved from shimming and gradient tuning for the specific voxel selected for spectroscopy. In fact, line widths observed for the 1H MR signal of water from swine brain in the present study were equal to or slightly better than we typically obtained in past studies on the 4.7 T system, when using a surface coil used for data acquisition.
There are no previous estimates of directly measured brain temperature in normal adult human subjects that we can compare our results with, but average values of 37.8 ± 0.8°C measured from temperature probes placed in the brains of head trauma patients (Ginsberg, 1992), are similar to the present study (Table 1). Similar to our previous study, the calibration data obtained from swine brain suggests an accuracy of about ±1°C. Potential sources of variation include: temperature variances within the volume and during the time required to obtain individual spectra (±0.3°C), limits in digital resolution in the frequency domain of MR spectra (±0.29°C per data point or ±0.58°C per brain temperature determination, because this involves measuring the difference in two MR frequencies), variations associated with manually phasing the data (less than ±0.1°C), the accuracy of the thermocouple used to calibrate the optical fiber sensors (±1% of reading, or ±0.3 to 0.4°C) and variations in temperature readings from the optical fiber sensor itself (±0.08°C). Further work is needed to determine the optimum method for, and limits of accuracy of chemical shift measurements in proton spectra of the brain.
Our results are also consistent with invasive brain temperature measurements that report temperature gradients of up to 1°C from the cooler superficial to warmer deep brain tissue in humans (Mariak et al., 1994; Shiraki et al., 1988). It is unclear whether variations in the magnitude of this gradient reflect differences for distinct anatomical regions of brain or differences in the population of subjects studied (normal subjects versus patients with varying degrees of traumatic head injury). Our observation of a temperature gradient in normal subjects is suggestive of heat loss by direct conduction through the calvaria, as hypothesized by proponents of the existence of selective brain cooling in humans (Cabnac, 1993). However, the present study neither confirms or refutes selective brain cooling, because none of the subjects studied were hyperthermic, a condition thought to be required for selective brain cooling to occur. It would be of interest to extend these measures into the hyperthermic range, because if selective brain cooling were present, one would predict a decrease in the difference between brain versus systemic temperature. The observation of a decreasing difference between brain and forehead temperature with increasing temperature, casts doubt on the use of the latter as a measure of brain temperature. From this standpoint, oral temperature would seem to be a more valid measure of brain temperature, although the absence of a significant linear correlation in Fig. 4 could simply be a reflection of intersubject variability as well as the narrow temperature range for subjects studied under normothermic conditions.
A considerable advantage over our previous study was that there was no need to collect alternate pairs of non-H2O-suppressed and H2O-suppressed spectra. 1H MR signals from both H2O, as well as TMA and NAX were clearly visible in volume-localized non-H2O-suppressed spectra. The ability to obtain MR signals from both water and the peak used as a frequency reference (NAX or TMA) in a single spectrum eliminated the potential for magnetic field drift during the period when alternate non-H2O-suppressed and H2O-suppressed spectra are collected. The visibility of the TMA peak was an added benefit because it presented a second chemical shift reference for temperature determinations. As expected, there was no significant difference between brain temperatures estimated from Δ δH2O − δNAX versus Δ δH2O − δTMA, and therefore we took their average to provide a more accurate estimate of brain temperature. The alternative of measuring brain temperature from Δ δH2O − δTMA could be especially useful in the study of subjects with brain damage in which extensive neuronal death could reduce or eliminate the 1H MR signal from NAX (Fenstermacher and Narayana, 1990). One potential concern is that the in vivo TMA MR signal may derive from several compounds with slightly different chemical shifts (Barker et al., 1994), and whose relative concentrations could change during ischemia or infarction, although there is evidence to suggest that total brain phosphocholine and glycerol phosphocholine levels do not change rapidly during short periods of ischemia (Miccheli et al., 1988). However, changes in the days after ischemia also will need to be investigated. Similarly, there is the possibility that the in vivo NAX signal is the composite of signals not only from N-acetylaspartate, but other species as well, such as N-acetylaspartylglutamate, glutamate, and glutamine (Barker et al., 1994). However, the ratio of N-acetylaspartylglutamate to N-acetylaspartate 1H MR signal intensities is low (0.03 to 0.14) for most locations except the brain stem and spinal cord (Holowenko et al., 1992), and the 1H MR signals of glutamate and glutamine are attenuated with increasing spin-echo delay times exceeding 20 ms because of J-modulation (Rothman et al., 1992). Both of these considerations suggest that the relative contribution of these species to the in vivo NAX 1H MR signal in normal brain tissue under the data collection conditions used in the present study (i.e., TE = 136 ms) would be negligible. However, whether this holds true for chronically infarcted brain tissue remains to be tested.
Although the relationship between temperature and Δ δH2O − δNAX was qualitatively similar to that observed for swine brain previously, the exact slope and intercept from the plot in Fig. 2, differed from our previous study (Corbett et al., 1995), as well as Cady et al. (Cady et al., 1995). Several differences in the experimental design as well as the data collection and processing protocols, as compared with the present study, may explain these discrepancies. In Corbett et al., we used calibration data obtained from model solutions whose temperature was monitored directly using a fiber optic temperature sensor, whereas Cady et al. used calibration data derived from the study of a newborn swine whose tympanic membrane temperature was monitored. It is possible that tympanic membrane temperature may not be identical to the temperature of the portion of brain tissue measured by 1H MRS.
In the present study, this concern was obviated by implanting temperature sensors directly in the brain, and collecting volume-localized 1H MR spectra from tissue immediately surrounding the implanted probes. In Corbett et al., the 1H MRS signals for water and NAX were collected using two different pulse sequences, a simple pulse-acquire sequence for water, and a spin-echo pulse sequence using 1331 and 2662 pulses for NAX. These binomial pulses were set with optimal sensitivity on lactate, 0.7 ppm upfield from NAX, whereas Cady et al. collected 1H MRS signals from both water and NAX via a single spin-echo pulse sequence using 11 and 22 pulses with the spectrometer frequency operating 150 Hz off resonance from the water signal, with the optimum sensitivity of the binomial pulses set 0.5 ppm downfield from NAX.
In either study, collecting data for NAX off the optimal frequency sensitivity for NAX could shift the apparent peak maximum of the MR signal. Because the 11-pulse sequence gives a smaller frequency range of optimal sensitivity as compared with the 1,331-pulse sequence (Hore, 1983), the extent of the apparent maximum shift may be larger in the former compared with the latter. Binomial pulses were not used in the present study. In addition, differences in the phasing procedures applied to Fourier transformed data in the present study (simultaneous, manual, zero-order phasing of both the water and TMA and NAX peaks), as compared with Corbett et al. (computer-automated, zero-order phasing the water peak and magnitude calculation applied to water-suppressed MR spectra of NAX), and Cady et al. (separate, manual, zero-order phasing of water and NAX peaks), could introduce small systematic differences in peak maxima between studies. Finally, peak overlap between the unsuppressed water and metabolite MR signals could affect the peak maxima of the latter as compared with their locations in water-suppressed spectra. These considerations point to the need for caution when applying calibration results to a different MR system, in which instrument differences in data collection, processing, or analysis may result in subtle differences in the relationship between temperature and Δ δH2O − δNAX. Nevertheless, provided that the appropriate validation has been done, it should be relatively straightforward to measure brain temperature on any clinical imaging system with spectroscopy capabilities.
The observation that 1H MR spectra collected before and after death follow the same linear relationship (Fig. 2), suggests that the calibration is valid for tissue that has been ischemic for at least 1–2 h, and is in agreement with our previous study (Corbett et al., 1995). Nevertheless, it is important to confirm that accurate temperature readings are also obtained from infarcted or traumatically injured brain tissue during a longer post-insult period. Despite the need for further validation studies such as these, we believe that it is reasonable to expect that brain temperature via 1H MR spectroscopy will provide a viable means to investigate temperature variation in patients with brain injury and to evaluate procedures to monitor and control brain temperature.
Footnotes
Acknowledgments:
Supported by the United Cerebral Palsy Research and Education Foundation, Inc.; Philips Medical Systems Inc; the Departments of Radiology and Pediatrics, University of Texas Southwest Medical Center at Dallas; and the Biomedical Research Support Grant Program Division of Research Resources NIH (BRSG 2 S07 RR 07175-13), National Institutes of Health Southwestern In Vivo Resource Facility (5P41-PR02584).