
Abstract
Spreading depolarizations (SDs) are highly active metabolic events, commonly occur in patients with intracerebral hemorrhage (ICH) and may be triggered by fever. We investigated the dynamics of brain-temperature (Tbrain) and core-temperature (Tcore) relative to the occurrence of SDs. Twenty consecutive comatose ICH patients with multimodal electrocorticograpy (ECoG) and Tbrain monitoring of the perihematomal area were prospectively enrolled. Clusters of SDs were defined as ≥2 SDs/h. Generalized estimating equations were used for statistical calculations. Data are presented as median and interquartile range. During 3097 h (173 h [81–223]/patient) of ECoG monitoring, 342 SDs were analyzed of which 51 (15%) occurred in clusters. Baseline Tcore and Tbrain was 37.3℃ (36.9–37.8) and 37.4℃ (36.7–37.9), respectively. Tbrain but not Tcore significantly increased 25 min preceding the onset of SDs by 0.2℃ (0.1–0.2; p < 0.001) and returned to baseline 35 min following SDs. During clusters, Tbrain increased to a higher level (+0.4℃ [0.1–0.4]; p = 0.006) when compared to single SDs. A higher probability (OR = 36.9; CI = 36.8–37.1; p < 0.001) of developing SDs was observed during episodes of Tbrain ≥ 38.0℃ (23% probability), than during Tbrain ≤ 36.6℃ (9% probability). Spreading depolarizations – and in particular clusters of SDs – may increase brain temperature following ICH.
Keywords
Introduction
Spontaneous intracerebral hemorrhage (ICH) accounting for 10–15% of all strokes worldwide has a high morbidity and mortality. 1 Therapeutic strategies to prevent secondary brain injury following ICH are limited. Fever is common in the neurocritical care setting and independently associated with hematoma growth and poor neurologic outcome following ICH. 2 Aside infectious complications as the cause of fever, neurologic injury per se can result in so called “central fever.” 3 An acute phase response including neuroinflammation, intraventricular hemorrhage or direct damage to thermoregulatory centers can lead to increased body temperature. 4 Based on information from temperature sensors of the skin, deep tissue and spinal cord, the central “set-point” temperature is regulated via prostaglandine E (PGE) levels in the hypothalamus. Peripheral mechanisms for increasing body temperature to reach the central “set-point” temperature include arteriovenous shunt vasoconstriction and heat production from muscles via shivering. 5 Temperature management in neurocritical care patients is challenging and may modulate pathophysiologic cascades following brain injury.4,6
As an important pathophysiologic process following ICH, perihematomal edema (PHE) expansion contributes to poor neurological outcome. 7 Data from a pilot trial with historical controls 8 and from a cohort study 9 indicated that PHE expansion might be effectively reduced using targeted temperature management (TTM).
Multimodal neuromonitoring allows a better understanding of pathophysiologic processes during TTM at the bedside. 6 Monitoring of spreading depolarizations (SDs) in patients with ICH demonstrated that the occurrence of SDs is timely associated with the development of PHE. 10
SDs are waves of glial and neuronal depolarizations leading to large intra- and extracellular ion shifts with near-complete loss of the transmembrane potential, water influx (cytotoxic edema) and loss of neuronal activity, irrespective of functional or vascular compartments. 11 A hallmark of SDs is influx of sodium and calcium ions into neurons and efflux of potassium ions which causes marked concentration changes of sodium, calcium and potassium in the intra- and extracellular bulk solutions. 12 Importantly, the influx of sodium and calcium is larger than the efflux of potassium so that the intracellular osmolality increases while the extracellular osmolality declines. As a consequence, water follows sodium and calcium into the neurons, producing an intracellular “cytotoxic” edema. This is visualized using two-photon-microscopy as a swelling of the neuronal soma and neuronal dendrites (so-called dendritic beading).13–15 The relevance of SDs has been clearly demonstrated in patients with subarachnoid hemorrhage (SAH), 16 traumatic brain injury (TBI) 17 and ischemic stroke. 18
In patients with TBI, the frequency of SDs is increased during episodes of elevated body temperature. 19 Understanding the pathophysiology of brain temperature regulation following ICH seems to be crucial for defining targeted treatment strategies in future. 20
In this study, we investigated the dynamics of brain-temperature (Tbrain) relative to the occurrence of SDs and core-temperature (Tcore) in patients with ICH.
Study population
Twenty patients with simultaneous multimodal electrocorticography (ECoG) and brain temperature monitoring have been recorded in an ongoing prospective observational trial at the neurologic intensive care unit of the Medical University of Innsbruck between January 2013 and January 2016. This prospective observational trial was approved by the institutional review board of the Medical University of Innsbruck, Innsbruck Austria (UN4089 292/4.4). Inclusion criteria for multimodal ECoG monitoring were ICH, written informed consent according to federal regulations, GCS before sedation <9. Patients were selected for retrospective data analysis of prospectively recorded data as follows: (1) spontaneous supratentorial intraparenchymal hemorrhage, (2) clinical decision for osteoplastic craniotomy and (3) brain temperature monitoring. Exclusion criteria for neuromonitoring were absence of brain stem reflexes, do-not-resuscitate status, uncontrolled coagulopathy, age <18 years. None of the patients of this study had decompressive craniectomy. All patients were comatose and were on continuous sufentanil, midazolam or propofol infusions. S-ketamine was added at the discretion of the treating neurointensivist.
CT scans were obtained for clinical management and were grouped based on post bleeding days (Day 0–2, Day 3–5, Day 6–9). Initial hematoma volume was calculated using the ABC/2 estimating technique in ellipsoid hemorrhages and the ABC/3 in non-ellipsoid hemorrhages by an independent neuroradiologist (PR) blinded to clinical course, ECoG data and the patients outcome. 21–23 All CT-scans were graded for PHE progression by increases of midline-shift and/or edema volume. 23 The midline-shift was expressed in millimeters (mm) as the largest distance between the ideal midline and the septum pellucidum.
Ethics
This prospective observational study was approved by the Ethics Committee of the Medical University ofInnsbruck, Innsbruck Austria (UN4089 292/4.4) in accordance with the Declaration of Helsinki of 1975 (and as revised in 1983). Written informed consent was obtained according to federal regulations.
Clinical management and outcome assessment
Devices for monitoring intracranial pressure (ICP) including brain temperature (NEUROVENT-P-TEMP, Raumedic®, Münchberg, Germany) and electrocorticographic activity (AdTech, Medical Instrument Corporation, WI, USA) were tunneled after hematoma evacuation through the craniotomy targeting the perihematomal white matter. The subdural ECoG-strip (6 platinum contacts, 10 mm between contacts distance) was placed adjacent to the incision site for hematoma evacuations as described previously. 10 Cerebral perfusion pressure (CPP) was monitored at the level of Monroi. ICP levels >20 mmHg were treated using a stepwise protocol (increasing sedation, short-term hyperventilation (target PaCO2: 30–35 mm Hg), bolus osmotherapy (100 cc of 10% hypertonic saline or 250 cc of 15% mannitol), and as rescue therapy TTM (using an endovascular cooling device: ThermoGard XP™, Zoll®; target temperature: 34.0–35.0). CPP was targeted at >60 mmHg, all patients were ventilated to achieve an arterial oxygen saturation ≥95% and PCO2 of 35 to 45 mmHg. An external ventricular drainage was inserted in patients with hydrocephalus and/or patient with severe intraventricular bleeding.24,25 The subdural strip electrode was removed at the bedside at the end of neuromonitoring. Clinical outcome was assessed at three months following ictus using the modified Rankin Scale (mRS). Unfavorable outcome was defined as mRS > 3.
Body temperature monitoring and fever management
Tcore was recorded continuously from a temperature sensor of the bladder catheter. Antipyretic treatment was performed according to a stepwise protocol: (1) Physical measures (e.g. cold mint washes), (2) Oral or parenteral paracetamol or non-steroidal antipyretics, (3) Ice cooled isotonic fluid, (4) TTM to achieve at least normothermia (∼36.4℃).
ECoG data interpretation
In general, multimodal ECoG monitoring was performed as described previously.10,26 SDs were considered as sequential onset of propagating, polyphasic slow potential changes (SPC) in adjacent channels accompanied by an ECoG-amplitude loss (ECoG depression) of at least 50% in the high frequency ECoG band.27,28 Clusters of SDs were defined as ≥2 SDs per hour. 29 As a quality control, at least daily checks of the ECoG setup and electrodes were performed by the study physician to assure appropriate recordings and patient safety. 30
Data acquisition and management
Monitoring data including Tcore and Tbrain were obtained from the devices every 2–3 min and stored in the electronic patient management system (Centricity Critical Care 7.0, GE Healthcare Information Technologies, Dornstadt, Germany). Anonymized datasets were merged into a standardized database (PostgreSQL 8.4-www.postgresql.org) using Perl (www.perl.org) and Talend Open Studio for Data Integration 5.1 (TOS-www.talend.com) and averaged to 5-min-means by a biomedical engineer (WH) blinded to ECoG and outcome data. Five minute-means were used for longitudinal temperature analysis, and 1 h means for correlating SDs with physiologic parameters. For each depolarization, a time stamp was assigned to the time of onset of the first SPC. The depolarization onset time was then assigned to the closest 5-min interval of the automatically and standardized recorded monitoring signals. Fever was defined as Tcore ≧38.0℃ according to previous studies. 31 Fever burden (for brain and body temperature) was defined as the fever time product (℃ hours) under the fever curve, and calculated by formulas, as published previously. 32 The 5-min average resolution was used for calculating the percentage of temperature recordings ≧38.0℃ per 24 h. Temperature variability was calculated as the standard deviation of 24-h temperature values. The first 24 h following ICH were defined as “day 0.” Spreading probability was assessed by dividing the count of SDs within a temperature quartile by the count of total temperature data points within the temperature quartile. 19
Statistical analysis
Statistical analysis, data processing and statistical imaging were performed using SPSS 24.0 (SPSS Inc., IBM, Chicago, Illinois) by the study team under the supervision of experienced statisticians and bioengineers (GK, WH). Impax (EE R20 XV, Agfa Healthcare, Bonn, Germany) was used for radiologic image processing. Quartiles of continuous parameters were defined by their percentiles (25th, 50th, 75th). Time-series data (5-min-means) were analyzed 60 min before and 60 min after depolarization events using generalized estimating equations (GEEs) with an autoregressive matrix of the first order (AR-1) to handle multiple comparisons and repeated observations within subjects. The 5-min-means 60 min before the SDs onset was defined as baseline. Spearman’s rho was used for correlation analysis. Data are presented as median with interquartile range (IQR) or mean and standard error. A p-value < 0.05 was considered as statistically significant.
Results
Patient characteristics and outcome
Patient characteristics, complications and outcome.
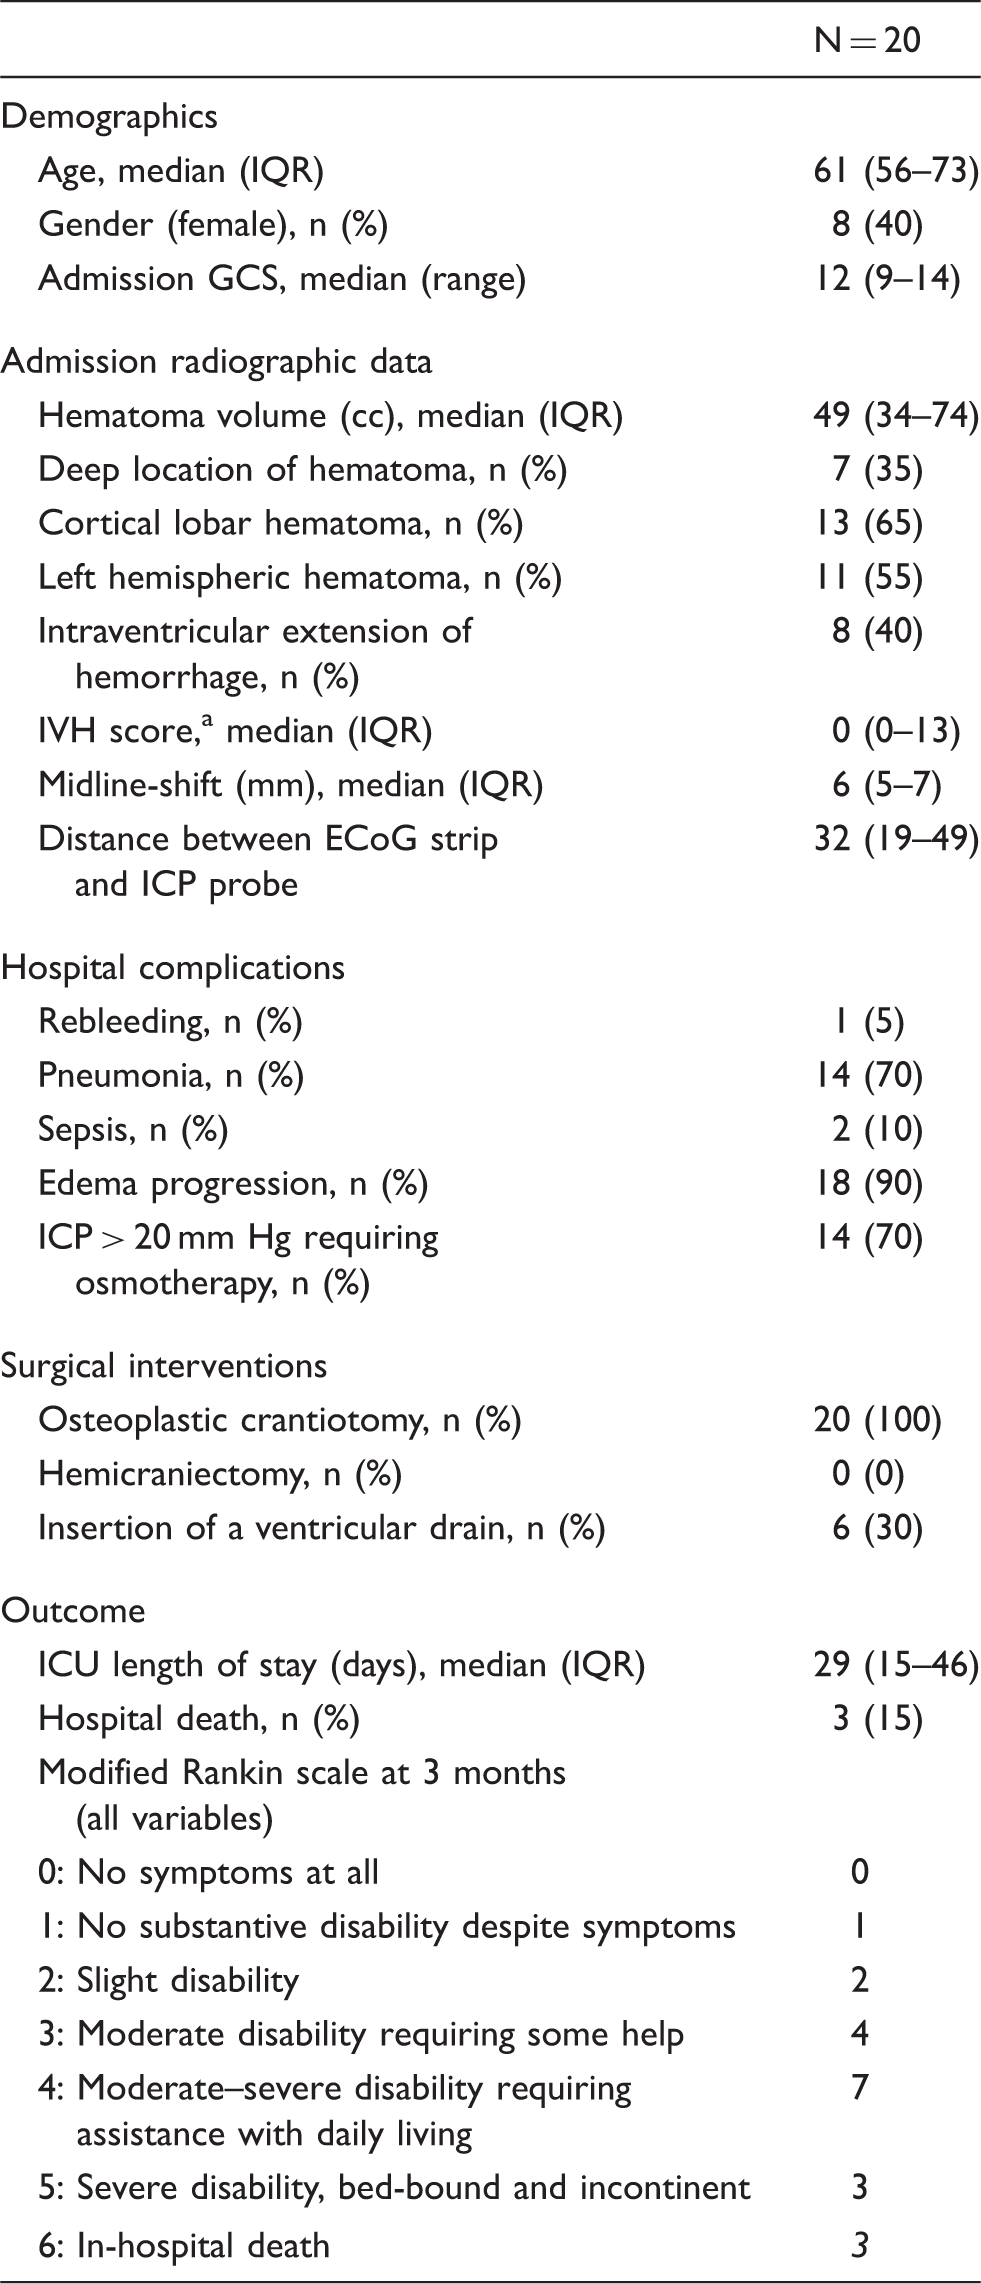
GCS: Glasgow coma scale; ICP: intracranial pressure; ICU: intensive care unit; IVH: intraventricular hemorrhage; ECoG: electrocorticography; IQR: interquartile range.
IVH sum score grades the amount of blood in the right and left lateral, third and fourth ventricle (0 = no blood, 1 = sedimentation, 2 = partly filled, 3 = completely filled) by adding each of the four individual ventricle scores (range 0–12).
Neuromonitoring, spreading depolarizations and interventions
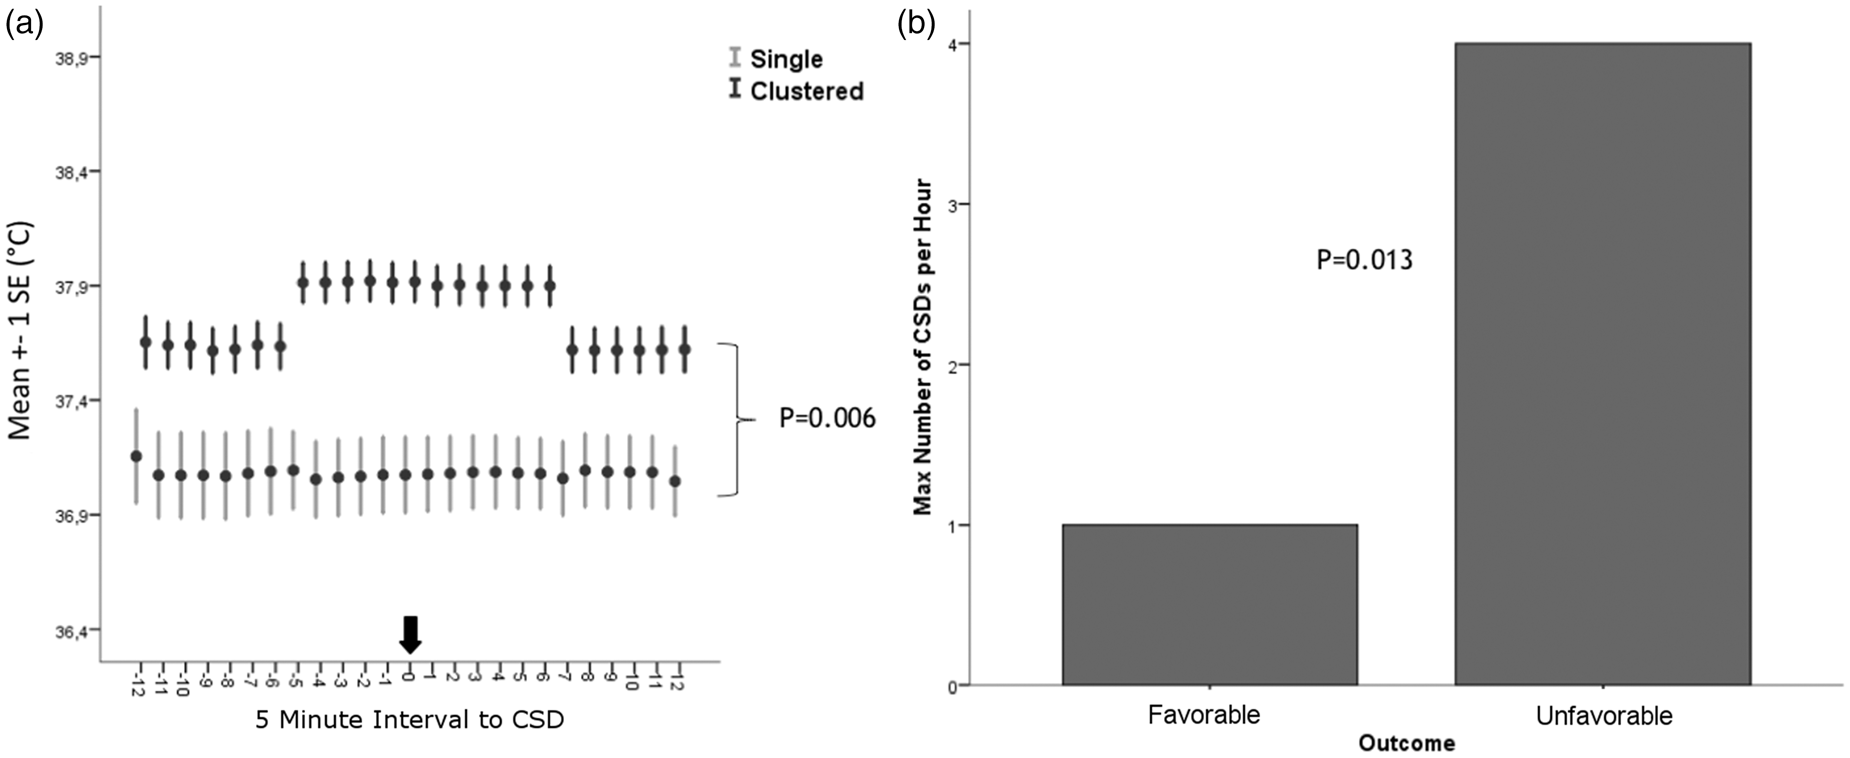
Hematoma evacuation and subdural strip electrode placement was performed within the first 48 h in 19 patients (90%). Median distance between the ECoG probe and ICP-P-Temp probe was 32 mm (19–49). During 3097 h (173 h [81–223]/patient; until maximum day 17 after hemorrhage) of ECoG monitoring, 342 SDs were detected. Fifteen percent (n = 51) of SDs occurred as clusters. Duration of spreading depression was 17 min (11–28). Antipyretic drugs (acetaminophen n = 90 [43%] and diclofenac n = 114 [57%] were administered in all patients, resulting in 11 (6–16) interventions per patient during ECoG monitoring. Higher total count of SDs (unfavorable outcome: n = 308 SDs, compared to 34 SDs in patients with favorable outcome; OR = 5.6, 95%-CI = 1.3-23 p = 0.04; GEE model adjusted for ICP and MAP) and higher SDs frequency per hour (unfavorable: 4/h vs. favorable: 1/h; p = 0.013, OR = 4.7 CI = 1.1–20; GEE model adjusted for ICP and MAP) were associated with three-month outcome (Figure 3(b)).
Brain- and body temperature
Brain- and body temperature data were available for 173 h (81–223) per patient (Figure 1(a) and (b)). Fever burdenbrain was 1.9 (0.7–4.5)℃ h/patient/day. Tcore and Tbrain at the onset of SDs were 37.3℃ (36.9–37.8) and 37.4℃ (36.7–37.9), respectively. There was a strong correlation between Tcore and Tbrain (rho = 0.9; p < 0.001). The difference between brain and body temperature (+0.13℃ higher Tbrain [−0.5;+0.3]) increased with higher brain temperatures (p < 0.001) and lower CO2 levels <37.3 mmHg (p = 0.001). The percentage of temperature ≥38.0℃ was predictive for the occurrence of SDs (Tbrain: p < 0.001; OR = 1.2 per %; Tcore: p < 0.001; OR = 1.1 per %) independent of MAP and ICP. Fever burdenbrain was higher during clusters of SDs (Tbrain: 1.9 (1.6–1.9)℃ hours) than during single SDs (Tbrain: 0℃ h (0.0–0.7)), (p = 0.001; OR = 2.0 [1.3–3.0] per ℃ h).
(a) Percentage of monitoring time ≥38℃/24 h of brain and body temperature following ICH; day 0 indicates the admission day. (b) Temperature and temperature variability after ICH; the black arrow indicates the time within 90% of patients had surgery; TBrain: brain temperature; TCore: core body temperature; ICH: spontaneous intracerebral hemorrhage. Error bars indicate one standard error of mean.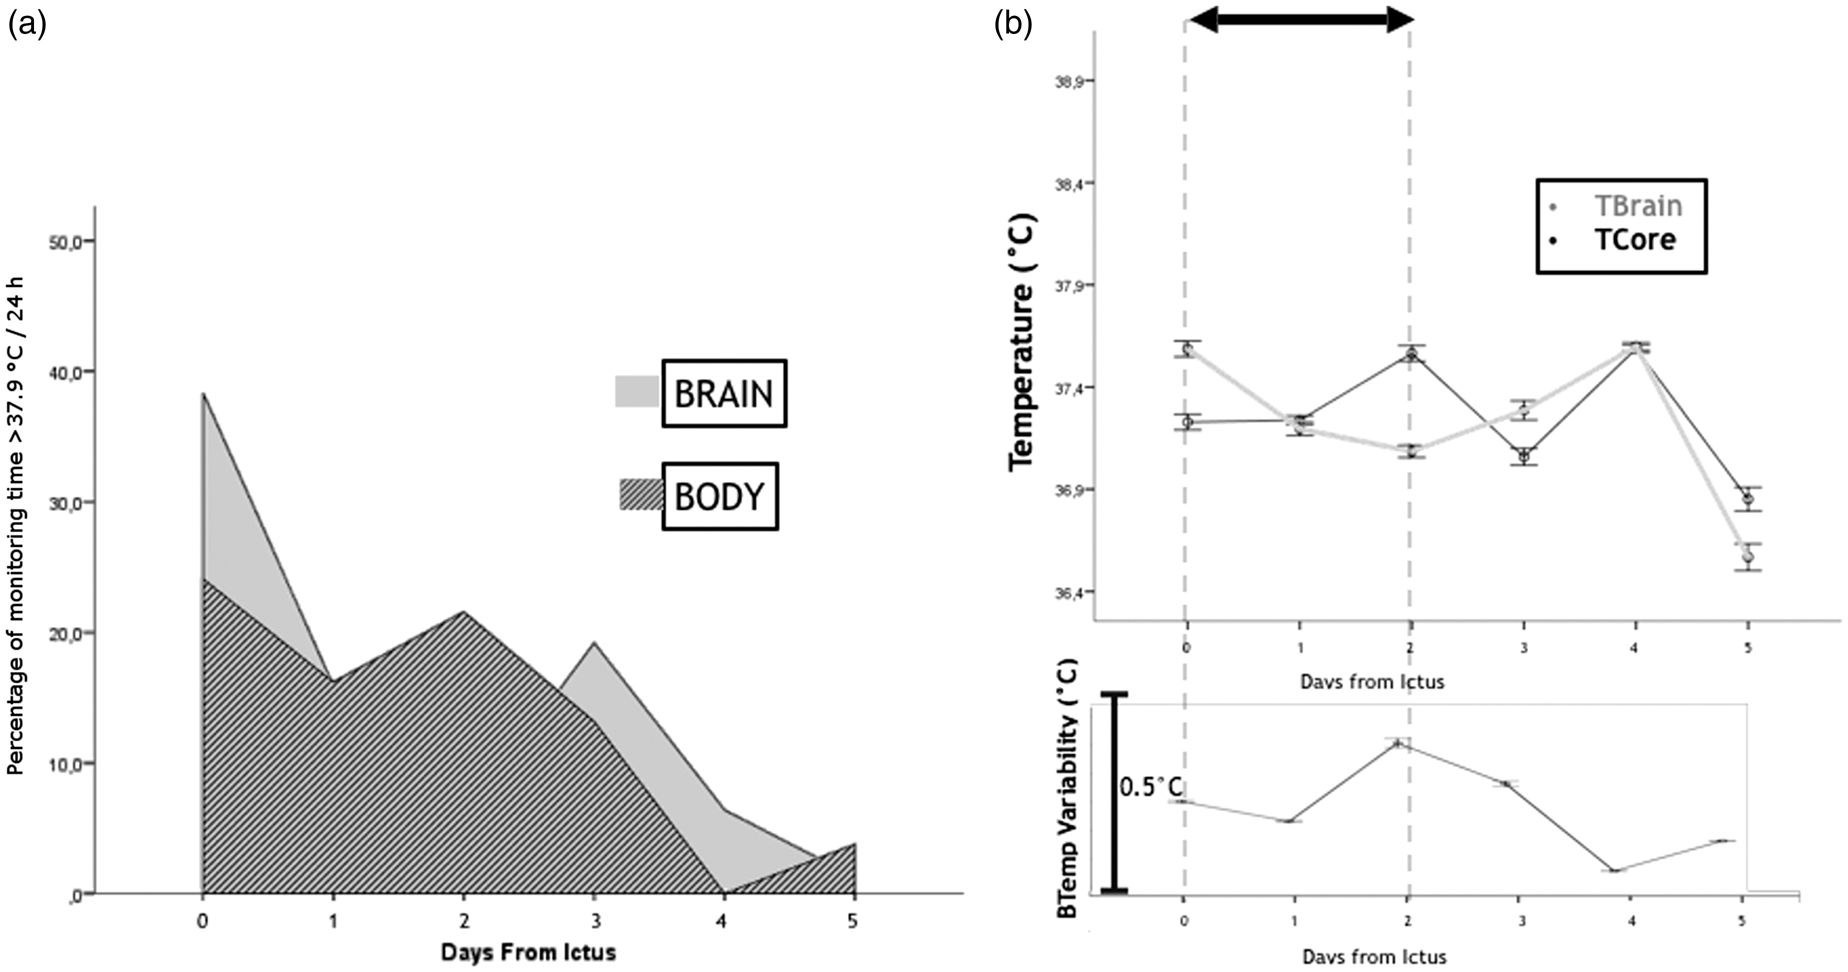
Temperature and spreading depolarizations
Tbrain but not Tcore significantly increased 25 min preceding SDs by a median of 0.2℃ (0.1–0.2; p < 0.001) and returned to baseline 35 min following SDs (Figure 2(b)). Tbrain (+0.4℃ [0.1–0.4]; p = 0.006) was higher during clusters than during single SDs (Figure 3(a)). A higher probability (OR = 36.9; CI = 36.8–37.1; p = 0.000) of developing SDs was observed during episodes of Tbrain ≥38.0℃ (23% probability), than at Tbrain ≤ 36.6℃ (9% probability; details Figure 2(a)). Tbrain ≥ 38.0℃ was predictive for the occurrence of SDs (Tbrain: p < 0.001; OR = 1.2 per %; Tcore: p < 0.001; OR = 1.1 per %) independent of MAP and ICP.
(a) A higher probability (OR = 36.9; CI = 36.8–37.1; p < 0.001) of developing SDs was observed during episodes of brain temperature ≥38.0℃ (23% probability), than at a brain temperature ≤36.6℃ (9% probability). (b) Brain temperature but not core body temperature significantly increased 25 min preceding the onset of SDs by a median of 0.2℃ (0.1–0.2; p < 0.001) and returned to baseline 35 min following SDs; SDs: spreading depolarizations; error bars indicate one standard error of mean. (a) Brain temperature (+0.4℃ [0.1–0.4]; p = 0.006) was higher during clusters (≥2 SDs/h) than during single SDs. (b) Unfavorable outcome (mRS > 3) at three months was associated with a higher SDs frequency (unfavorable: 4 SDs per hour vs. good: 1 SDs per hour; p = 0.013, OR = 4.7 CI = 1.1–20; adjusted for ICP and MAP); mRS: modified Rankin scale; SDs: spreading depolarization; error bars indicate one standard error of mean.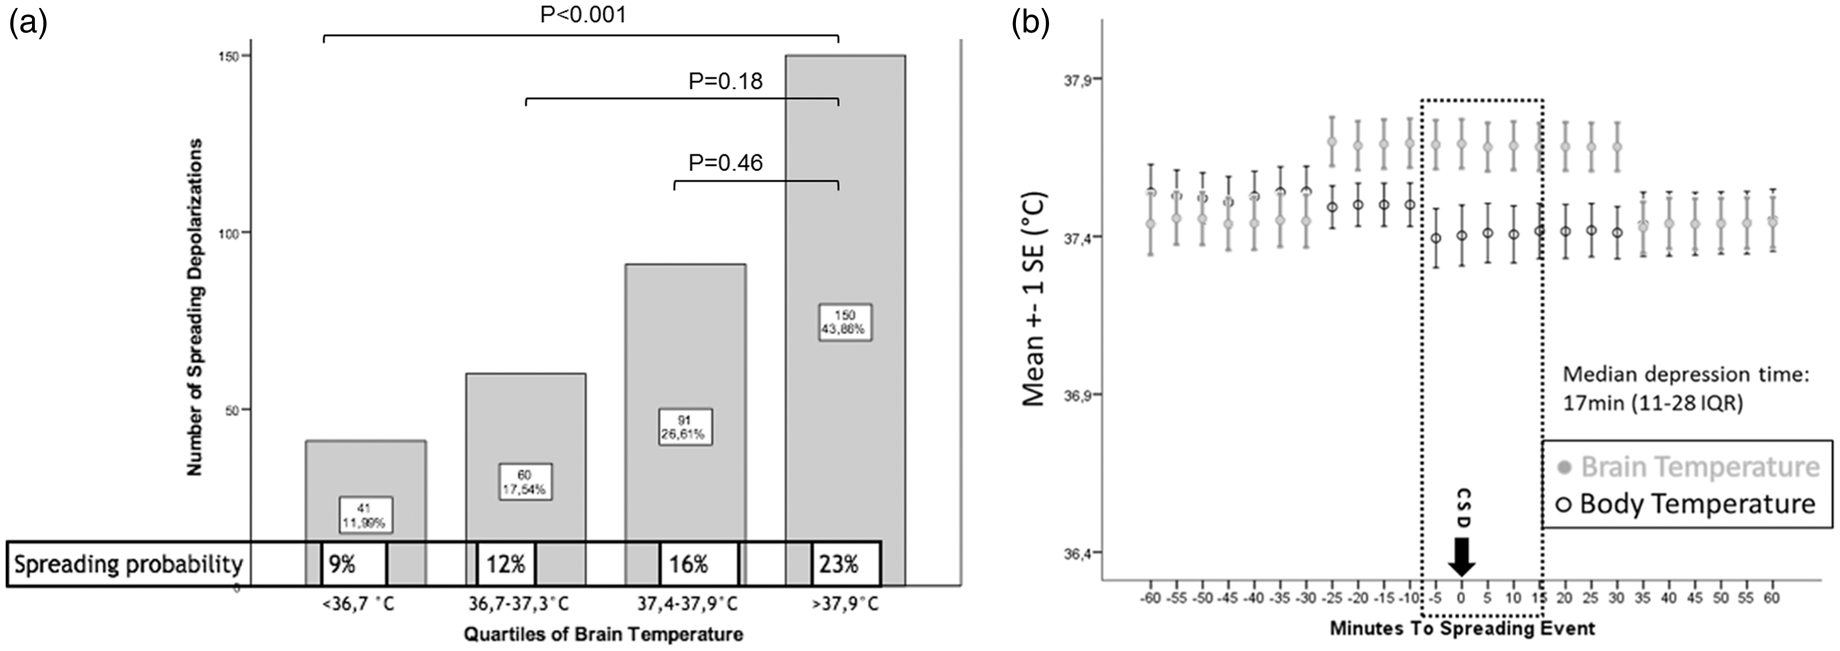
Discussion
We investigated the association between brain-, body temperature and the occurrence of SDs in a prospective study of 20 patients with ICH. The major findings of this study were (1) that the likelihood of SDs was higher during episodes of increased body temperature, (2) that an increase in Tbrain but not Tcore preceded the onset of SDs and (3) that clusters of SDs were associated with higher Tbrain compared to single SDs.
The probability of SDs was higher during fever than during normothermia. Similarly, a prospective study of 16 patients with TBI demonstrated that a body temperature >38.4℃ leads to a 3-fold higher probability of SD-occurence compared to normothermia. 19 An association between fever and SDs has been reported in experimental studies. 33 The ability of brain tissue to propagate a spreading depolarization wave is temperature dependent, whereas a decrease in temperature slows the speed of propagation by 25–30% and reduces the occurrence of repetitive spreading depolarizations. 33 In a transient middle cerebral artery occlusion study in rodents, the authors demonstrated that hyperthermic animals have far more spreading depolarizations and larger infarct volumes than hypothermic or normothermic animals. 34 While a decrease in brain temperature reduces energy demands and release of glutamate, hyperthermia increases the release of glutamate and inhibits the metabolic recovery of brain tissue. 35 Any temperature elevation increases cerebral metabolic rate of glucose (CMRGluc) and oxygen (CMRO2) leading to increased adenosine triphosphate (ATP) breakdown. 36 Persistent reduction in cerebral blood flow (CBF), brain tissue oxygen tension and rise in CMRO2 have been observed in rats following SDs. 37 Histopathologic tissue examination following human brain resection in patients with ICH demonstrated mitochondrial failure of the perihematomal tissue 72 h after hemorrhage.38,39 Under pathologic conditions following ICH, mitochondrial dysfunction and inverse vascular coupling might lead to impaired energy supply with consecutive energy supply/demand mismatch.
Recovery from SDs requires chemical energy from ATP to activate the ATP dependent ion pumps (Na+/K+ ATPase). If ATP supply is restricted, neurons will remain in the SDs state, which is increasingly toxic to the cells, eventually leading to necrosis or apoptosis. 12
Our data suggest an increase of Tbrain independently from Tcore during SDs. A mismatch between cerebral heat-production and heat outflow results in relatively higher brain temperatures. 40 CBF and metabolism are believed to be major factors of brain temperature regulation. 40 Simplified, CBF contributes to heat outflow from the white matter and therefore serves as heat exchanger. In case that CBF decreases, i.e. during spreading oligemia or ischemia, brain temperature may increase. 40
An energy supply/demand mismatch leads to loss of function of ATP-dependent membrane pumps such as the Na+/K+-ATPase, resulting in a breakdown of the transmembrane potential. 15 Ischemia following SDs has been observed in a subset of studies conducted in patients with subarachnoid hemorrhage (SAH), 16 TBI 41 and malignant hemispheric stroke. 18 Despite an increased metabolic demand following SDs, CBF decreases under pathologic conditions as a result of so called inverse neurovascular coupling, a phenomenon which has been named spreading ischemia. 16
SDs are highly metabolic active events and might influence brain temperature due to increased metabolism. Pathophysiologic concepts suggest a hypermetabolic response of the perihematomal brain tissue to ICH. 42 A PET-study of 13 ICH patients indicated increased glucose turnover in the PHE area two to four days after bleeding. 43 The regional increase in glucose utilization is thought to be due to nonischemic mechanisms, such as SDs, seizure activity, neuroinflammation or glutamate induced cytotoxicity. 43 An increase in CMRO2 following SDs has been described in animal studies indicating an altered hypermetabolic response to SDs with prolonged decreases in brain tissue oxygen tension, CBF and cerebral glucose.37,44
Similar to SDs, seizure activity also increases cerebral energy demands. A multimodal neuromonitoring study of a patient with hypoxic brain injury following cardiac arrest revealed rapid increasing brain temperature peaks lasting as long as seizure activity. 45
A case report of a patient with ICH demonstrated increased levels of excitatory aminoacids and immense cytokine release during repetitive SDs. 26 The interaction between neuroinflammation and brain temperature has been shown in an experimental study, in which focal brain cooling (14℃ brain surface temperature) decreased cytokine expression, whereas a cytokine flush was described during hyperthermia. 46
Heat production due to loss of free energy (Gibbs free energy) has been suggested in a computational model of spreading depolarizations. 47 This hypothesis is based on in vitro experiments on spreading depolarizations in retinal tissue. 48 The Gibbs energy is a thermodynamic potential that is minimized when a system reaches chemical equilibrium (e.g. loss of ATP-dependent ion pump function). 2 The physiological state, the partial depolarization of ictal epileptic activity, spreading depolarization, and death might be four fundamental Gibbs free energy states of the brain. 47
Brain temperature changes preceded the onset of the SDs. The propagation direction of the SDs relative to the ECoG strip and the spatial difference between the ECoG strip and ICP-Temp probe (Figure 4) might explain the time lag between the onset of the temperature elevations within the PHE and SDs. Considering a median distance of ∼3 cm between the ECoG strip and ICP probe and a propagation velocity of 3 mm/min, a temporal dispersion of at least 10 min may be explained.
(a) Schematic 3D Reconstruction of a patient with right frontal hematoma; (b) Note the nearest distance between the subdural ECoG strip (electrode 6) and the tip of the ICP-temp probe in the perihematomal region (b); white arrow = subdural ECoG strip; triangle = tip of the ICP-temp probe; asterix = hematoma location.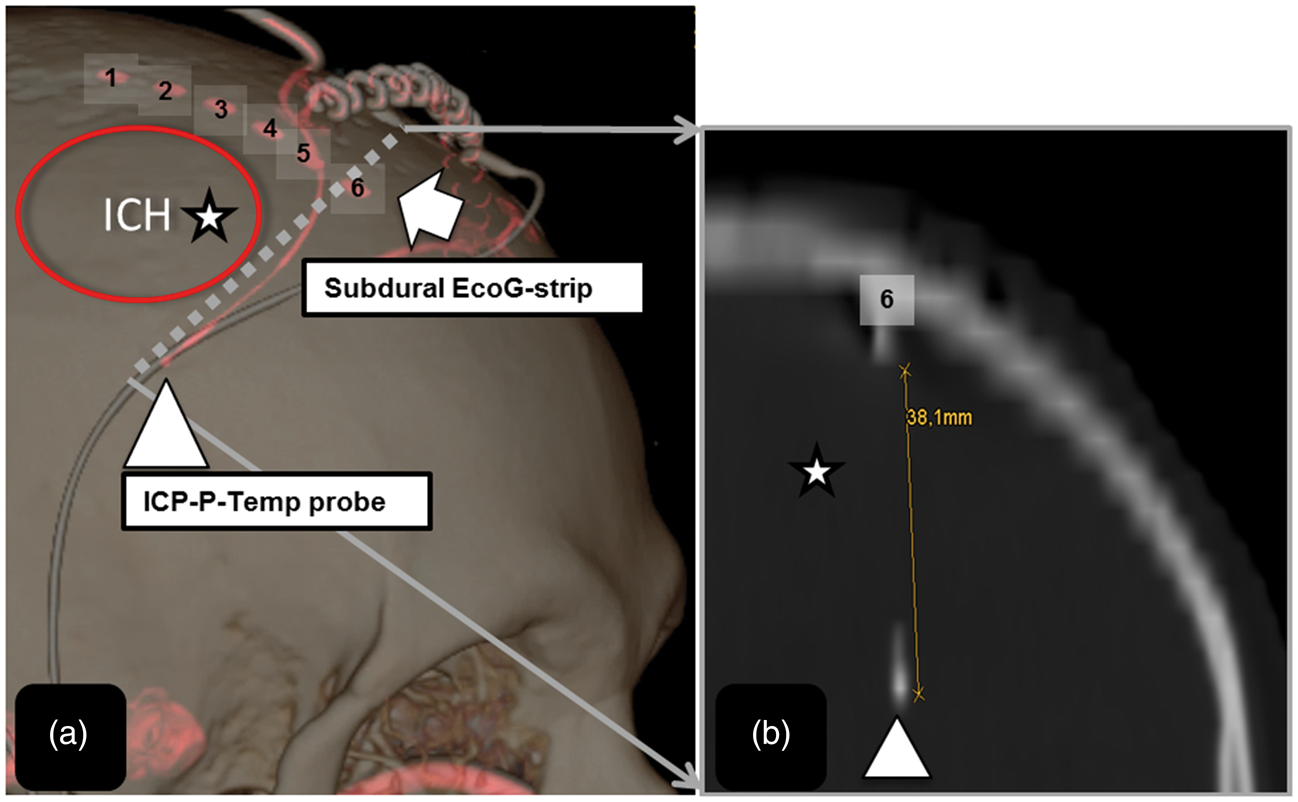
We found that repetitive SDs (clusters) were associated with higher Tbrain compared to single SDs.
Clusters have been described as potentially harmful events causing delayed cerebral infarctions following SAH. 49 In patients with ICH, the occurrence of clusters was time-linked to edema progression.10,26
Especially pre-injured brain tissue might be vulnerable to the increased metabolic demands caused by clusters.29,49,50 In SAH patients, profound changes in cerebral blood flow within the white matter were observed following spreading depolarizations. 51 Single events of spreading depolarizations were accompanied by transient hyperoxic responses and increases in cerebral blood volume, whereas clusters of recurrent spreading depolarizations were associated with prolonged hypoxic responses and a decrease in cerebral blood flow. 51 Animal data showed that there is a hyper-metabolic response to spreading depolarizations and slower return to physiological conditions in injured than in healthy brain tissue. 44 The prolonged increase in Tbrain, as observed in our study, might be explained by the prolonged depression of electrical activity. To restore the electrical activity of neurons and glia cells, increased energy demand is leading to increased metabolism.52,53
Assuming that the perihematomal brain tissue is a homogeny zone of injury, the time linked dynamics of brain temperature and spreading depolarizations are suggesting a profound change in metabolism and blood flow of the perihematomal region, which are main players in brain temperature regulation. 40
The total number of SDs per patient as well as the number of SDs per hour were associated with unfavorable outcome in this study. An association between the occurrence of SDs and outcome has been described in studies of patients with TBI 17 and SAH.29,54
Fever burden, the maximum peak of body temperature and temperature variability were highest two days following bleeding. This finding is similar to a recent study which investigated the impact of fever on outcome following ICH. 3 In this prospective study on 95 patients with ICH, fever occurred with a maximum peak during the first 48 h, whereas the survival rate was higher in patients without fever. 3 Fever as modifiable risk factor for worse outcome following ICH might further aggravate the evolvement of PHE.7,8 Currently the ongoing “Targeted temperature management after intracerebral hemorrhage” (TTM-ICH) trial (www.clinicaltrials.gov) investigates the effect of moderate hypothermia (core temperature: 32–34℃) on cerebral edema formation and functional outcome. 55
This is the first study on human brain temperature recordings during spreading depolarizations following ICH, but it does have its limitations. The results of his study might not be transferable to patients with small volume ICH. All patients had neurosurgical interventions which could have biased the course of the disease and the frequency of SDs.
Furthermore, this observational study cannot answer the question if SDs are the cause of isolated brain temperature increase or if SDs are a consequence of increased brain temperature due to increased metabolism, mitochondrial dysfunction or inflammatory changes in the perihemorrhagic zone.
However, our study gives further insight into the manifold pathophysiological mechanisms of brain temperature regulation, which may help improving further treatment strategies against edema formation following ICH.
Conclusion
Spreading depolarizations – and in particular clusters of SDs – may influence brain thermodynamics following ICH. Prevention of fever and integration of advanced neuromonitoring techniques in future TTM trials may help to further understand the effects of therapeutic hypothermia on a cellular level.
Footnotes
Funding
The author(s) disclosed receipt of the following financial support for the research, authorship, and/or publication of this article: The study was supported by a grant of the Austrian National Bank (OeNB-Nr.: 14082).
Acknowledgements
We thank Georg Kemmler, PD, for advice on statistical analysis. Further, we thank the nursing staff, the physicians of our neurointensive care unit and Honorata Donnermaier for their overall support of this study.
Declaration of conflicting interests
The author(s) declared no potential conflicts of interest with respect to the research, authorship, and/or publication of this article.
Authors’ contributions
AS was involved in the acquisition of data, ECoG setup, statistical analysis, interpretation of data, study design, writing and manuscript drafting. RH was involved in the study design, interpretation of data, statistical analysis, manuscript writing and drafting, and final revision of the manuscript. MK and MG contributed to acquisition of data, ECoG setup, interpretation of data, and manuscript drafting. ES, RB, BP, IU, GB, PL, and PR, EG participated in the acquisition and interpretation of data and radiologic gradings. MM, MO and CT were involved in the study design and data acquisition. WH was involved in study design, data processing, and statistical analysis.