
Abstract
Changes in the ability of substances to diffuse in the intersticial space of the brain are important factors in the pathophysiology of cerebrovascular diseases. Extracellular space (ECS) volume fraction α (α = ECS volume/total tissue volume), tortuosity λ (λ2 = free diffusion coefficient/apparent diffusion coefficient), and nonspecific uptake (k′) − three diffusion parameters of brain tissue were studied in cortex and subcortical white matter (WM) of the developing rat during anoxia. Changes were compared with the rise in extracellular potassium concentration ([K+]e), extracellular pH (pHe) shifts, and anoxic depolarization (AD). Diffusion parameters were determined from extracellular concentration–time profiles of tetramethylammonium (TMA+) or tetraethylammonium (TEA+). TMA+, TEA+, K+, and pH changes were measured using ion-selective microelectrodes. In the cortex and WM of animals at 4–12 postnatal days (P4–P12), the volume fraction, α, is larger than that of animals at ≥P21. Anoxia evoked by cardiac arrest brought about a typical rise in [K+]e to ∼60–70 mM AD of 25–30 mV, decrease in α, increase in λ, and increase in k′. At P4–P6, α decreased from ∼0.43 to 0.05 in cortical layer V and from ∼0.45 to 0.5 in WM. Tortuosity, λ, increased in the cortex from 1.50 to 2.12 and in WM from ∼1.48 to 2.08. At P10–P12 and at P21–P23, when α in normoxic rats is lower than at P4–P6 by ∼25 and 50%, respectively, the final changes in values of α and A evoked by anoxia were not significantly different from those in P4–P6. However, the younger the animal, the longer the time course of the changes. On P4–P6 final changes in α, λ, and k′ in cortex and WM were reached after 37 ± 3 min and 54 ± 2 min; on P10–P12, after 24 ± 2 and 27 ± 3 min; and on P21–P23 at 15 ± 1 and 17 ± 3 min, respectively (mean ± SE, n = 6). The time course of the changes was longer in WM than in gray matter (GM), particularly during the first postnatal week, i.e., in the period during which WM is largely unmyelinated. Changes in diffusion parameters occurred in three phases. The first slow and second fast changes occurred simultaneously with the rise in [K+]e and AD. Peaks in [K+]e and AD were reached simultaneously; the younger the animal, the longer the time course of the changes. The third phase outlasted the rise in [K+]e and AD by 10–15 min and correlated with the acid shift in pHe. Linear regression analysis revealed a positive correlation between the normoxic size of the ECS volume and the time course of the changes. Slower changes in ECS volume fraction and tortuosity in nervous tissue during development can contribute to slower impairment of signal transmission, e.g., due to lower accumulation of ions and neuroactive substances released from cells and their better diffusion from the hypoxic area in uncompacted ECS.
Keywords
Neuronal and glial cell swelling during an energy deficit is the consequence of transmembrane ionic shifts resulting in the intracellular accumulation of K+, Ca2+, or Na+ and accompanied by an influx of water due to osmotic imbalance (for reviews see Syková, 1983; Kimelberg and Ransom, 1986; Syková, 1992; Walz et al., 1993). Anoxia/ischemia and, to a lesser degree, hypoxia or partial ischemia result in a dramatic decrease in extracellular space (ECS) volume and a decrease in the apparent diffusion coefficient (ADC) of tetramethylammonium (TMA+) or tetraethylammonium (TEA+) (Rice and Nicholson, 1991; Lundbaek and Hansen, 1992; Syková et al., 1994b; Pérez-Pinzon et al., 1995) or ADC of water (Van der Toorn et al., 1996), apparently due to cellular swelling. It has been recognized that ECS size and geometry affect movement and accumulation of substances within the CNS. Movement of substances in the ECS by diffusion is the underlying mechanism of nonsynaptic transmission (Bach-y-Rita, 1993; Bjelke et al., 1995; Fuxe and Agnati, 1991; Nicholson and Rice, 1991; Syková, 1991, 1992). Compensatory shrinkage of the ECS during the pathological states leading to cellular swelling may further contribute to functional deficits and CNS damage. Determining changes in ECS diffusion parameters and their time course can, therefore, help to determine how and when to prevent functional deficits and irreversible damage.
Diffusion in the ECS obeys Ficks's law, subject to two important modifications (Nicholson and Phillips, 1981; Nicholson, 1993). First, diffusion in the ECS is constrained by the restricted volume of the tissue available for diffusing particles, i.e., by the extracellular volume fraction, α. Second, the free diffusion coefficient, D, is reduced by the square of the tortuosity, λ, to ADC = D/λ2, presumably because a diffusing substance encounters membrane obstructions, neuronal and glial processes, glycoproteins, and macromolecules of the extracellular matrix, and, therefore, traverses a longer path as it diffuses between two points. Besides these two geometrical constraints, diffusion of many substances in the ECS is affected by nonspecific uptake, k′, a factor describing loss of substances across cell membranes (Nicholson and Phillips, 1981). These diffusion parameters—α, λ, k′, and ADC—and their dynamic changes can be studied in vivo simultaneously using the real-time iontophoretic method, which uses ion-selective microelectrodes (ISMs) to follow the diffusion of an extracellular marker applied by iontophoresis, e.g., TEA+ or TMA+ (Nicholson and Phillips, 1981). The TMA+-method is the most versatile and convenient, since α, λ, k′ and ADC can be measured with it. Other methods are less complete and provide only relative changes in ECS volume, e.g., light scattering, (Andrew and MacVicar, 1994), measurements of tissue resistance (Van Harreveld et al., 1971; Korf et al., 1988), changes in the ADC of water, ADCW measured by diffusion-weighted (DW) nuclear magnetic resonance (NMR) (Benveniste et al., 1992, Van der Toorn et al., 1996), or ADCs and λ of dextrans tagged with fluorescent dye and followed by optical imaging (Nicholson and Tao, 1993). Optical methods may be used only in vitro on brain slices. Using the real-time iontophoretic method, absolute values of the ECS volume decrease, ADC decrease, tortuosity increase, and nonspecific uptake in vivo have been found to result from activity-related transmembrane ionic shifts evoked by repetitive stimulation of an afferent input (Svoboda and Syková, 1991) or during pathological situations, such as peripheral injury (Svoboda and Syková, 1991), hypernatremia (Cserr et al., 1991), seizures (Lehmenkühler and Richter, 1991), spreading depression (SD) (Nicholson et al., 1981; Hansen and Olsen, 1980), and anoxia (Lundbaek and Hansen, 1992; Syková et al., 1994b). On the other hand, blood–brain barrier (BBB) damage, cell damage, inflammation, and edema formation—important factors in the manifestation of CNS diseases—were found to result in an ECS volume increase, ADC increase, and/or tortuosity decrease (Syková et al., 1996; Šimonová et al., 1996).
Clinically, the most important conditions leading to brain cell death are those associated with cerebrovascular diseases, particularly stroke. Acute ischemic stroke remains without an effective therapy to improve outcome. An important consequence of acute ischemic stroke is a decrease in the ability of substances to diffuse into the brain. Experimentally, ischemia-induced changes in ECS diffusion parameters in vivo have, so far, been studied only in adult rats and gray matter (GM) (Hansen and Olsen, 1980; Lundbaek and Hansen, 1992; Syková et al., 1994b). It is well-known that the immature CNS is less sensitive to anoxia than is the adult nervous system. Anoxic depolarization (AD) and buildup of extracellular potassium during anoxia occur more slowly in immature rats than in adults (Mareš et al., 1976; Hansen, 1977). Our recent studies have revealed that in newborn healthy animals, ECS volume fractions in the cortex, corpus callosum, and spinal cord are large and diminish with age, while tortuosity remains unchanged (Lehmenkühler et al., 1993; Syková and Chvátal, 1993). Typical mean values of α found in animals 2–3 days old, i.e. postnatal days (P) (P2–P3) in cortical layers V and corpus callosum were 0.38 and 0.46, respectively, while at P20–21 and in adults (P90–P120), mean values for these sites were 0.22 and 0.20, respectively. Questions arise about whether anoxia-evoked changes in ECS diffusion parameters are the same in developing and adult brain, in GM and white matter (WM), and in myelinated and unmyelinated tissue; and about how these changes relate to the rise in [K+]e, fall in extracellular pH (pHe), and to the AD. In the present study, we investigated changes in ECS diffusion parameters α, λ (as calculated from ADCTMA or ADCTEA), and k′, and compared them with the rise in [K+]e and changes in pHe and AD in developing rat cortex and corpus callosum during anoxia/ischemia evoked by cardiac arrest. TMA+ or TEA+ diffusion profiles were analyzed in control medium (agar), cortical layer V, and WM (corpus callosum) in animals at P4–P23, i.e., during the period of extensive gliogenesis.
METHODS
Animal preparation
Experiments were performed on P4–P22 rat pups (Wistar strain) anesthetized with urethane (1.6–2.5 g/kg i.p.) and placed in a rat head holder. Body temperature was maintained at 36–37°C by supporting the rat on a heated, curved platform that enclosed the lower part of the body. Animals spontaneously breathed air. A hole, 2.0 mm in diameter, was made over the somatosensory neocortex in the hind limb area and the dura was carefully removed. Exposed brain tissue was bathed in warmed (37°C) artificial cerebrospinal fluid (Lehmenkühler et al., 1993). Ischemia was evoked by cardiac arrest induced by i.p. administration of 0.3–1 ml saturated MgCl2. In the majority of the experiments, an ECG was used to confirm that heart arrest occurred quickly, i.e., in 1–2 min.
All efforts were made to minimize animal suffering and to reduce the number of animals used. Experiments were performed under the inspection of the Ethical Commission of the Institute of Experimental Medicine AS CR and in accordance with the Law on Animal Protection no. 167/1993.
Measurements with K+ − and pH-sensitive microelectrodes and of direct current (DC) potentials
K+ activity and pH were measured with double-barreled K+- or pH-sensitive microelectrodes made by twisting together two glass pipettes (Fig. 1). The K+-selective barrel was filled with liquid ion exchanger (Corning 477317) or with valinomycin ionophore (Fluka 60031) and prepared by a previously-described procedure (Syková, 1992). The backfilling solution was 150 mM KCl. The second barrel was filled with 150 mM NaCl and served as the reference electrode for the K+-selective channel. Electrodes were calibrated using the fixed-interference method (Nicholson, 1993) before and after each experiment in a sequence of solutions containing 3, 6, 12, 24, 48, and 70 mM K+, with a background of either 150, 147, 141, 129, 105, or 63 mM NaCl to keep the ionic strength of the solutions constant. Calibration data were fitted to the Nikolsky equation to determine electrode slope and interference. Basically, the same procedure was adopted to prepare the double-barreled pH-sensitive microelectrodes (Syková, 1992). The pH-sensitive barrel contained liquid Hydrogen Ion Ionophore II-Cocktail A (Fluka, Buchs, Switzerland). The back-filling solution was composed of KH2PO4 40.0 mM, NaOH 23.0 mM and NaC1 15.0 mM (pH 7.0). Electrode sensitivity was tested in standard solutions, the pHs of which were 6.2, 6.4, 6.6, 6.8, 7.0, and 7.2, with backgrounds of 150 mM NaCl and 3 mM KCl.
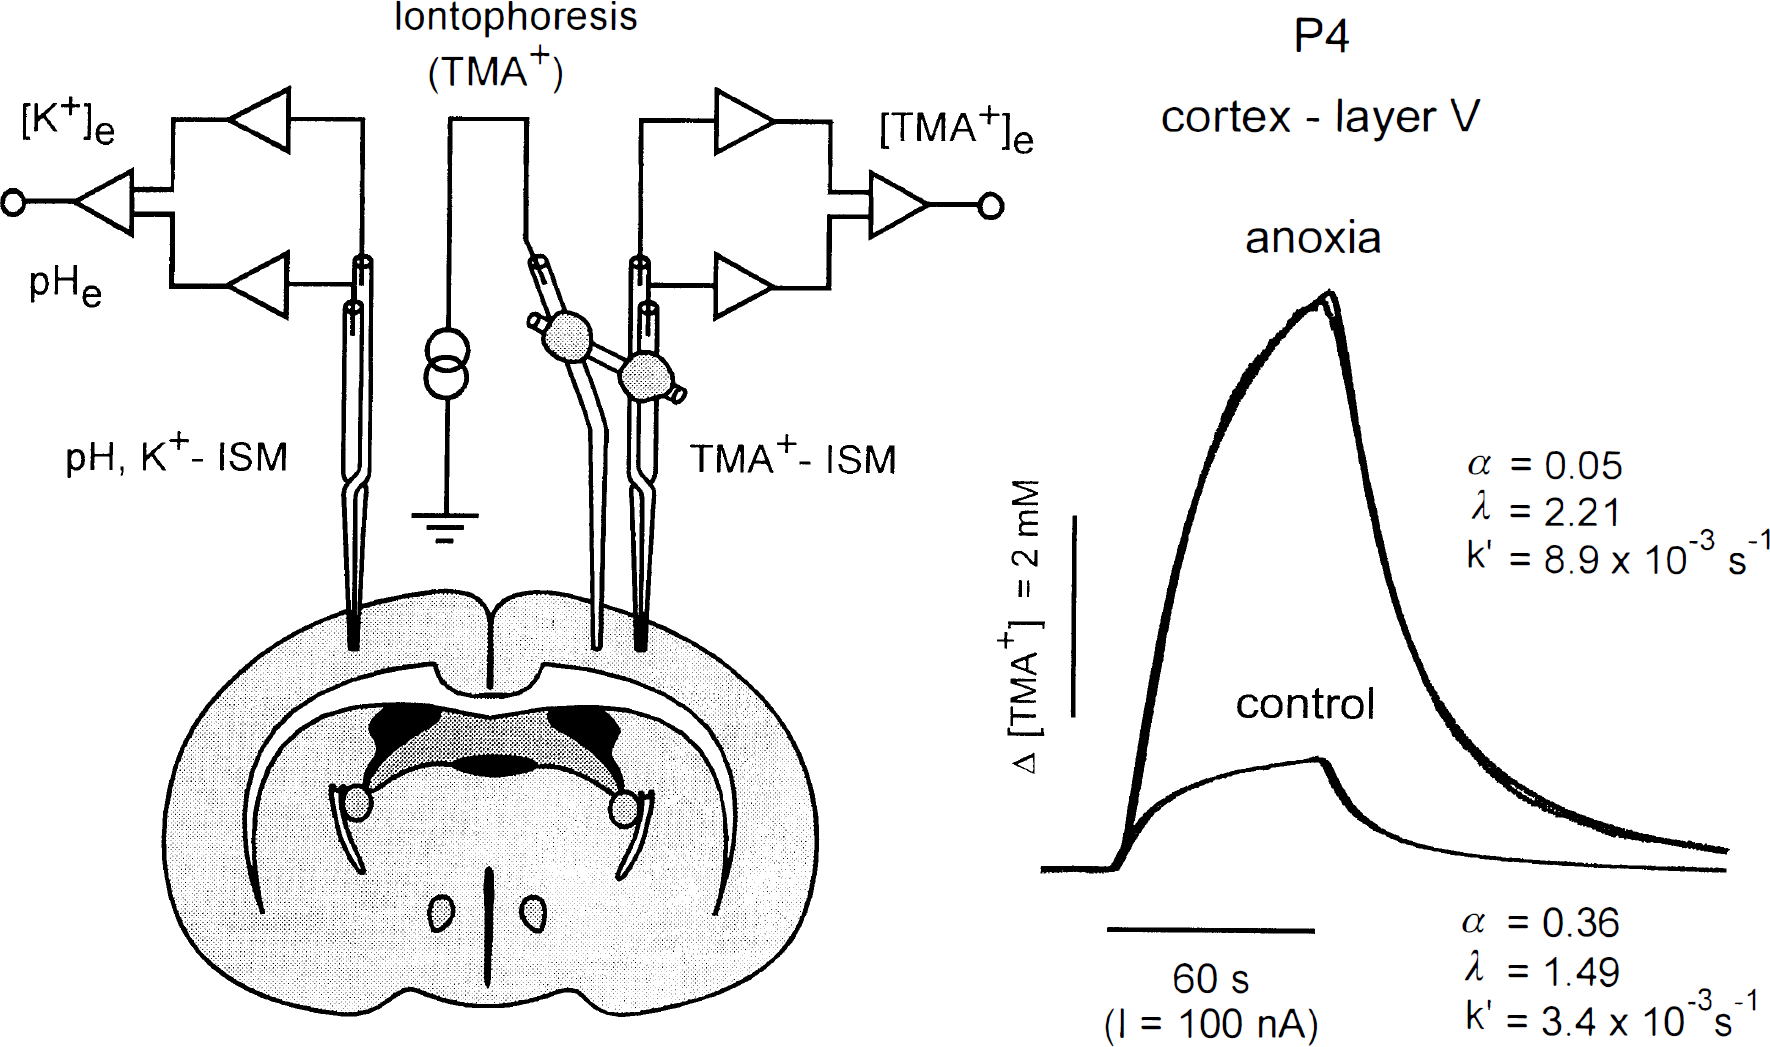
Experimental setup and TMA+ diffusion curves. Left: Schema of the experimental arrangement. TMA+-selective double-barrelled ion-selective microelectrode (ISM) was glued to a bent iontophoresis microelectrode. Separation between electrode tips was 130–200 μm. A K+-selective or pH-sensitive double-barreled ISM was inserted into the contralateral hemisphere. Right: Typical records obtained with this setup in cortex of animal at P4 during normoxia (control) and 40 min after cardiac arrest (anoxia). In this figure, the concentration scale is linear and the theoretical diffusion curve (expression 1) is superimposed on each data curve. When the electrode array was inserted into the lamina V of the cortex and the iontophoretic main current was applied, the resulting increase in concentration was much higher after anoxia than in control, apparently due to a decrease in the ECS volume fraction (α). Separation between the ISM and iontophoresis electrode tips was 186 μm. The values of α, λ, and k′ are shown with each record. Both recordings were made in the same animal using the one microelectrode array.
DC potentials were recorded differentially between the reference barrel of either the K+- or TMA+-selective microelectrode (“active” electrode) (Fig. 1) against a reference electrode (WPI Dri-Ref ceramic electrode), which exhibits stable potential, low resistance, and very low electrolyte leakage, placed on the frontal nasal bone.
Measurements of ECS diffusion parameters
Ion-selective microelectrodes were used to measure diffusion parameters in ECS of two different-sized substances: TEA+ (Mr = 130 Da) and TMA+ (Mr = 74 Da). The uptake k′ of these two ions may be different, as was suggested in previous studies (e.g., Jing et al., 1994). A TEA+- or TMA+-selective microelectrode was prepared in the same way as were the K+-selective ones; the ion-exchanger was Corning 477317, but the ion-sensing barrel was back-filled with 100 mM TEA-chloride or TMA-chloride. Electrodes were calibrated using the fixed-interference method before and after each experiment in a sequence of solutions of 150 mM NaCl + 3 mM KCl, with the addition of the following concentrations (in mM) of TEA- or TMA-chloride:0.0003, 0.001, 0.003, 0.01, 0.03, 0.1, 0.3, 1.0, 3.0, and 10.0.
For diffusion measurements, iontophoresis pipettes were prepared from theta glass (Clark Electrochemical Instruments, Pangbourne, England). The shank was bent before back-filling with 1 M TEA- or TMA-chloride, so that it could be aligned parallel to that of the ion-selective microelectrode. Electrode arrays were made by gluing together an iontophoresis pipette and an ion-selective microelectrode with a tip separation of 130–200 μm (Fig. 1). Typical iontophoresis parameters were + 20 nA bias current (continuously applied to maintain a constant transport number), with a + 100 nA current step of 80 s duration to generate the diffusion curve.
Potentials recorded on the reference barrel of the ISM were subtracted from the ion-selective barrel voltage measurements by means of buffer and subtraction amplifiers. TMA+ diffusion curves were captured on a digital oscilloscope (Nicolet 310) and then transferred to a PC-compatible, 486 computer on which they were analyzed by fitting the data to a solution of the diffusion equation (see below) using the program VOLTORO (C. Nicholson, unpublished data).
TEA+ or TMA+ concentration versus time curves were first recorded in 0.3% agar gel (Difco, Special Noble Agar, Detroit, MI, U.S.A.) made up in 150 mM NaCl, 3 mM KCl, and 0.3 mM TMA+ in a Lucite cup that could be placed just above the brain. The array of electrodes was then lowered into the cortex to appropriate depths to coincide with the known distribution of layer V and corpus callosum (Lehmenkthler et al., 1993).
Diffusion curves obtained from the cortex or corpus callosum were analyzed to yield α, λ, and nonspecific, concentration-dependent uptake, k′ (s–1). These three parameters were extracted by a nonlinear curve-fitting simplex algorithm operating on the diffusion curve described by Eq. 1, which represents the behavior of TEA+ or TMA+, assuming that it spreads out with spherical symmetry, when the iontophoresis current is applied for duration S. In this expression, C is the concentration of the ion at time t and distance r. The equation governing the diffusion in brain tissue is
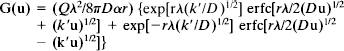
where C = G(t) and t < S (for the rising phase of the curve) and C = G(t) − G(t − S) and t > S (for the falling phase of the curve). The function G(u) is evaluated by substituting t or t − S for u (Nicholson and Phillips, 1981). The quantity of TMA+ or TEA+ delivered to the tissue per second is Q = In/zF, where I is the step increase in current applied to the iontophoresis electrode, n is the transport number, z is the number of charges associated with the substance iontophoresed (+1 here), and F is Faraday's electrochemical equivalent. The function “erfc” is the complementary error function. When the experimental medium is agar, by definition, α = 1 = λ and k′ = 0, and the parameters n and D are extracted by the curve fitting. Knowing n and D, the parameters α, λ, and k′ can be obtained when the experiment is repeated in the brain.
Statistical analysis
Results of the experiments were expressed as the mean ± SE. Statistical analysis of the differences between groups was evaluated by using a Mann-Whitney statistical test. Values of p < 0.05 were considered significant.
RESULTS
For measurements in the cortex, recording microelectrodes were positioned in the hind limb area of the somatosensory neocortex in layer V (inner pyramidal layer), which contains large pyramidal cells. For measurements in WM, microelectrodes were positioned in the corpus callosum below this cortical area, in parallel to corpus callosum axon fibers (Fig. 1). In our previous study, the dimensions of cortical layers and WM were measured in each of the postnatal stages in cryostat sections from unfixed rat brains rapidly frozen in −70°C isopentane (Lehmenkühler et al., 1993). In this study, the location of electrode penetration was confirmed in selected histological sections, as described previously (Lehmenkühler et al., 1993), and the cytoarchitecture at this location was compared with that in rat brain atlases (Paxinos et al., 1991; Zilles, 1985).
Changes in ECS diffusion parameters in GM and WM
Table 1 shows the average ECS volume fraction, α, tortuosity, λ, and nonspecific TMA+ uptake, k′, in rats at P4–P6, P10–P12, and P21–P23 before being subjected to anoxia. Values of α in cortical layer V, as well as in WM, diminished with age, but λ stayed constant (see also Lehmenkühler et al., 1993). In the present study, more careful analysis revealed that k′ increases with age.
ECS diffusion parameters in normoxic and anoxic rats as a function of age in cortical layer V (GM) and subcortical WM
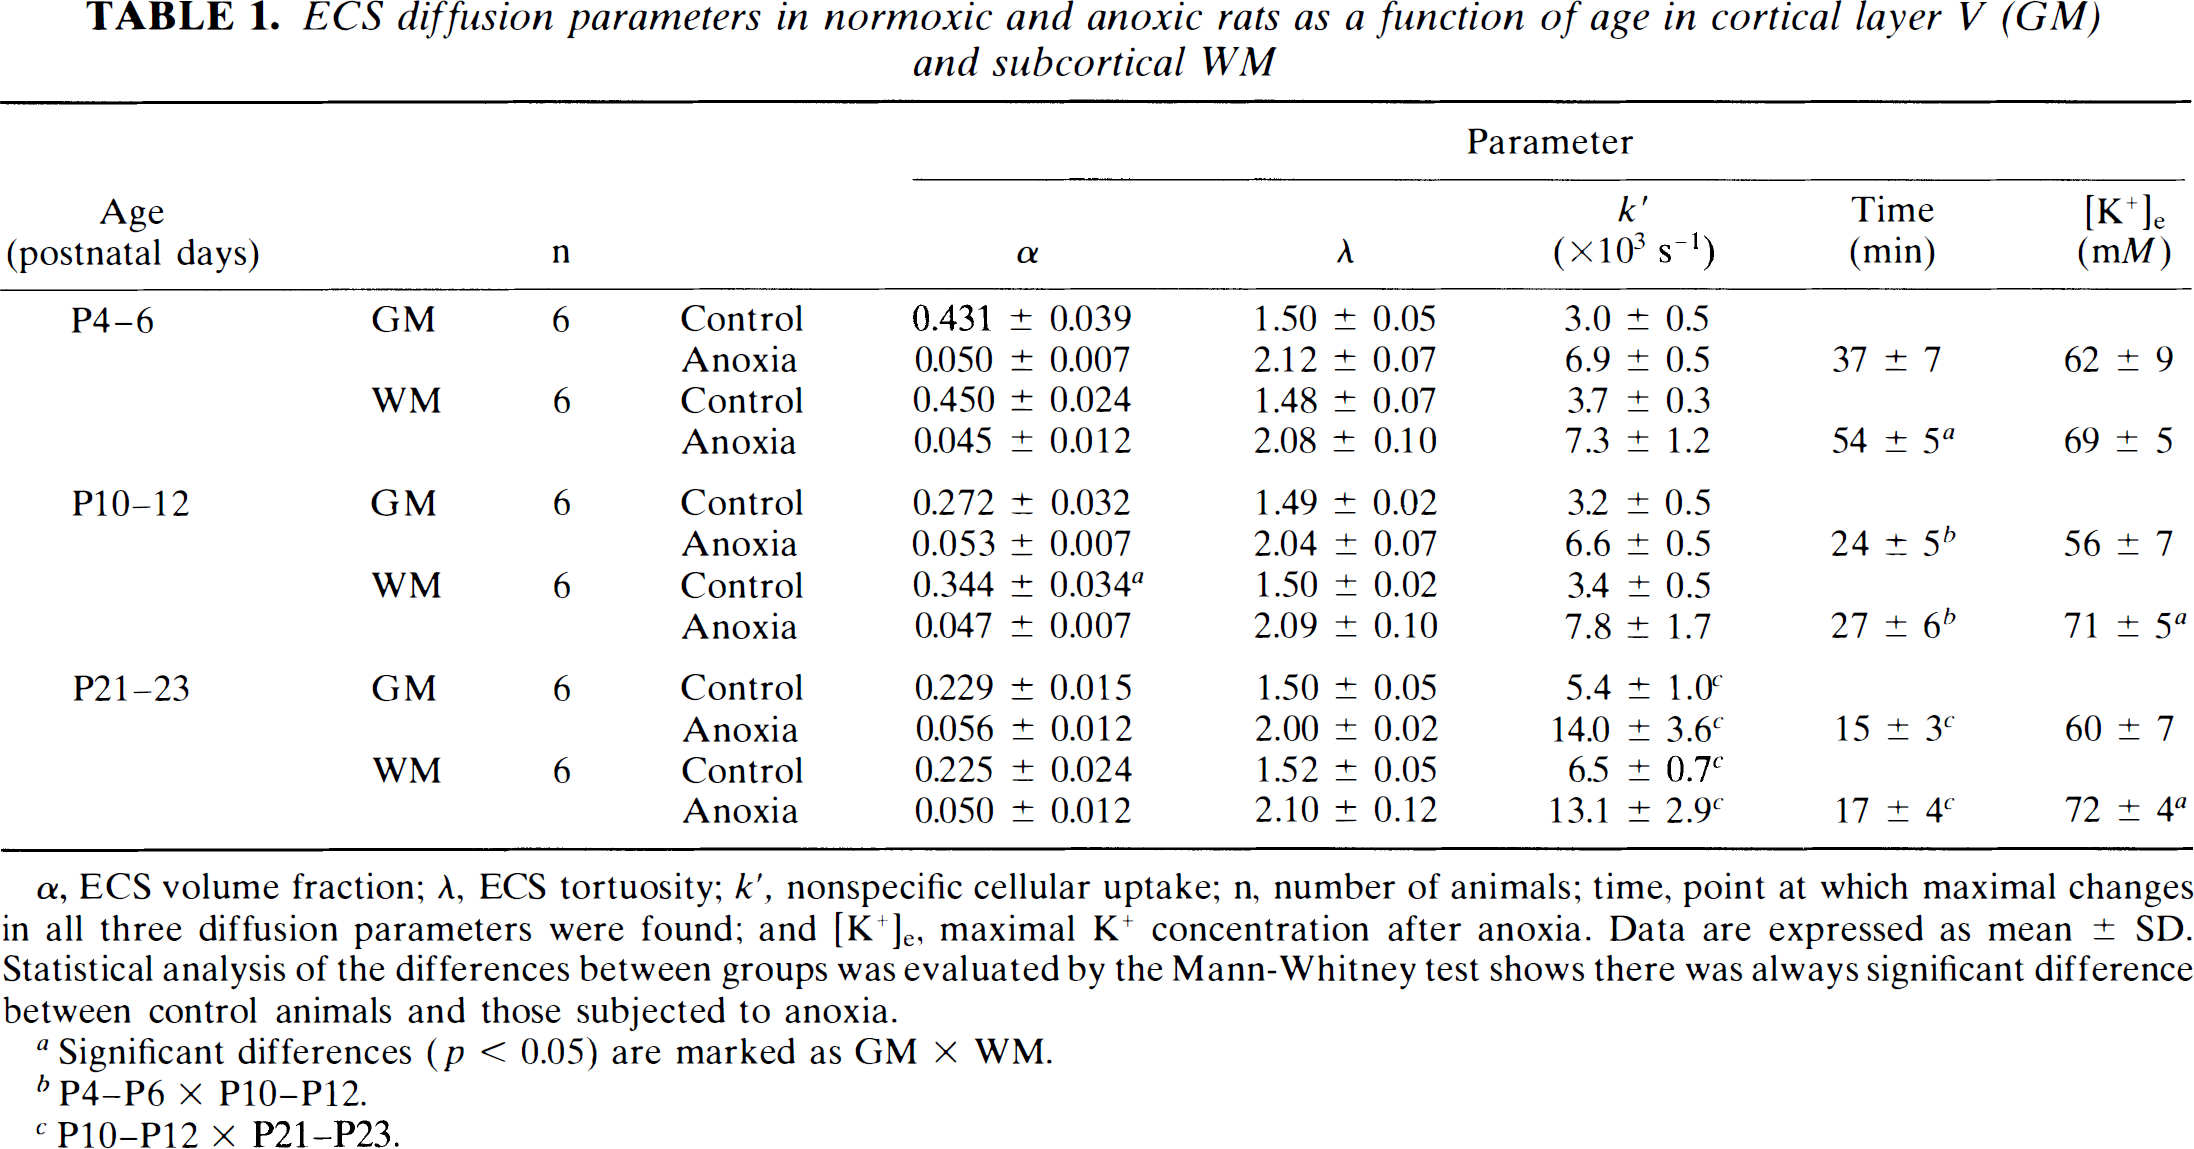
α, ECS volume fraction; λ, ECS tortuosity; k′, nonspecific cellular uptake; n, number of animals; time, point at which maximal changes in all three diffusion parameters were found; and [K+]e, maximal K+ concentration after anoxia. Data are expressed as mean ± SD. Statistical analysis of the differences between groups was evaluated by the Mann-Whitney test shows there was always significant difference between control animals and those subjected to anoxia.
Significant differences (p < 0.05) are marked as GM × WM.
P4–P6 × P10–P12.
P10–P12 × P21–P23.
A substantial decrease in α, an increase in λ, and an increase in k′ started in all age groups 1–2 min after i.p. injection of MgCl2 and gradually reached maximum values, which then remained constant. The volume fraction ultimately decreased to 0.045–0.056 and tortuosity increased to 2.00–2.12 (Table 1). Figure 1 shows a typical TMA+ diffusion curve before and after anoxia recorded in layer V of an animal at P4 (note that the diffusion curves are “normalized”, i.e., referenced to the same baseline). Table 1 shows that the final values of α and λ after cardiac arrest were not significantly different in the three age groups studied in either GM or WM. These results show that the final values of both α and λ are independent of the values of the volume fraction before anoxia.
The time course of the changes in the ECS diffusion parameters during anoxia was significantly different in the three age groups. First, at P4–P6, changes were significantly slower in unmyelinated WM than in GM (Fig. 2). Second, the older the animals, the faster the changes (Table 1, Fig. 2). Figures 3 and 4 show the time course of the changes. TMA+ or TEA+ diffusion curves recorded at ∼5-minute intervals are superimposed on changes in the TMA+ or TEA+ baseline. Diffusion measurements require a stable or linearly changing TMA+ or TEA+ baseline for at least 90 s, so measurements could not be taken during the fast rise in the baseline. At P4–P6, final values were reached in cortical layer V at 37 ± 3 min, and in the unmyelinated corpus callosum WM at ∼54 ± 2 min; at P10–P12, final values were reached at only 24 ± 2 and 27 ± 3 min, respectively. At P21–P23, final values in cortex and WM were achieved at 15 ± 1 and 17 ± 3 min, respectively, suggesting that there is no statistically significant difference in the time course in GM and in already myelinated WM of these animals. In all age groups and structures, the three diffusion parameters—α, λ, and k′—changed simultaneously. Figure 5 shows the positive correlation between the size of the ECS volume, α, prior to anoxia and the time course of the changes in α, λ, and k′. Individual variations in α were found in normoxic animals of the same age; the larger the ECS volume, the longer the time course of the changes.
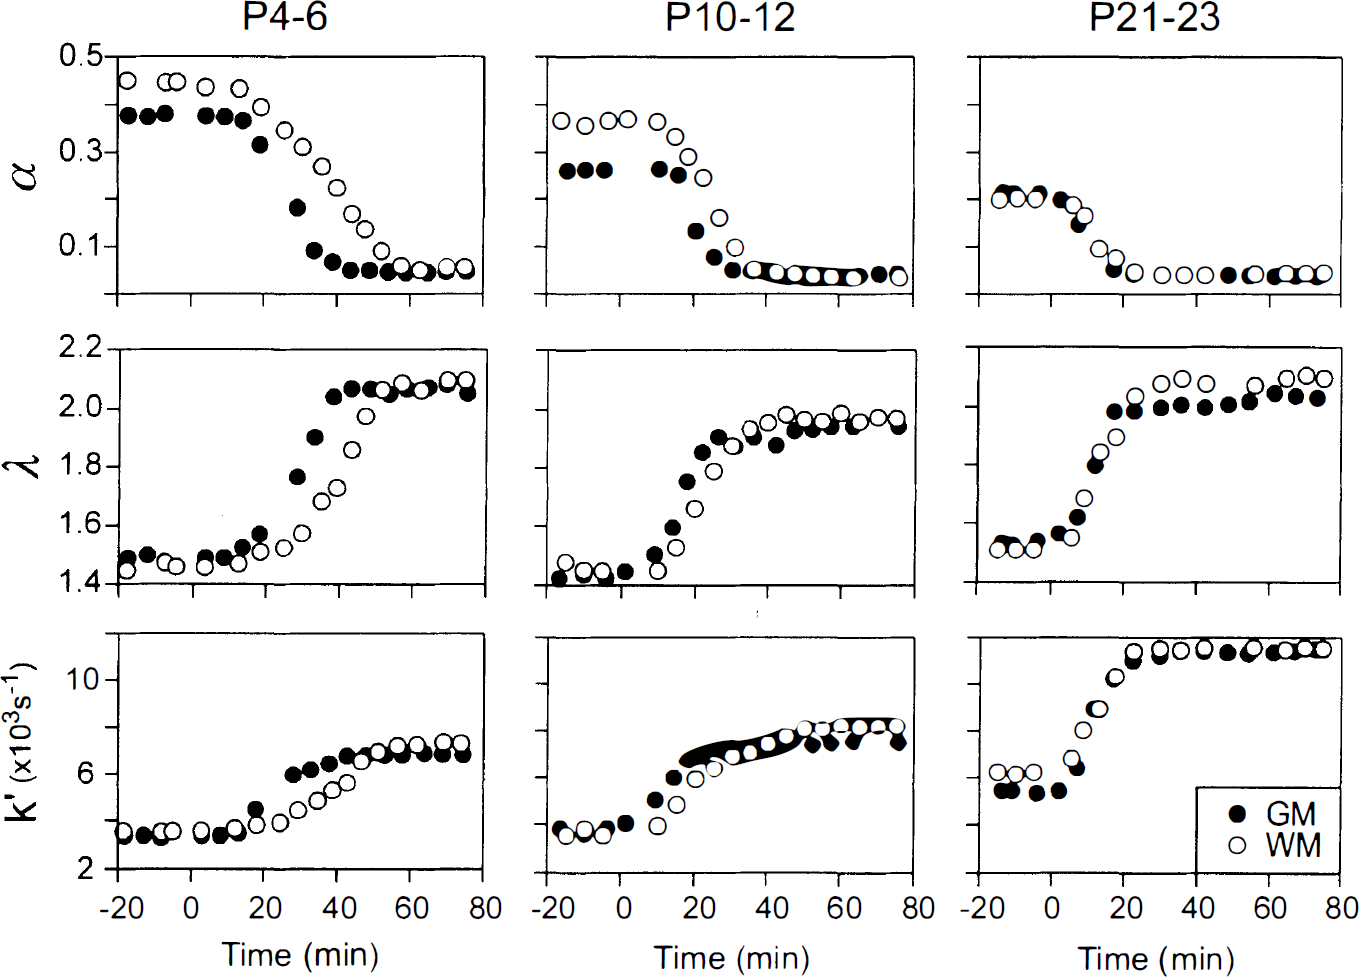
Time course of the changes in ECS diffusion parameters α, λ, and k′ in the six representative experiments in GM and WM. Measurements were done in animals at P5, P10, and P22. Note particularly the longer time course at P5 in WM compared to GM and the increase in k′ at P22.
The rise in nonspecific cellular TMA+ uptake, k′, was significantly higher in anoxic animals at P21–P23 than in anoxic animals at P4–P12 (Table 1). Whereas, after anoxia, the TMA+ diffusion curves showed complete recovery to the local TMA+ baseline at P4–P6, full recovery of diffusion curves was not achieved at P21–P23 (Fig. 3). This might be related to the fact that TMA+ uptake to cells is increased at P21–P23. In six additional experiments, we studied TEA+ diffusion parameters in layer V at P21. We found full recovery of TEA+ diffusion curves to the original baseline (Fig. 3). In these experiments, the TEA+ uptake prior to anoxia was k′ = 1.8 ± 0.4 × 10⁻³ s–1 (n = 6), and after anoxia, 4.4 ± 0.6 × 10⁻³ s–1 (n = 6), i.e., it was significantly lower than TMA+ uptake (see Table 1). This shows that after anoxia, cell membranes become more permeable to the smaller substance applied (TMA+: Mr = 74 Da) than to the larger one (TEA+: Mr = 130 Da).
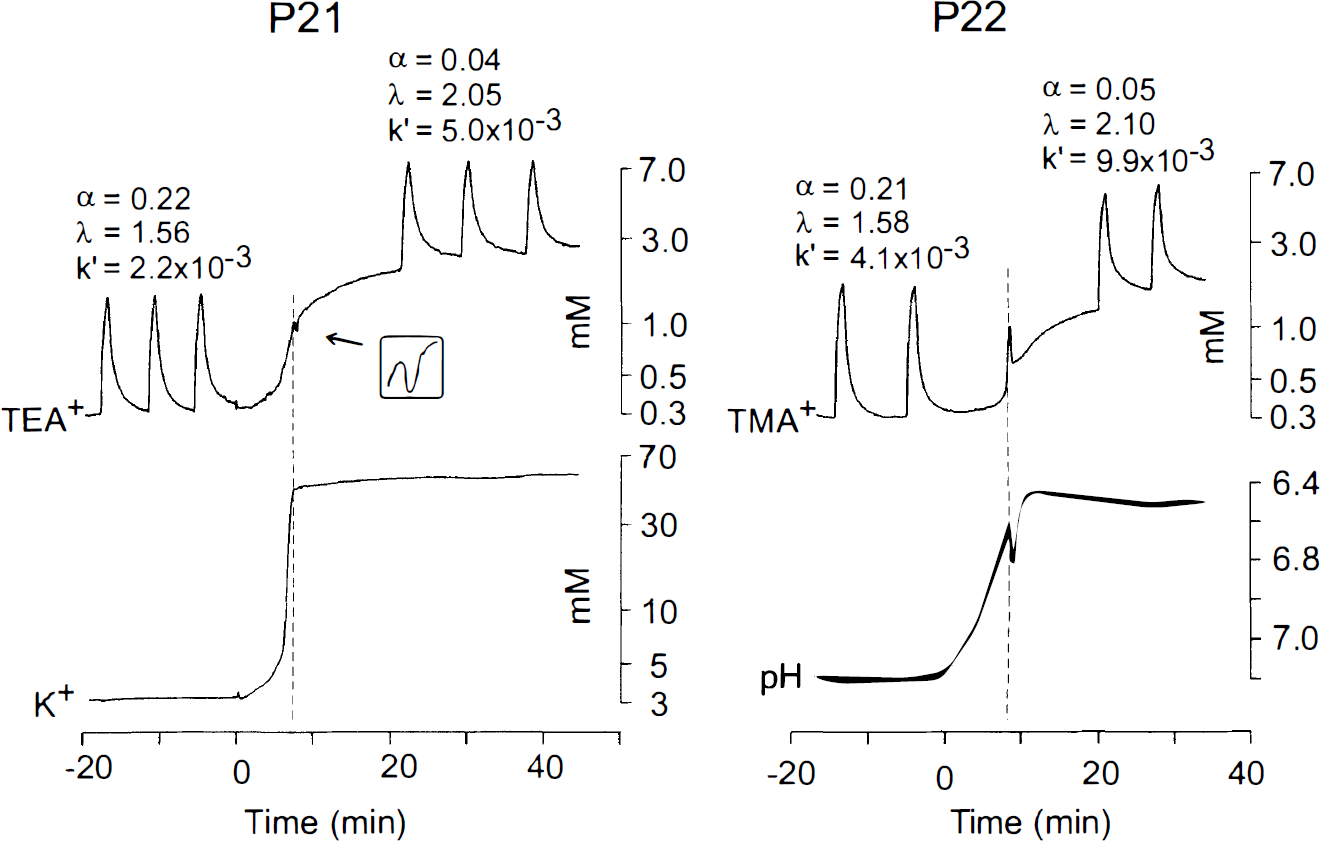
Simultaneous recordings of the changes in TEA+ or TMA+ diffusion in one hemisphere and [K+]e or pHe in the contralateral hemisphere. All recordings were done in layer V of animals at P21 (left) and P22 (right). P21: diffusion curves are superimposed on the increasing TEA+ baseline due to ECS shrinkage. Note that the ECS shrinkage outlasts the increase in [K+]e. P22: diffusion curves are superimposed on the increasing TMA+ baseline. Note that the ECS shrinkage has a time course similar to that of the changes in pHe.
Correlation of the changes in α, λ, and k′ with rise in extracellular potassium and AD
In the first series of experiments, extracellular K+ activity and AD (DC potentials) were simultaneously recorded by a double-barreled K+-selective microelectrode (DC potential recorded between reference barrel of K+-ISM and nonpolarizable reference electrode placed on the frontal nasal bone) in animals of all three age groups. Figure 6 shows the typical records at P10 and P22. The rise in [K+]e had three typical phases. The first rise, ∼1–2 mM, was correlated with a positive DC shift of 2–5 mV. After this phase, the [K+]e rose up to 20–30 mM, and this was accompanied by a negative DC shift (AD) of 4–8 mV. An abrupt and rapid rise in K+ then occurred, in all age groups, to ∼50–70 mM, with a time course similar to that of the negative DC shift of 20–25 mV (Fig. 6). Similar to the maximal changes in ECS diffusion parameters, the final values of the [K+]e changes (Table 1) and the amplitude of AD were not significantly different in the respective age groups; however, the older the animals, the faster the time course of these changes (Figs. 3, 4, and 6), as described also in previous studies (Mareš et al., 1976; Hansen, 1977). Maximal changes in [K+]e and the peak in AD in layer V (GM) and WM were reached at P4–P6 in 29 ± 2 min and 43 ± 3 min, respectively; at P10–P120 at 17 ± 1 min and 20 ± 1 min, respectively; and at P21–P23 at 5 ± 1 min and 6 ± 1 min, respectively (mean ± SE, n = 5 in each group). It is, therefore, evident that (a) the smaller the ECS size prior to anoxia, the faster the rises in [K+]e and AD and (b) the times to peaks in [K+]e and AD were significantly shorter than time to maximal changes in ECS volume and tortuosity (Table 1).
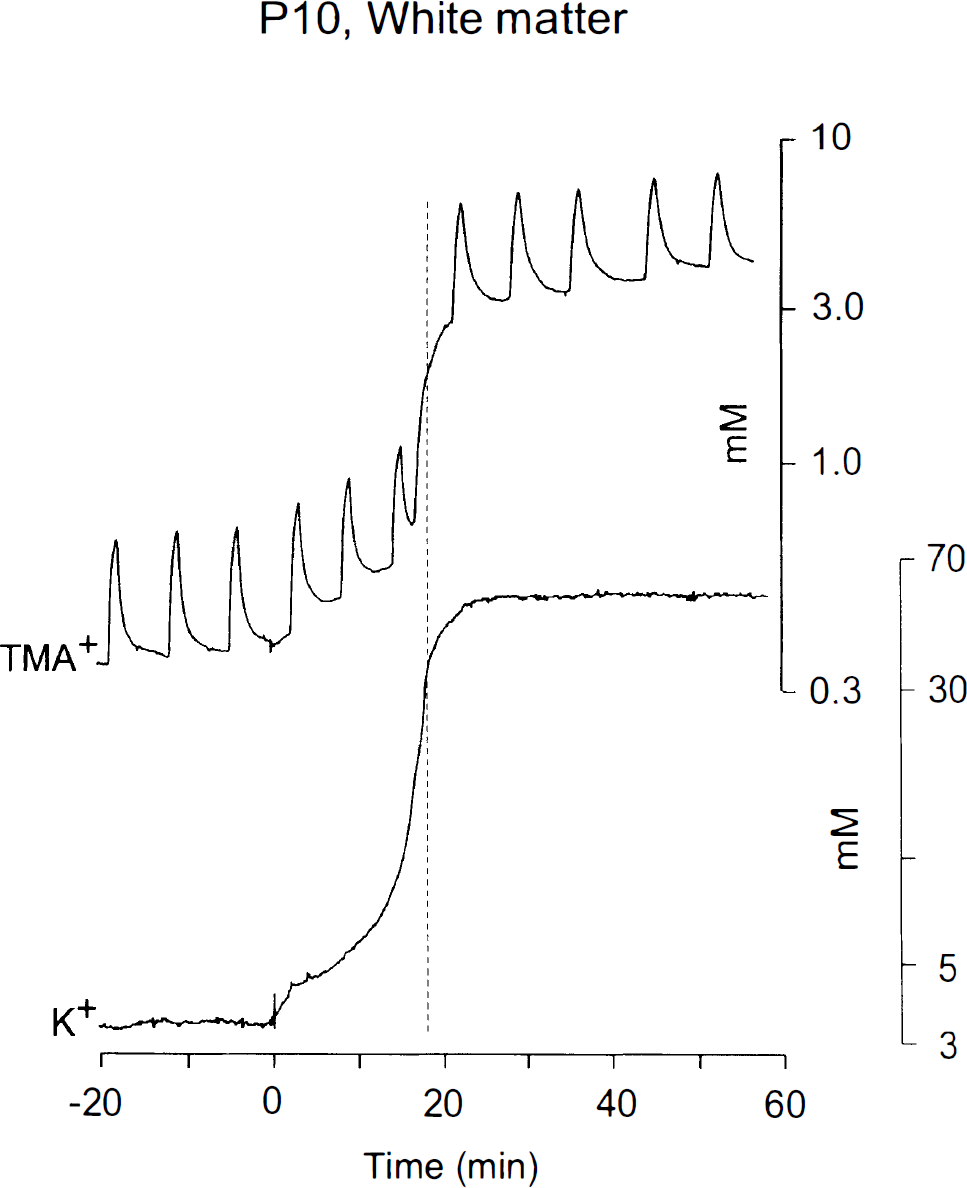
Simultaneous recordings of the changes in TMA+ diffusion in one hemisphere and [K+]e in the contralateral hemisphere. Both recordings were done in the corpus callosum of a rat at P10. Diffusion curves are superimposed on the increasing TMA+ baseline due to ECS shrinkage. Note that the ECS shrinkage outlasts the increase in [K+]e.
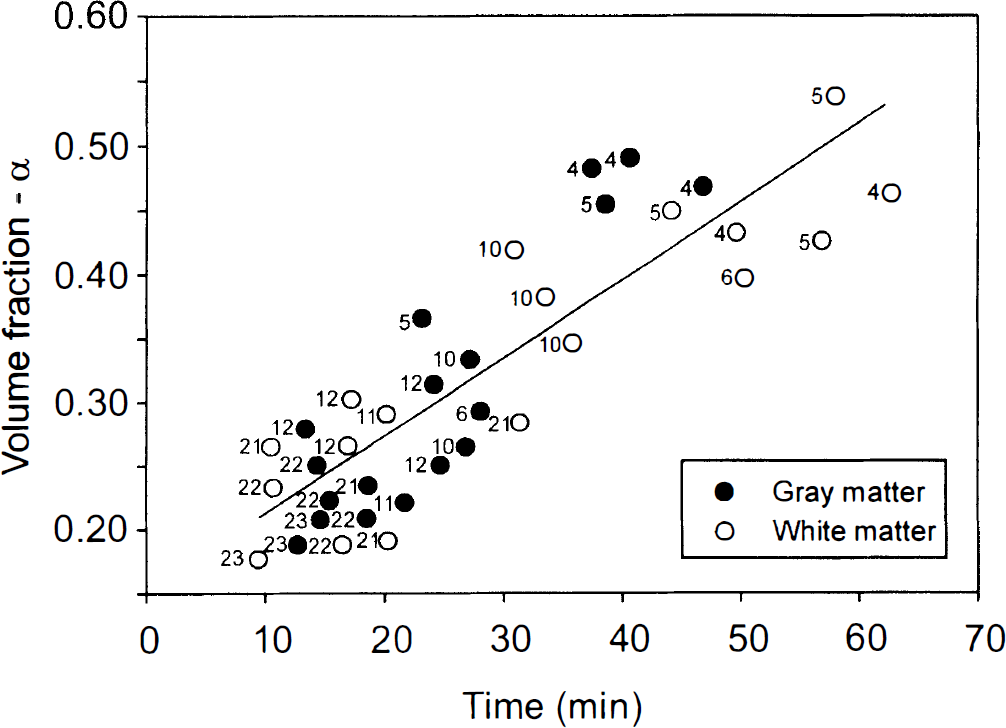
Scatter diagram with regression line of ECS volume fraction (α) plotted against time when the maximum ECS volume decrease after cardiac arrest was found. Full circles are data from GM and open circles from WM. Numbers (to the left of the circles) indicate the postnatal age of the rat. Correlation coefficient is 0.82, which is significant (p < 0.001).
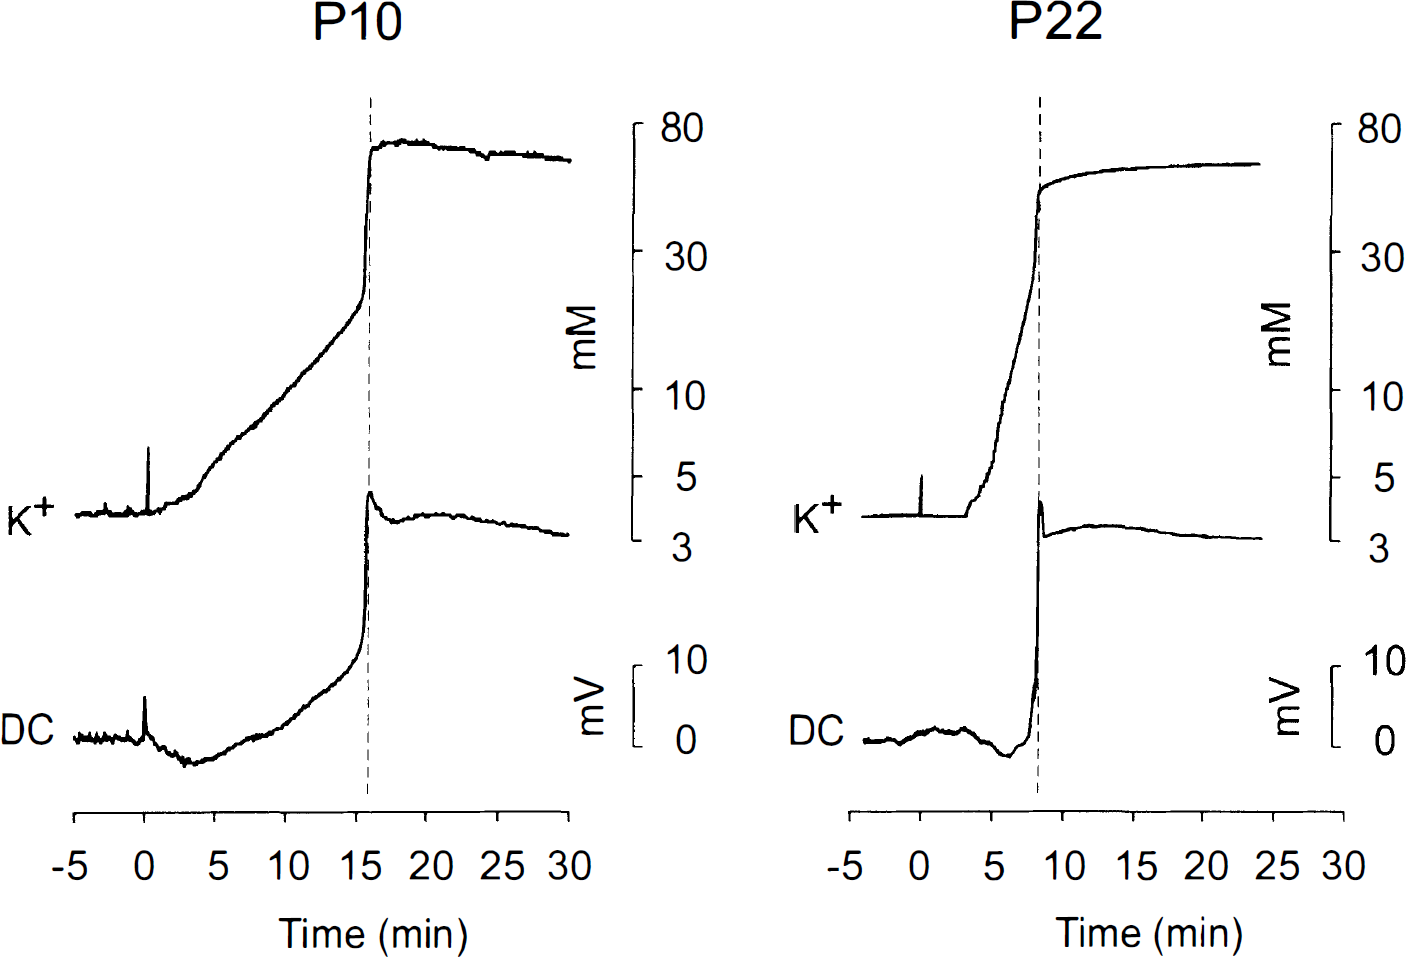
Simultaneous recording of [K+]e and AD in layer V of a rat at P10 and P22. Both [K+]e and AD recordings are from the one K+-selective microelectrode. Note that the peaks in [K+]e and in AD are reached at the same time; the time course is shorter at P22 than at P10; and after the negative peak, there is a delayed, slow AD outlasting the rise in [K+]e.
In the second series of experiments, TMA+ diffusion curves were recorded in one hemisphere and K+ activity was simultaneously recorded by the valinomycin K+-selective microelectrode inserted into the same area and depth of the contralateral hemisphere (see Figs. 3 and 4). In the third series of experiments, TMA+ diffusion curves were recorded simultaneously with DC potentials. In these experiments, DC shifts were recorded between the reference barrel of the TMA+-selective microelectrode and the reference electrode placed on the nasal bone. The TMA+ baseline started to rise and the diffusion parameters started to change with the first rise in [K+]e and during the negative DC shift. However, in all age groups, the [K+]e (as well as DC shifts) reached maximum 10–15 min before the end of the rise in the TMA+ baseline (Figs. 3 and 4) and before the maximal changes in ECS diffusion parameters. The further delayed rise in the TMA+ baseline was clearly visible as an additional rise in some animals at P10–P12, and in all animals at P20–P22, regardless of whether TMA+ or TEA+ was used (see Fig. 3). Also, this delayed rise in the TMA+ baseline was accompanied by a small and slow negative DC shift, which was not accompanied by a further rise in [K+]e (Fig. 6). Since anoxia-evoked intra- and extracellular ionic shifts (K+, Na+, and Ca+2) have very similar time courses (Xie et al., 1995), which are apparently shorter than those for TMA+ changes, it is necessary to assume that there are at least two different mechanisms responsible for the changes in ECS diffusion parameters.
Correlation of the changes in α, λ, and k′ with acid shift in pHe
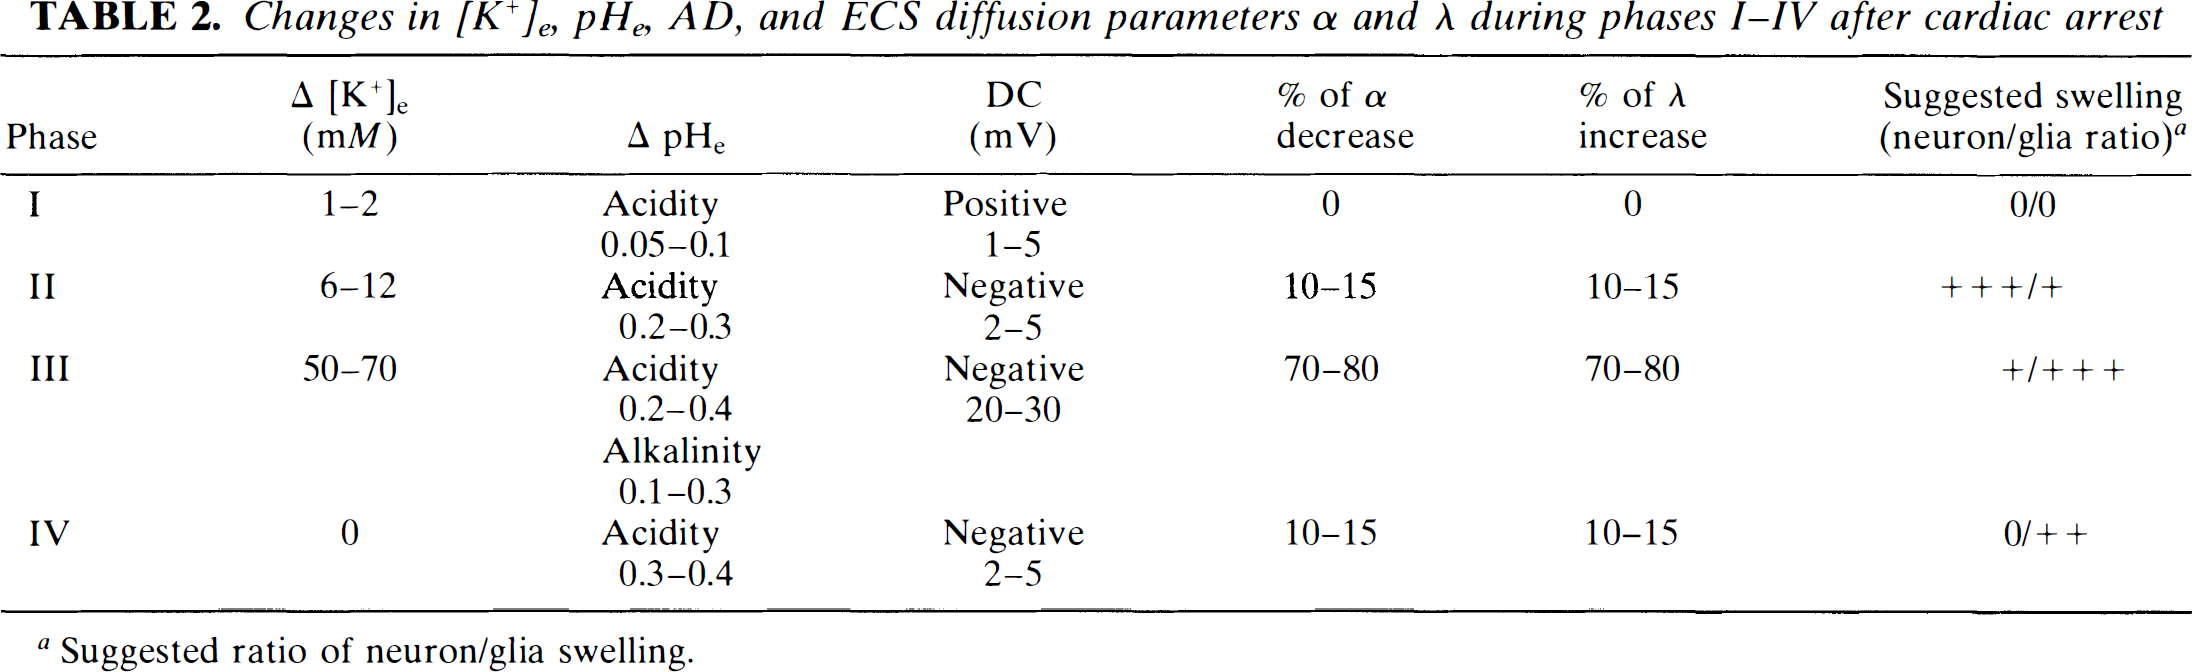
It has been previously demonstrated (e.g., Harris and Symon, 1984) that progressive anoxia results in biphasic changes in pHe. We introduced a pH-sensitive microelectrode into layer V of one hemisphere and a TMA+-microelectrode array or K+-selective microelectrode into the same area of the contralateral hemisphere. Figure 3 shows that anoxia evoked a pHe shift that had several phases. An initial small acid shift corresponded to a rise in [K+]e of 1–2 mM and a subsequent larger acid shift corresponded to a rise in [K+]e of 50–70 mM. When [K+]e was stable, pHe revealed a second acid shift of 0.3–0.5 pH units that was separated from the first one by a small alkaline shift, presumably akin to SD (for review, see Syková, 1992). Figure 3 further shows that the second acid shift was accompanied by an increase in the TMA+ baseline, indicating that this acidosis was accompanied by further cellular swelling and changes in ECS diffusion parameters. Changes were accompanied by a small AD, ∼2–5 mV (Fig. 6, Table 2), which had a time course similar to that of the acid shift and ECS volume decrease, i.e., it also outlasted the rise in [K+]e.
Changes in [K+]e, pHe, AD, and ECS diffusion parameters a and A during phases I–IV after cardiac arrest
Suggested ratio of neuron/glia swelling.
DISCUSSION
Our study revealed that the final values of ECS volume in ischemic tissue are the same in all age groups, regardless of the fact that the ECS is almost twice as large for animals in the first postnatal week than for 3-week-old animals and adults (Table 1; see also Lehmenkühler et al., 1993). However, the time course of changes in the ECS volume fraction, as well as in all other diffusion parameters studied (ADC, tortuosity, unspecific TEA+, and TMA+ uptake), was much slower in animals at P4–P6 than in more mature ones (P21–P23). The slower rise in [K+]e and AD during development was described in several other studies (Mareš et al., 1976; Hansen, 1977). Other studies have also revealed, at least in adult rats, a similar time course for rises in [K+]e, AD shift, and decreases in [Ca+2]e and [Na+]e (Xie et al., 1995). Since ECS volume and tortuosity changes undoubtedly result from cellular swelling, it can be assumed that the slower time course is related to the slower swelling of cells, presumably of both neurons and glia. The question arises of whether the slower time course of the swelling is due to slower energy depletion in immature animals (and, consequently, slower transmitter release and slower breakdown of ionic homeostasis) or to the fact that the extraordinarily large ECS slows down the accumulation of transmitters and ions and results in cellular swelling.
Mechanisms involved in the changes of the ECS diffusion parameters
As with ionic changes and AD, changes in ECS diffusion parameters have several (three–four) phases. Table 2 summarizes ECS ionic composition, volume, and geometry during phases I–IV of our experiments and suggests the ratio of neuron/glia swelling. It is, in addition to the findings in our present study, based on previous findings about neuronal and glial swelling during ischemia (for a review, see Hansen and Zeuthen, 1981; Syková, 1983; Walz et al., 1993; Siesjo, 1993; Szatkovski and Attwell, 1994; Siesjo et al., 1995). During phase I, in which we see no statistically significant change in ECS volume and geometry, we can assume that energy depletion is low, since the anaerobic metabolism is maintaining active Na+/K+ transport. The transient increase in spike activity is accompanied by a calcium-dependent K+ rise in the ECS of 1–2 mM (Walz et al., 1993), a small acid shift in pHe (see Fig. 3), normal levels of [Na+]e and [Ca+2]e (Xie et al., 1995), and a positive shift in DC signals. Previous studies revealed that neither ECS volume changes nor glial spatial buffer currents carried by K+ plays an essential role in the electrogenesis of anoxia-evoked positive DC shifts (Lehmenkühler et al., 1985). During phase II, the ECS volume decreases and tortuosity increases by 10–15%. This is apparently due to further energy depletion, which leads to a block of the Na+/K+ pump, release of K+ from neurons, entry of Na+ into neurons, increase in cytosolic Ca2+, and early transmitter (particularly glutamate and aspartate) release (Obrenovitch and Richards, 1995), the latter of which results in further Na+ and Ca2+ entry into neurons through receptor-operated channels. [K+]e is elevated by 6–12 mM and pHe shows a slow acid shift of 0.1–0.2 pH units. It is, therefore, reasonable to assume that neurons especially, and not glial cells, are swelling (see Walz et al., 1993). At phase III, the severe energy depletion results in complete loss of ionic homeostasis: [K+]e is elevated by 50–70 mM, [Na+]e and [Ca+2]e rapidly decrease (Xie et al., 1995), and pHe decreases by ∼0.5–0.6 pH units. This is accompanied by steep AD, which has a similar time course (Xie et al., 1995; Fig. 5). During this phase, glial cells are depolarized; the depolarization leads to an opening of anion (Cl– and HCO3–) channels, and this, in turn, results in passive, Donnan-mediated K+, Cl–, and HCO3– fluxes into glial cells, particularly astrocytes (for review, see Walz et al., 1993). This naturally leads to water accumulation in astrocytes at the expense of ECS, ECS volume decreases, and tortuosity increases, all with approximately the same time course (see Figs. 3, 4, and 6). In addition, neuronal and glial swelling may open the stretch-activated channels. During phase IV, degradation of macromolecules and, thus, of membrane structure, may occur due to blockage of resyntheses of polysacharides, phospholipids, and proteins and/or due to enzyme-catalyzed degradation. Swelling during this phase is not accompanied by further [K+]e, [Na+]e, or [Ca+2]e changes, but there is an additional acid shift in pHe by 0.3–0.5 pH units. The mechanism by which cells, presumably glia, swell might be extracellular acidosis due to lactate accumulation (Sjesjö, 1993) and/or accumulation of osmotically active substances due to an increased uptake (Table 1).
Although the first changes in ECS diffusion parameters had a time course similar to that of the rises in [K+]e and AD, there was a further ECS volume decrease and tortuosity increase that outlasted the rise in [K+]e and AD by 10–15 min. This was clearly visible on the records as the second increase in the TMA+ baseline (see Fig. 3), and its time course correlated with acid shift in pHe. It is not clear what the mechanism(s) of the second change can be. Besides acidosis-induced swelling, another possibility is that under severe anoxia, membranes may become permeable to larger molecules and proteins and the cells may swell due to the evoked osmotic imbalance. Another possibility is that the cells try to downregulate their volume after initial swelling by a so-called regulatory volume decrease (RVD), but after complete energy failure and dramatic changes in membrane permeability, these mechanisms are diminished and this leads to further swelling. Older animals (P21–23) in our experiments showed a higher TMA+ uptake, with incomplete recovery of TMA+ curves after anoxia, suggesting accumulation of TMA+ (74 Da) in the cells. If we used TEA+ (130 Da) iontophoresis, we obtained complete recovery of TEA+ diffusion curves, but the second phase of ECS changes, which outlasts the [K+]e rise, was still present (see Fig. 4).
Our present data are also in good agreement with those of our recent study combining TMA+ measurements and magnetic resonance imaging (MRI) studies of P8–P9 rats subjected to cardiac arrest. Dynamic changes in the apparent diffusion coefficient of water, ADCW, observed by both DW magnetic resonance spectroscopy (STEAM) and DW MRI (U-FLARE), had a biphasic behavior. A fast drop in ADCW that lasted ∼10 min corresponded to the energy failure, and the second decrease took an additional 15–20 mins. Both phases were accompanied by a decrease in ECS volume fraction and a simultaneous increase in λ (Van der Toorn et al., 1996). These studies show that the changes in the ECS volume fraction, ADC of TMA+ (or λ), or ADCW predominantly indicate cytotoxic swelling. Further studies are needed to clarify all the mechanisms leading to cytotoxic swelling and changes in ECS diffusion parameters during anoxia in the developing and adult brain.
Role of the ECS size in anoxia-evoked swelling, breakdown of ionic homeostasis, and AD
The slower time course of the changes of ECS diffusion parameters (phase I–III) and of transmembrane ionic shifts leading to a rise in [K+]e, and a fall in [Na+]i and [Ca+2]i in the developing rat brain, is apparently related to higher resistance of immature animals to anoxia due to slower energy depletion and the known role of anaerobic glycolysis (Jílek, 1966). In addition, neurons with smaller dendritic arborization and immature glial cells swell more slowly, even when exposed to the same concentration of transmitters or ions. The slower swelling of immature glia is supported by the fact that immature glial cells, e.g., in spinal cord GM, do not efficiently buffer activity-related extracellular K+ and pH changes during the first postnatal week (Jendelová and Syková, 1991; Syková et al., 1992).
It is reasonable to assume that the time course of neuronal and glial swelling resulting in an ECS volume decrease is dependent on the actual level of transmitters, ions, and osmotically active substances in the ECS. In immature animals, the release of these substances may be somewhat less or the same as in adults, and, therefore, the actual concentration of these substances in the space, which is twice as large, will be ≤50%. However, after complete energy depletion, membrane leakage, and complete breakdown of ionic and volume homeostasis, the equilibrium between the intra- and extracellular spaces would be the same for immature animals and adults, since the concentration of substances would reach the same values in a ECS shrunken to the same size (α = 0.04–0.05).
The slower time course of ionic changes, AD, and swelling in immature animals due to greater ECS volume fraction is supported by the fact that in some very young animals, in which the ECS was already smaller than average for that particular age, the time course of the ECS diffusion parameter changes was as fast as in older animals, i.e., the greater the ECS volume fraction prior to anoxia, the longer it took to reach the ultimate changes in the diffusion parameters (Fig. 5). Figure 5 shows the positive correlation between ECS volume fraction prior to anoxia and the time course of the changes of ECS diffusion parameters. These findings suggest that the original size of the ECS may influence the accumulation of ions and other substances and this ultimately leads to cellular swelling and changes in ECS diffusion parameters. It has been previously proposed that a smaller initial α may be responsible for the greater susceptibility of the hippocampal CA1 region to anoxia/ischemia and seizures than the hippocampal CA3 region or cortex (Kawasaki et al., 1990; McBain et al., 1990; Pérez-Pinzon et al., 1995). Furthermore, anoxia in brain slices perfused with a 25 mM mannitol, a compound that does not enter cells and, therefore, increases extracellular osmolarity, resulted in an increase in AD latency in hippocampus (Balestrino, 1995). These results suggest that ECS size may play an important role in the degree and time course of the accumulation of toxic substances and cellular swelling, and may, therefore, prolong tissue resistance to anoxia.
Our recent experiments on isolated rat spinal cord revealed that cellular swelling during superfusion with 50 mM K+ results in changes in ECS diffusion parameters similar to those with terminal anoxia (Syková et al., 1995). The time course of K+-induced swelling in spinal cords of animals at P21 was much faster than in animals at P10; this, in turn, was faster than in animals at P5. Our findings suggest that the larger the ECS in younger animals, the slower the K+ accumulation in ECS, the slower the swelling of cells (presumably particularly of glia), and the slower the changes in α, λ, and k′. The fact that in unmyelinated WM the time course was extremely long, even when compared with the GM of animals of the same age, suggests that cellular swelling is slower during gliogenesis. At P21–P23, when the corpus callosum is already myelinated, the time course was fast and almost the same in GM and WM.
ECS volume and AD
Previous studies have shown that the occurrence and severity of ischemic damage is related to the period of AD. Latency from the onset of ischemia to the peak of AD has been considered to be an indicator of tissue resistance against ischemic insults (Bureš and Burešová, 1957). In our study, comparison of a rise in [K+]e to >20 mM and AD revealed the same time course. It has been proposed that a failure of Na+, K+-ATPase, accompanied by a rise in [K+]e, is, by itself, sufficient to cause AD and, indeed, the application of ouabain-induced AD-like depolarization in hippocampal slices (Balestrino, 1995). However, influx of Na+ into neurons or glia leads to swelling (Rothman and Olney, 1986; Hansen and Olsen, 1980). The question is whether swelling, per se, can cause AD. In our experiments, the time course of changes in α, λ, and k′ revealed that cellular swelling in all age groups continues beyond changes in ECS ionic composition. This suggests that there may be another late mechanism that leads to cellular swelling besides a rise in [K+]e, [Na+]i, and [Ca+2]i, e.g., acidosis or changes in osmolarity that could also lead to AD. Indeed, the later ECS volume decrease, which also appeared as the second rise in TMA+ baseline, was accompanied by an additional AD shift of several mV (Figs. 3 and 6). Artificially-evoked swelling in normoxic brain slices perfused with hypoosmotic medium induced AD-like depolarization (Balestrino, 1995). As already hypothesized, the swelling may cause AD by stretching neuronal membranes (Somjen et al., 1992) and opening stretch-activated channels (Kullberg, 1987). Alternatively, ECS volume decrease may increase extracellular transmitter (e.g., glutamate) and/or [K+]e concentrations and can cause AD (Bureš et al., 1974). In our studies, the rise in [K+]e was not found during this late ECS volume decrease.
In vivo and in vitro studies
This study revealed that during ischemia all three diffusion parameters—α, λ and k′—are changing simultaneously (see Fig. 2). There was no difference between final α and λ values in cortex and corpus callosum in this study and those described in adult rat cortex (Syková et al., 1994a) or in spinal cord in vivo (Syková et al., 1994b). In contrast, Lundbaek and Hansen (1992) described in adult rats a decrease in α from 0.18 to 0.07, but a rise in λ from 1.40 to only 1.63, which may have been due to the fact that the investigators did not take into account nonspecific TMA+ or TEA+ uptake (see Syková et al., 1994b, for more extensive discussion). The lower values were also found after ischemia in vitro. In vitro studies using the slice model of ischemia revealed slightly smaller changes in α (up to ∼0.09) in adult rat cortex, but no significant changes in λ (Pérez-Pinzón et al., 1995). Similarly, Rice and Nicholson (1991) did not find changes in λ in slices of rat neostriatum. Significant in vitro changes in λ have so far been observed only with the TMA+ technique in the hippocampal region CA3 (Pérez-Pinzón et al., 1995). Our data indicate that there is something different in slice models and conditions in vivo with respect to changes in tortuosity. Presumably, anoxia leads to different geometrical changes in vivo, when no substance can escape from the ECS, and in vitro, when relatively thin slices are perfused with solutions that do not contain large macromolecules and peptides that may be partly washed out.
Functional implications
The three diffusion parameters α, λ, and k′ were determined from concentration–time profiles of TMA+ or TEA+, relatively small ions with molecular masses of 74 and 130 Da, respectively. Diffusion properties of TMA+ or TEA+ are comparable to those of some neurotransmitters (e.g., acetylcholine, γ-aminobutyric acid, glutamate). Recent studies revealed that larger molecules also diffuse through brain ECS but are more hindred than smaller ones (Tao et al., 1995; Tao and Nicholson, in press). Movement of substances with greater molecular masses, e.g., glucose (180 Da), ATP (500 Da), neurohormones and neuropeptides (dynorphin, substance P, galanin) (1,000–3,000 Da); and nerve growth factor (∼40,000 Da) could, therefore, be more hindered than TMA+.
In this study, we did not investigate tissue anisotropy. Rice et al. (1993) described anisotropic diffusion in the turtle cerebellum, showing that there is more than one distinct value of λ when measurements are made using different geometrical tissue axes (x-, y-, and z-axes). All our measurements were done in the x-axis, i.e., along WM fibers. Our recent studies revealed that diffusion in GM at P4–P21 is isotropic. Diffusion in largely unmyelinated WM at P4–P10 is also isotropic, while at P21, when myelination peaks, significant anisotropy exists in the corpus callosum (Prokopová et al., 1996); this could lead to even higher values of λ when the ADCTMA is measured across the fibers.
Diffusion in ECS is an important factor in nonsynaptic transmission (for review, see Bach-y-Rita, 1993; Fuxe and Agnati, 1991; Nicholson and Rice, 1991; Syková, 1992). Furthermore, externally applied drugs, growth factors, etc. can reach target receptors and cells only by diffusion. It is, therefore, of considerable interest to know to what extent small and large molecules can diffuse in ECS during brain pathologies. We suggest that a larger ECS is beneficial for longer survival and lesser damage during ischemia/anoxia.
Footnotes
Acknowledgment:
The authors thank Professor Charles Nicholson for providing us with his VOLTORO program and helpful comments. This work was supported by GACR grants nos. 309/94/1107, 309/96/0884, 307/96/K226, IGA MZ 3423-3, and U.S.–Czech Science and Technology Program award no. 92048.