
Abstract
Diffusion-weighted (DWI), dynamic contrast-enhanced (perfusion imaging), and conventional spin-echo magnetic resonance imaging (MRI) were applied to characterize the pathophysiology of cerebral venous thrombosis (CVT) in the rat. We induced CVT by rostral and caudal ligation of the superior sagittal sinus (SSS) and injection of a thrombogenic cephalin suspension. The resulting pathology was monitored in an acute and long-term study group. Evans blue and hematoxylin–eosin staining was performed for comparison with MRI data. A subgroup of animals was treated with i.v. tissue plasminogen activator (t-PA). Successful thrombosis of the SSS was confirmed by macropathology or histopathology in all rats. Parenchymal lesions as shown by MRI, however, were present only in animals with additional involvement of cortical cerebral veins (11 of 18 rats). The early pathology was clearly detected with the DWI. The apparent diffusion coefficient declined to 56 ± 7% of control value at 0.5 h and slowly increased to 84 ± 8% by 48 h. Perfusion imaging showed parasagittal perfusion deficits. Treatment with t-PA partially resolved the hyperintensity on DWI. Evidence of blood–brain-barrier disruption was observed 2 to 3 h after induction of CVT. In conclusion, experimental CVT is characterized by early cytotoxic edema closely followed by vasogenic edema. The t-PA treatment partially reversed the DWI signal changes consistent with regional tissue recovery, as shown by histopathology. These results encourage the use of cytoprotective drugs in addition to anticoagulant or thrombolytic therapy.
Keywords
Cerebral venous thrombosis (CVT) is an underestimated cause of stroke with an obscure pathophysiology that differs from other stroke mechanisms in the following ways: (1) Increased pressure in the superior sagittal sinus (SSS) results in a reduced capillary perfusion pressure (Wagner and Traystman, 1983) and increased cerebral blood volume (CBV) (Gotoh et al., 1993); (2) venous flow obstruction leads to increased intracranial pressure and blood–brain barrier (BBB) disruption, resulting in a decreased cerebral blood flow (CBF) (Kurokawa et al., 1990; Fries et al., 1992; Gotoh et al., 1993; Ungersböck et al., 1993; Nakase et al., 1996); (3) the net capillary filtration increases leading to progressive cerebral edema; and (4) intracerebral and subarachnoid hemorrhage additionally compromise the brain tissue (Cervos-Navarro and Diemer, 1991; Garcia, 1990).
A model of cerebral sinus and venous thrombosis has been described in the rat that is believed to resemble the human condition (Deckert et al., 1990). The combination of SSS ligation with the injection of thrombogenic cephalin suspension reliably induces SSS thrombosis. Damage to the underlying parenchyma is dependent on the additional involvement of cortical and bridging veins (Ungersböck et al., 1993; Nakase et al., 1996). Preliminary findings of an increased tissue impedance in the affected parasagittal tissue indicate a shrinkage of the extracellular space and suggest a possible role of early cytotoxic edema in the wake of sinus and venous thrombus formation (Frerichs et al., 1994). This report must be corroborated, however, and the temporal relationship of the various types of edema and the BBB breakdown has yet to be defined (Rosenblum, 1996).
Magnetic resonance imaging (MRI) is well suited to study the pathophysiology of cerebrovascular disorders. Conventional T2-weighted MRI shows signal hyperintensities a few hours after acute ischemia. The signal changes are related to the disruption of the BBB and the consequential increase of osmotically obliged water (Brant-Zawadzki et al., 1986; Kato et al., 1986). Contrast-enhanced T1-weighted MRI highlights areas with BBB disruption due to the T1 shortening effect of ex-travasated contrast agent (Runge et al., 1985; McNamara et al., 1986). Diffusion-weighted MRI (DWI) detects acute cerebral ischemia within minutes after its initiation with high temporal and spatial resolution (Le Bihan et al., 1986; Moseley et al., 1990; van Bruggen et al., 1994; Röther et al., 1996a,b). Water shifts from extracellular to intracellular compartments that occur with the development of cytotoxic edema are believed to be responsible for the signal hyperintensities in DWI (Moseley et al., 1990; Mintorovitch et al., 1991; Benveniste et al., 1992). Dynamic susceptibility contrast-enhanced MRI (perfusion imaging) takes advantage of the signal intensity changes occurring during the first passage of a contrast agent bolus and allows the qualitative measurement of cerebral perfusion (Villringer et al., 1988; Rosen et al., 1989; Edelman et al., 1990). Parameter images reflecting cerebral blood volume (rCBV) and the cerebral blood flow (rCBF) can be calculated (de Crespigny et al., 1993; Gückel et al., 1994; Röther et al., 1996c). These techniques were used in the present study to monitor the time course of the lesion development in experimental CVT and to follow the therapeutic effect of tissue plasminogen activator (t-PA).
METHODS
Animal preparation and surgical procedure
Twenty-two male, pathogen-free Sprague–Dawley rats (Harlan) were anesthetized with ketamine (40 mg/kg) and xylazine (4 mg/kg) i.m. During the MRI examination, anesthesia was maintained with 0.5 to 1.0% halothane via a nose cone. Heart rate and oxygen saturation were monitored continuously by pulse oximetry.
The surgical procedure as described by Decken et al. (1990) was slightly modified as detailed below. A 2-cm midline skin incision was made to expose the calvaria, and craniotomies (2 × 2 mm) were performed at the coronal and lambda suture. The SSS between these two craniotomies was exposed and ligated rostrally and caudally with 8–0 prolene suture. A 30-gauge needle was inserted into the SSS in front of the caudal ligation, and CVT was induced by the injection of 150 μl of a cephalin suspension (Sigma Diagnostics, USA; partial thromboplastin time reagent). The thrombogenic suspension was injected in six to eight fractions over a period of 5 min. The extended craniotomy along the length of the SSS enabled visual control of the injection to induce a maximal extension of the thrombus into the cortical veins. The needle was withdrawn after a dark, solid blood clot was visible in the SSS. Three animals with subarachnoid hemorrhage or cortical injury resulting from the surgical preparation were excluded from further evaluation.
Three different study groups were formed: An acute study group (group I; n = 6) was examined by DWI and T2-weighted MRI at time points 1, 2, 3, 4, and 5 h after injection of the thrombogenic cephalin suspension. In two animals, additional scans were performed 30 min after the injections. Lines were inserted into a femoral vein and artery for injection of MR contrast agent, blood pressure measurements and blood gas analysis.
The long-term study group (group II; n = 9) was imaged at 1, 2, 3, 24, and 48 h. A tail vein was cannulated for contrast agent injection. Additionally, in five rats, MRI was performed 0.5 h after lesion induction. At the end of 3 h, the rats were allowed to recover for subsequent MRI investigation at 24 h and then again at 48 h.
The t-PA study group (group III; n = 3) was studied at 0.5, 1, 2, 3, 4, 5 h. At the 2-h timepoint, t-PA (Genentech, Inc., U.S.A.) was infused over 2 h at a dose of 10 mg/kg body weight.
In three rats, DWI was performed 1 h after SSS ligation to screen for any tissue injury from the surgical procedure. Cerebral venous thrombosis was induced immediately therafter, and the rats were treated as described above. In one control rat, the SSS was ligated, but no cephalin suspension was injected. This rat was followed over 48 h as described for group II.
Evans blue (EB) dye (0.5 ml of 2% solution) was given intravenously to six animals either directly after the injection of cephalin suspension (2 rats of group I) or before the start of the 48 h MR examination (four rats of group II).
After the last MRI study, the rats were deeply anesthetized with halothane and perfused with heparinized saline (10 IU heparin/ml) via the venous line. Perfusion fixation with 10% buffered formalin was performed, and the brains were harvested and held in formalin until they were evaluated for EB staining and processed for histopathology.
All animal procedures were approved by the Administrative Panel on Laboratory Animal Care, Stanford University.
MRI protocol
We performed MRI using a 2.0T GE CSI imaging system. Conventional spin-echo imaging with standard sequence parameters was applied (T1-weighted: repetition time [TR] 500 ms, echo time [TE] 15 ms, field-of-view [FOV] 40 mm, 2.5-mm slice thickness, slice offset 0.25 mm, eight slices; T2-weighted: TR 2000 ms, TE 88 ms). The parameters for the navigated spin-echo diffusion experiment were TR 2000 ms, TE 80 ms, FOV 40 mm, 128 × 128 pixel matrix, b-value 0, and 1338 mm2/s.
Perfusion imaging was performed in nine rats using a multislice spin-echo echo planar bolus tracking technique (TR 1500 ms, TE 88 ms, FOV 40 mm, 2.5-mm slice thickness, 64 × 64 pixel matrix, 3 slices, 1 average). The bolus injection of 0.3 mmol/kg Gd-DOTMA contrast agent (Nihon Medi-Physics Co., Chiba Pref., Japan) was followed with a series of 16 images with a temporal resolution of 1.5 s. Perfusion imaging was performed 2 h after SSS ligation and after 24 or 48 h. Contrast-enhanced T1-weighted MRI was performed immediately after the perfusion scans.
MRI data analysis
The MRI data were transferred to an off-line workstation (Sun Microsystems, Mountain View, CA, U.S.A.) for postprocessing using customized image-display software (MR Vision Co., Menlo Park, CA, U.S.A.). The window level was adjusted to give optimal contrast, and the boundary of the hyperintense area in T1-weighted, T2-weighted MRI and DWI was delineated by eye. This procedure was repeated for every slice, and the size of this area was expressed at the percentage of the total slice area. The diffusion images were processed using a linear least-squares fitting algorithm to yield serial apparent diffusion coefficient (ADC) maps. The regions of interest that were outlined from the lesion area measurement were transferred to the ADC maps and the ADC value integrated. The ADC values were expressed as percentage of the individual normal ADC values that were obtained from the measurement of normal tissue at the 0.5-h time point. The perfusion data were processed to generate rCBV (integral of the ΔR2 transit curve) and bolus-delay maps for each slice (de Crespigny et al., 1993).
The t test was performed to test for differences in the lesion areas measured by DWI, T2w, or T1w MRI at corresponding imaging time points. The change of the ADC values was tested for significance at the 0.5- and the 48-h time points. Significance was accepted at p < 0.05. All values are given as mean ± SD.
Macroscopic and microscopic evaluation
The extent of subarachnoid bleeding and thrombus formation was evaluated macroscopically. The brains were then cut into slices corresponding to the coronal MR slices applying anatomical landmarks. The slices were digitized, and the extent of the EB extravasation was determined using NIH image analysis program (Version 1.56, Wayne Rasband, NIH).
The brain sections were embedded in paraffin, sectioned at 5 μm, and stained with hematoxylin and eosin for microscopic examination. At least three stained sections from each brain were examined by light microscope. The sections were evaluated blindly, without knowledge of the corresponding MRI results. Brain parenchyma was evaluated for the presence of hemorrhage (subarachnoid and parenchymal); fibrin thrombi in the SSS and blood vessels; and parenchymal lesions, such as basophilic shrunken neurons and glia, rarefaction of the neuropil, and presence of the neutrophils and pyknotic nuclei. The severity of parenchymal lesions was rated on a scale of 0–3 as follows: 0, no significant lesion; +, unilateral; ++, bilateral, mild to moderate; +++, bilateral severe.
RESULTS
The physiological variables are summarized in Table 1. All parameters except the MABP were within the normal range during the observation time. The MABP values recorded from six animals are overlaid in Fig. 1 to demonstrate the influence of cephalin injection. The MABP dropped from 104 ± 14 mm Hg to a minimum of 50 ± 13 mm Hg during the injection and returned to a maximum of 149 ± 15 mm Hg shortly after the end of the injection time. The MABP measurement was interrupted before the baseline was reached in order to place the animal in the magnet. The MABP changes occurred regardless of MRI lesion development (four animals with and two animals without lesion showed MABP changes; two animals had no MABP reaction and no lesion).
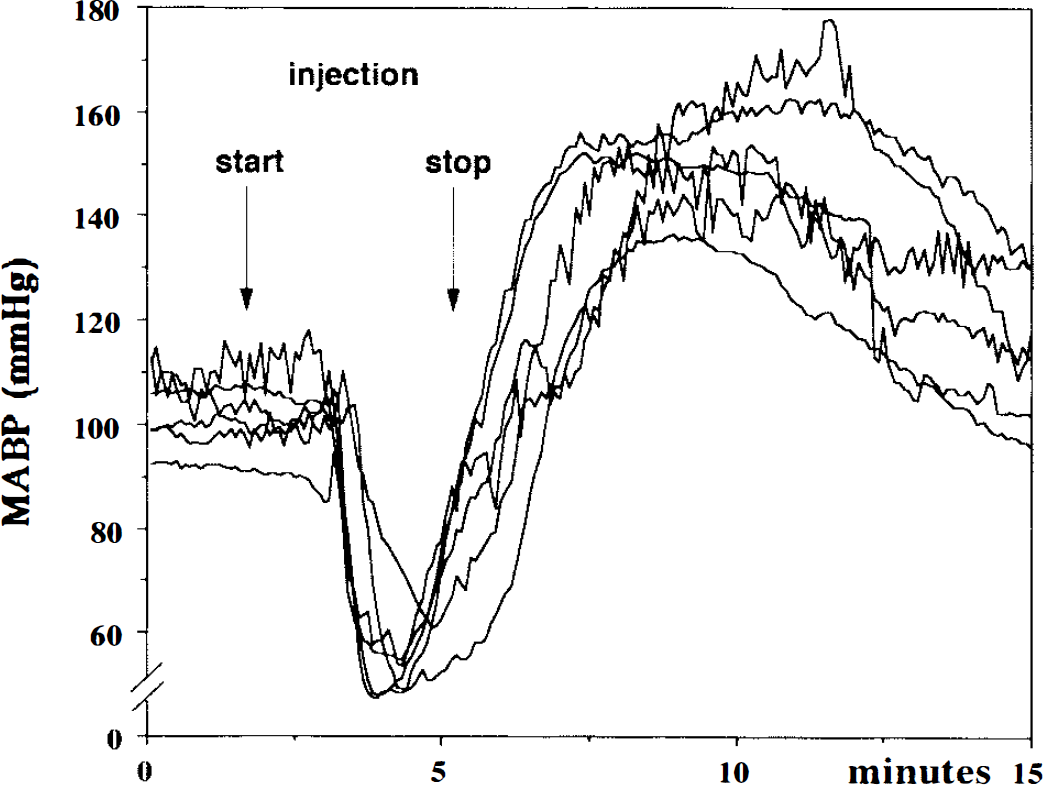
Mean arterial blood pressure (MABP) from six rats is overlaid to demonstrate the influence of cephalin injection. Shortly after the start of the injection, the MABP dropped from 104 ± 14 mm Hg to a minimum of 50 ± 13 mm Hg and returned to a maximum of 149 ± 15 mm Hg shortly after the end of the injection time.
Physiological variables (mean ± SD)
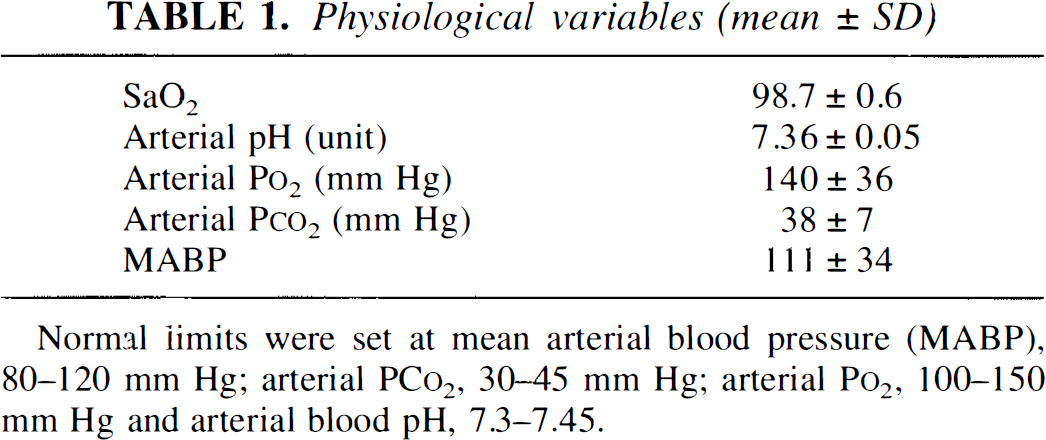
Normal limits were set at mean arterial blood pressure (MABP), 80–120 mm Hg; arterial PCo2, 30–45 mm Hg; arterial Po2, 100–150 mm Hg and arterial blood pH, 7.3–7.45.
Animals with MRI detectable lesions
Three rats from group I (acute study group), five rats from group II (long-term study group), and the t-PA-treated animals (group III; n = 3) presented lesions on MRI scans. The lesions were of variable size and located bilaterally in the parasagittal brain parenchyma. Lesions were restricted to areas between the two SSS ligations. Measurements of the lesion area and ADC values over time were performed in a total of nine animals. In two animals, the lesions were too small to allow reliable measurements. Figure 2 presents MRI data obtained from a single animal experiment 5 h after the lesion induction that best illustrates the utility of MRI.
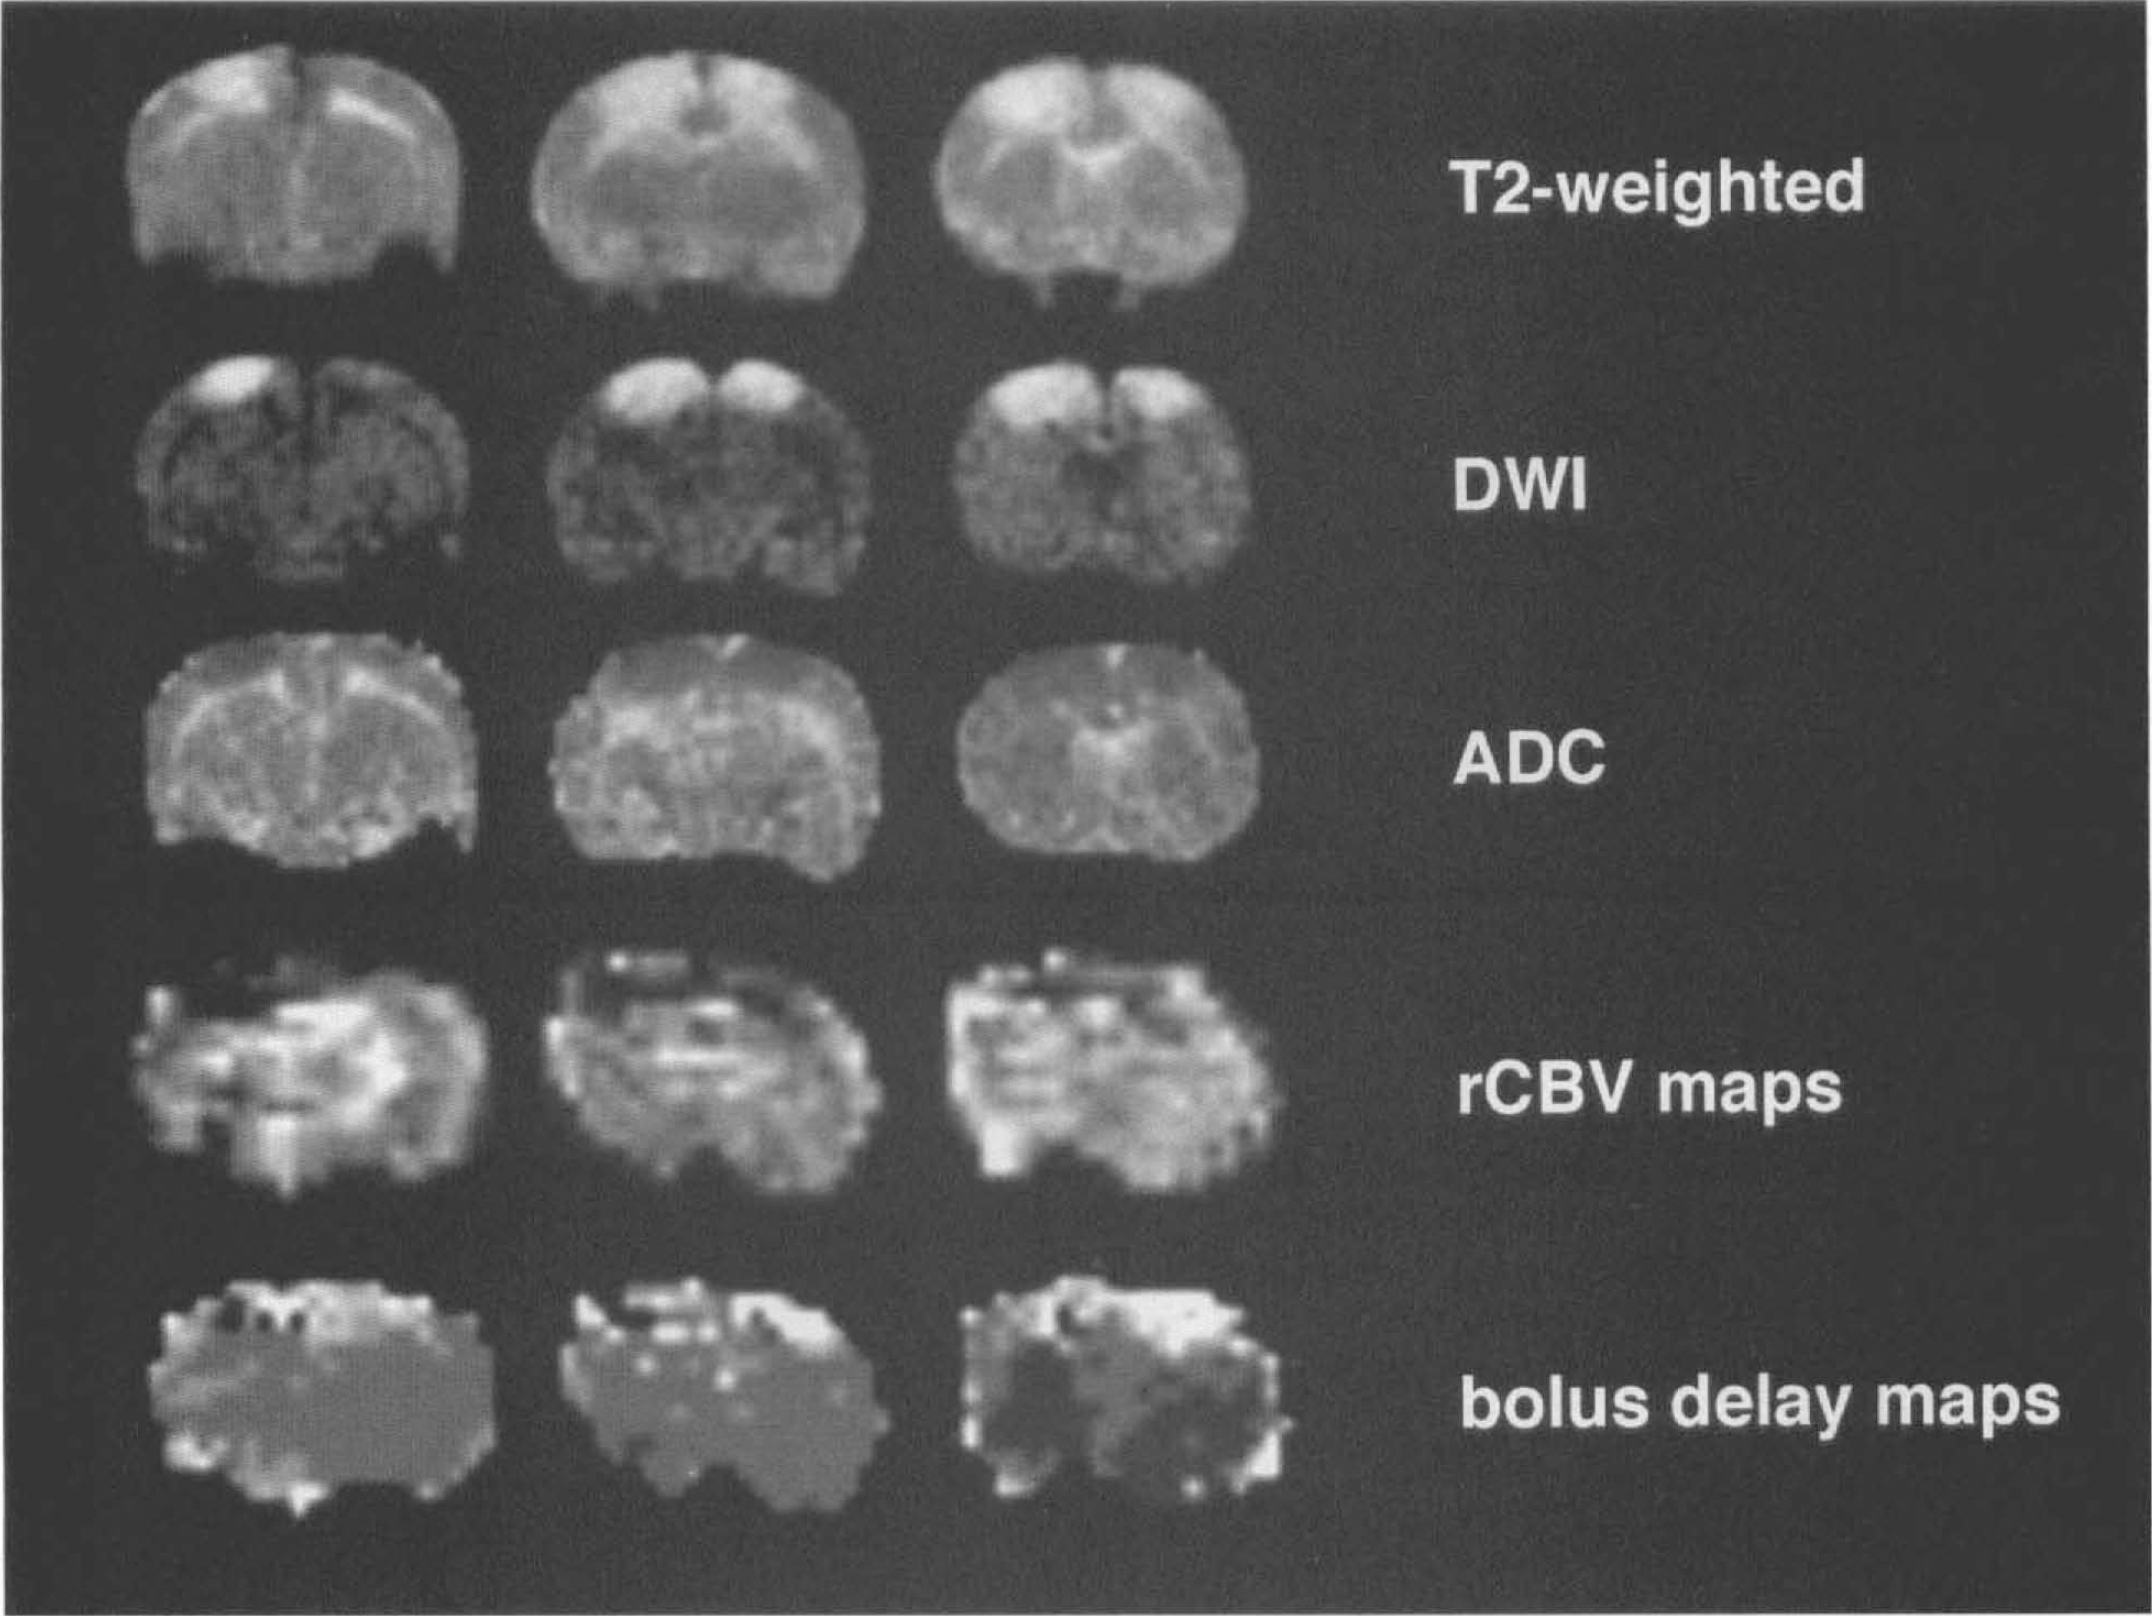
Magnetic resonace imaging (MRI) results at the 5-h imaging time point. T2-weighted MRI and diffusion-weighted MRI (DWI) display bilateral hyperintense lesions. The apparent diffusion coefficient (ADC) maps show corresponding low ADC values (indicated as dark pixels) as an indicator of cytotoxic edema. The relative cerebral blood volume (rCBV) maps and bolus delay maps delineate decreased tissue perfusion corresponding to the hyperintense lesion areas (dark areas in rCBV maps indicate low CBV; bright areas on bolus delay maps indicate severe bolus delay).
As shown in Fig. 3, at the 0.5-, 1-, and 2-h imaging time points the lesion was best delineated on DWI over T2-weighted MRI. In all animals imaged at 0.5 h after lesion induction, the DWI lesion areas were greater than the T2-weighted changes (11.0 ± 7.8% lesion area [% LA] in DWI versus 3.0 ± 6.9% LA in T2-weighted MRI; p < 0.001). By 1 h there was no detectable difference in the lesion area (10.3 ± 6.5% LA in DWI versus 9.1 ± 6.8% LA in T2-weighted MRI). In DWI as well as T2-weighted MRI, the lesion area increased toward the 5-h imaging time point (18.9 ± 11.7% LA in DWI versus 22.7 ± 11.8% LA in T2-weighted MRI; not significant) and subsequently decreased at 24 (12.5 ± 7.5% versus 16.4 ± 9.3%; not significant) and 48 h (8.5 ± 4.4% versus 13.5 ± 7%; not significant; Fig. 3).
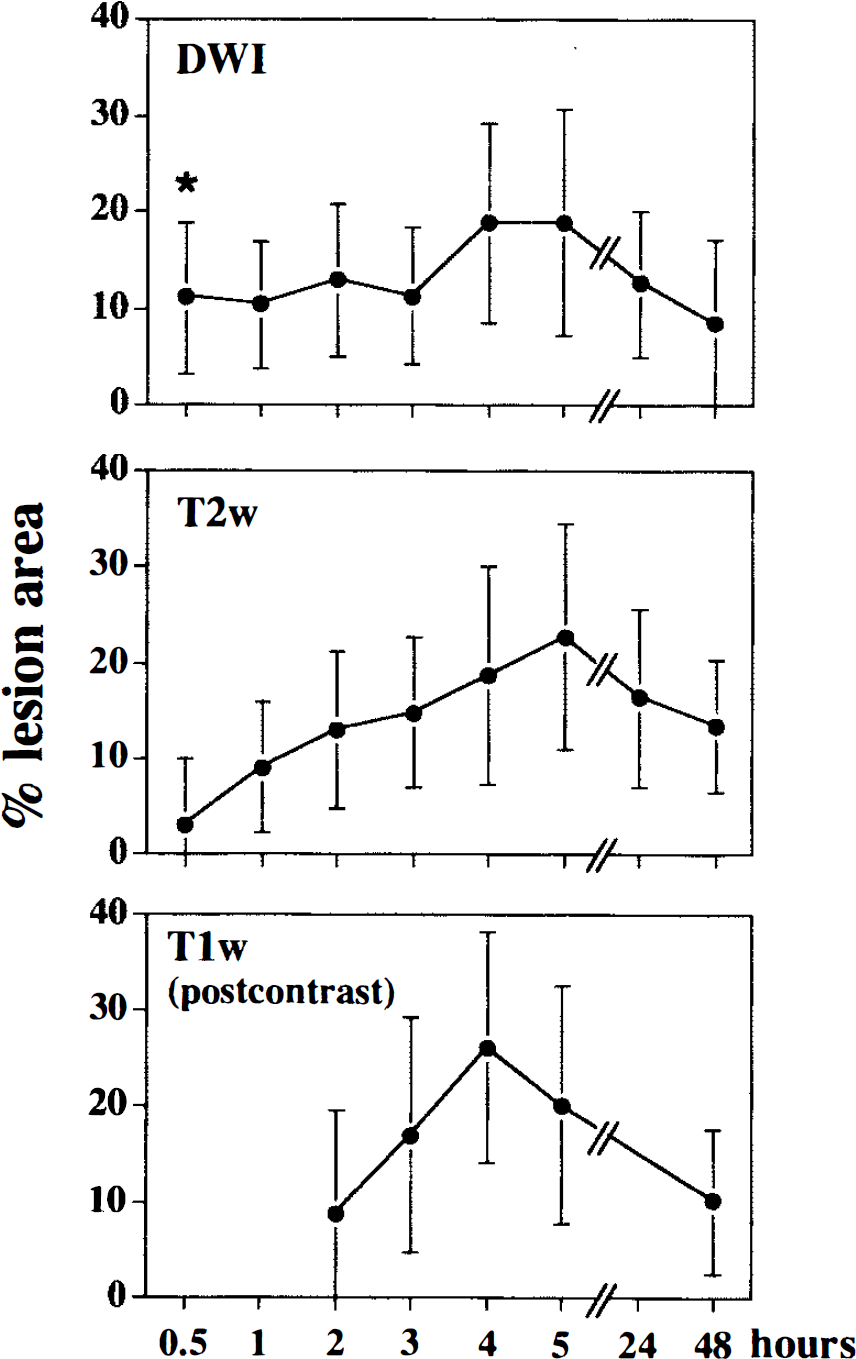
Development of the lesion area over time (mean averages ± SD). At the 0,5-h imaging time point, the diffusion-weighted magnetic resonance imaging (MRI) (DWI) lesion area was significantly greater than in T2-weighted MRI (*p < 0.001), Thereafter, lesion areas do not differ significantly, increase toward the 5-h time point and decrease by 24 h and 48 h. T1-weighted MRI follows the temporal profile of T2-weighted MRI and DWI without a significant difference in the lesion area. The lesion area is expressed as percentage of the total slice area.
The lesion development in group III rats is presented for an illustrative example from a rat in Fig. 4. The lesion area increased to the 4-h imaging time point (end of the treatment period) and dropped significantly by 5 h in DWI (p < 0.05).
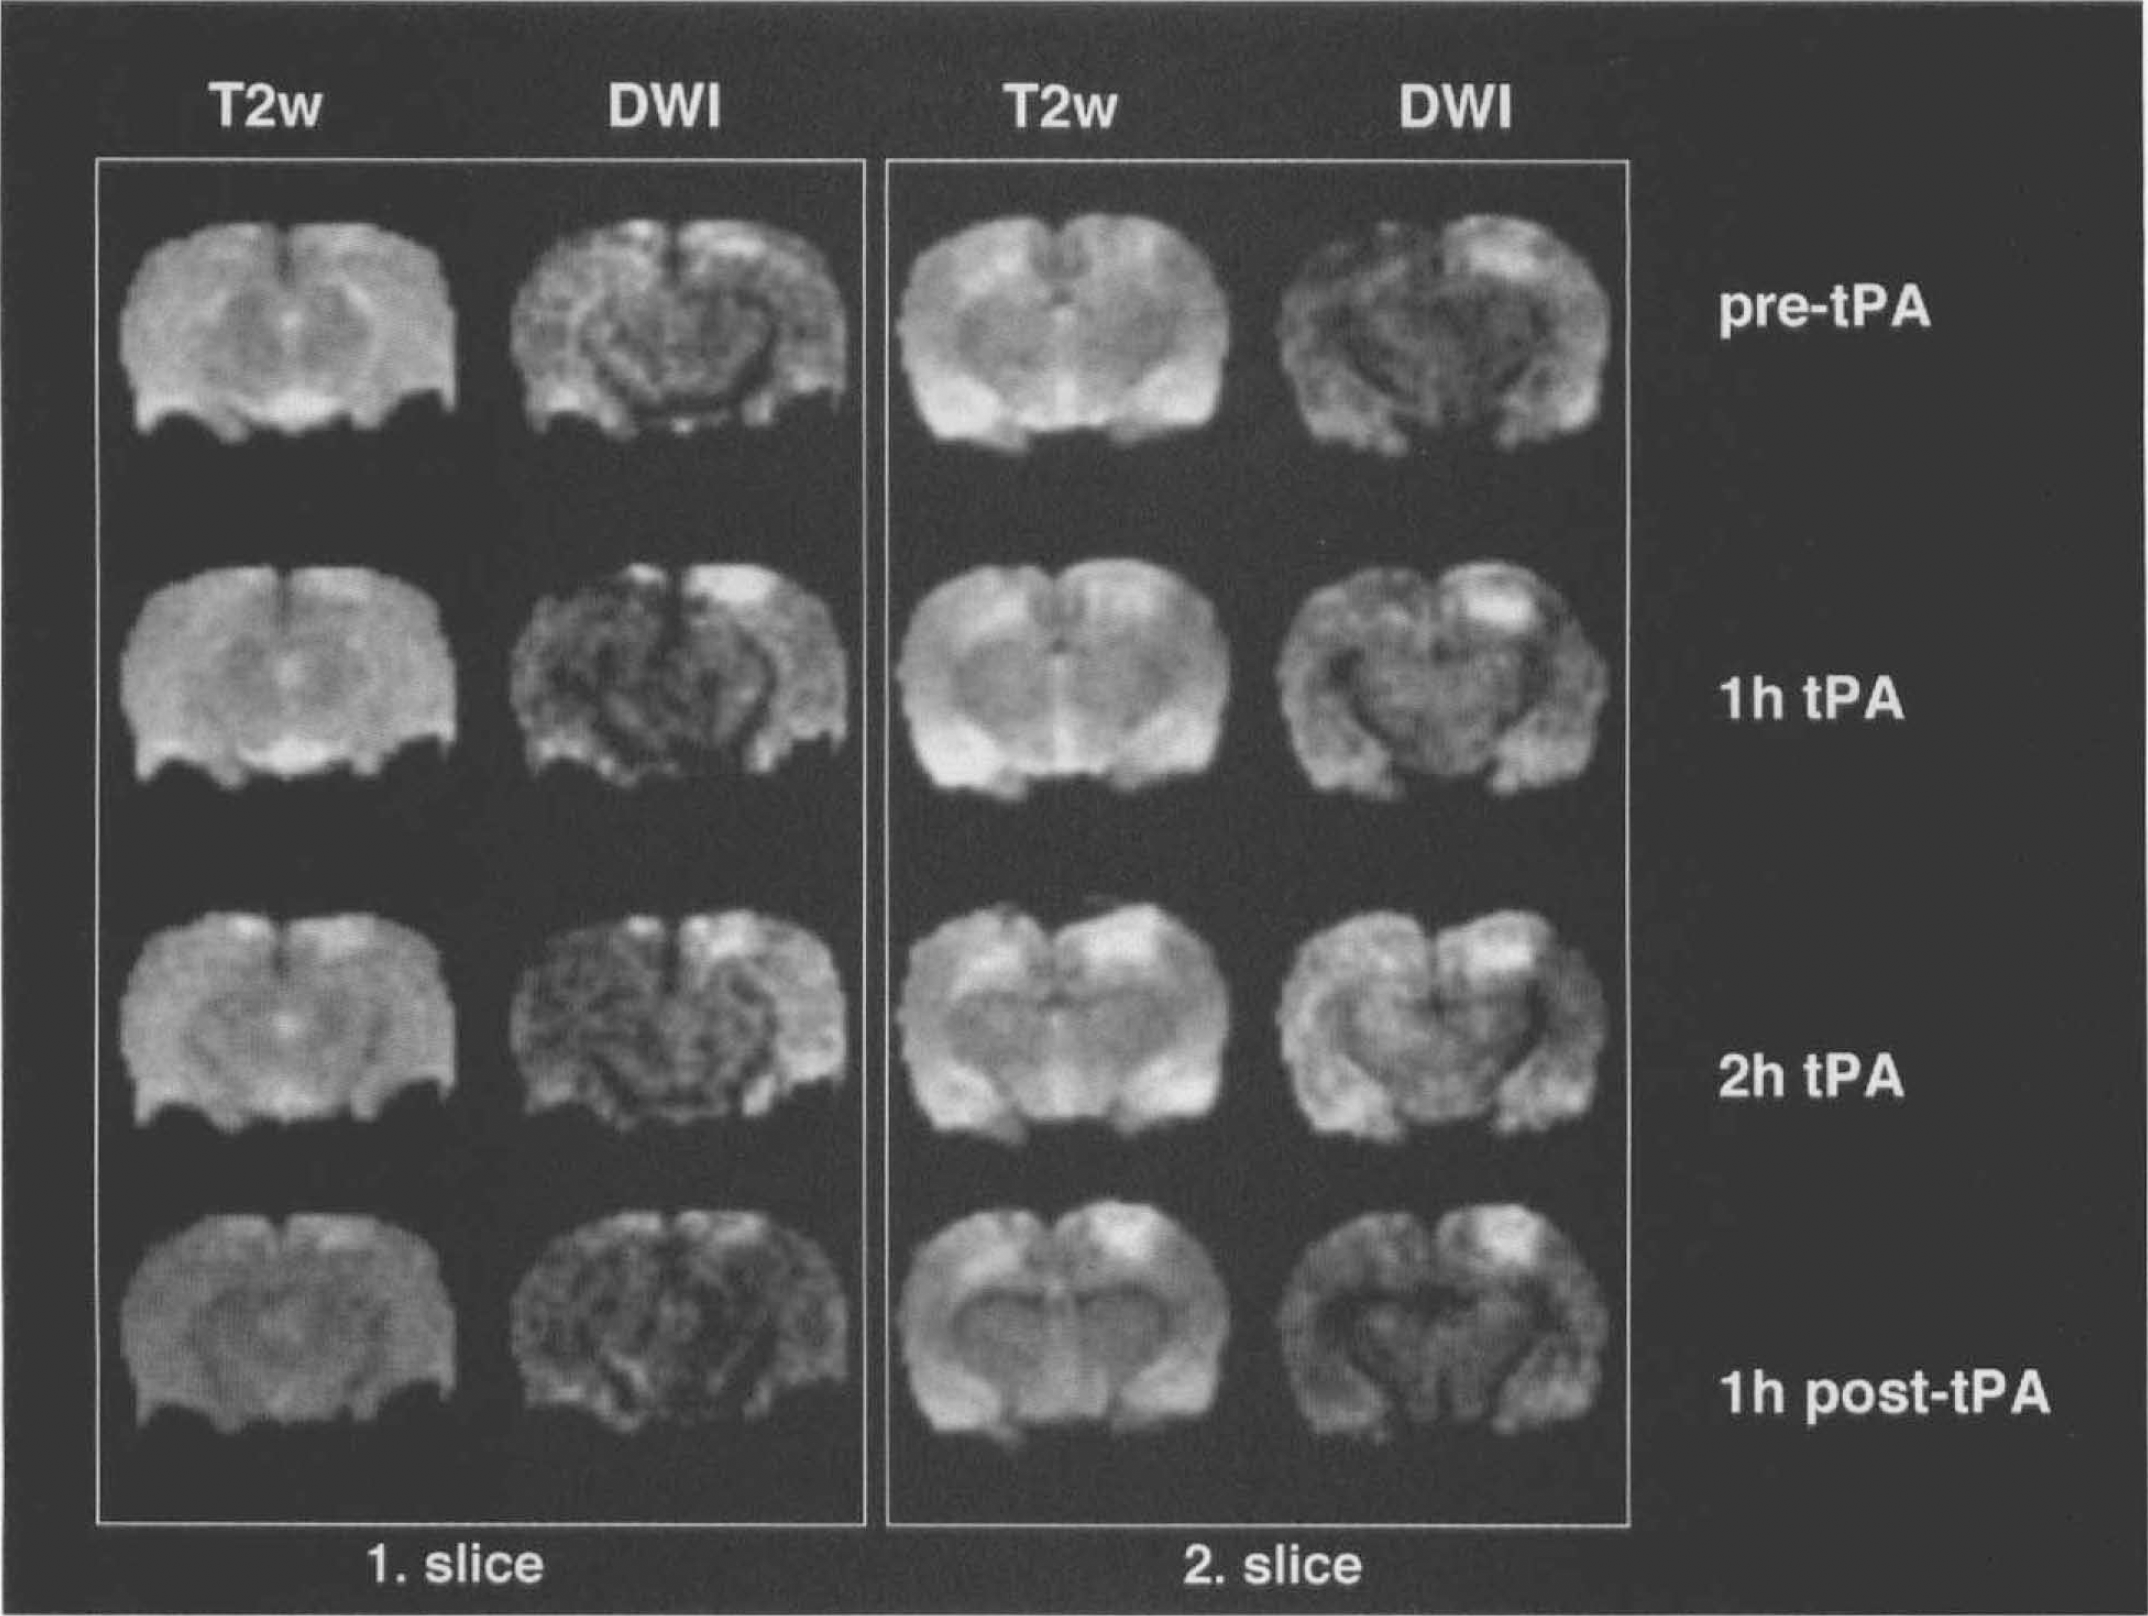
Lesion development of animals treated with tissue plasminogen activator (t-PA). Two slices with four T2-weighted images and diffusion-weighted magnetic resonance imaging (MRI) (DWI) each are presented. In slice 1, DWI shows a hyperintensity of the right cortex after 1 h and 2 h of t-PA treatment (i.e., 3 and 4 h after cerebral venous thrombosis [CVT]), that is resolved 1 h post t-PA therapy (5 h after CVT). Slice 2 shows a dense, parasagittal hyperintensity of the right cortex with a more subtle signal increase in the remaining cortex at the pre-t-PA time point in the DWI image (2 h after CVT). The more discrete hyperintensity of the parietal cortex resolves at 1 h t-PA and is followed by a hyperintensity of the contralateral cortex at 2 h t-PA. Only a small hyperintense lesion remains at 1 h post-t-PA.
The ADC values of the lesion areas decreased to 56.8 ± 7% of normal at the 0.5-h imaging time point and increased toward the 48-h observation point (84.1 ± 7.8% of normal; p < 0.001; Fig. 5).
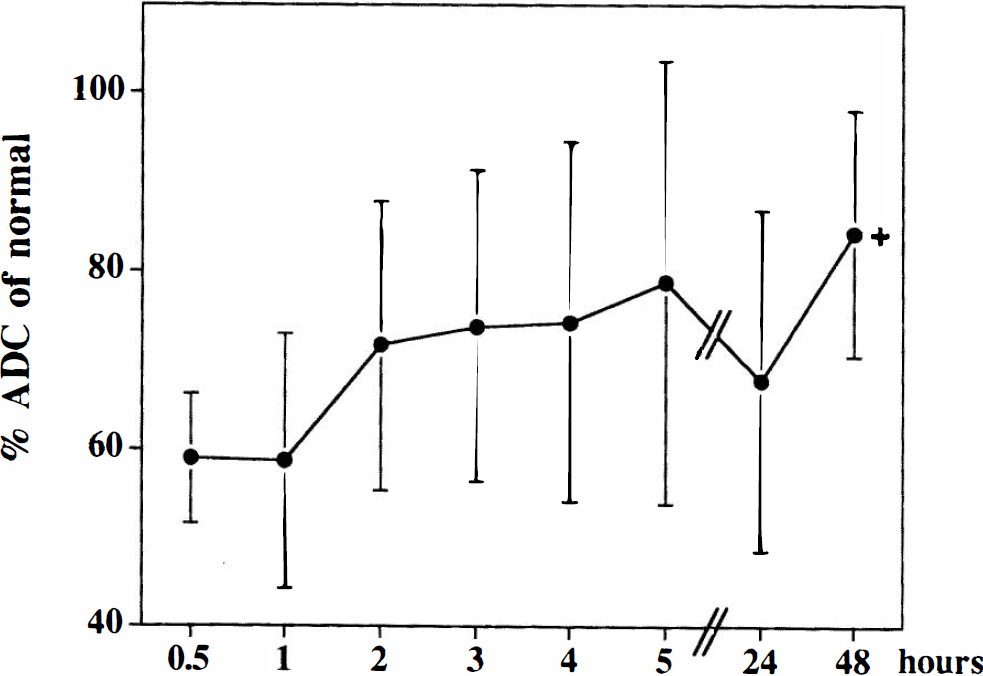
Development of the apparent diffusion coefficient (ADC) over time (mean averages ± SD). The ADC values of the lesion areas are presented as percentage of normal values. ADC decreases to 57% at the first imaging time point at 0.5 h and increases toward the 48-h time point (*p < 0.001 for comparison of the 0.5- and 48-h time points).
Perfusion imaging was performed in four of 11 rats in this subgroup. All showed bilateral, parasagittal perfusion deficits matching the lesion areas in DWI and T2-weighted MRI. In two rats with severe bilateral lesions, perfusion imaging was performed at the 2-h imaging time point and again at 24 h. In both these animals, the perfusion deficit had partially resolved at the late time point, showing only a slight bolus delay with normal findings on the rCBV maps; T2-weighted MRI and DWI were still abnormal.
Animals without MRI detectable lesions
Seven rats (three from group I, four from group II) did not develop any signal changes in postcontrast T1-weighted, T2-weighted MRI or DWI. The sham-operated animals, with ligation of the SSS but without cephalin injection, produced no detectable lesion. Furthermore, no abnormalities were detected in the rats examined after SSS ligation and before thrombogenesis.
Perfusion imaging was performed in five of seven animals and showed normal results corresponding to normal findings on T2-weighted MRI, DWI, and histology (three from group I; two from group II).
Macroscopical and histological findings
Macroscopic and microscopic inspection revealed thrombus formation in the SSS in all animals (Table 2); however, parenchymal lesions were only present in animals with additional involvement of cortical cerebral veins (11 of 18 rats). Animals without MRI lesions did not show microscopically significant changes, whereas good agreement was found between microscopic changes and MRI. The microscopic alterations were generally limited to the gray matter with rare extension into the subjacent white matter. Early microscopic changes (after 5 h of CVT) included shrinkage of neurons and glial cells, rarefaction of the parenchyma, scattered hemorrhages, intravascular aggregates of fibrin, and capillary collapse (Fig. 6). In the brains of rats euthanized at 48 h, intense eosinophilic wedge-shaped foci of necrosis and scattered neutrophils were also commonly observed. Subarachnoid hemorrhage over both hemispheres was present in 11 animals. In the t-PA-treated rats, the histological changes were limited to the lesion area as seen on the final MRI examination. The region of tissue in which the hyperintensity reversed on t-PA treatment appeared normal on subsequent microscopic examination. We performed EB staining in six rats: two with normal histological and MRI results and no extravasation present, four with bilateral lesions (histology and MRI) showing EB extravasation exceeding the area of postcontrast T1-weighted MRI (37.4% area on EB versus 16.5% T1-weighted; p < 0.02).
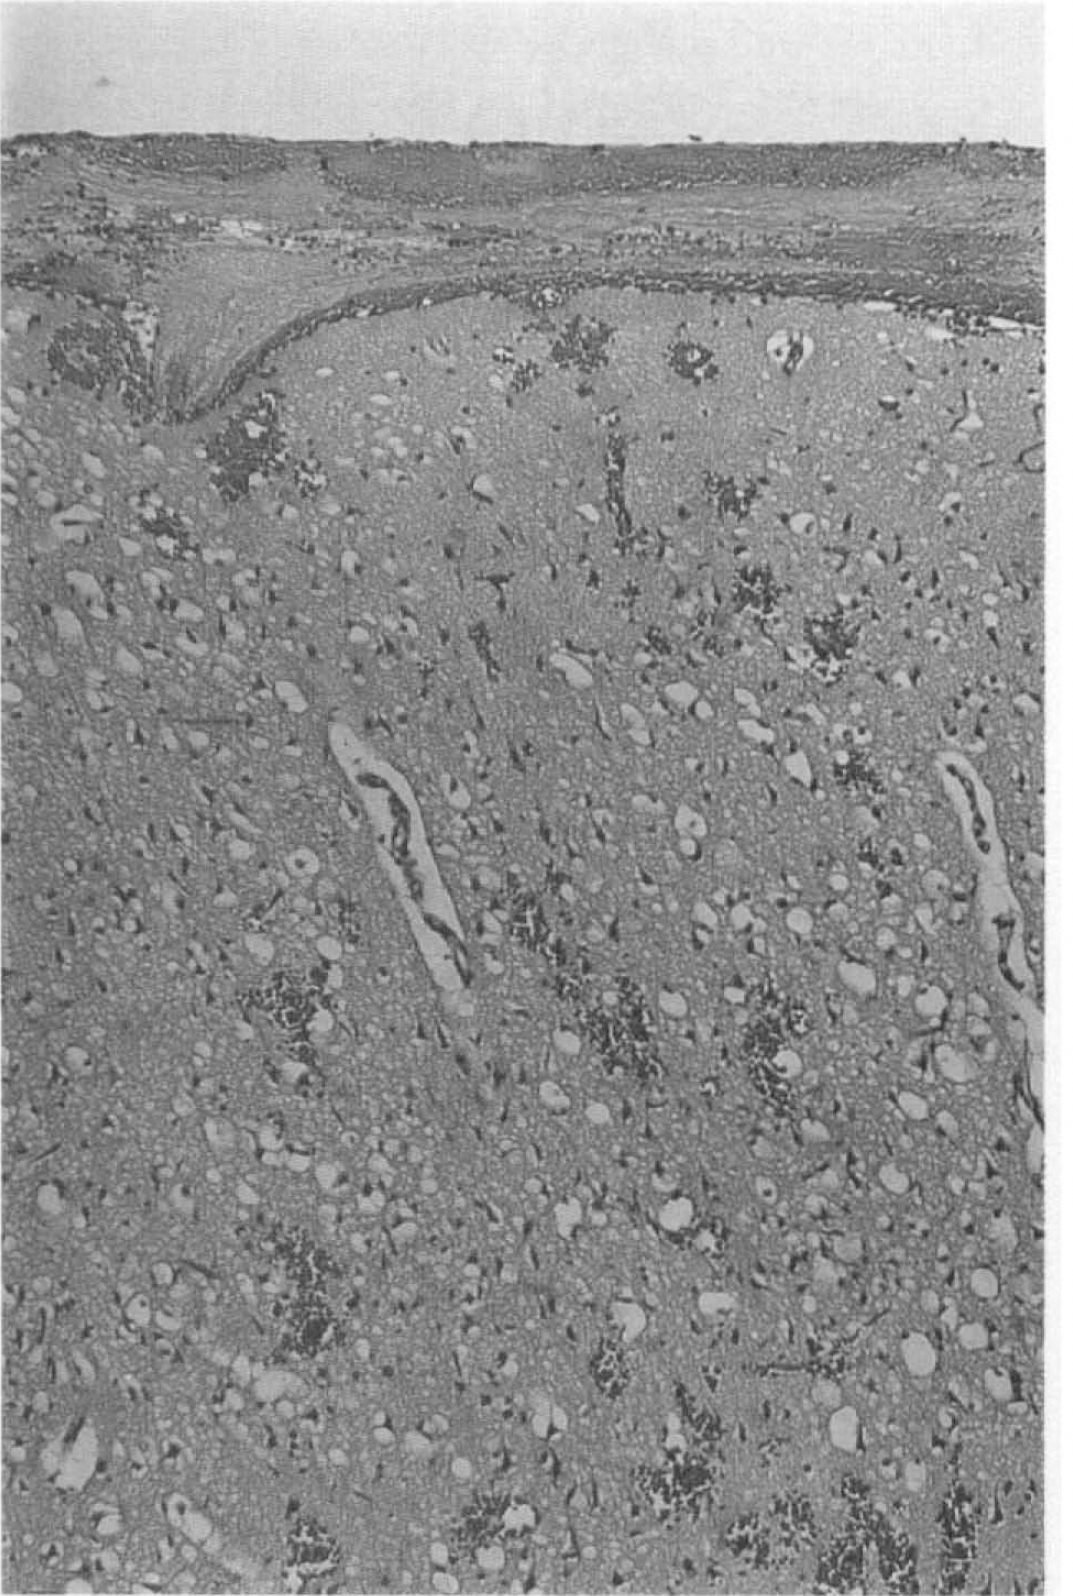
Microscopic section showing subarachnoid hemorrhage and fibrin aggregates, scattered intracerebral hemorrhages, and shrinkage of neurons and glial cells (hematoxylin and eosin staining; 1 cm = 82.5 μm). The section resembles part of a parasagittal lesion area in the occipital cortex.
Summary of MRI, histopathology, and macropathology
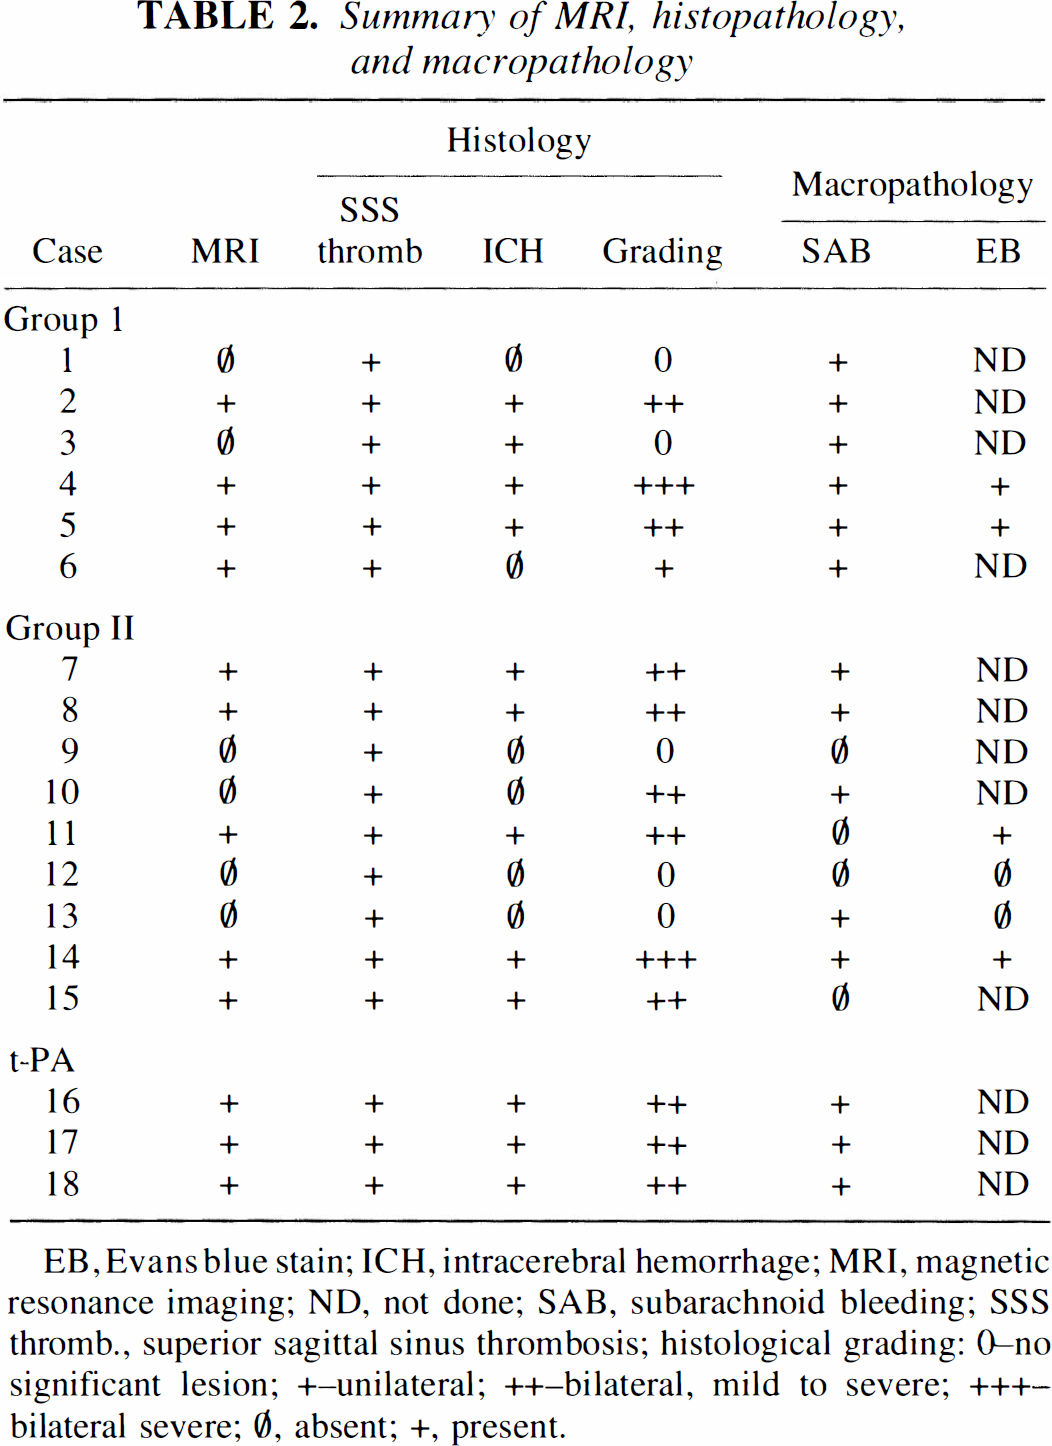
EB, Evans blue stain; ICH, intracerebral hemorrhage; MRI, magnetic resonance imaging; ND, not done; SAB, subarachnoid bleeding; SSS thromb., superior sagittal sinus thrombosis; histological grading: 0–no significant lesion; +–unilateral; ++–bilateral, mild to severe; +++–bilateral severe; ∅, absent; +, present.
DISCUSSION
Several conclusions are derived from our results: (1) cytotoxic edema is a pathophysiological factor that plays a role in the early stage of CVT; (2) sagittal sinus thrombosis alone does not produce venous infarction and hemorrhage; (3) the combination of DWI, perfusion imaging, and conventional spin-echo sequences will be useful in characterizing the development of the disease in humans; (4) the development of new therapeutic strategies combining thrombolytic/anticoagulant as well as cytoprotective therapy should be encouraged, and efficacy can be monitored using MRI.
The pathophysiology of CVT has been addressed by several studies using different experimental models. In these models, raised intracranial pressure, increased CBV, decreased CBF, and reduced cerebral perfusion pressure were found to be the consequences of venous flow obstruction and resulted in venous infarction and hemorrhage (Kurokawa et al., 1990; Tychmanowicz et al., 1990; Fries et al., 1992; Gotoh et al., 1993). In both the clinical condition (Krayenbühl, 1966; Bousser et al., 1985; Thron et al., 1986; Einhäupl et al., 1991) and experimentally induced CVT (Fries et al., 1992; Ungersböck et al., 1993; Frerichs et al., 1994; Nakase et al., 1996), the severity of resulting changes is critically dependent on the length of the thrombosed SSS and the involvement of cortical veins. These findings are supported by our results.
The development of vasogenic edema has been considered the consequence of increased venous pressure and disrupted BBB. It was only recently that cytotoxic edema formation was first proposed as a mechanism contributing to the cascade of pathological events (Gotoh et al., 1993; Frerichs et al., 1994). DWI is highly sensitive to cerebral ischemia, and the water shift from extracellular to intracellular compartments is the major component of signal intensity increases (Moseley et al., 1990; Benveniste et al., 1992). Cytotoxic edema seems the most likely cause of DWI signal changes in experimental CVT, and previous studies have shown CBF reductions well under the threshold for cytotoxic edema formation and infarction (Kurokawa et al., 1990; Gotoch et al., 1993; Ungersböck et al., 1993).
Rapid decreases in the ADC value can be detected as early as 1 to 2 min after the onset of cerebral ischemia (Davis et al., 1994; Röther et al., 1996a,b). In our series of experiments, we detected DWI signal changes at the first time point imaged, 30 min after CVT induction. At this early time point, some animals presented with a DWI signal increase before T2-weighted MRI showed any signal changes. This temporal profile of DWI changes preceding T2-weighted MRI signal hyperintensities is well known from ischemic stroke models; however, T2-weighted changes usually do not occur before 4 to 6 h after stroke induction (Mintorovitch et al., 1991) but were present in all animals at the 1-h time point in our study. A different time course of MRI changes in CVT seems likely, and an earlier vasogenic edema formation is understandable considering the increased venous pressure (Wagner and Traystman, 1983; Kurokawa et al., 1990; Gotoh et al., 1993). The increased venous pressure with consequent decrease of the cerebral perfusion pressure might be responsible not only for early vasogenic edema formation but also for the decreased parasagittal tissue perfusion observed on the perfusion images.
Although it is well known that intracranial pressure (ICP) increase is a contributing factor in clinical CVT (Kristensen et al., 1992), the role of ICP increase for the pathophysiology of CVT is still poorly characterized. Experimental data suggest that severe increases of ICP occur in response to thrombosis of cortical bridging veins (Fries et al., 1992; Frerichs et al., 1994). The contribution of increased ICP to the reduction of CBF, however, is still controversial, and the elevation of the venous pressure and the decreased cerebral perfusion pressure have been proposed as more important factors (Wagner and Traystman, 1983; Gotoh et al., 1993). Because we modified the model of CVT as initially described by Deckert et al. (1990) and performed a more extended craniotomy parasagittal along the SSS, it seems unlikely that an ICP increase could contribute to the perfusion deficit observed in our study. The midline trepanation of the calvaria served as a decompressive craniotomy, and in no rat did we observe MRI signs of increased ICP, like compression of ventricles and cisterns. Therefore, our data support the influence of venous pressure increase on parasagittal perfusion deficits rather than increased ICP.
The ADC values decreased to a minimum of 57% at the early observation points and then showed a steadily increasing trend toward the end of the study (84%). This temporal profile is similar to that observed in the related pathophysiology of focal ischemia (Knight et al., 1994). Two mechanisms may be responsible for the observed ADC increase over time: (1) A recovery of ADC may reflect accumulation of extracellular free water resulting from cell lysis. This argument is supported by the delayed development of signal hyperintensities in T2-weighted MRI and the BBB leakage seen in post contract T1-weighted MRI. (2) ADC values might normalize as a result of spontaneous recanalization of thrombosed veins or improvement of collateral drainage and subsequently recovering metabolism.
To account for the MRI observations, we propose the following: Within the first 1 to 2 h, the major pathological event is the development of cytotoxic edema, as indicated by low ADC values, on the grounds of a severely reduced perfusion pressure and consecutively occurring energy depletion and membrane failure. Because of the rapidly developing BBB disruption, the protein leakage pulls water into the extracellular space, and signal hyperintensities in T2-weighted MRI become more prominent, whereas ADC values rise from the 1 to 2 h time point. The lesion area increases until the 5-h time point and subsequently decreases toward the 24 and 48 time point. Spontaneous recanalization and improvement of collateral blood flow are the most likely explanations for lesion area decrease toward the 24- and 48-h time points and are supported by our and previous observations (Gotoh et al., 1993) of an improvement of tissue perfusion over time.
Severe MABP changes following the injection of cephalin have been reported in previous studies and possible systemic effects of the cephalin reagent were discussed (Ungersböck et al., 1993; Frerichs et al., 1994). An alternative theory for the MABP drop might be a short-lasting vasodilation resulting from the severe stimulation of the pain-sensitive SSS by the cephalin injection, as the SSS is part of the trigeminal vascular system and known to trigger a vasodilator response (Lambert et al., 1988; Goadsby and Edvinsson, 1993).
The benefit of heparin treatment in patients with CVT has been demonstrated in a randomized, placebo-controlled study (Einhäupl et al., 1991). The high specificity of t-PA for binding to blood clots seems to deliver the rationale for a comparative trial of heparin and t-PA treatment; however, only one experimental study reported on the beneficial use to t-PA (Alexander et al., 1990). Our observation of a marked decrease in the lesion area in DWI after treatment with t-PA and normal histological findings in the part of the cortex that showed transient hyperintensities in DWI is encouraging; however, further studies are necessary to determine the role of t-PA treatment in CVT. Moreover, a combined therapeutic approach of thrombolysis and cytoprotection might be an important conclusion from our data.
The rat is well suited for experimental CVT because it has a relatively constant anatomy of the cortical veins (Schuhmacher, 1984) and because the applied model of CVT is thought to mimic closely the pathophysiology of CVT in humans (Frerichs et al., 1994). The considerable variability of the lesion areas as well as the ADC values in our experiments is similar to the disease in humans. Nevertheless, several factors hamper a close comparison between CVT in this animal model and in humans. The most important factor is probably the temporal frame of the pathological events. It is well known that the course of the disease in humans can proceed over days and weeks (Bousser et al., 1985; Einhäupl et al., 1991), whereas in this model the evolution of thrombosis occurs within 5 to 10 min during injection of the cephalin suspension. It is reasonable to assume that the expedited edema formation and tissue infarction has a strong influence on the temporal profile of ADC and T2-weighted MRI tissue characteristics. This temporal profile might be much more delayed in patients; therefore, clinically useful information can be expected from monitoring the course of the disease by DWI, conventional MRI, and perfusion imaging. It has been proposed that CVT has features reminiscent of the ischemic penumbra (Ungersböck et al., 1993; Nakase et al., 1996). We could not support this intriguing idea in our experiment, but it seems reasonable to · assume that the combination of ADC values, T2 values, and perfusion imaging data in patients may allow for a differentiation of compromised but salvageable tissue.
Footnotes
Abbreviations used
Acknowledgment:
Joachim Röther is supported by a research grant from the Deutsche Forschungsgemeinschaft. We gratefully acknowledge Dr. J. Yoshikawa, Dr. K. Iwai, and Dr. S. Seri from the Nihon Medi-Physics Co. Ltd., Chiba Prefecture, Japan, for providing the MR contrast agent and Genentech., Inc., Department of Neuroscience, South San Francisco, for providing the t-PA. This work was supported by the NIH/NCRR (RR 09784, Center for Advanced MR Technology at Stanford, G. Glover, P.I.).