
Abstract
The development and characterization of new receptor ligands for in vivo binding assays are often both lengthy and expensive. It is therefore desirable to predict the suitability of a ligand early in the process of its evaluation. In the present study, compartmental analysis following intracarotid ligand injection in the monkey is used to evaluate the in vivo kinetics of the muscarinic cholinergic receptor antagonists [11C]tropanyl benzilate ([11C]TRB) and [11C]N-methylpiperidyl benzilate ([11C]NMPB). Animals were implanted with chronic subcutaneous access ports and indwelling catheters with tips located in the common carotid artery, just proximal to its bifurcation. The external carotid artery was ligated to ensure selective tracer delivery through the internal carotid artery to the brain. Positron emission tomography was used to measure brain tissue time–activity curves following tracer injections. CBF was estimated from the clearance of [15O]H2O, and receptor ligand distributions were analyzed according to a physiologic model consisting of an intravascular compartment and nonspecific plus free and receptor-bound tissue ligand compartments. In [11C]TRB studies, marked reductions in the forward ligand-receptor binding rate and in both the total and the specific binding tissue-to-plasma volumes of ligand distribution were observed after scopolamine receptor blockade or with low administered specific activity. Conversely, neither the distribution volume of the nonspecific plus free ligand compartment nor the rate of ligand dissociation from receptor sites was affected. In [11C]NMPB studies, tissue compartments describing specific binding and nonsaturable components could not be reliably separated. The receptor-related term in this case, the total tissue-to-plasma distribution volume, demonstrated reduction after low specific activity ligand injection. Comparison of the two ligands suggests that NMPB interacts more rapidly with the receptors and has a lower apparent volume of distribution than does TRB. Thus, NMPB may be the more suitable ligand if accurate estimates of binding dissociation rate are limited by temporal constraints or if simplified, one-tissue-compartment analyses are used. The carotid injection method appears promising for the initial evaluation of ligand kinetics, permitting physiologic compartmental analyses without measurement of input functions or chromatography of blood samples.
The initial selection of ligands for in vivo neuroreceptor imaging is often based on properties determined in in vitro binding assays. However, ligands with high equilibrium affinity or other favorable properties in vitro may prove unsuitable in vivo due to limitations in their kinetic distribution properties. This situation has been encountered in the biodistributions of several tracers including buterophenone binding to dopamine D2 receptors (Wong et al., 1986) and scopolamine (Frey et al., 1992), quinuclidinyl iodobenzilate (Sawada et al., 1990), and benztropine (Dewey et al., 1990) interactions with muscarinic cholinergic receptors. Scopolamine, for example, displays high in vitro equilibrium affinity for muscarinic cholinergic receptors (Kd = 300 pM) (Frey and Howland, 1992). However, attempts to quantify brain muscarinic receptor density with [11C]scopolamine and positron emission tomography (PET) demonstrate limited precision due to very rapid binding and slow dissociation of the ligand in vivo (Frey et al., 1992). Under conditions where binding is both relatively irreversible and rapid relative to tissue delivery and clearance, even delayed postinjection ligand distribution reflects tracer delivery (CBF and blood–brain barrier permeability) in addition to receptor density.
Precise in vivo receptor quantification requires ligands with well balanced ratios between the kinetic parameters describing blood–brain barrier ligand transport and binding to and dissociation from specific and nonspecific tissue sites. Considering that the development of a receptor ligand for human imaging use is both time consuming and costly, it is desirable to have a method for evaluation of in vivo kinetics early in the development process. Here, we present an animal model employing intracarotid injection, PET data acquisition, and tracer kinetic analysis. Since the procedure utilizes direct intracarotid tracer injection, the need for measurement of the arterial input function, including chromatographic analyses of blood, is obviated. The method is evaluated by application to a comparison of the ligands [11C]tropanyl benzilate ([11C]TRB) and [11C]N-methylpiperidyl benzilate ([11C]NMPB), two muscarinic cholinergic tracers developed in our laboratories.
METHODS
In vivo receptor binding model
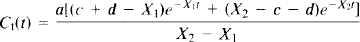
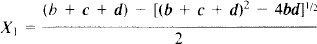
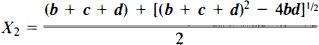
Modeling of in vivo radioligand binding studies generally employs a derivative of a four-compartment tracer kinetic model, including representations of radioligand in arterial plasma (Ca), free radioligand in tissue (Cf), radioligand bound to nonspecific (nonsaturable) tissue sites (Cns), and radioligand bound to specific (saturable) receptor sites (Cs). In the present studies, we have made the simplifying assumption that the free and nonspecific binding tissue pools are in rapid equilibrium, resulting in a three-compartment, four-parameter model with combined representation of the nonsaturable binding and free ligand pools (Cns+f) (Frey et al., 1985). In this simplified model, movement of tracer between blood and tissue is described by transfer rate constants a and b, while binding of ligand to receptors is described by c and dissociation of bound tracer by d. The physiologic descriptions of the intercompartmental transfer rates have been derived previously (Frey et al., 1985) and are given below:

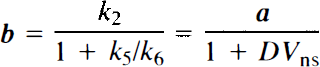
where K1 through k6 are the intercompartmental rate constants in the four-compartment model (Fig. 1a), a through d are the exchange rate constants in the simplified three-compartment model (Fig. 1b), PS is the cerebral capillary permeability-surface area product, EF is the single-pass cerebral capillary tracer extraction fraction, DVns is the apparent tissue volume of distribution of nonspecifically bound tracer (the ratio of the rates of binding and dissociation from nonspecific sites), kon and koff represent the bimolecular binding and unimolecular dissociation rate constants for the receptor–ligand interaction, respectively, and R is the concentration of receptors available for ligand binding.
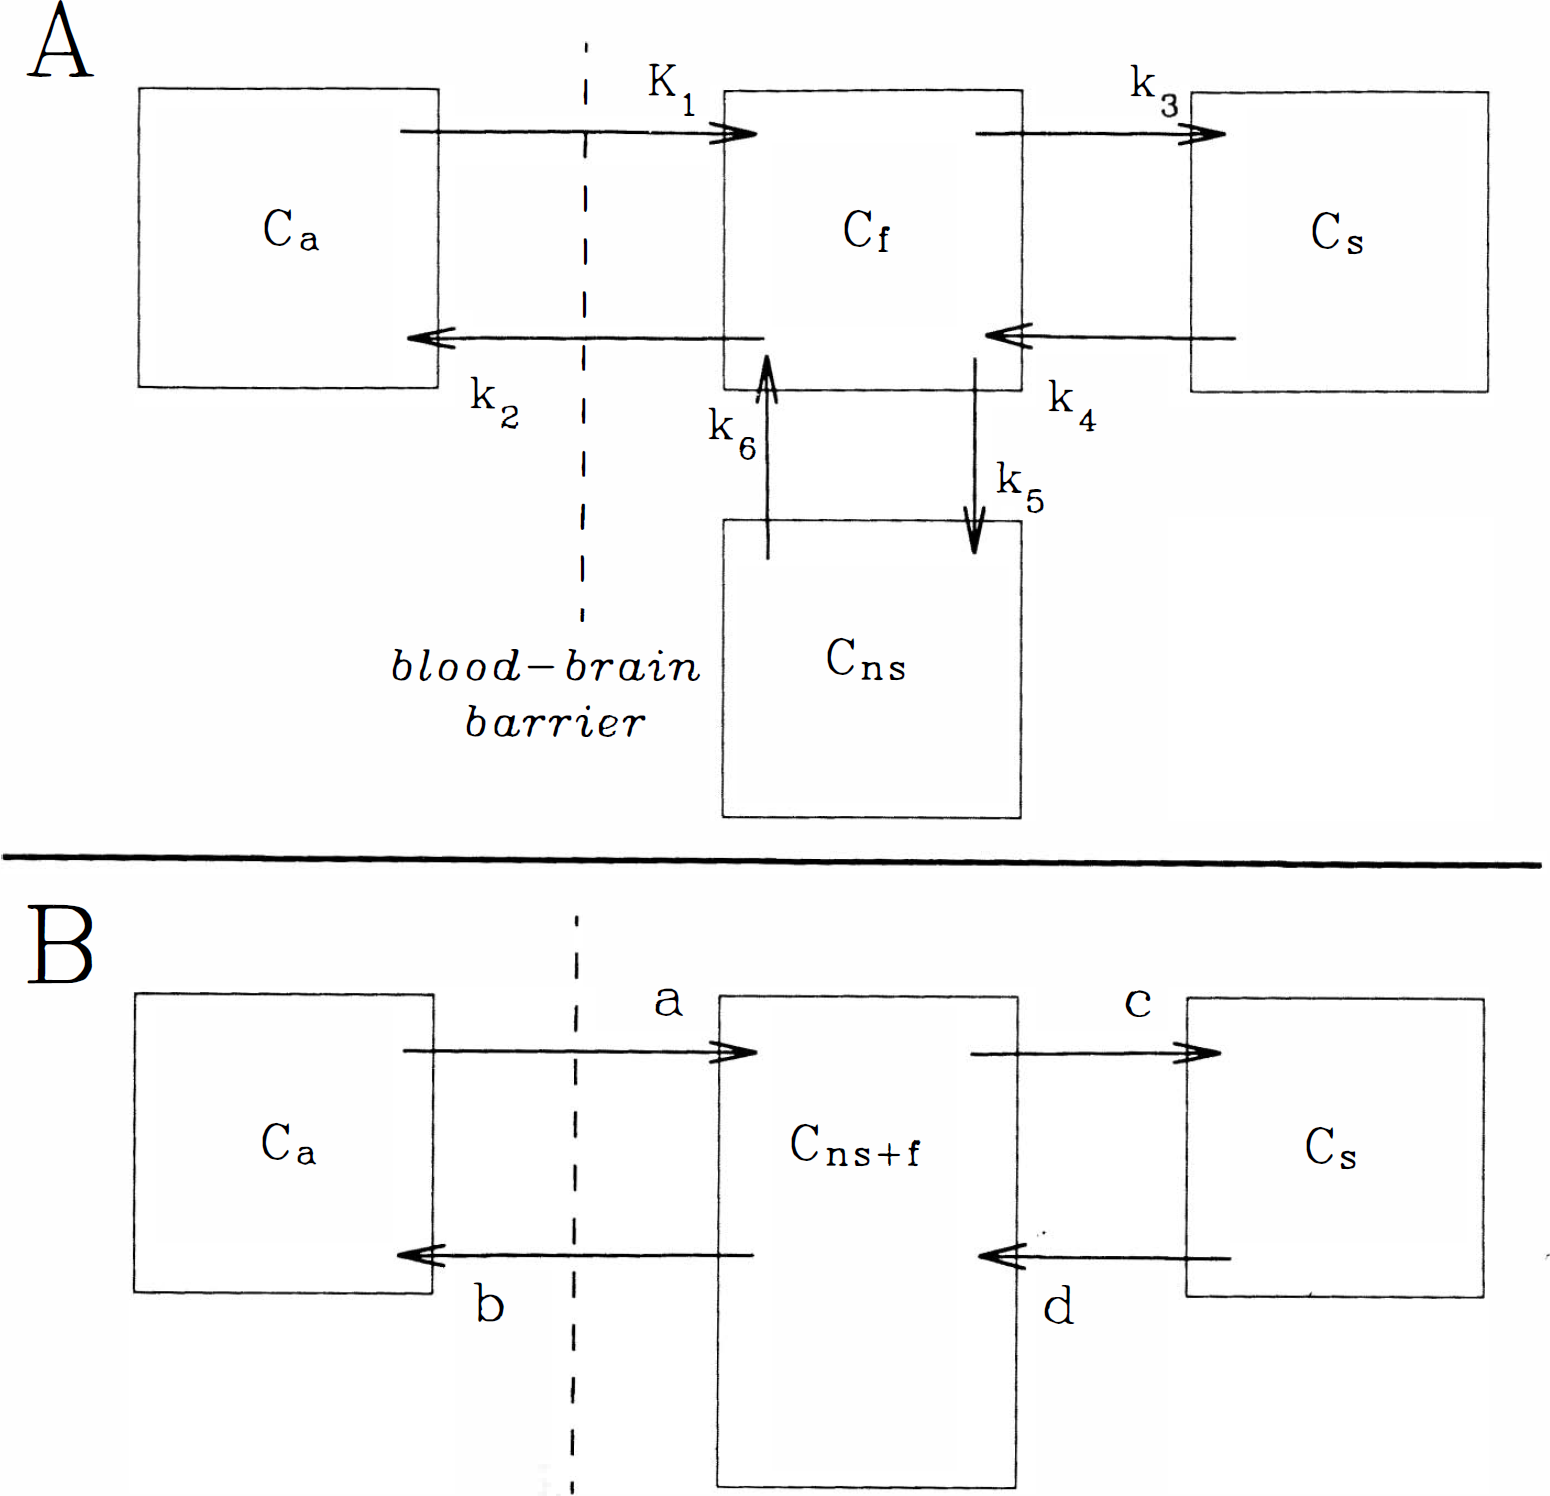
Physiologie compartmental model configurations describing cerebral ligand distribution,
After bolus arterial input to the brain, the time course of the total tissue tracer concentration (Ct) is described by
Implantation of chronic carotid artery access ports
Chronic, indwelling vascular access ports (model GPV; Access Technologies, Skokie, IL, U.S.A.) were surgically implanted in each of three Macaca nemistrina monkeys under general anesthesia. The ports were connected to catheters entering the external carotid artery, terminating in the common carotid artery as described previously (Taylor et al., 1992). Catheter tips were positioned at the carotid bifurcation, and the distal external carotid was ligated so that injections were directed into the internal carotid artery (Fig. 2). Access ports were positioned subcutaneously over the sternum, facilitating percutaneous localization and ligand injections. The volume of the reservoir system and the catheter was ˜0.2 ml, and they were flushed on a once- or twice-weekly basis with a heparinized saline solution (˜1 ml containing 1,000 U heparin sodium) to prevent thrombosis. Animals were used in tracer distribution experiments a minimum of 1 month postoperatively and participated in no more than 1 half-day imaging session per week over the course of the present studies. The studies were reviewed and approved by the University Committee on Use and Care of Animals, in accordance with the principles and guidelines established by the NIH Guide for the Care and Use of Laboratory Animals and the NIH OPRR Public Health Service Policy on Humane Care and Use of Laboratory Animals.
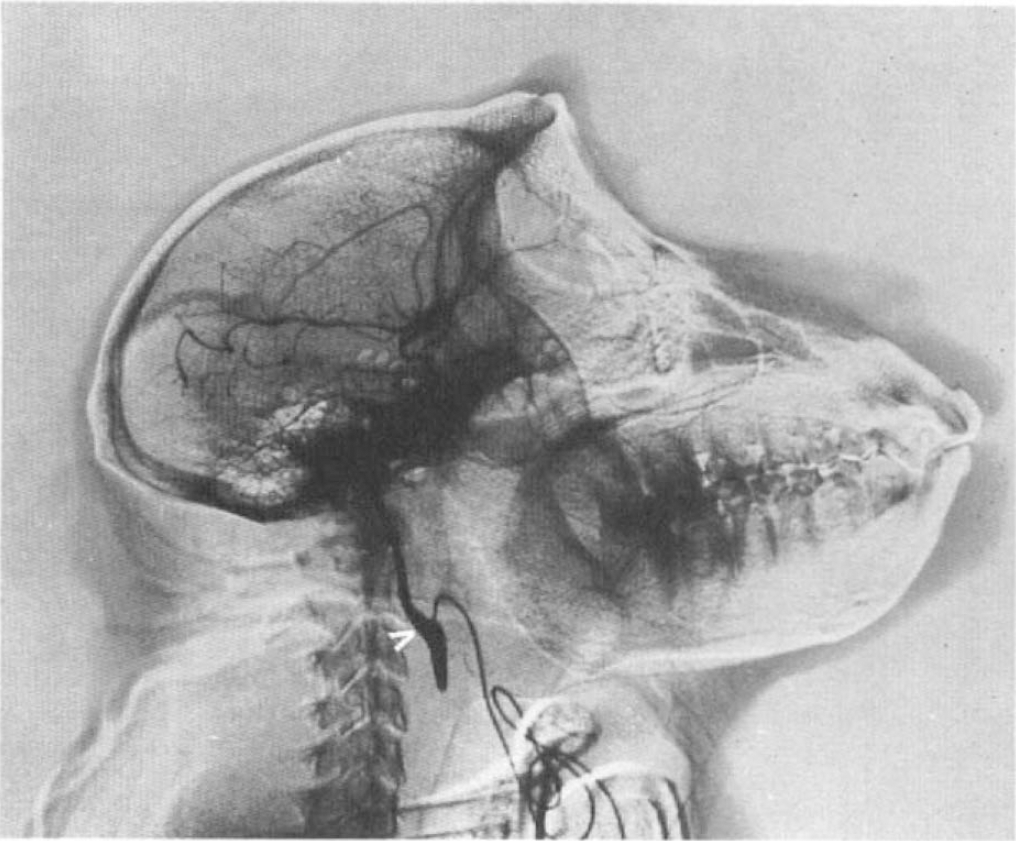
Angiographic demonstration of implanted catheter and cerebrovascular distribution of injected tracers. The point of entry of the catheter in the external carotid artery (arrowhead) and opacification of the adjacent distal common carotid, internal carotid, and anterior and middle cerebral arteries are demonstrated in a subtraction radiograph during injection of iothalamate meglumine 0.6 g/ml. The injection port is located caudally, outside of the radiographic field of view.
Determination of brain radiotracer time–activity curves
Prior to PET scanning sessions, animals were premedicated with atropine (0.04 mg/kg s.c.) to reduce oral secretions and anesthetized with ketamine (25 mg/kg i.m., given every 30 min or more frequently as needed). Endotracheal intubation was performed to prevent airway obstruction.
Imaging was performed with a Cyclotron Corp. TCC 4600A positron tomograph consisting of three rings of discrete detectors. The scanner has an effective sensitivity of 20,000 cps/μCi/ml in the direct planes and allows reconstruction of five contiguous slices with an 11.5-mm center-to-center slice separation and a reconstructed in-plane resolution of ˜12 mm in the present studies. Animals were positioned supine with the canthomeatal line oriented parallel to the plane of imaging. The skin overlying the injection port was washed and draped for aseptic, percutaneous injection of the access port. At the beginning of each imaging session, the access port was entered with a 22-G Huber needle and flushed with 1 ml of heparinized saline solution. Subsequently, 0.5–2 mCi of [15O]H2O were injected and a 3-min emission image acquired. After reconstruction, the subject's axial head position was adjusted to maximize the volume of the catheter-perfused brain tissue in the center ring of the tomograph.
CBF
CBF was measured after bolus injection of [15O]HzO. Following the intracarotid bolus injection of 0.5–2 mCi of [15O]H2O, total coincidence counts in the middle ring of the tomograph were recorded dynamically with high temporal resolution. Data acquisition was started a few seconds before tracer injection, and activity was integrated over contiguous 0.25-s intervals for 3 min, yielding a tissue time–activity curve q(t). An integrated image of the activity was acquired in parallel with the count rate data and was reconstructed to verify the anatomy of the tissue contributing to the time–activity curve. The dynamic data were corrected for physical decay, and the following model was used to describe the time course of the tissue time–activity curve q(t):

where q is the total activity in a tissue volume element (here the whole-tissue slice in the field of view), CBF is cerebral blood flow to the volume, Λ is the tissue-to-intravascular partition coefficient for water, Ca(t) is the time course of arterial activity, and ⊗ denotes the operation of convolution. Following direct intracarotid injection, the shape of the arterial input curve may be assumed to be a true impulse (neglecting effects of intravascular bolus dispersion and assuming no recirculation), in which case Eq. 8 can be simplified to
where q(0) is the activity initially extracted by the tissue volume. The constant CBF/Λ was calculated by fitting Eq. 9 to the tissue time–activity curve between 5 and 35 s following the peak of activity, and CBF was estimated by assuming a partition coefficient Λ of 0.85 ml/g (Fig. 3).
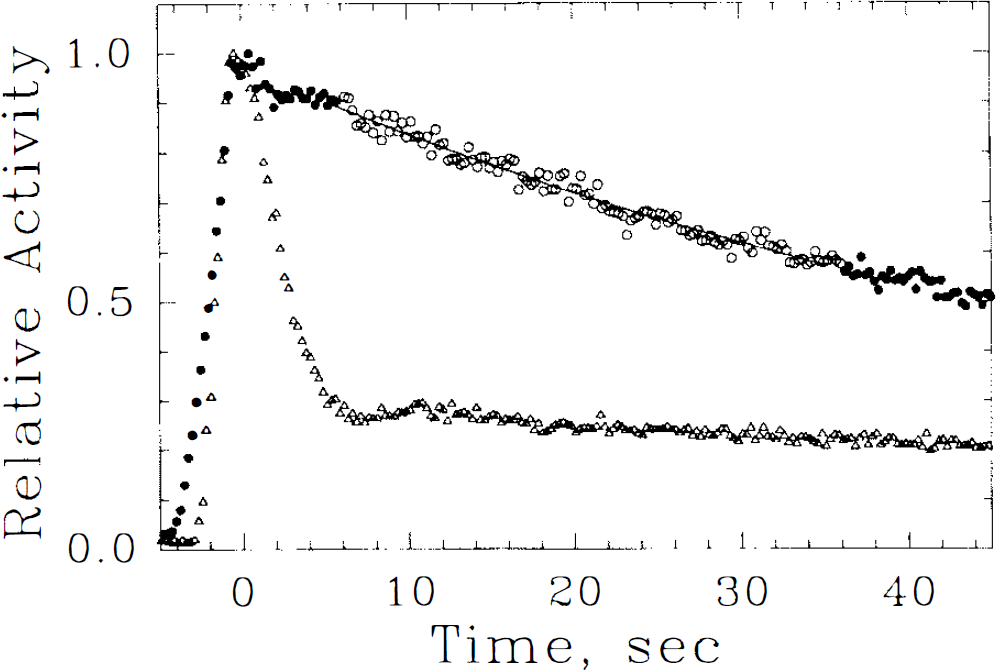
Time course of activity in a whole transaxial slice following intracarotid injections of [15O]H2O (filled and open circles) and of the poorly extracted polar tracer [13N]NO32 (triangles). In the interval between 5 and 35 s (open circles) following arrival of peak activity, a monoexponential fit to the [15O]H2O washout curve (solid line) is employed to estimate CBF.
Estimation of in vivo ligand distribution and binding parameters
11C-labeled TRB and NMPB were synthesized from the desmethyl precursors and [11C]methyl iodide as described previously (Mulholland et al., 1992, 1995). The specific activity of each tracer was determined by ultraviolet absorbtiometry following HPLC of the reaction mixtures.
Following the bolus injection of 1–3 mCi of either [11C]TRB or [11C]NMPB, coincidence counts in the middle ring of the tomograph were recorded as in the CBF studies and the data corrected for decay. A monoexponential was fitted to the time–activity curve in the interval between 5 and 35 s after initial arrival of activity in the head and the fit back-extrapolated to the time of peak activity. The EF was calculated as the ratio of the back-extrapolated value at the time of the peak-to-peak activity (Eichung et al., 1974; Raichle et al., 1974; Taylor et al., 1992). The forward transport rate from blood to brain (K1; parameter a) was then estimated from Eq. 1, employing the immediately preceding CBF value.
Simultaneously with the TRB or NMPB injection, a sequence of PET scans was started consisting of the following: 7 × 5 s, 12 × 10 s, 14 × 30 s, 10 × 120 s, 6 × 300 s, and 3 × 600 s scan frames. The data were corrected for 11C decay, and each frame was reconstructed into five transaxial slices using a 128 × 128 voxel matrix (voxel size: 1.4 × 1.4 × 11.5 mm, reconstructed with Hanning filter, cutoff frequency 1.75 cycles/cm, resulting in an effective in-plane resolution of 12 mm and z-axis resolution of 10 mm full width at half-maximum). Tissue time-activity curves were generated by placing large regions of interest over the cerebral activity on the injected side in the middle slice and also in the same approximate location on the contralateral (uninjected) side. The time–activity curves were analyzed by fitting to Eqs. 1–7 with a nonlinear, least-squares algorithm (Marquardt, 1963), with weighting inverse to the counts recorded at each point. Parameter a was fixed to the value determined from the first-pass extraction and CBF estimates (see preceding). This fitting procedure yielded the parameters b, c, and d. The fit was started 10 s after the peak, permitting the bolus of intravascular activity to leave the field of view and obviating the need to include and fit an intravascular volume term.
In addition to the forward binding rate parameter c, several derived estimates of ligand binding and distribution were examined. The specific binding distribution volume (DVs) (Koeppe et al., 1991), the total tissue ligand distribution volume (DVtot) (Frey et al., 1991), and the nonsaturable (nonspecific plus free ligand) distribution volume (DVns + f) (Koeppe et al., 1991) were each estimated as follows:
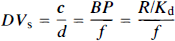
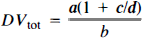

where BP is the binding potential (BP = Bmax/Kd), f is the free fraction of ligand in the tissue binding precursor pool, and Kd is the equilibrium binding affinity constant (Kd = kon/koff) in the notation of Mintun et al. (1984).
RESULTS
[11C]TRB distribution
Following intracarotid injection of high specific activity tracer (containing <0.3 nmol), [11C]TRB demonstrated protracted brain retention with gradual clearance over the experimental period (Fig. 4). The cerebral retention time of TRB was considerably shortened either after injection of low specific activity tracer (containing >6 nmol TRB) or when unlabeled scopolamine was given systemically prior to tracer injection.
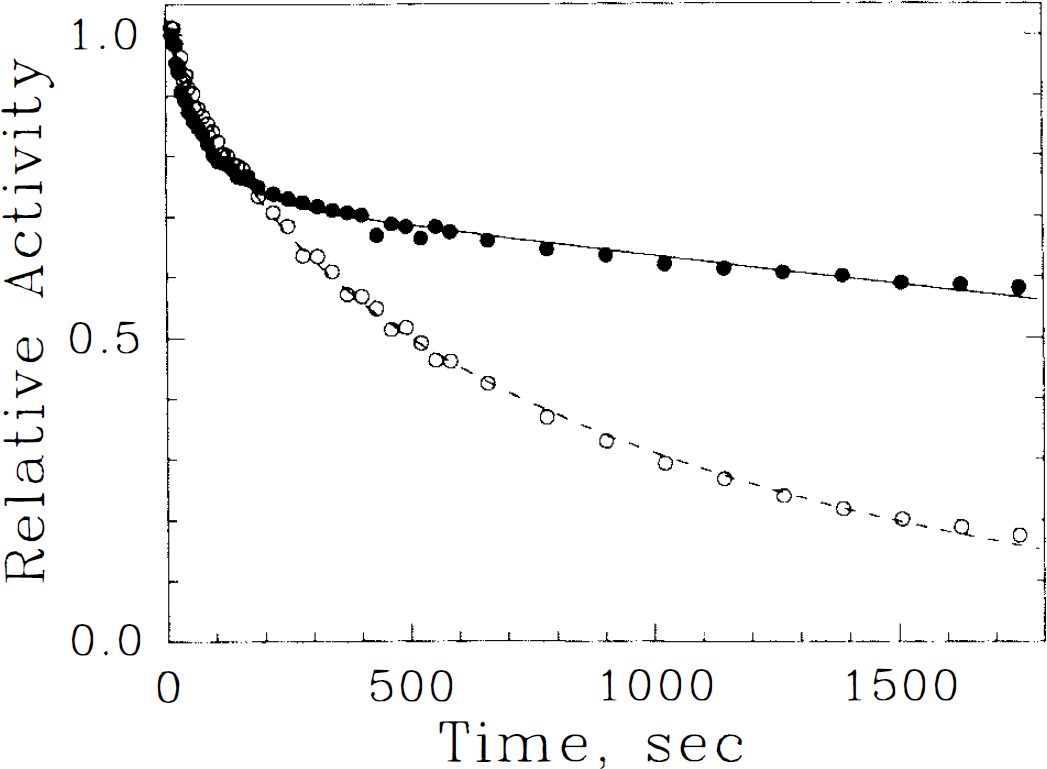
Tissue time–activity curves following intracarotid injections of [11C]tropanyl benzilate ([11C]TRB) in animal 2 with (open circles, dashed line) and without (filled circles, solid line) unlabeled scopolamine pretreatment. Individual scan measurements (symbols) and the fits to Eq. 5 (lines) are shown. Loss of TRB from brain is accelerated after muscarinic receptor blockade by the pharmacologic dose of scopolamine.
11 C-labeled TRB entered the brain readily following intracarotid injection. Estimates of its first-pass extraction (EF) ranged from 0.83 to 0.99 (average 0.90). Kinetic compartmental analyses of [11C]TRB distribution indicated clear resolution of two tissue compartments in the high specific activity studies (Table 1). The parameter estimates indicated predominance of receptor binding in the cerebral retention of TRB with DVs of ˜20 ml/g and a nonsaturable binding distribution volume (DVns + f) of ˜5 ml/g. Individual intercompartmental transfer rate constants indicated a forward binding rate (parameter c) approximately three times the magnitude of the tissue-to-blood clearance rate constant (parameter b); however, all of the primary and secondarily derived parameter values were within physiologically reasonable ranges and revealed adequate precision across repeated studies. In the instances of low specific activity injections or following systemic scopolamine blockade of muscarinic receptors (0.4 mg/kg scopolamine HCl i.v. 15 min prior to tracer injection), analyses revealed little effect on the model parameters unrelated to receptor binding. Only the forward binding rate parameter c, DVsp, and DVtot were altered, each demonstrating considerable reduction in comparison with the high specific activity studies.
Kinetic compartmental analyses of muscarinic ligand distribution in monkey forebrain
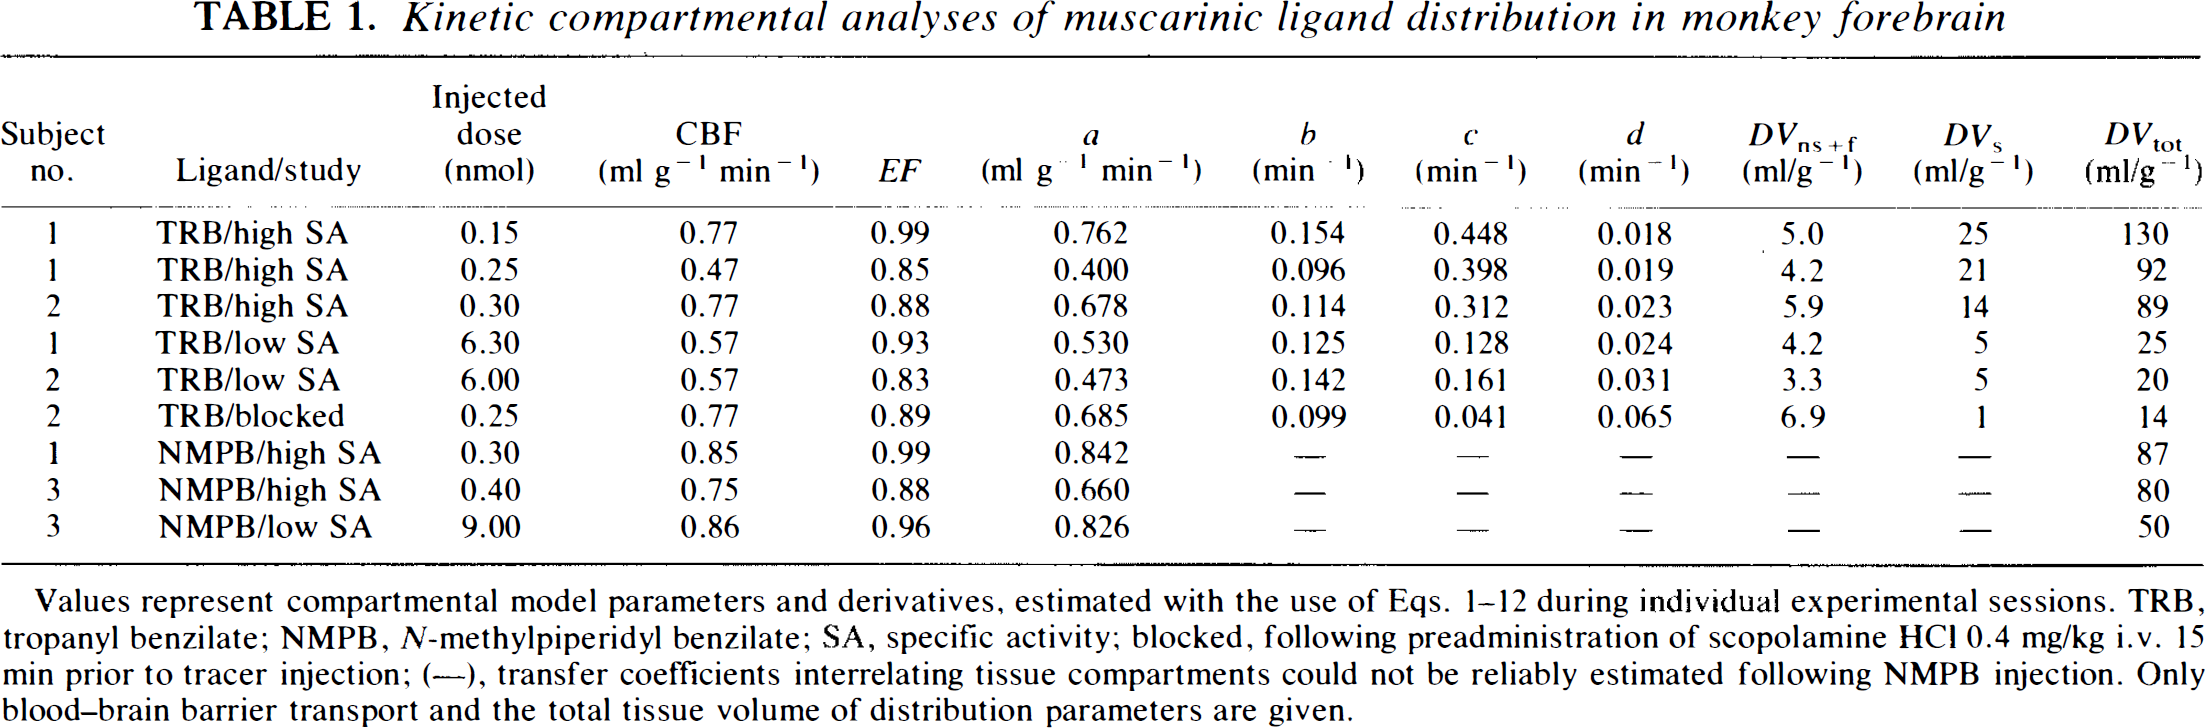
Values represent compartmental model parameters and derivatives, estimated with the use of Eqs. 1–12 during individual experimental sessions. TRB, tropanyl benzilate; NMpB, N-methylpiperidyl benzilate; SA, specific activity; blocked, following preadministration of scopolamine HCl 0.4 mg/kg i.v. 15 min prior to tracer injection; (—), transfer coefficients interrelating tissue compartments could not be reliably estimated following NMPB injection. Only blood-brain barrier transport and the total tissue volume of distribution parameters are given.
[11C]NMPB distribution
Similarly to [11C]TRB, [11C]NMPB was readily extracted by brain from the circulation (average EF 0.94). In distinction from [11C]TRB, [11C]NMPB was more rapidly lost from brain after initial uptake (data not shown), and kinetic analyses revealed inconsistent and physiologically untenable individual model parameter estimates when attempts were made to resolve two tissue compartments. In two of the three studies, a monoexponential tissue response function provided equivalent description of the tissue time–activity curves as did the biexponential response function in Eq. 5. As a result, only the tracer extraction and DVtot parameters are given for NMPB (Table 1). The DVtot of [11C]NMPB is less than that of [11C]TRB (˜85 ml/g for NMPB vs. 100 ml/g for TRB), in agreement with the qualitative observation of less avid brain retention of NMPB. After injection of low specific activity [11C]NMPB, there was considerable reduction in DVtot reflecting its sensitivity to receptor availability.
DISCUSSION
In the present studies, we have developed and evaluated a new animal model for characterization of in vivo binding site imaging radioligands. Use of direct intracarotid injection after acute transfemoral catheterization was introduced and employed extensively by Raichle and collaborators to determine blood–brain barrier penetration of radiotracers such as [15O]H2O and 11C-labeled alcohols (Eichung et al., 1974; Raichle et al., 1974, 1976). More recently, intracarotid injection has been applied in studies of the kinetic behavior of the single photon emission computed tomography perfusion tracers [99mTc]-T691 (Taylor et al., 1992) and [99mTc]bicisate (Friberg et al., 1994). Our modification of the acute catheterization procedure, with an implanted infusion port system, provides reliable access with less time and expense, eliminating the need for angiographic catheter positioning at each session. Overall, the chronic catheterization procedure was well tolerated by the monkeys and the port systems remained patent for at least 6 months, requiring only once- or twice-weekly flushing with heparinized saline.
Previous experience in our laboratories indicates that in vitro evaluation and systemic biodistribution studies in rodent models alone may be misleading with regard to the subsequent quantitative utility of radiotracers in clinical research applications. Kinetic aspects of radioligand distribution dictate both the form of the compartmental model and the mathematical approach to estimation of binding site density (Pennell and Frey, 1994), as well as the accuracy and precision of the measures (Koeppe, 1990). Thus, the method developed in our current studies may be of considerable importance early in tracer development. Specific factors governing the overall utility of a tracer for in vivo brain imaging include (a) uptake from blood to brain, (b) kinetics of interaction between the ligand and both specific and nonspecific binding sites, and (c) ligand metabolism. Of these, the first two are readily obtained with the current procedure.
Practical advantages of employing the current method early in the course of radioligand development include the ability to evaluate details of tracer kinetic distribution with relatively small amounts of radiotracer and the lack of need for measurement or metabolite correction of arterial blood. In contrast, kinetic brain distributions following systemic tracer injections require 5- to 10-fold higher administered doses of radioactivity to achieve comparable tissue counting statistics. More importantly, when administered by the intravenous route, the arterial tracer input function is often protracted and consists of both authentic tracer as well as its radiolabeled metabolites. Accurate kinetic analyses must therefore extend the period of experimental observation as well as rely on sampled, metabolite-corrected arterial input functions. These requirements add substantial time and cost to tracer evaluation, in some instances leading to agents with only limited potential for quantitative clinical use.
Determination of blood-to-brain transport
The method for estimation of blood–brain barrier transport in the current experimental design was initially developed for the study of radiolabeled water and alcohol extractions (Eichung et al., 1974; Raichle et al., 1976). It assumes that the peak tissue activity after bolus arterial tracer injection represents the intravascular concentration driving the diffusion into the tissue compartments. With this assumption, the first-pass extraction fraction (EF) can be estimated as the ratio of initially extracted tracer to the total peak activity. As opposed to prior methods employing direct tracer injection into the intracranial internal carotid, our more proximal site of injection and use of larger volumes to overcome the void volume of the reservoir system may have led to a more temporally dispersed arterial input. The effect of temporal dispersion on our parameter estimates is predictably greatest on EF and will result in increased estimates particularly for poorly extracted tracers (Taylor et al., 1992). In our formulation, we have combined this EF measure for the receptor ligands with immediately preceding estimations of CBF, resulting in a measure of the combined convective and diffusive contributions to the model transport parameter K1, but without the need for sampling of the arterial tracer input function. While errors in EF estimation result in linearly scaled errors in model parameter a and in DVns + f and DVtot, there is no propagation of this effect into estimates of the remaining model parameters or of DVs.
A limitation of the present experimental design is the potential for overlooking significant effects of plasma protein or blood cell interactions with the ligand. We have determined in human studies, for example, that the apparent first-pass extraction of [11C]TRB is in the range of 0.25–0.30 (Koeppe et al., 1994). This lower value than that found in the present studies may reflect reduced cerebral capillary surface area for diffusion in the human as opposed to the monkey brain or, more likely, may indicate that binding of TRB to blood components limits its brain uptake after intravenous injection. This latter speculation is further supported by the lipophilicity of the tracers (octanol-to-saline partition coefficients for free bases: TRB = 516, NMPB = 35; unpublished observations) and prior observations that tracers of similar lipophilic character are quantitatively extracted at the primate blood–brain barrier (Dischino et al., 1983). Tracer injections from buffered saline vehicle solutions, as conducted in the present studies, may provide an upper limit to ligand transport rates. Additional studies with tracer injected after incubation with both plasma and whole blood could be conducted to determine directly their effects on blood–brain barrier transport (Pardridge, 1979; Pardridge and Fierer, 1990). Alternatively, the binding of ligand to plasma proteins and blood cells can be estimated in vitro, providing a lower limit for free tracer fractions available for transport if dissociation of bound tracer is negligible during capillary transit.
Brain tissue distribution kinetics
The parameters b-d in our present formulation describe the tissue distribution and ligand binding kinetics and determine only the shape of the tissue time–activity curve (see Eq. 5). Thus, if the blood–brain barrier transport rate is not of interest, relative tissue distribution kinetics can be calculated independently of K1. This may be of use, for example, in screening ligands for suitability in “equilibrium” versus “irreversible” binding models (Pennell and Frey, 1994).
The substantial reductions in the forward binding rate model parameter and in both specific binding and total tissue volumes of distribution following receptor blockade and with low radiotracer specific activity verify appropriate saturability of binding parameters. Parameters b and d were relatively unaffected by these pharmacological interventions, as is expected, since they represent clearance of free ligand from tissue and dissociation of ligand from receptors, respectively.
In addition to appropriate sensitivity and specificity of parameters to available receptor numbers, the relative and absolute values of the tissue distribution rate parameters for [11C]TRB are in good agreement with those determined in kinetic analyses of human brain following intravenous injection. The mean k4 value of 0.02/min in the present studies is identical to that determined in humans (Koeppe et al., 1994). Also in close agreement with the human study is the ratio of c to b, which ranged from 2.7 to 4.1 in the current high specific activity studies and is 2.5–3.5 in the human. The present results further suggest that [11C]NMPB, in comparison with [11C]TRB, may have better sensitivity to receptor numbers in areas of highest concentration (cerebral cortex and striatum), owing to its lower DVtot. The more rapid kinetic interaction of [11C]NMPB with receptors, precluding kinetic resolution of specific binding from nonsaturable components, indicates that its distribution may be appropriately analyzed with reversible, equilibrium models. Our preliminary human studies with [11C]NMPB (Zubieta et al., 1992) support this interpretation.
It is of interest, and also of some concern, that we were able to easily detect the effects of reduced ligand specific activity on tracer kinetics. Occupancy of a significant receptor fraction is predicted following our low specific activity injections if one assumes that monkey forebrain muscarinic receptors are present at a concentration of ˜500 fmol/mg and that the internal carotid artery supplies ˜70 ml of brain tissue in M. nemistrina. Thus, there are an estimated 3.5 nmol of receptor and initially extracted radiopharmaceutical doses of 0.15–0.35 nmol in the high specific activity and 5–8.6 nmol in the low specific activity studies. In these latter instances, the modeling assumption of a constant receptor availability, and thus of constant rate coefficients in the compartmental model, is violated. Accounting for receptor saturation effects on the model parameters requires assumption that the total tissue receptor concentration (Bmax) is equal to the unoccupied receptor concentration (R) at the beginning of a scan in the absence of significant occupancy by endogenous substances (neurotransmitter) or unlabeled drugs. If only a small fraction of the available receptors become occupied during the experiment, R remains essentially constant during the study and Eq. 3 is valid. If, however, significant receptor occupancy occurs, R becomes time dependent. The saturability of the specific binding tissue compartment Cs and effect on model parameter c can be expressed as
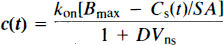
where SA is the ligand specific activity, Bmax is the density of free receptors at the beginning of the experiment (Rt = 0), and Cs(t) is the concentration of specifically bound ligand at time t postinjection. We evaluated the nonconstant coefficient differential equations governing receptor-saturating conditions with numerical integration (data not shown), but found, as reported previously by Mintun et al. (1984), that the data were described equally well by the constant coefficient model (no improvement in residuals or reduced X2 with the nonconstant coefficient model). Hence, analyses of the time–activity curves alone following carotid tracer injection will not exclude the possibility of partial saturation due to low tracer specific activity. It is thus important to accurately estimate both injected tracer and available receptor specific activities in these studies.
Summary
In conclusion, the intracarotid injection method is suitable for kinetic evaluation of receptor ligands at an early stage in their development. It has the advantages of minimal invasiveness after initial surgical port implantation and simple data analyses. Critical indicators that dictate whether a ligand is suitable for equilibrium binding or irreversible binding models, as well as indicators of relative sensitivity to binding site number (relative magnitudes of parameters b, c, and d), can be accurately determined. The ability to evaluate tracer kinetic behavior in detail, without the need for large-scale radio-syntheses or for metabolite correction of arterial plasma input functions, may considerably streamline the future evaluation of radioligands for potential in vivo application.
Footnotes
Abbreviations used
Acknowledgment
The authors are indebted to the staff of The University of Michigan Cyclotron/Radiochemistry Laboratories for assistance with tracer production and imaging. We additionally acknowledge with thanks the efforts of Mr. Phillip Sherman and Ms. Teresa Pisani for their assistance with animal care and handling. We are grateful to Dr. G. D. Hutchins for many useful discussions on kinetic model configurations and for his development of the curve-fitting software employed. These studies were supported by grants to the investigators from the U.S. Department of Energy and from the National Institutes of Health, designated DE-FG02–87ER60561 and P01 NS-15655, respectively. A.B. was on leave of absence from the Division of Nuclear Medicine, University Hospital, Zurich, Switzerland, and was supported by the Swiss National Science Foundation.