
Abstract
CBF, OEF, and CMRO2 images can be quantitatively assessed using PET. Their image calculation requires arterial input functions, which require invasive procedure. The aim of the present study was to develop a non-invasive approach with image-derived input functions (IDIFs) using an image from an ultra-rapid O2 and C15O2 protocol. Our technique consists of using a formula to express the input using tissue curve with rate constants. For multiple tissue curves, the rate constants were estimated so as to minimize the differences of the inputs using the multiple tissue curves. The estimated rates were used to express the inputs and the mean of the estimated inputs was used as an IDIF. The method was tested in human subjects (n = 24). The estimated IDIFs were well-reproduced against the measured ones. The difference in the calculated CBF, OEF, and CMRO2 values by the two methods was small (<10%) against the invasive method, and the values showed tight correlations (r = 0.97). The simulation showed errors associated with the assumed parameters were less than ∼10%. Our results demonstrate that IDIFs can be reconstructed from tissue curves, suggesting the possibility of using a non-invasive technique to assess CBF, OEF, and CMRO2.
Keywords
Introduction
Cerebral blood flow (CBF), oxygen extraction fraction (OEF), and metabolic rate of oxygen (CMRO2) images can be quantitatively assessed using positron emission tomography (PET) and 15O-labelled radiotracers. These images are essential for understanding the pathophysiological status of cerebrovascular disorders, and this imaging technique has been promoted as a clinical diagnostic tool. A measurement of these images requires administration of multiple 15O-labelled tracers,1–7 such as oxygen (15O2), water (
Computation of CBF, OEF, and CMRO2 images, however, requires input functions, which generally are obtained from arterial blood samplings. Such invasive samplings carry a small risk.
11
Therefore, the need for CBF, OEF, and CMRO2 examination may hinder subject participation. Blood sampling for the input also increase the burden on the operating doctor and the measuring technician, both by creating extra tasks during the scan procedure, and by producing the inherent risk of blood handling. There is, thus, a need for a non-invasive approach, such as an image-derived input function (IDIF). We have recently developed a method to estimate IDIF for CBF with
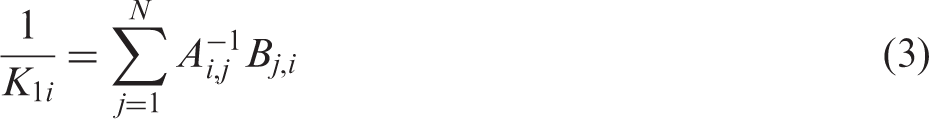
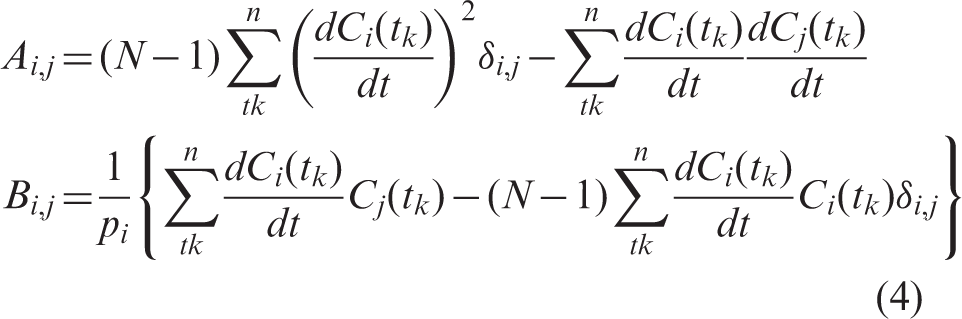
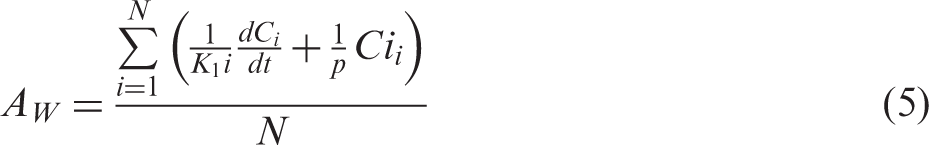
In this study, we have developed a method for reconstructing both
Materials and methods
Water IDIF estimation
The formula for

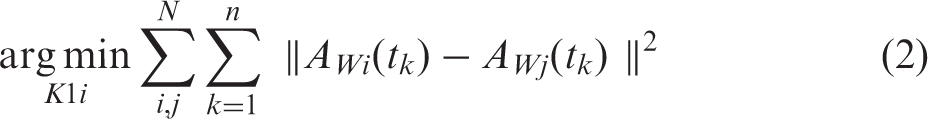
From the condition (2), the unknown parameters of K1
i
, can be estimated as:
We defined the
Oxygen IDIF estimation
We needed to implement two factors for the O2-IDIF: one is the metabolic product of oxygen, namely, recirculating water; the other is blood volume. To derive the formula for oxygen phase IDIF with taking into account recirculating water, we assumed both oxygen and water kinetics simultaneously as (the index i was omitted for simplicity):
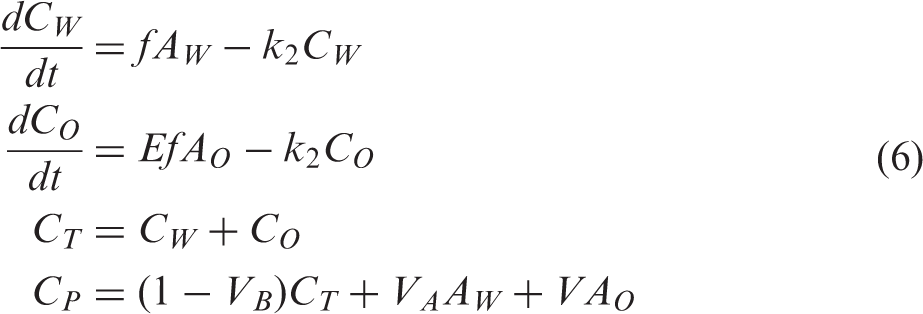
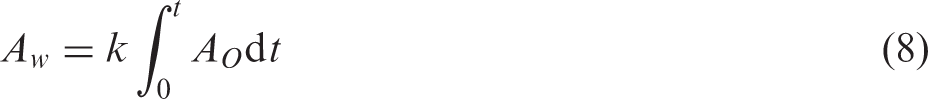
The recirculating water generation can be expressed with a generation rate, k:
15
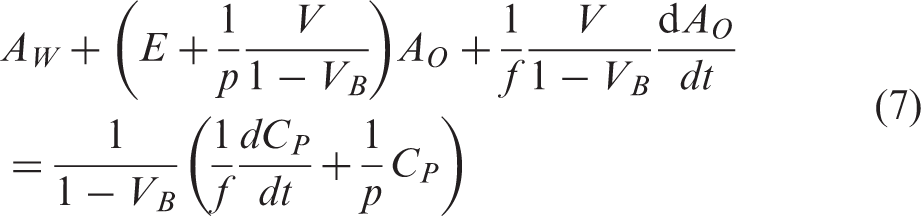
We can approximate the (1 − VB) term as 1, because the blood volume term is negligible, i.e. typically around 0.04 mL/g. Then combining equation (7) with equation (8) becomes:
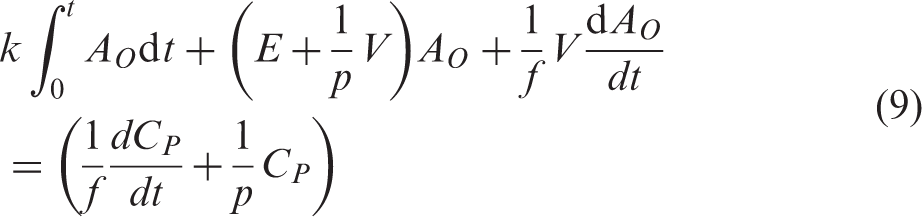
After solving this differential equation, we obtain:
Subjects
Subjects were retrospectively selected from a clinical database at random in our hospital. All subjects received PET examination due to suspected cerebrovascular disorders involving stenosis or occlusion in the internal carotid or middle cerebral artery, and Moyamoya disease (n = 24, 4 females and 20 males, weight = 64.3 ± 11.8 kg, age = 61 ± 18 years).
PET measurement protocol
The rapid PET protocol for CBF, OEF, and CMRO2 was applied,9,10 as was described in our previous article. 16 Briefly, PET acquisition was carried out in 2-D mode using a PET scanner (ECAT HR+, Siemens-CTI, Knoxville, TN, USA). Two tracers, 15O2 (3000 MBq, 60 s duration) and C15O2 (3000 MBq, 60 s duration), were administrated in sequence, with a 11-min interval during the single PET scan with a total exposure of 780 s (6 × 10 s, 6 × 20 s, 3 × 30 s, 3 × 120 s, 12 × 5 s, and 9 × 10 s). During the scan, arterial blood was manually sampled at the start of each scan frame. The radioactivity concentration was measured using an ARC-400 well counter (Aloka, Tokyo, Japan).
All procedures and the investigation performed in this study involving human participants were approved and in accordance with the ethical standards of Kagawa University Human Subjects Ethics Committee (Heisei27-098). Informed consent for the present examination with arterial blood sampling was obtained from all patients before the examination.
Data processing
Dynamic sinogram data were corrected for dead time, random, and the radioactive decay, in addition to detector normalization. Images were reconstructed by the filtered back-projection method with a Hann filter with 9 mm FWHM. Attenuation correction was applied by the transmission-based map. Scatter correction was also applied by the single scatter simulation method. The reconstructed image consisted of a 128 × 128 × 63 matrix with a pixel size of 1.71 mm × 1.71 mm ×2.45 mm and with 39 frames.
Measured arterial blood TACs were calibrated to the PET scanner, and separated into oxygen and water content after correcting for delay and dispersion,9,10,17–19 and used as measured arterial input functions (MAIFs).
Image-based input estimation
The input estimation was performed using images without decay correction condition. Tissue TACs were extracted from all pixels in the reconstructed image beyond the level of the nasal cavity. All TACs with AUCs in water phase above a threshold of 10% from the maximum one were used. The extracted TACs were divided into 500 sub-groups according to their AUCs, and the divided TACs were applied for the following IDIF estimation. Additional details are described in our previous study. 12
A schematic diagram of the IDIF estimation procedure is presented in Figure 1. To estimate IDIFs for oxygen and water, the applied tissue TACs were separated into water and oxygen contents (Figure 1(a)). To separate the tissue TACs, we first estimated oxygen input by applying the input estimation method for water using the applied tissue TAC during 0 to 660 s, assuming p = pO = 0.32 mL/g, because uptake of oxygen in normal is around 0.4 and the p value in oxygen phase when applying water kinetics would be pO = fE/k2 = 0.8 E mL/g. The estimated input was extrapolated to the end of the scan time with a liner function. Using the estimated input and K1 values, tissue TACs were generated; these generated TACs were subtracted from the corresponding applied tissue TACs in the phase of CO2 inhalation. The subtracted TACs were used for Schematic diagram of the procedure for estimating image derive input function. TAC: time activity curve; IDIF: image-derived input function; RW: recirculating water; AUC: area under the curve. (a) Applied tissue TACs were separated into water and oxygen contents; (b) H2O-IDIF estimation; (c) primal O2-IDIF estimation; (d) generation of RW tissue TAC; (e) estimation of E; and (f) O2-IDIF estimation.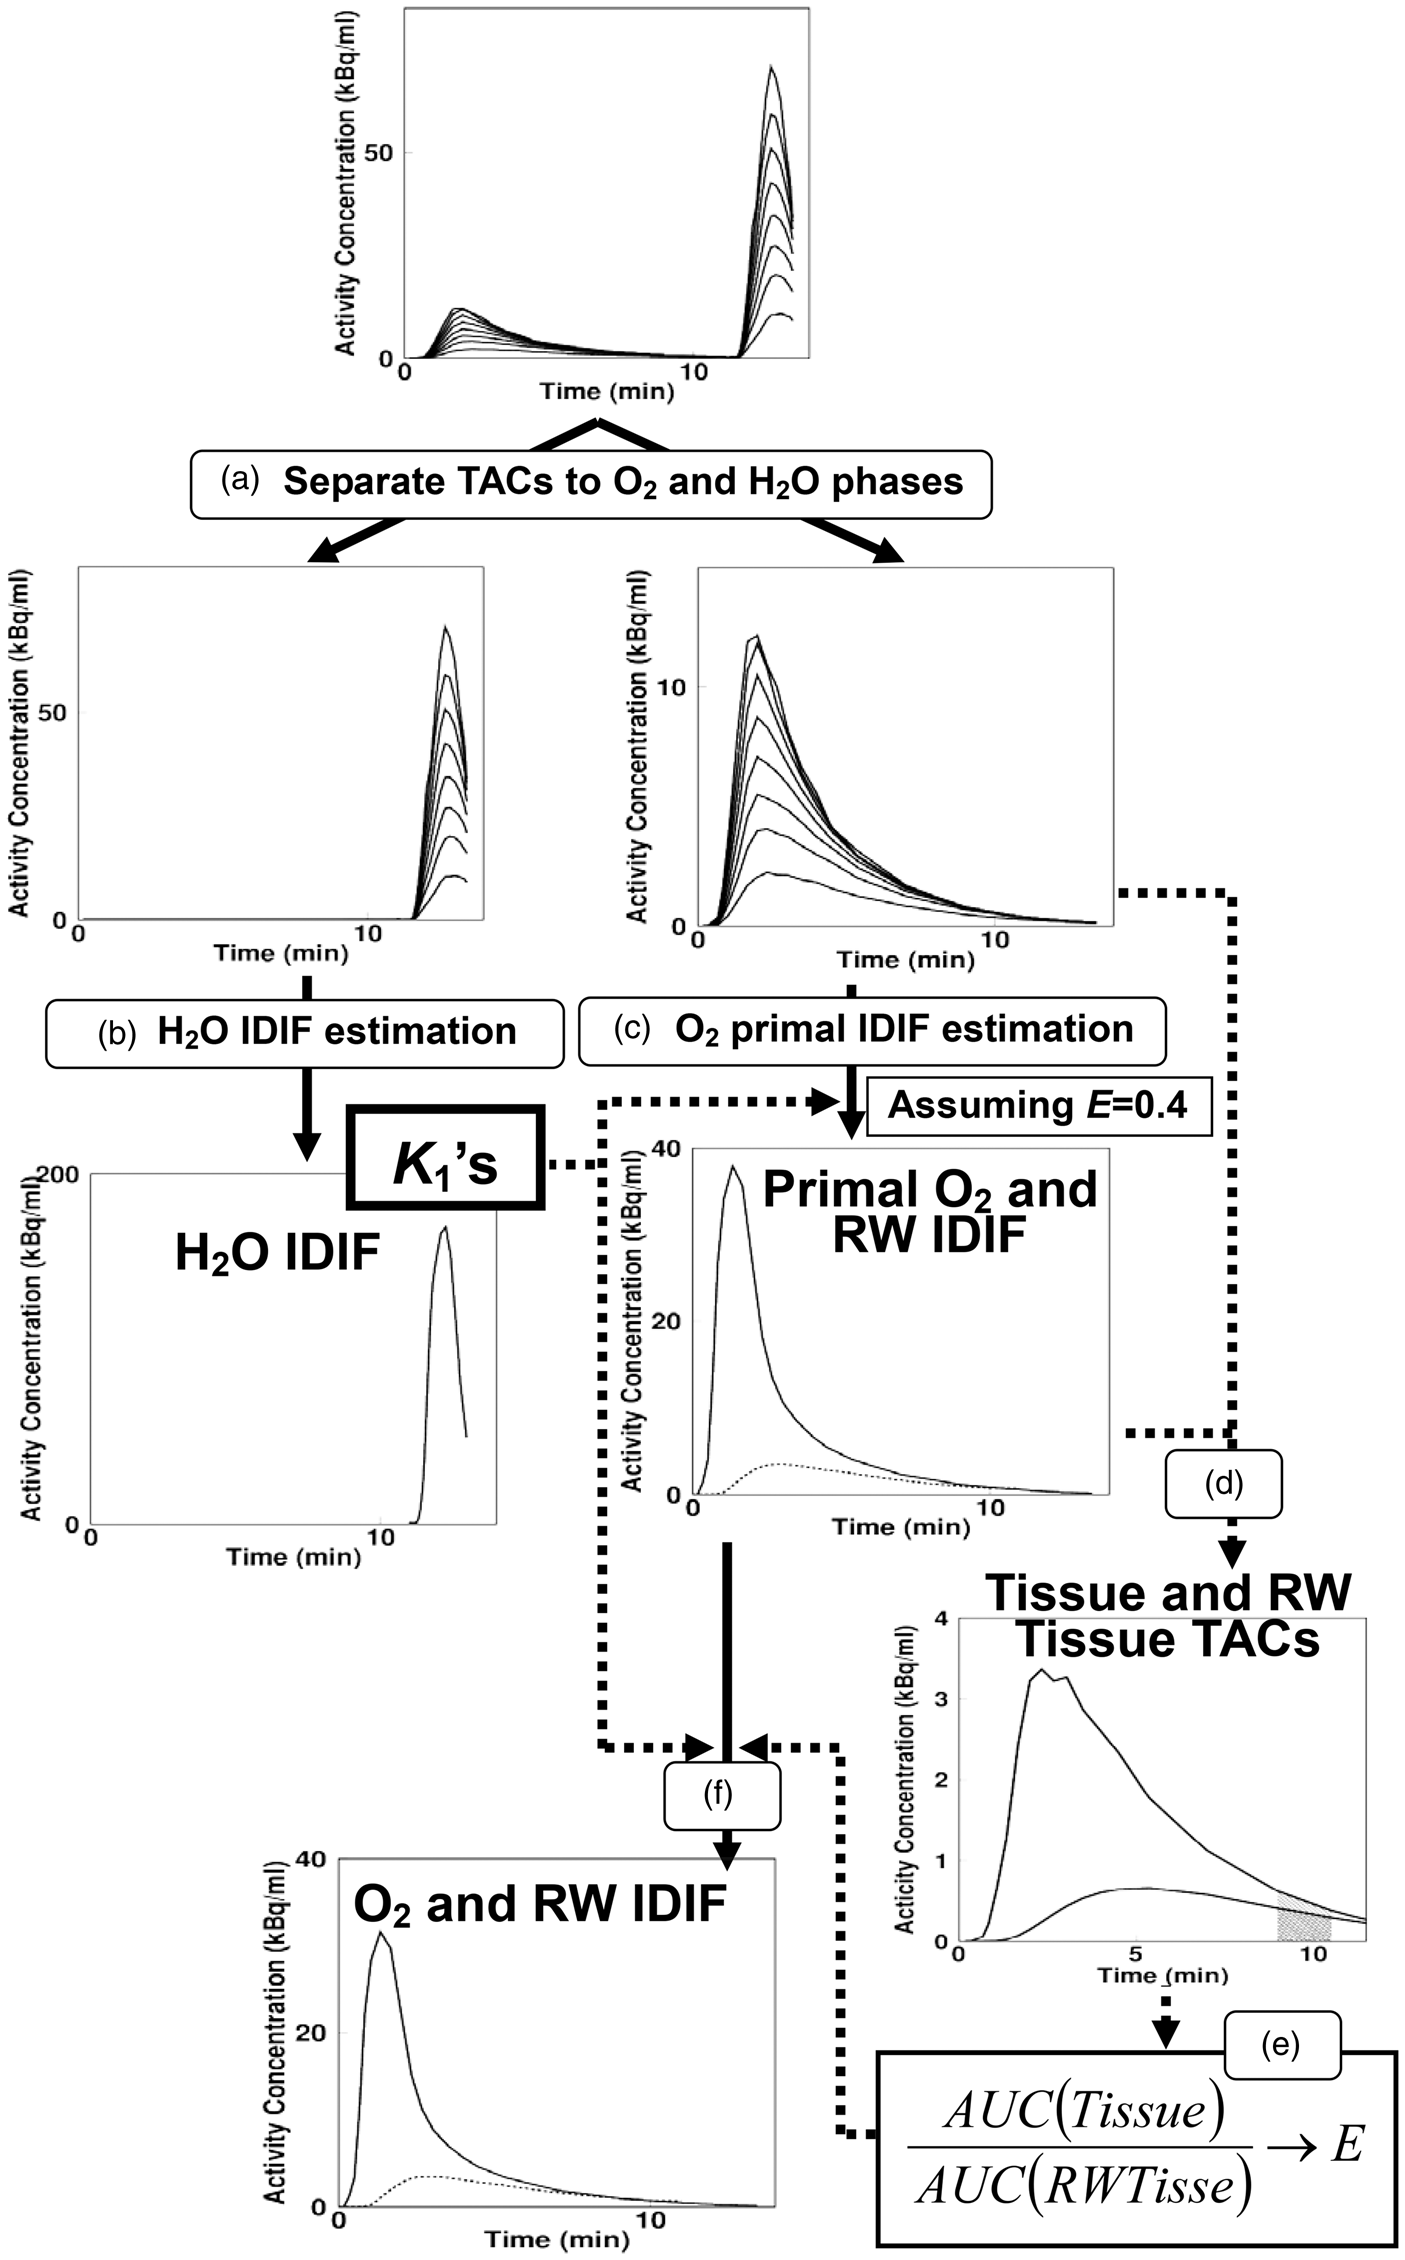
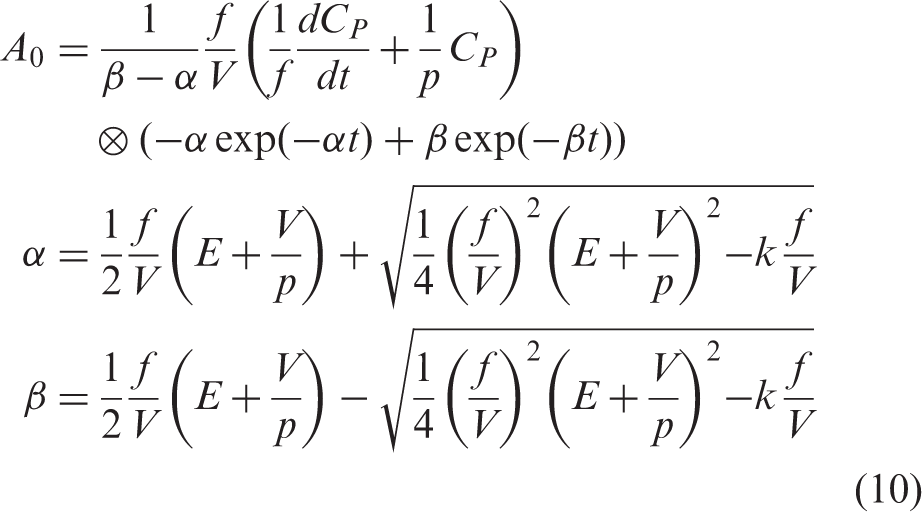
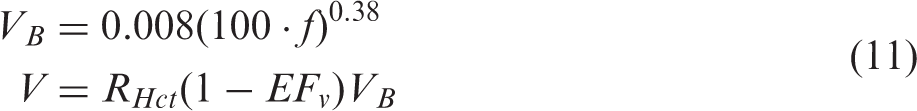
The original tissue TACs in the oxygen phase and the generated TACs after CO2 inhalation were connected and used for the following 15O2-IDIF estimation. Regional oxygen inputs were estimated from equation (10) by applying regional K1 values (f = K1 as defined above) from the above water input estimation (Figure 1(c)), using previously obtained k = 0.0722 min−1,15 assuming initially: E = 0.4, and assuming V as:2,20
In the next step, we estimated the E for extracted TACs using the primal recirculating water input as follows: Tissue TACs for recirculating water content corresponding to the extracted TACs were generated using the primal recirculating water input and estimated K1 values (Figure 1(d)). Areas under the curve (AUCs) were calculated for both the generated TACs and the extracted TACs, and their ratios were obtained. The relationship between OEF and the AUC ratio was obtained empirically from the present experimental study (see below) and used to estimate E for each applied tissue TAC (Figure 1(e)). For the estimated E and K1, oxygen inputs were estimated again using equation (10) for all the applied tissue TACs (Figure 1(f)). Next, the oxygen IDIF was obtained as the mean of the regional inputs and then, finally, the recirculating water IDIF was obtained.
Relationship between OEF and AUC ratio
The relationship between the OEF and the AUC ratio was obtained as follows. Using the dynamic PET images, primal oxygen and recirculating water IDIFs were estimated. Tissue TACs for recirculating water were generated in the oxygen phase, using the estimated primal recirculating water IDIF and estimated K1 values. Then, AUCs for the generated and applied tissue TACs were calculated during 510 to 630 s, and their ratios were obtained. The ratio (X) and E from MAIF-based OEF image were obtained and their relationships expressed as:
Data analysis
Two sets of CBF, OEF, and CMRO2 images were generated according to the DBFM formula; 10 one from MAIFs and the other from IDIFs.
We placed three region of interests (ROI), circular in shape (8.6 mm in diameter) in each of the bilateral parietal, frontal, temporal, occipital cortical regions, on white matter, and on cerebellar cortical regions; namely, 36 ROIs in total, in each subject on the obtained MAIF-based CBF image. Values of CBF, OEF, and CMRO2 were extracted from two sets of images for the ROIs and were compared between MAIF and IDIF using regression analysis and a Bland–Altman plot. The obtained values were also compared by the paired t-test. P < 0.05 was considered statistically significant.
Error analyses in the simulation
The present method of estimating IDIFs assumes that the partition coefficient, p, can be fixed as a constant, that the relationship between blood volume and blood flow can be expressed as in equation (11) in the oxygen input estimation, and that the generation rate of recirculating water, k, is fixed as a constant. It is not known a priori how these assumptions degrade the accuracy of the estimated IDIFs and the subsequent CBF, CMRO2, and OEF images. Moreover, tissue TACs for input estimation may contain variation in OEF values due to pathologic states, and also contain variations in regional appearance time of the input function. The accuracy of the estimated input could be affected by the degree to which these factors mix. A simulation study was designed to reveal the influence of the above elements on the accuracy of the current method.
We selected one set of arterial input functions from one of the clinical data sets. The selected inputs were treated as the ‘true input’. A distribution of CBF values for the whole brain was assumed to be same as in our previous study, 12 namely, the mean and standard deviation were 0.44 ± 0.14 mL/min/g. On the basis of the CBF distribution, we generated simulated tissue TACs using the kinetic equations in equations (6), assuming E = 0.4 and V as in equation (11). The number of the tissue TACs generated for one simulation set was 250,000. Gaussian noise was imposed on the set of tissue TACs generated, based on the estimated level applied in our previous study.12,21
We simulated the propagation of errors in V level and p to the IDIFs and their subsequent CBF, OEF, and CMRO2 estimations. Sets of tissue TACs were generated from the true input by changing the relationship between V and f in equation (11) from 0 to 3 times (indicated as V level) in right hand side, and changing p to 0.70 and 0.90 mL/g. The propagation of error in k in equation (8) to CBF, OEF, and CMRO2 estimation was simulated. Sets of tissue TACs were generated in the same procedure described above, using inputs generated assuming k as 0.060 and 0.085 min−1, each as true input in this case, where variation in k value was reported as 15%, namely: k = 0.0722 ± 0.0126 min−1.15
The influence of a mixture of regions with increased OEF using the current method was explored. Sets of dynamic images were generated by changing the mixture ratio of increased OEF = 0.7 region from 0% to 100% on that of OEF = 0.4. In addition, the influence of regional variation on appearance time of input in brain was simulated by mixing tissue TACs with varying the appearance time, for two cases, namely; mixing 2 s and −2 s time-shifted tissue TACs both with 25% ratio, and mixing 5-s delayed tissue TACs with 25% ratio, because previous studies suggested around ±2 s regional variation of the appearance time of the input in normal, and 5-s regional delay seems to appear in stroke patients.18,22,23
Using the generated set of tissue TACs, input functions were estimated, and CBF, OEF, and CMRO2 values were computed. Percent differences between the computed and assumed CBF, OEF, and CMRO2 values were presented.
Results
All IDIFs reconstructed in the present study, together with MAIFs are shown in Figure 2. The IDIFs were superimposable onto the MAIFs for all subjects. Ratios of AUC between IDIF and MAIF were 0.95 ± 0.03 and 1.00 ± 0.06 for water and oxygen inputs, respectively.
Estimated input functions for 15O2 (solid-red) and 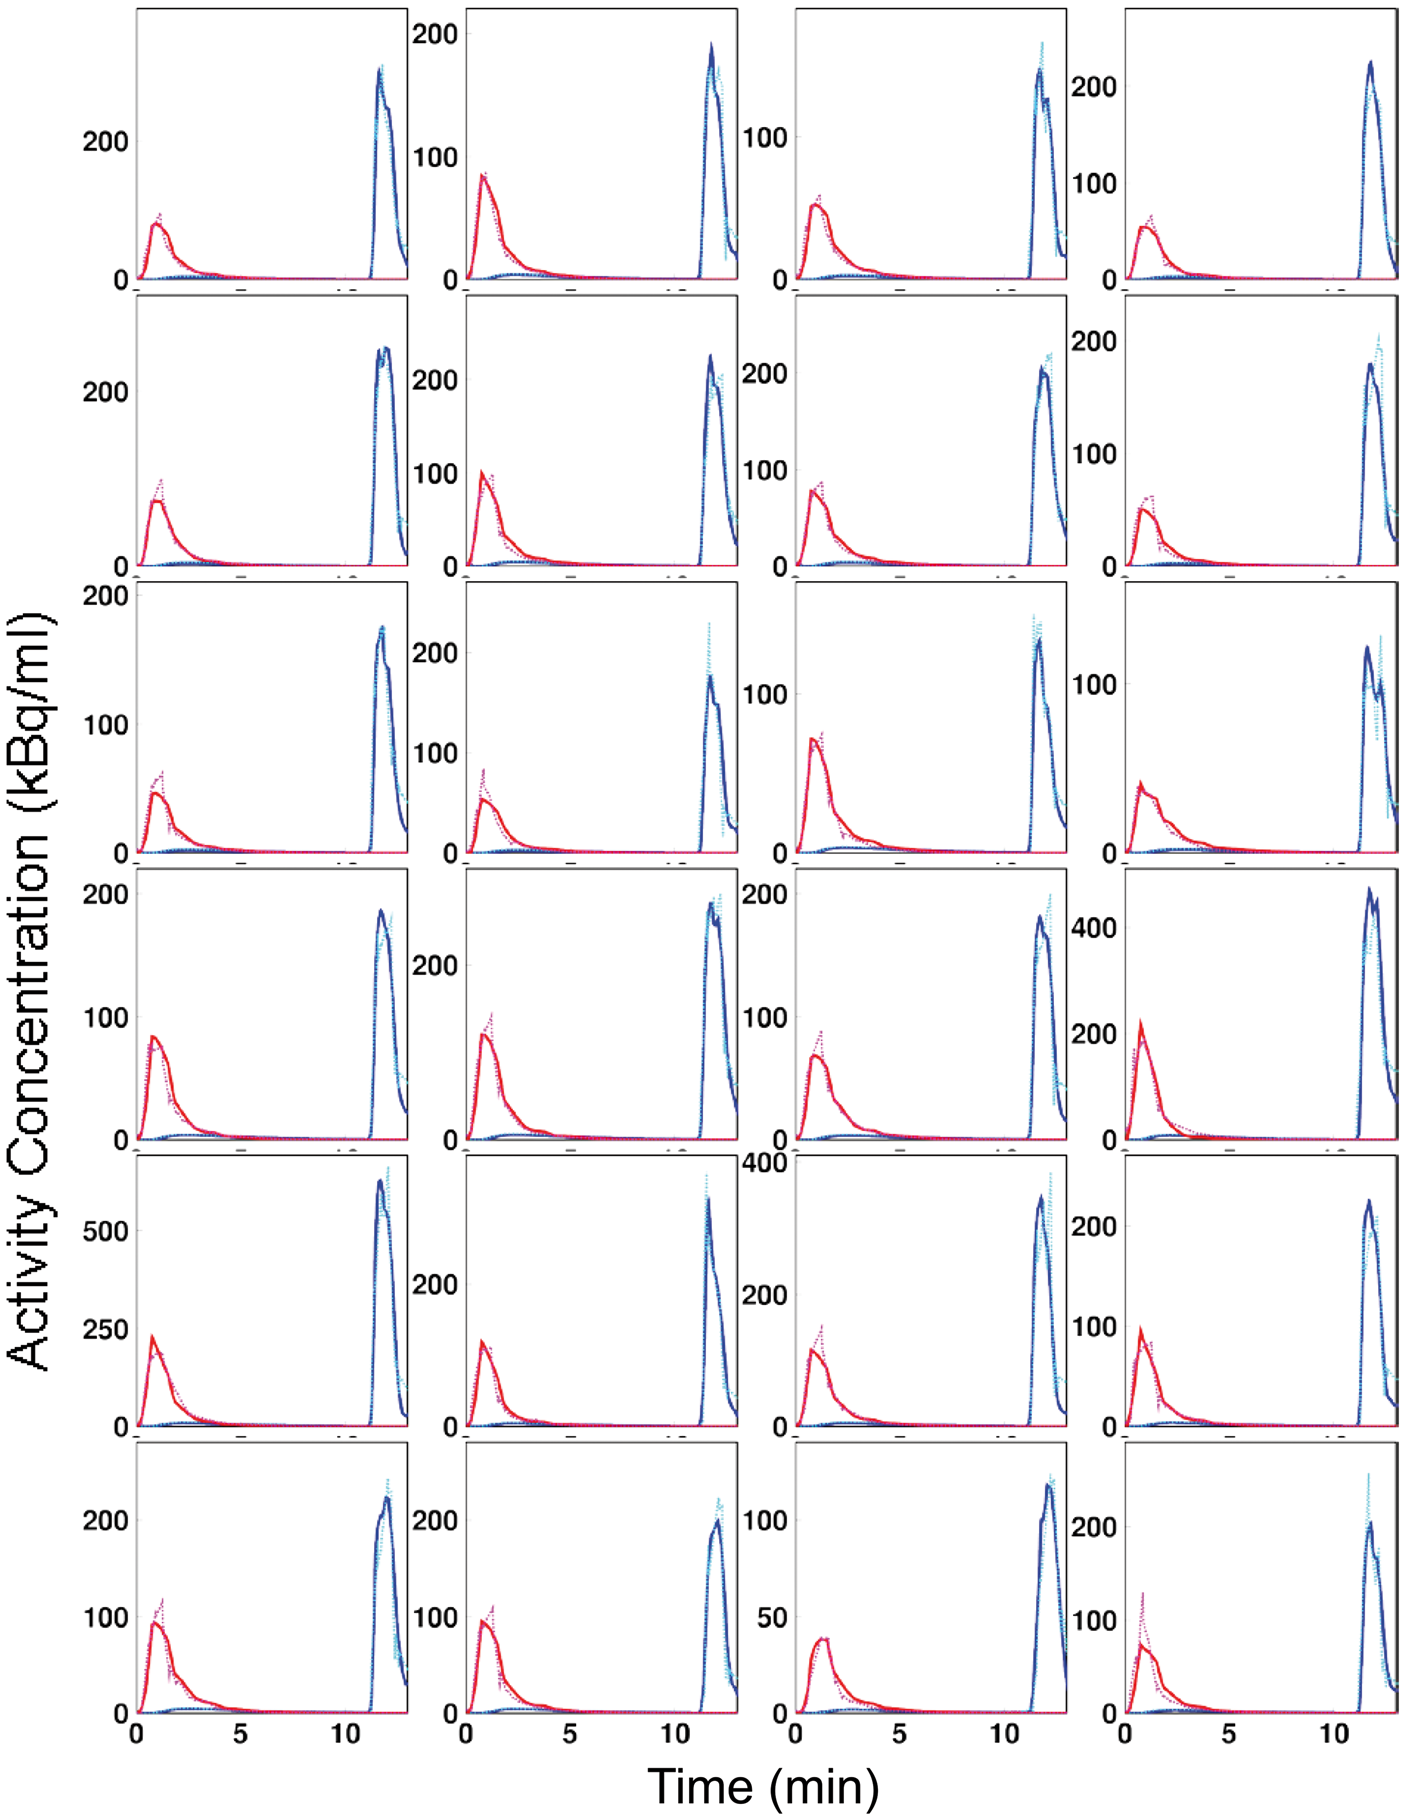
The relationships and Bland–Altman plots for the regional CBF, OEF, and CMRO2 values, as estimated using the IDIF versus the MAIF, are shown in Figure 3. Regression lines were: y = −0.01 + 1.05 x (r = 0.97, p < 0.001) and y = 0.001 + 0.94 x (r = 0.97, p < 0.001) for CBF and CMRO2, respectively. The plots demonstrate small over- or under-estimations by the IDIF with biases of −0.01 mL/min/g, 0.02, and 0.001 mL/min/g for CBF, OEF, and CMRO2, respectively. Paired t-tests showed no significant differences between the methods for CBF and CMRO2, however, the difference was significant for OEF. Differences in CBF, OEF, and CMRO2 values were −1.6 ± 7.7%, 2.8 ± 9.3%, and 2.1 ± 8.5%, respectively.
(a) Relationship (left) and (d) Bland–Altman plot (right) for CBF, (b,e) OEF, and (c,f) CMRO2 between image-derived and measured inputs, respectively. Regression lines were: y = −0.01 + 1.05 x (r = 0.97, p < 0.001) and y = 0.001 + 0.94 x (r = 0.97, p < 0.001) for CBF and CMRO2, respectively.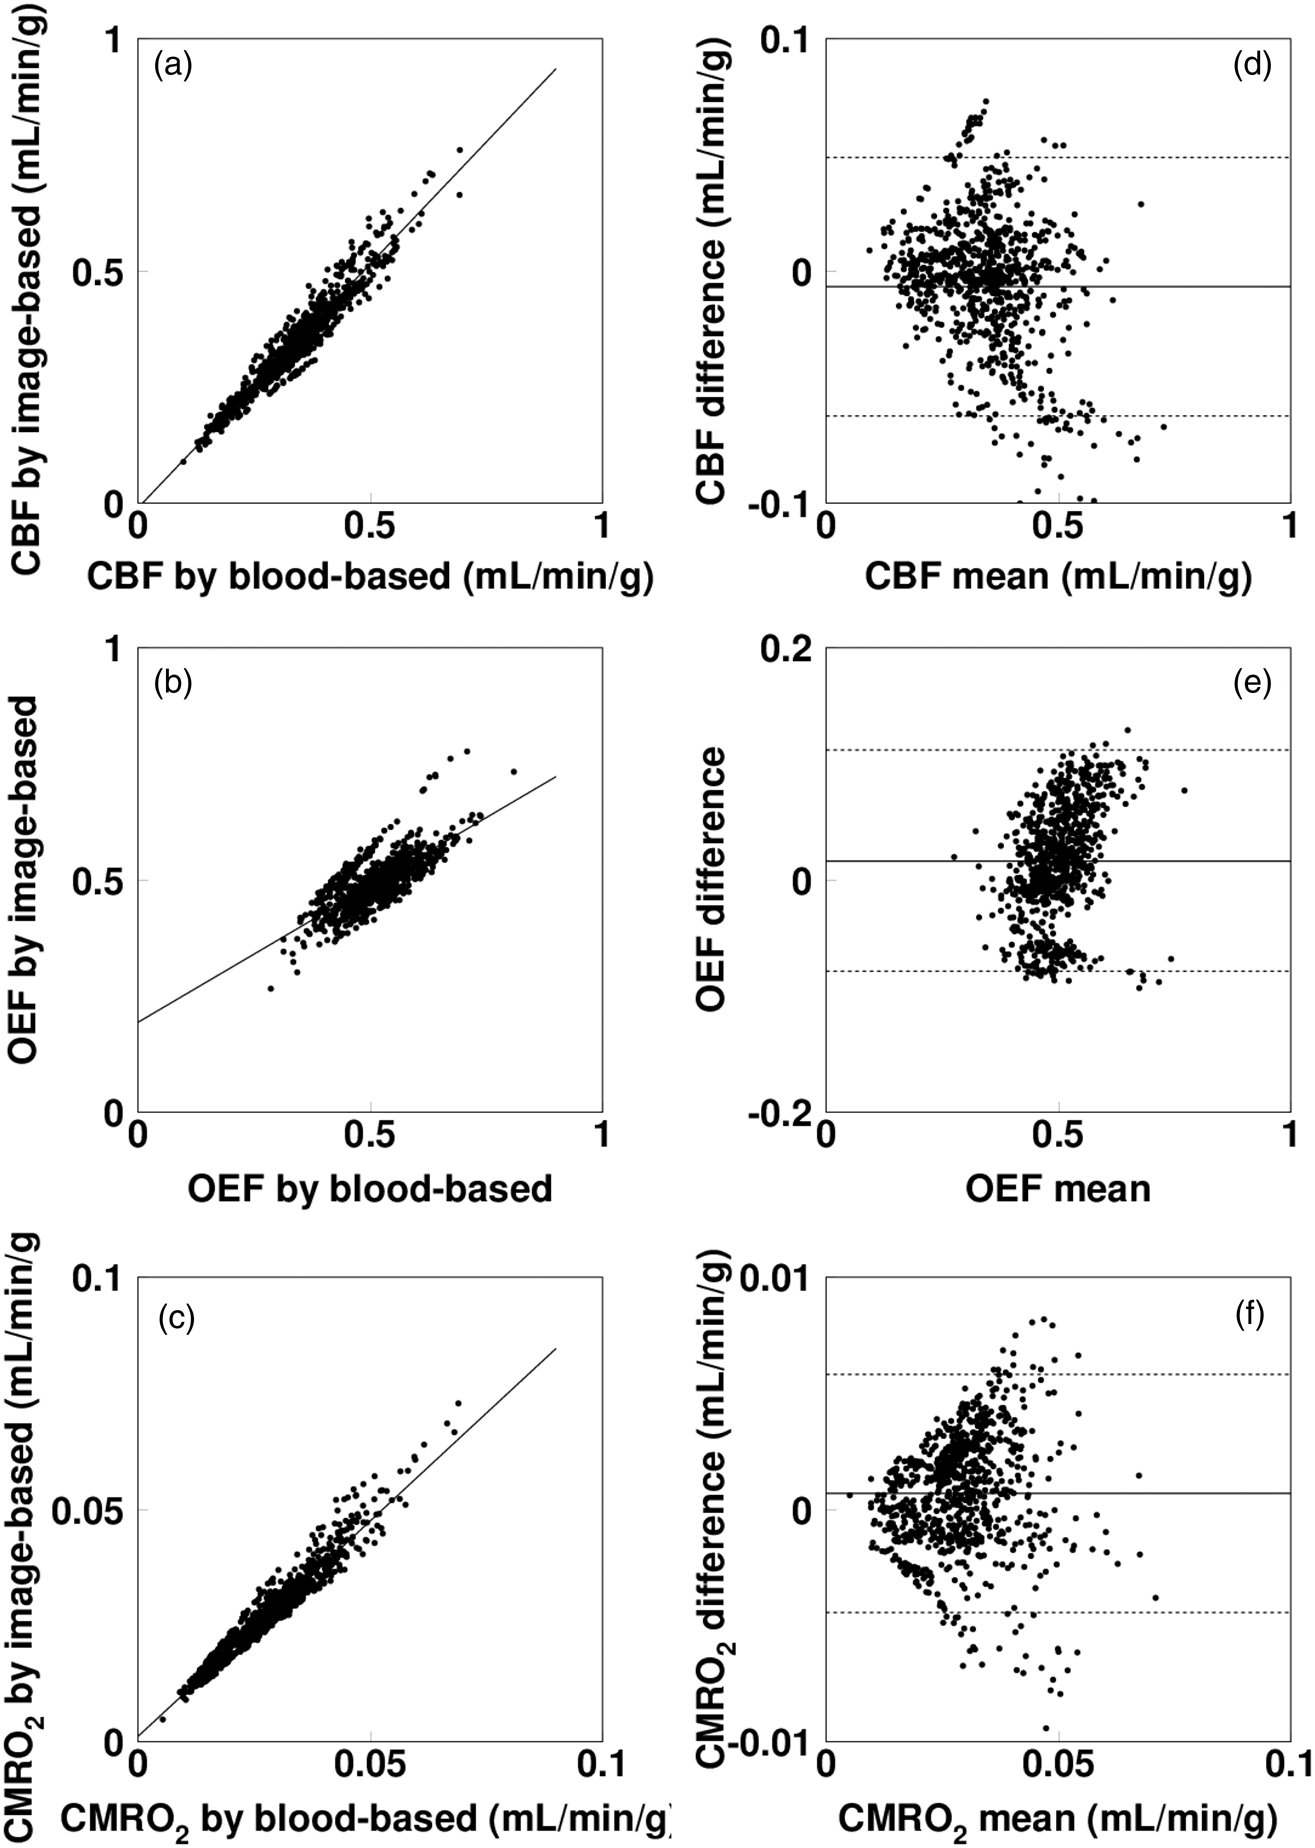
Representative sets of CBF, OEF, and CMRO2 images are presented in Figure 4. These images suggest similar maps are generated using the IDIF and MAIF methods.
Representative CBF, OEF, and CMRO2 images by measured (MAIF) and image derived input functions (IDIF), respectively.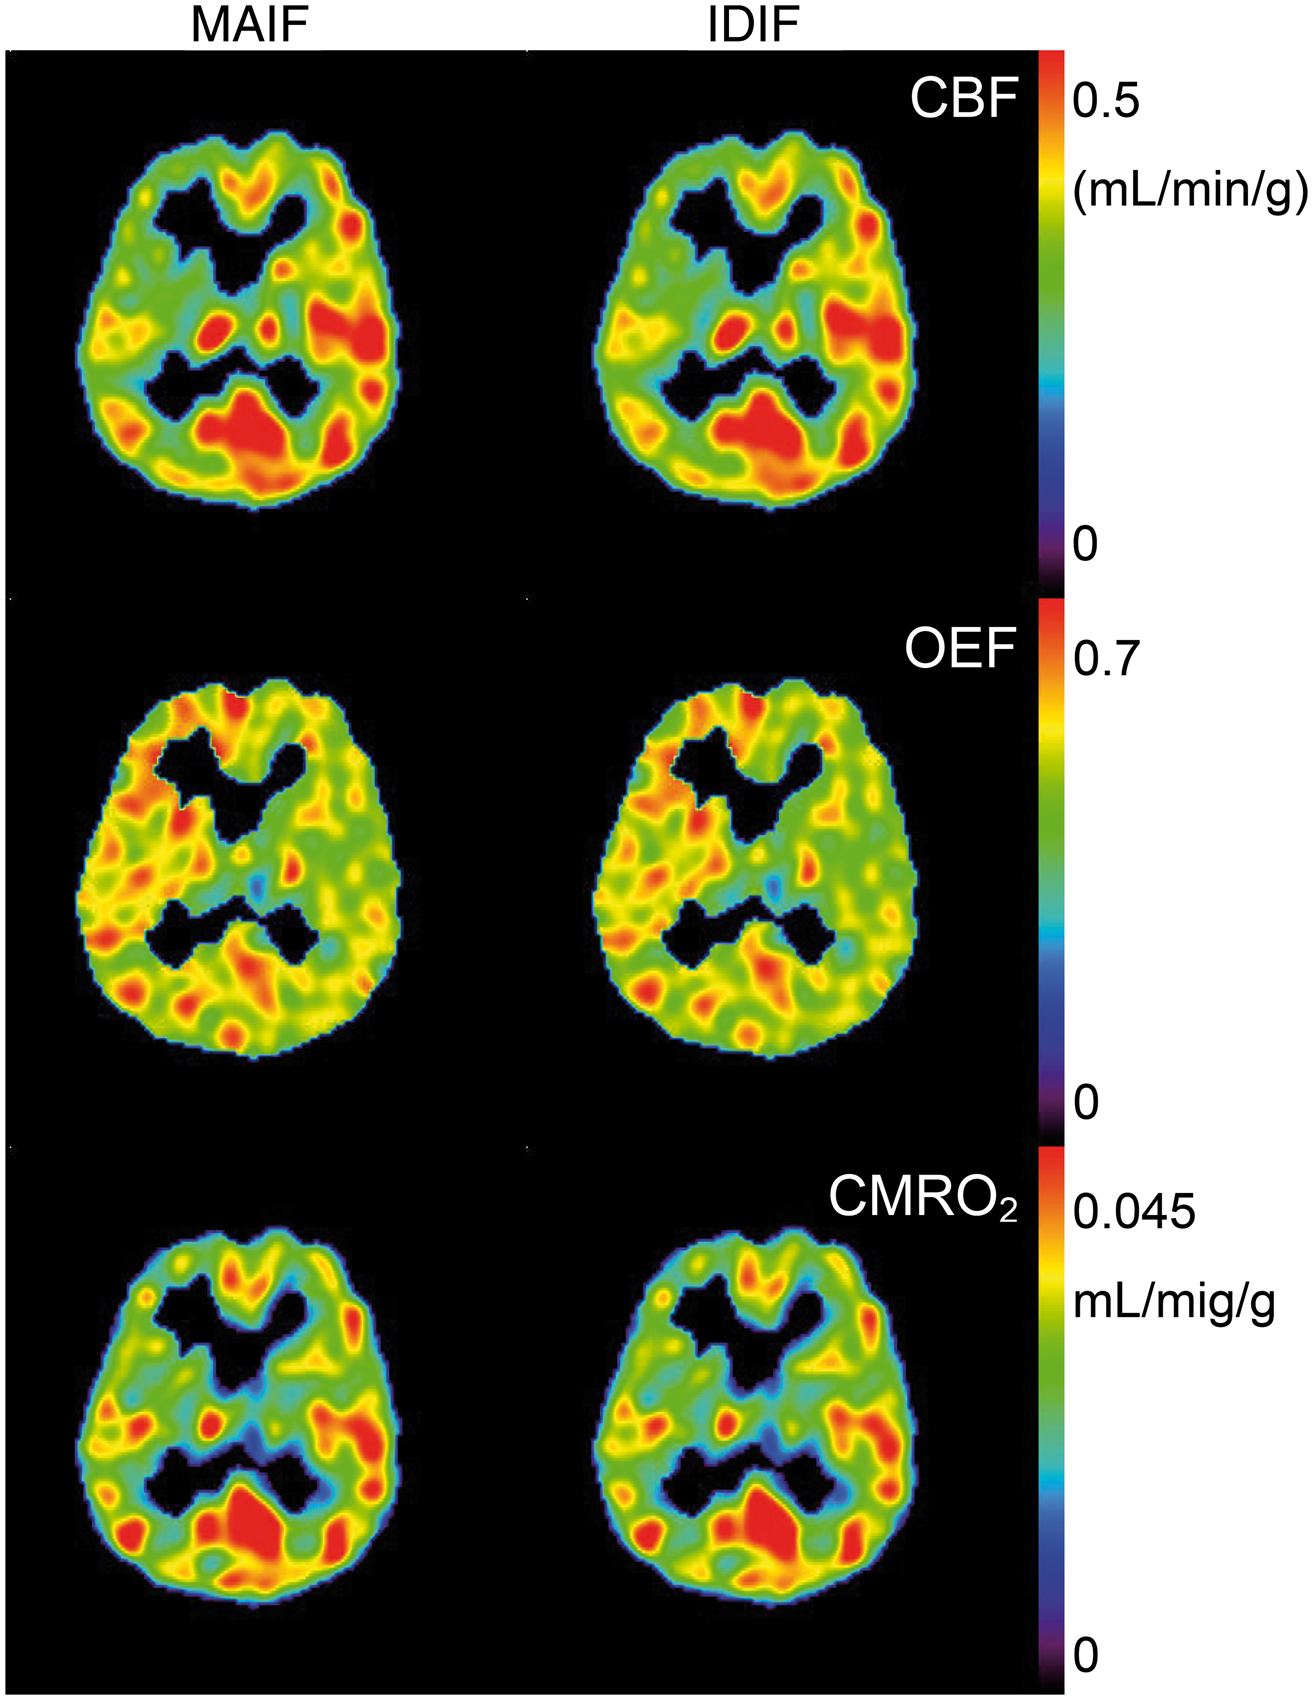
The biases due to changing p to 0.7 mL/g and 0.9 mL/g were 11% and −12% in the values of CBF and CMRO2, and 2% and −3% in the values of OEF, respectively. Those biases due to changes of the V level are presented in Figure 5, showing that the error in CBF was smaller than 5% when the V level was smaller than two-fold of the assumed value, while the errors in OEF and CMRO2 were similarly ∼10% when the level was 1.5 times and ∼20% when that was two-fold. The biases due to a 15% change in k values were less than 1% for CBF, and were 9% and 12% for OEF and CMRO2.
Error in CBF, OEF, and CMRO2 values propagated from difference of assumed scale of blood volume V, where scale of V means that ratio between simulated V and assumed V for IDIF estimation.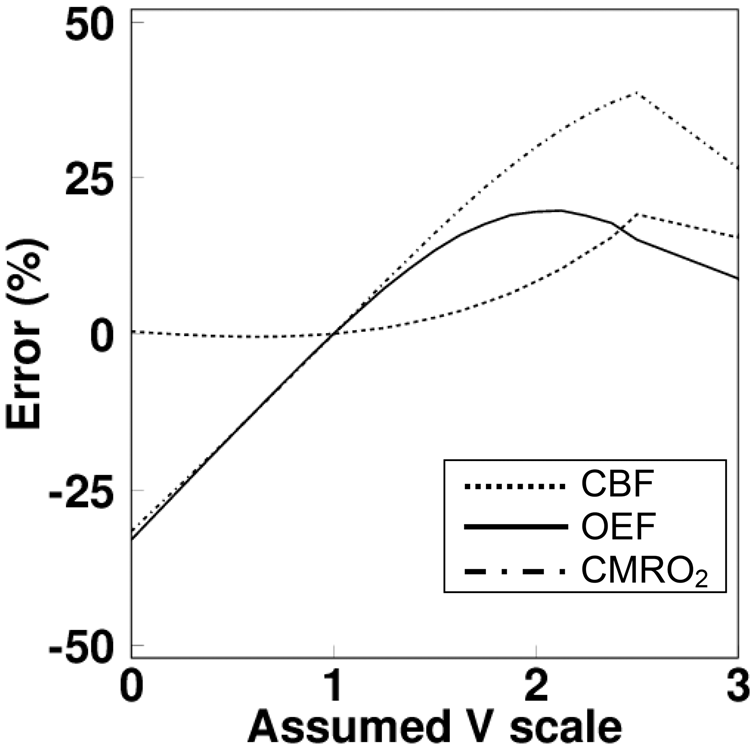
Figure 6 shows the bias in CBF, OEF, and CMRO2 as a function of mixture ratio of OEF increased region, with and without scale correction in the oxygen IDIF estimation. These results indicate that the estimated CBF, OEF, and CMRO2 values are properly estimated by applying the present scale correction method, but that bias was significant without the correction. The biases due to mixing the ±2-s appearance times were less than 1% in CBF, OEF, and CMRO2, and the bias due to a 5-s delay was less than 1% in CBF, and 5% in OEF and CMRO2, respectively.
Estimated degree of error in (a) CBF, (b) OEF, and (c) CMRO2 values as a function of the mixture ratio of OEF increased region, with (solid line) and without scale correction (dashed line).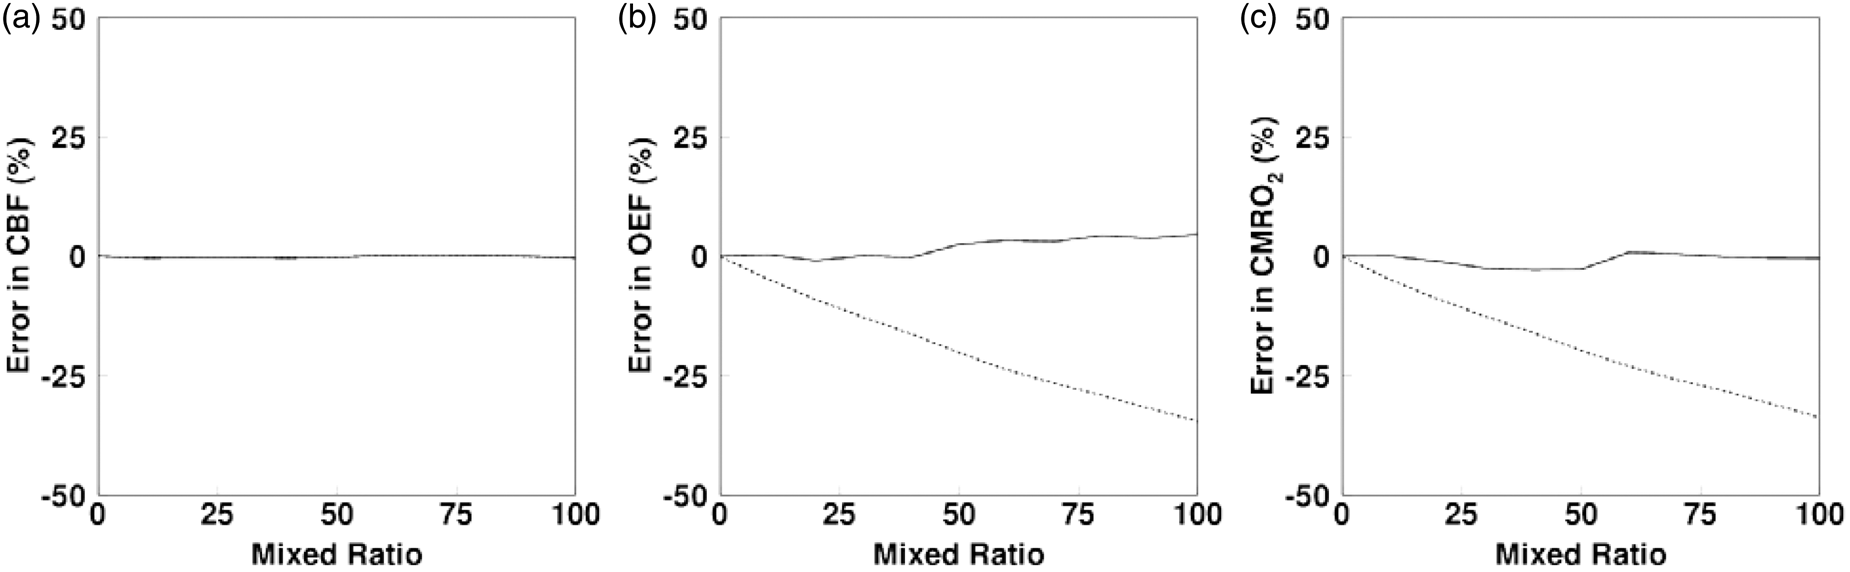
Discussion
We developed and tested a method for reconstructing the
The current approach estimated the input function obtained from multiple tissue curves to calculate CBF, OEF, and CMRO2 quantitative images from a PET image with rapid measurement.9,10 A high degree of overlap was observed between the IDIF and MAIF. Consequently, calculated CBF, OEF, and CMRO2 values were consistent between the two methods. Closer to our current analysis for
Some elements may degrade the accuracy of the input estimation in the current formulae. These include variations in the generation rate of recirculating water, k, the partition coefficient, p, blood volume (V) level, input appearance time, and mixture of increased OEF region depending on pathological states. To investigate the influence of those elements, we performed the simulation study. The size of error in CBF was around 10% when changing the p to 0.70 mL/g or 0.90 mL/g, and the sizes were smaller than this due to other elements. For CMRO2, the size of error due to change of p was similar to that in CBF, namely around 10%; that was around 10% when the k was changed by 15%; 20% when V scale was two-fold; 5% when 5-s delayed appearance time of input was mixed, and negligibly small due to mixing of increased OEF region. For the OEF, the size of error was 3% due to the change of p; this element was affected by both CBF and CMRO2 and the affects cancelled each other in OEF, obtained as a ratio of uptakes between 15O2 and
In the simulation, we generated tissue TACs without taking into account mixture or heterogeneity of tissue. In estimating IDIFs from measured images, those factors could deteriorate accuracy of estimated IDIFs. Application of partial volume correction would improve accuracy of the present IDIF estimation. Further study is warranted to investigate the influence from those factors after understanding mixture of tissue components.
The scale of the input function relies on the partition coefficient for water in the current formula,
12
and thus for subsequent oxygen. In addition, the scale of oxygen input was determined from the estimated amount of recirculating water in the primary phase. For scaling, we used empirically obtained relationships between the measured OEF and the ratio of AUCs in TACs generated using the primal recirculating water input estimated assuming OEF = 0.4, and measured tissue TACs. The scale of the primal inputs for oxygen and recirculating water becomes higher when OEF in the applied tissue TACs is higher than 0.4. Tissue TAC using the primal recirculating water input also becomes higher than true one, but the true tissue TAC for recirculating water cannot be obtained from experimental data. Thus, we estimated the AUC ratio in tissue TACs of generated recirculating water and measured TACs. The AUC was calculated at the end phase of oxygen, namely, during 510 to 630 s to reduce the dependence of generation rate of recirculating water. Most of administrated 15O2 in blood was expected to be metabolized to
In formulating for the oxygen IDIF, we started from the formulae equations (6) involving VB, VA, and V, but their relation is: VB ≠ VA + V, meaning that the formulae do not strictly describe the tracer distribution. However, all three terms are extremely smaller than 1 for normal human and we assumed that the formulae can be applied for CBF, OEF, and CMRO2 computation and also for the present IDIF estimation. In our formulation, we assume VB and VA can be ignored in approximation, and we only dealt with V term by assuming equations (11). The first relation in equations (11) is not always valid also, because it was not obtained in human, not obtained regionally, and not valid for regions with disorder. One possibility would be to estimate CBV by CO inhaled scan, but the method requires arterial blood sampling, which is not practical for the present purpose. As a whole, the method applied in the present study might not be the best one, but can be practically applied and would facilitate as the present experimental study showed.
The deviation of the differences in CBF, OEF, and CMRO2 values was 8–9% and ∼20% at most between the IDIF and the MAIF in the experimental study. The deviation involved not only errors due to the present method, but also errors in the measurement procedure for MAIF. The MAIF can be obtained using the blood sampling and counting method,33–38 but the obtained blood TAC requires cross-calibration between the PET scanner and the radioactivity counter, corrections for delay time and dispersion between the target organ and the sampling device,17,18 all of which are potential sources of error.
In conclusion, our results demonstrate that the arterial input functions for dual-tracer approach can be estimated directly from tissue time–activity curves obtained through rapid dual tracer 15O2-C15O2 (H15O2) PET imaging. The CBF, OEF, and CMRO2 values calculated by the estimated input function were consistent with those obtained using the measured input function, suggesting that the rapid CBF, OEF, and CMRO2 measurement may be performed in noninvasive fashion.
Footnotes
Funding
The author(s) disclosed receipt of the following financial support for the research, authorship, and/or publication of this article: NK, YY, and YN were supported by the Ministry of Education, Science, Sports and Culture of Japan, a grant-in-aid for JSPS KAKENHI (C), grant number 26460728 2014–2016.
Acknowledgements
The authors thank the staff of the Department of Radiology, Kagawa University Hospital.
Declaration of conflicting interests
The author(s) declared no potential conflicts of interest with respect to the research, authorship, and/or publication of this article.
Authors’ contributions
All authors contributed substantially to the scientific process leading to this manuscript. NK, YM, YY, TH, and YN participated in the study design and the data analysis. NK and YM performed the image analysis and simulation. YM, HY, and YY acquired data on the subjects. NK drafted the manuscript. All authors read and approved the final manuscript.
Ethical approval
The investigation of the present study was approved by our University Human Subjects Ethics Committee (Heisei27-098).
Informed consent
Informed consent for the present examination with arterial blood sampling was obtained from all patients before the examination. The present study for validation was a retrospective one; for this type of study, formal consent is not required.
References
Supplementary Material
Please find the following supplemental material available below.
For Open Access articles published under a Creative Commons License, all supplemental material carries the same license as the article it is associated with.
For non-Open Access articles published, all supplemental material carries a non-exclusive license, and permission requests for re-use of supplemental material or any part of supplemental material shall be sent directly to the copyright owner as specified in the copyright notice associated with the article.