
Abstract
Although brain ischemia has been extensively studied using diffusion-weighted magnetic resonance imaging, most studies performed so far have not had adequate time resolution to follow the temporal changes in the water apparent diffusion coefficient (ADC) in hyperacute ischemia. Using diffusion echo planar imaging, we obtained ADC maps (calculated from measurements made with 8 b-values) with a time resolution of 43 s in a feline model of global brain ischemia and reperfusion. Different protocols were performed: 10-min hypoperfusion, 10- and 22-min ischemia followed by reperfusion, and cardiac arrest. ADC values were obtained from white matter of the internal capsule and from the thalamus. Cortical gray matter measurements were not deemed reliable due to the close proximity of CSF in the cortical sulci. Following occlusion, the ADC declined in the thalamus to <2 SD of its normal baseline value within 1.5–2.5 min. This decay was exponential with a time constant (τ ± SD) of 6.0 ± 2.6 min; no further decrease in the ADC was observed 10 min following ischemia. Following reperfusion, in animals that showed ADC recovery, the ADC began increasing immediately, returning to its preischemic value in ∼15 min. No significant ADC changes were observed during hypoperfusion. Following cardiac arrest, the decay of ADC was more rapid in the thalamus (τ = 2.6 ± 0.6 min) than in white matter (τ = 6.6 ± 1.8 min). We observed that the ADC at 40 min after cardiac arrest was similar to the ADC at 10 min after ischemia. Given that all animals subjected to 10-min ischemic episodes showed ADC recovery with reperfusion, doubt is cast on whether it is possible to define a threshold value of the ADC below which brain tissue is irreversibly damaged. Finally, despite variability in the time constants of the ADC decay induced by ischemia, the ADC values at 10 min were very similar in all the animals. This suggests that when blood flow is diminished sufficiently to induce an ADC reduction, differences in perfusion affect the rapidity of the decrease but not the final asymptotic value reached.
Keywords
Numerous experimental and clinical studies have demonstrated that diffusion-weighted (DW) magnetic resonance imaging (MRI), a technique in which signal intensity is influenced by the random translational motion of protons (Le Bihan, 1991), provides a previously unattainable noninvasive assessment of cerebral ischemia. Following the first study by Moseley et al. in 1990, a number of experiments have demonstrated that the apparent diffusion coefficient (ADC) of the water molecules in the ischemic tissue decreases before any signal intensity change is detectable in T2-weighted images. Experiments with reversible ischemia models have also shown that the ADC reduction observed during ischemia can be reversed after successful reperfusion (Mintorovitch et al., 1991; Minematsu et al., 1992; Bizzi et al., 1993), indicating that DW-MRI not only can reveal infarcted regions, but also can delineate the potentially salvageable tissue. Moreover, in the subacute stage of the infarction, when conventional T2-weighted imaging results are abnormal, DW imaging (DWI) is more specific than T2-weighted MRI in differentiating between ischemic and edematous regions (Helpern et al., 1993; Pierpaoli et al., 1993b) and thereby more accurate in delineating the extent of the infarct. DWI also identifies the progression toward the chronic infarction by showing a reelevation of the ADC, which is indicative of cellular lysis (Pierpaoli et al., 1993b).
Animal models have been investigated in the majority of the previous DW-MRI studies because DW-MRI is generally not available to users of clinical MR scanners. However, clinical DW-MRI has been implemented in a few centers, and several of the findings observed in animal models have been confirmed in human pathology. In particular, the identification of brain ischemia before changes were evident on conventional MRI (Warach et al., 1995) has been demonstrated. Accordingly, the clinical use of DW-MRI is viewed as very promising in that it offers a quantitative approach to the study of stroke physiopathology and the opportunity to monitor the efficacy of therapeutic trials.
The biophysical mechanisms responsible for the ADC changes associated with brain ischemia are not completely understood. Numerous factors have been suggested, including changes in brain temperature, cessation of brain pulsation, redistribution of water between the extracellular and intracellular compartments, and changes in membrane permeability. Whatever are the mechanisms responsible for the ADC changes, others have suggested that they are linked to a breakdown in energy metabolism (Busza et al., 1992; Back et al., 1994) or possibly to events occurring prior to complete ATP depletion (Kohno et al., 1995).
In this study, we present ADC measurements using DW echo planar imaging (EPI) in a well characterized feline model of global cerebral ischemia (Hossmann et ah, 1987). We reason that measuring the time course of the ADC should be helpful in identifying the pathophysiological events occurring during ischemia and reperfusion that are associated with its changes. Our diffusion measurements are acquired with a sufficiently high temporal resolution (43 s/map) to compare the temporal profile of changes in the ADC and in blood flow (Brunetti et ah, 1990), energy metabolism (Alger et ah, 1989; Behar et ah, 1989), and size of the extracellular space (Hossmann, 1971) previously obtained using this model. Moreover, the use of an imaging technique rather than localized spectroscopy (Davis et ah, 1994; Decanniere et ah, 1995) allows us to assess regional differences in the ADC response to ischemia as well as between different tissue types, i.e., white and gray matter.
METHODS
Animal preparation
Animal studies were performed under a protocol approved by the NINDS Animal Care and Use Committee. Adult cats (3.0–4.0 kg) were tranquilized with ketamine (15 mg/kg i.m.). After endotracheal intubation, the animals were anesthetized with 2.5% isoflurane in 40% O2 and 60% N2O, mechanically ventilated, and immobilized with a constant intravenous infusion of succinylcholine chloride (3–6 mg/kg/h). The tidal volume was adjusted to produce Pao2 of 3= 150 mm Hg and Paco2 of 35–40 mm Hg. Catheters were placed in a femoral artery and femoral vein. Body temperature was maintained at 37 ± 0.3°C by a circulating water heating pad placed around the body. These conditions were maintained throughout the subsequent surgery for placement of the arterial occluders and the MR studies, with the exception of the isoflurane concentration, which was lowered to 1% during the MRI procedures. Arterial blood pressure, heart rate, and expiratory CO2 were monitored throughout the study. Arterial blood samples were withdrawn periodically for measurement of pH and blood gases.
Ischemia
Global cerebral ischemia was produced by reversible intrathoracic occlusion of the innominate and left subclavian arteries, which supply both carotid and vertebral arteries in the cat. For this purpose, a midsternum thoracotomy was performed. The vessels, exposed at their origin from the aortic arch, were surrounded by pneumatic vascular occluders (In Vivo Metric, Healdsburg, CA, U.S.A.). The internal mammary arteries were permanently occluded by cauterization to prevent collateral blood supply to the subclavian arteries. The sternum was closed with sutures. The animal was placed in the magnet in a supine position with its head within the radiofrequency coil. The occluders were connected in parallel to a catheter that in turn was connected to a fluid-filled infusion bag through a three-way valve. Pressure was applied to the infusion bag, monitored by a sphygmomanometer, and set at the desired value. Occlusion was carried out by opening the connection between the infusion bag and the occluders and was terminated by closing this connection and allowing the occluders to deflate. No measures were taken to avoid the systemic blood pressure increase that occurs during occlusion (the “Cushing response”).
MRI
MR data were obtained with a GE 2.0-T Omega MR system (GE NMR Instruments, Fremont, CA, U.S.A.) with a horizontal clear bore of 35 cm. The system included a self-shielded gradient set (Acustar 290) capable of producing gradient pulses up to 4.0 G/cm. A home-built quadrature coil (13-cm diameter) was used as a radiofrequency transmitter and receiver. The animal was centered in the magnet/gradient system with the aid of T2-weighted MR images and not moved for the remainder of the study. The MR data were collected using a spin echo EPI sequence provided by the manufacturer (GE NMR Instruments) that was modified to acquire DW images. Imaging acquisition parameters were as follows: single coronal slice, 2.5 mm slice thickness, repetition/echo times of 2,700/120, two repetitions per image (5.4 s/image), 64-mm field of view, 66-kHz bandwidth, and 64 × 64 in-plane resolution. Sequential sets of eight images with different levels of diffusion weighting were acquired by varying the strength (0–3 G/cm) of two trapezoidal gradient pulses placed on both sides of the 180° pulse (Stejskal and Tanner, 1965; Taylor and Bushell, 1985; Le Bihan et al., 1986). These diffusion-sensitizing gradients were applied in the frequency-encoding (left-right) direction. They had a duration of 14 ms and were separated by a time interval of 37 ms. For each level of diffusion sensitization, the fe-value in the frequency-encoding direction was calculated by numerical integration of the sequence's gradient waveform (including the contributions of diffusion and imaging gradients) according to Le Bihan (1991). The resulting b-values were 1.6, 27.4, 90, 188, 323, 495, 703, and 947 s/mm2.
Experimental protocols
Twelve animals were studied. We used four different protocols in which the severity and/or the duration of the ischemia were varied. We refer to them as hypoperfusion, severe ischemia, prolonged ischemia, and cardiac arrest. The occluder pressure was set at 180 mm Hg for hypoperfusion and at 300 mm Hg for ischemia. These pressure levels were empirically established in earlier studies. For hypoperfusion we chose 180 mm Hg because it proved to be the minimum pressure level able to elicit a consistent and reproducible submaximal increase of the systemic blood pressure that lasted for the entire duration of the occlusion. An occlusion pressure of 300 mm Hg was chosen for ischemia because it is well above the systolic blood pressure, guaranteeing a complete block of circulation through the innonimate and left carotid arteries, leaving anastomosis with the spinal circulation as the only possible source for residual perfusion of the brain.
All 12 animals underwent the hypoperfusion protocol. The occlusion lasted 10 min and was followed by 25 min of reperfusion. After this initial hypoperfusion episode, the other protocols were performed on different subgroups of four animals each.
In the severe ischemia group, we performed two occlusions lasting 10 min, separated by 32 min of reperfusion. Images were collected for 30 min after the second reperfusion, and then cardiac arrest was induced by intravenous bolus injection of KCl (3 mEq/kg body wt). An additional set of images was acquired 40 min after the KCl injection. In this group, we assessed whether two consecutive ischemic episodes of the same duration and severity produced different ADC alterations.
The prolonged ischemia group had only one occlusion episode lasting 22 min followed by reperfusion. Images were collected for 40 min after reperfusion, and then cardiac arrest was induced by intravenous bolus injection of KCl. An additional set of images was acquired 40 min after the KCl injection. In this group, animals were heparinized (heparin sodium, 100 U/kg body wt i.v.) before the occlusion to minimize the possibility of intravascular coagulation of the stagnant blood during the lengthy occlusion. Epinephrine was also administered during reperfusion to counteract systemic hypotension (adrenaline chloride, 0.05 mg/ml i.v. bolus of 0.1 ml followed by slow i.v. infusion as needed to maintain the mean systemic blood pressure at values >100 mm Hg). This group was used to determine the asymptotic value of the ADC during prolonged ischemia and whether the time course of the ADC recovery following reperfusion was affected by the duration of the ischemia.
In the cardiac arrest group, we followed the ADC changes during complete brain ischemia. These animals, after the initial hypoperfusion episode, received no additional occlusions before cardiac arrest was induced by intravenous bolus injection of KCl. The image acquisition continued for 40 min after the KCl injection.
Data analysis
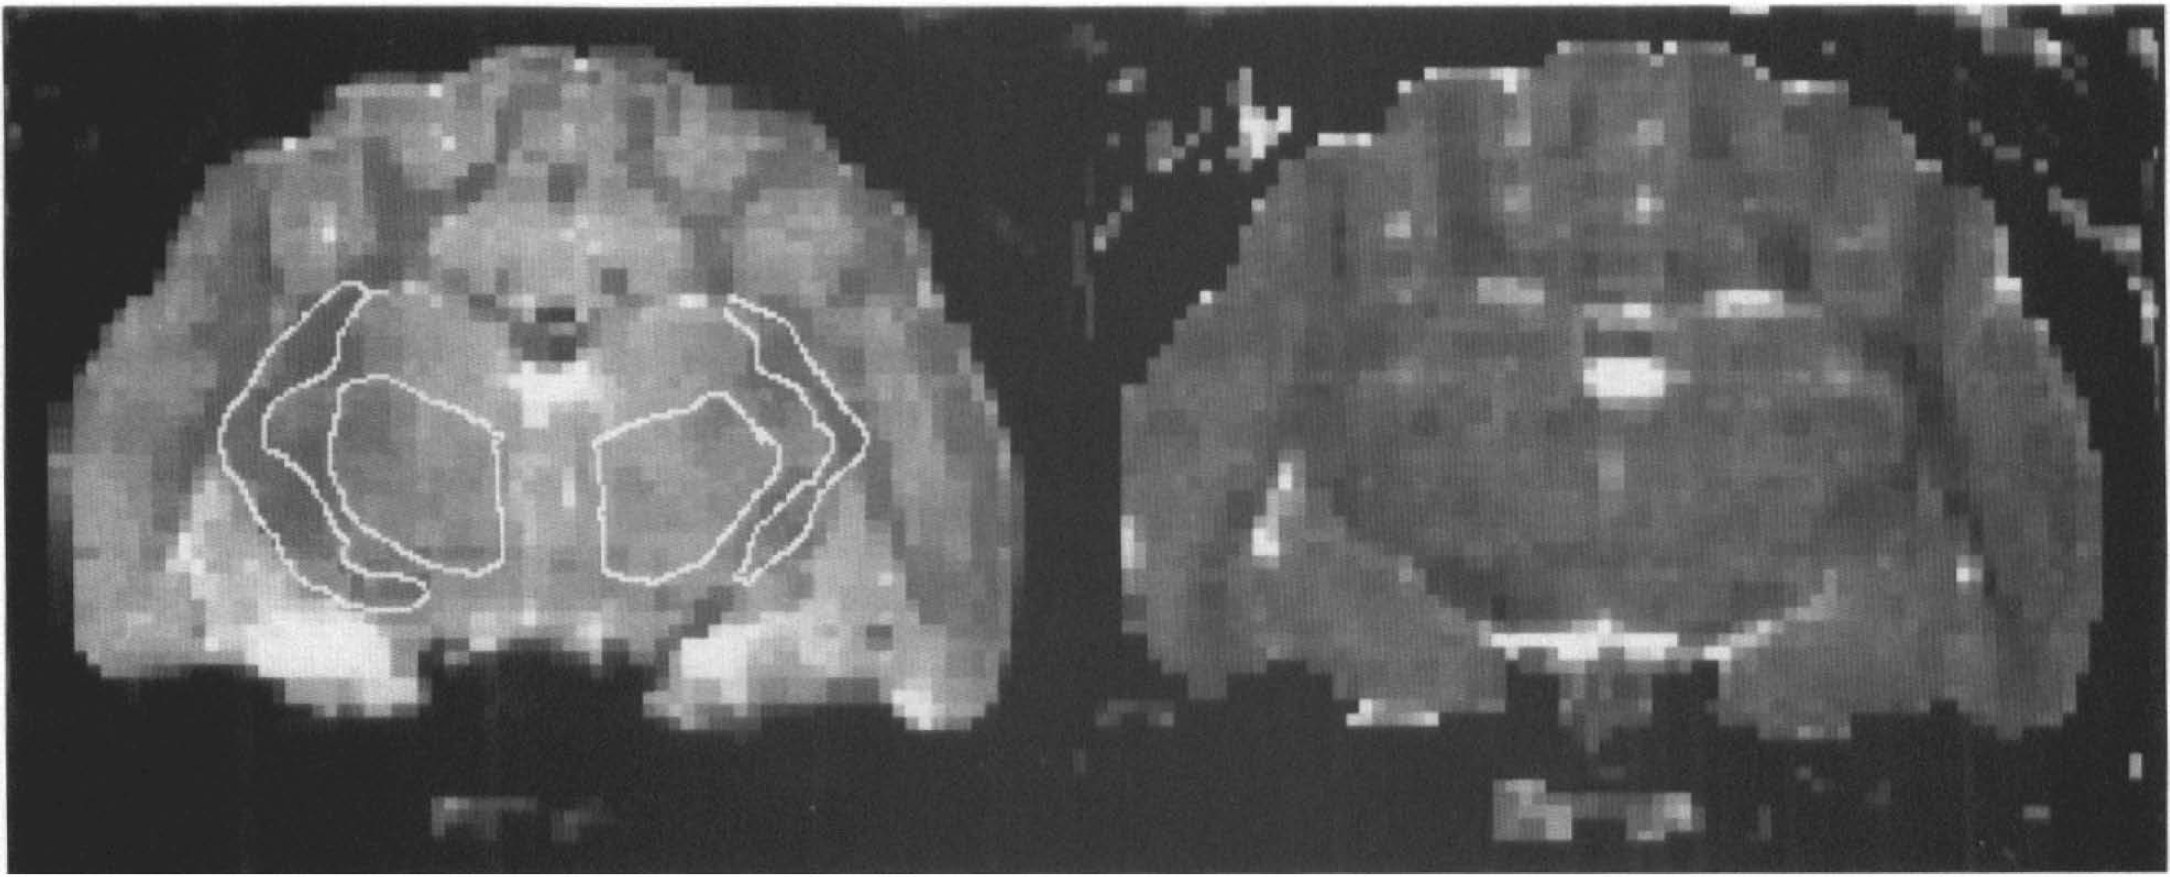
Following phase correction and Fourier magnitude reconstruction, the images were transferred to a SUN Sparc-10 for analysis using a modification of the DPA computer program developed by Goldberg and Le Bihan. Regions of interest (ROIs) were selected in the thalamus, in cortical regions, and in a white matter region that contained the internal capsule (see Fig. 1). For each image we measured the mean signal intensity in each ROI and we computed the ADC and the signal intensity at fe-value = 0 [Sb=0)] by a least-squares fit to the formula

Calculated S(b=0)
where Si, is the mean signal intensity in the ROI in the ith image of the DWI set and bi is the respective b-value. For bilateral structures such as the thalamus and internal capsule, the mean signal intensity was calculated by pooling data from the right and left sides into a single ROI.
To assess the degree of linearity in the plots of In (Si) vs. bi, 32 DW-EP images were acquired, at the beginning of the study in nine animals, with the same imaging parameters and range of b-values subsequently used during ischemia (see Fig. 2). For the various ischemia protocols, we used only eight b-values to estimate the ADC to obtain temporal resolution of <1 min. The ADC and S(b=0) were estimated at each time point in each animal to follow their evolution during the various protocols.
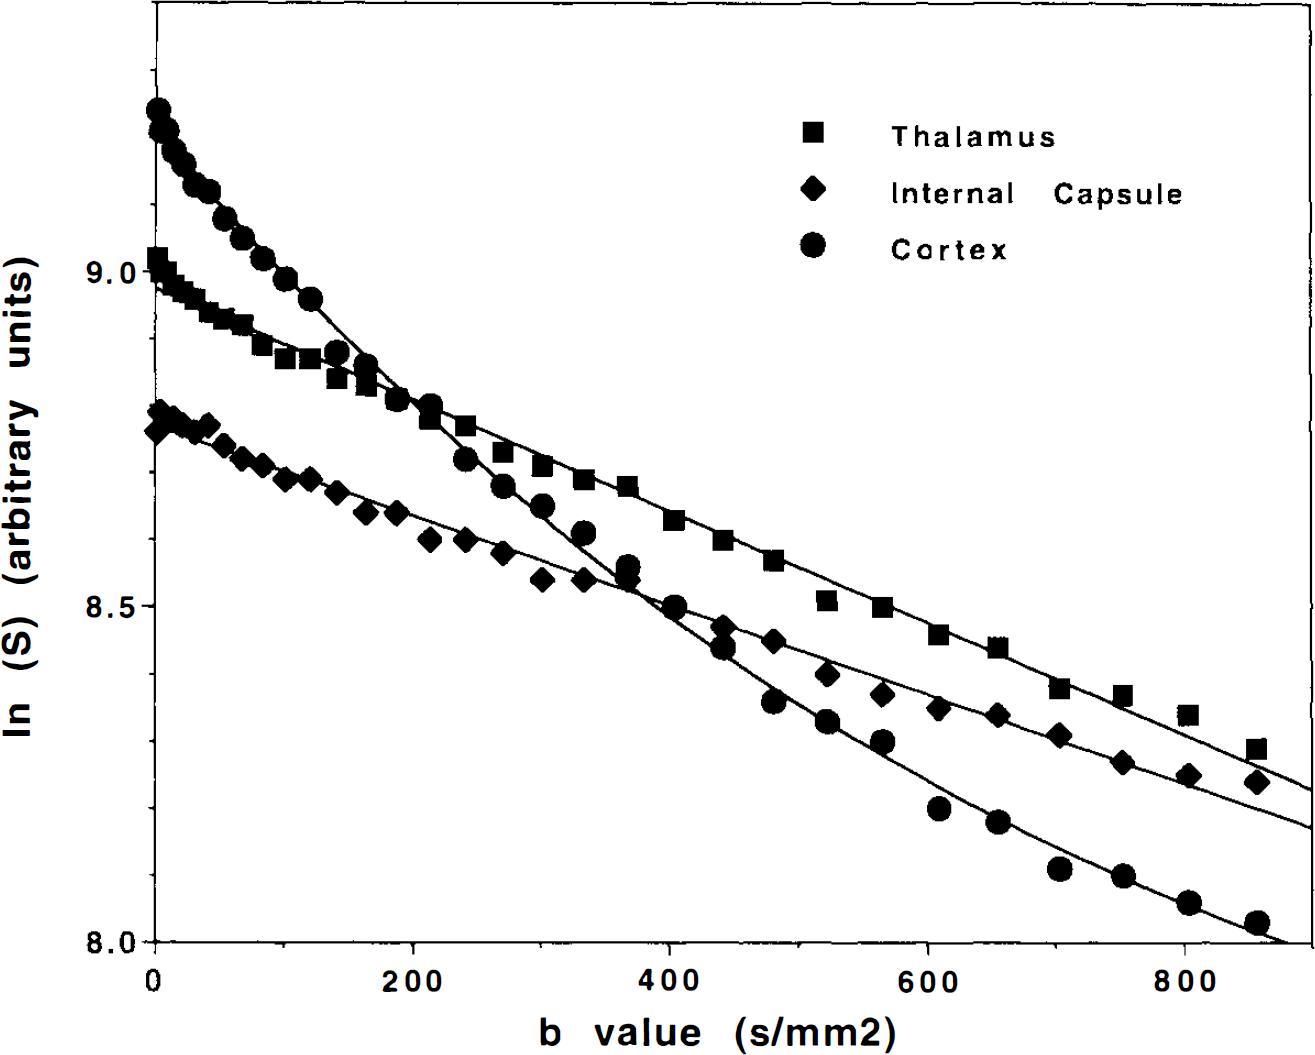
Semilogarithmic plot of the signal intensity, In (S), vs. b-value for regions of interest located in white matter (internal capsule), thalamus, and cortex. These data were collected with 32 b-values rather than 8 used for the time course studies in ischemia and cardiac arrest. For white matter and thalamus, the solid line portrays the best fit to a linear decay of In (S) vs. b-value obtained by least-squares regression and illustrates that a linear model is appropriate for these two structures. In the cortex, a cubic polynomial is used to fit the points and shows that the decay of In (S) vs. b-value is clearly nonlinear. This is because voxels in the cortex contain a mixture of CSF, white matter, and gray matter, each of which has a significantly different diffusivity and thus a different dependence of In (S) vs. b-value.
Statistical analysis
To illustrate the temporal changes of the ADC in the selected ROIs, data from different subjects obtained during each protocol were averaged on a point-by-point basis and plotted with their standard deviations as a function of time (see Figs. 3 and 4). Changes of physiological and MRI parameters within each group were evaluated by analysis of variance for repeated measures. Post hoc pair-wise comparisons were performed with the Scheffé test.
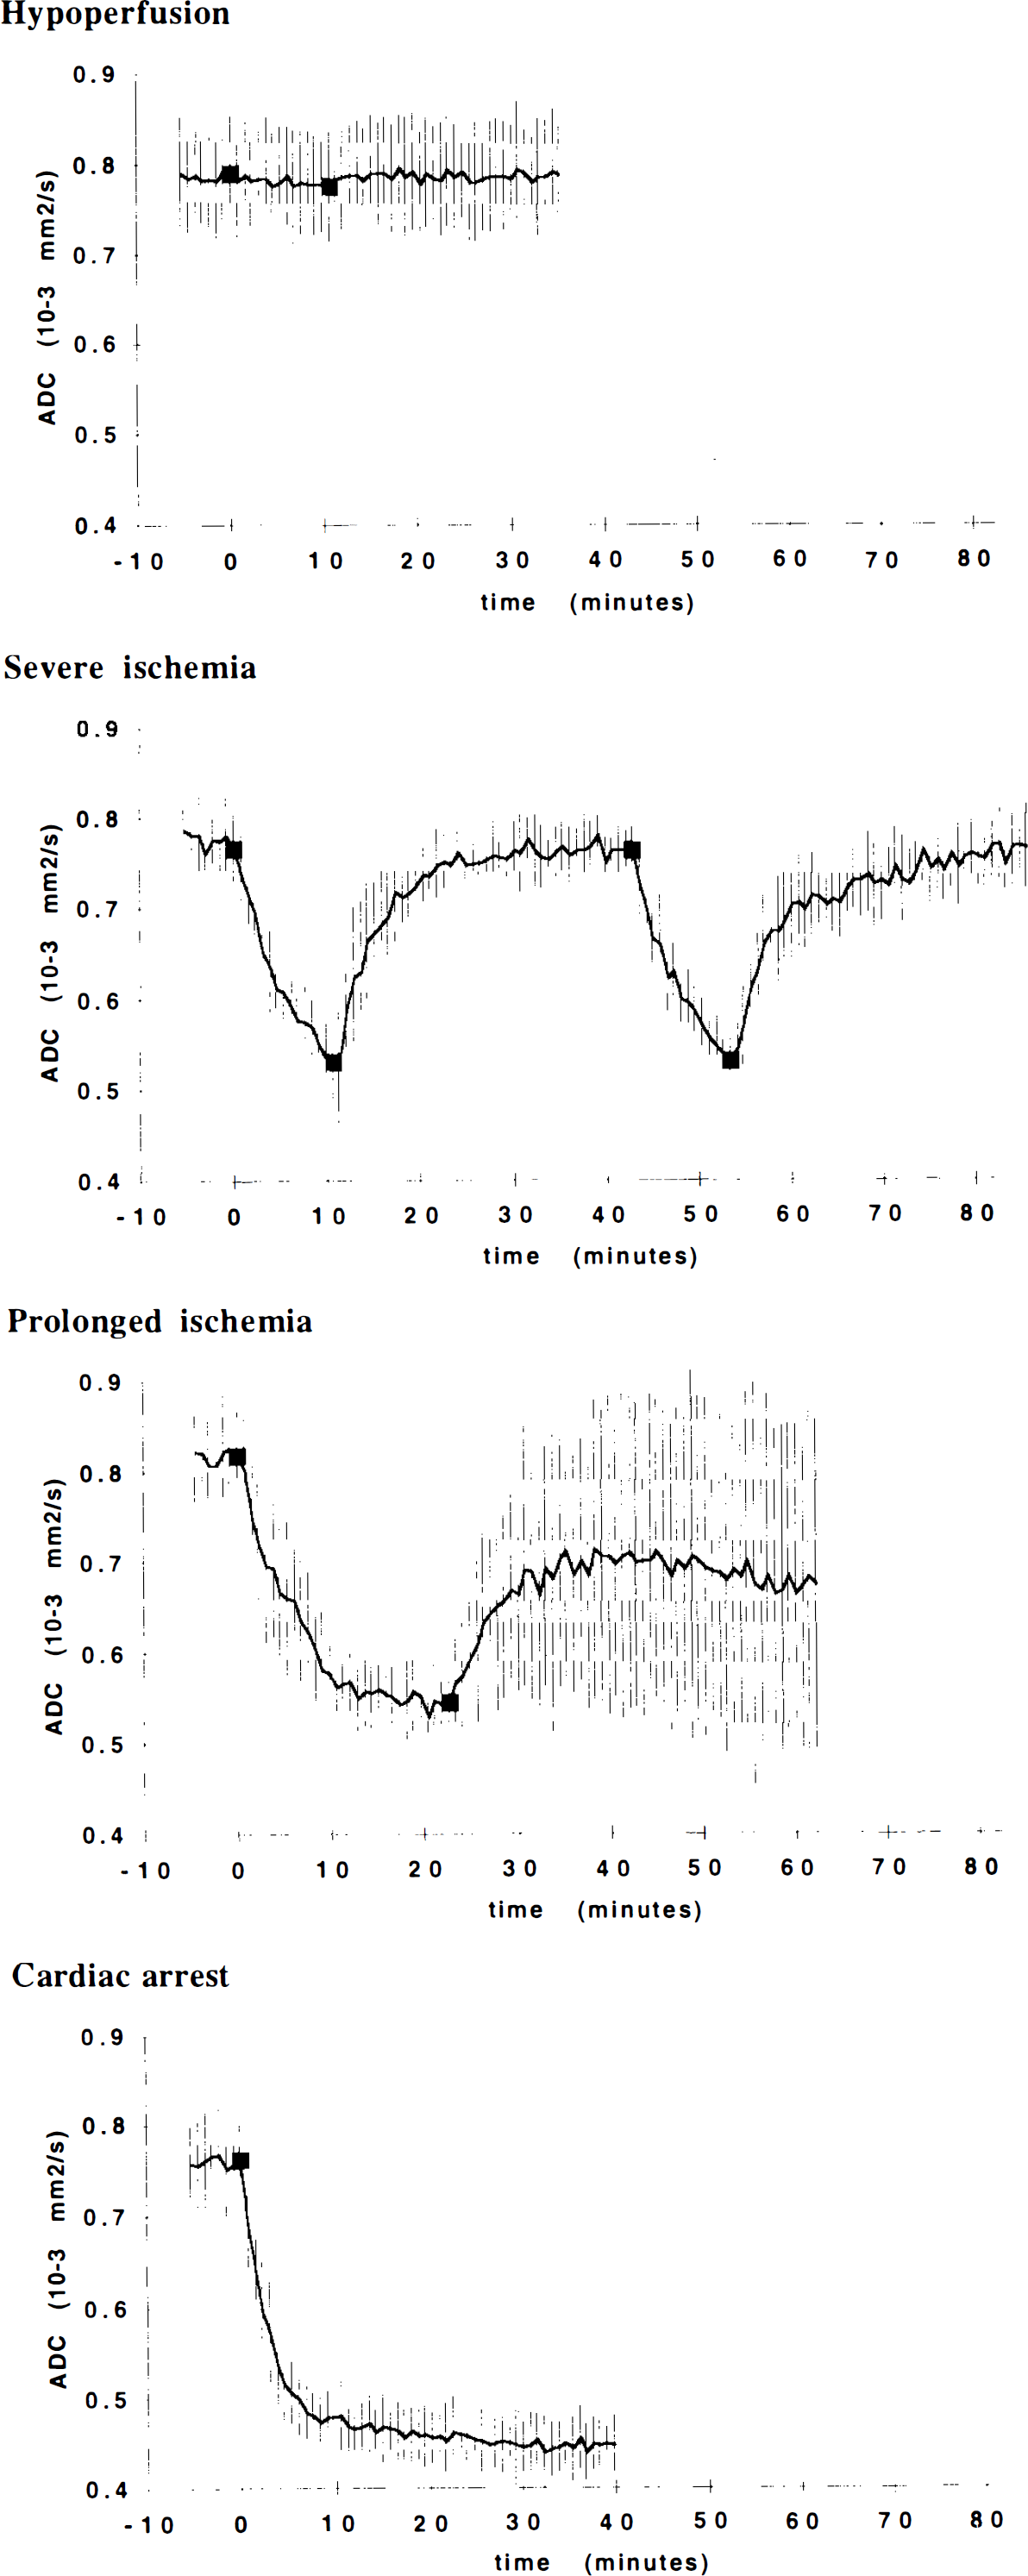
Apparent diffusion coefficient (ADC) vs. time in gray matter (thalamus) for the various ischemia protocols described in Methods. In this and subsequent figures, the group means obtained at each time point are connected by solid lines; vertical bars show the group SDs at each time point. Filled squares indicate the beginning and end of each ischemic episode.
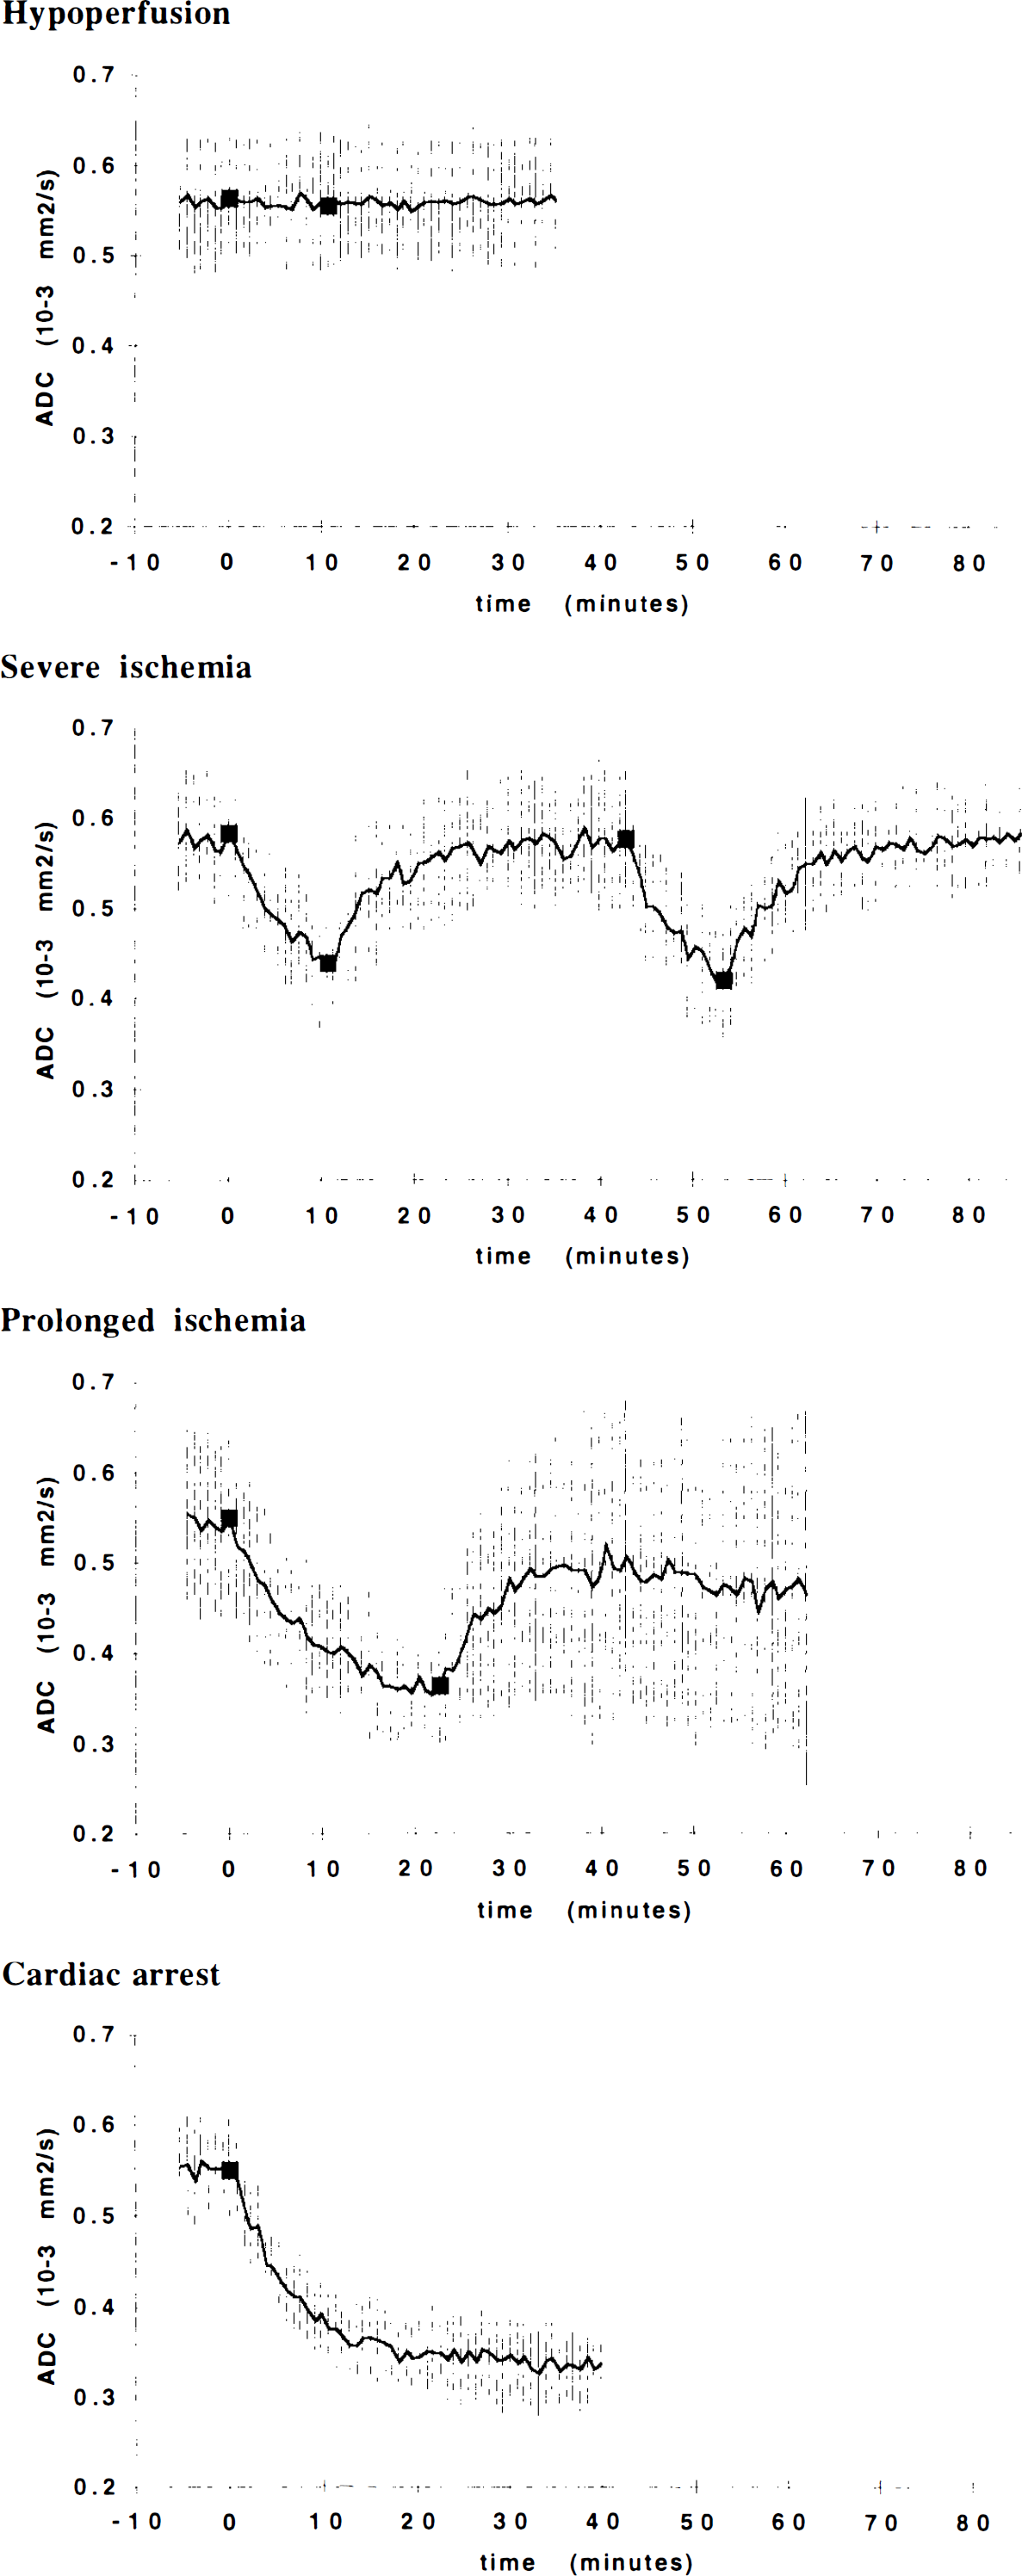
Apparent diffusion coefficient (ADC) vs. time in white matter (internal capsule).
Changes of MRI parameters between groups at selected time points were also evaluated by analysis of variance. Differences between the thalamus and internal capsule were assessed with the paired Student t test. Significance was set at p < 0.01.
To identify the time after occlusion at which the ADC in individual animals was significantly different from the baseline value, we first calculated the mean ADC and its standard deviation prior to ischemia (baseline) and then determined the time at which the ADC dropped below 2 SD from the baseline.
RESULTS
Blood pressure
The baseline value of the mean systemic blood pressure was 94 ± 16 mm Hg before hypoperfusion, reached a peak value of 157 ± 29 mm Hg during hypoperfusion (p < 0.01 vs. baseline), and returned to normal during the first reperfusion period (95 ± 15 mm Hg, not significantly different from baseline). In the eight animals of the severe and prolonged ischemia groups, the peak ischemic value of the mean systemic blood pressure was 207 ± 26 mm Hg (p < 0.01 vs. baseline). The hypoperfusion value was significantly different from the severe ischemia value (p < 0.01).
MRI
Figure 1 shows representative S(b=0) and ADC images calculated from eight DW-EP images in a normal animal prior to ischemia. The spatial resolution of these images permits one to distinguish gray and white matter in large and homogeneous anatomical regions; however, in cortical regions, brain tissue and CSF cannot be clearly separated. The presence of CSF partial volume contamination in the cortical ROI s was confirmed by the observation of a nonlinear behavior of the signal attenuation versus b-value in all of the nine animals in which 32 DW-EP images were acquired at the beginning of the study (Fig. 2). This observation indicates that estimation of the ADC of gray matter in the cortex would require fitting using at least three free parameters [S(b=0 CSF/S(b = 0) gray matter ADCCSF, and ADCgray>matter]. We felt that this cannot be performed adequately using only eight b-values. Moreover, in ischemia, changes in the volume fraction of CSF are likely to occur as the brain swells; given that the ADC in CSF is significantly larger than that in gray or white matter, such changes in the CSF volume fraction can have dramatic effects on the measured ADC. Finally, the contribution of the CSF in the strongly T2-weighted images is magnified owing to its long T2 compared to gray and white matter. Given the limitations in the spatial resolution (i.e., the inability to separate cortex and CSF completely), we could not arrive at a reasonably accurate estimate of the cortical gray matter ADC, and for this reason, we do not present cortical data. However, the eight measurements were adequate to estimate the parenchymal ADC in the thalamus and internal capsule, structures that are devoid of CSF partial volume contamination.
The evolution of the group mean ADC values in the gray matter during the four ischemia protocols is displayed in Fig. 3. A corresponding plot for internal capsule white matter is provided in Fig. 4. The time course of the ADC decrease following ischemia and KCl injection was better fitted by an exponential rather than a linear function of time. The time constants of the ADC decay in each animal are shown in Table 1.
Time constants of ADC delay following ischemia and cardiac arrest
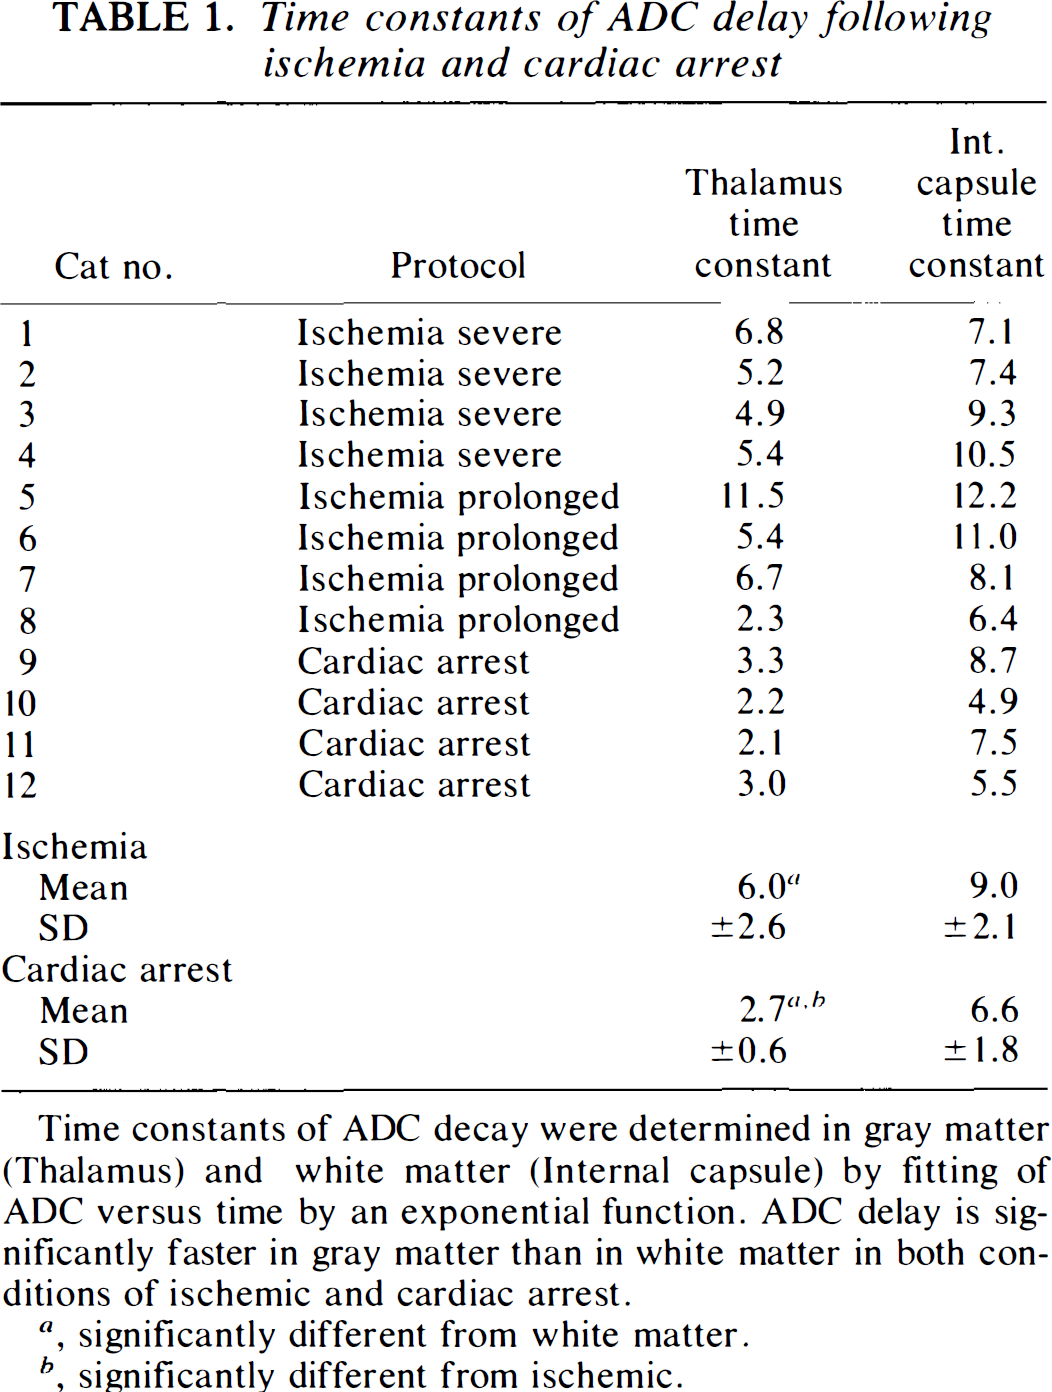
Time constants of ADC decay were determined in gray matter (Thalamus) and white matter (Internal capsule) by fitting of ADC versus time by an exponential function. ADC delay is significantly faster in gray matter than in white matter in both conditions of ischemic and cardiac arrest.
, significantly different from white matter.
, significantly different from ischemic.
ADC-gray matter (thalamus)
The mean preischemic ADC was 0.79 ± 0.06 (×10−3 mm2/s) (n = 12). During the final 5 min of hypoperfusion, the mean ADC was 0.77 ± 0.05 (Fig. 3, hypoperfusion). No significant differences were found between preocclusion, during occlusion, and postocclusion values. However, the changes in the S(b=0) that occurred during the hypoperfusion protocol shown in Fig. 5 suggest there were physiological alterations despite the absence of ADC changes. It has been shown that the increase in local deoxyhemoglobin content associated with hypoxia (Turner et al., 1991) and ischemia (de Crespigny et al., 1993) produces a decline in the signal intensity in long echo time EP images. Hence, our observation of a decrease in the S(b=0) during hypoperfusion is consistent with a stable hypoxia in which the ADC is not altered.
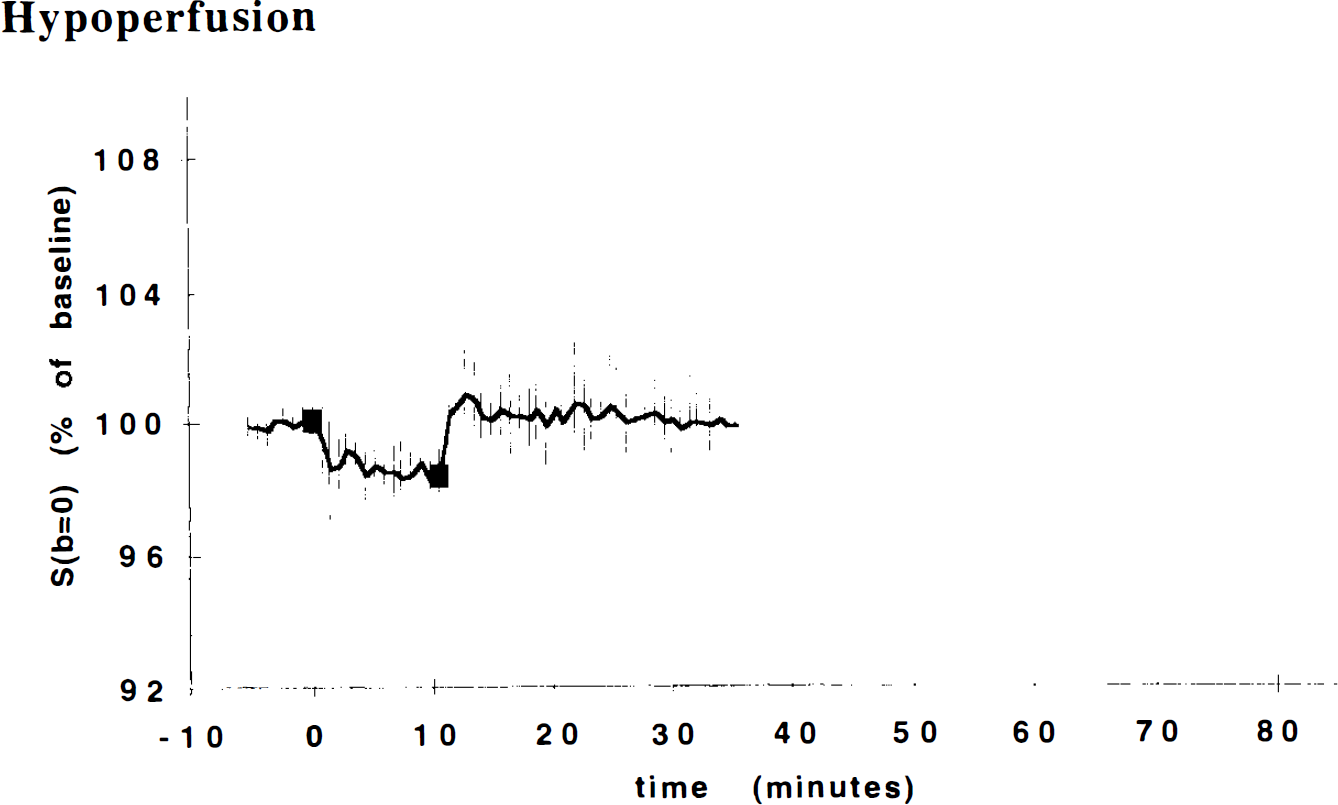
S(b=0) vs. time for thalamic gray matter in the hypoperfusion study. We observe a statistically significant reduction in the magnitude of this T2-weighted signal, which is consistent with an increase in capillary deoxyhemoglobin content, supporting the contention that perfusion is reduced during occlusion. The reduction in S(b=0) is about half of what is observed in severe ischemia (data not shown).
During the first episode of severe ischemia (Fig. 3, severe ischemia), the ADC decreased in an apparently monoexponential pattern, reaching a value of 0.52 ± 0.05 at 10 min (33% decrease). Following reperfusion, the ADC recovered in an apparently biphasic fashion: An initial rapid increase occurred during the first 5–10 min, while a slower recovery occurred during the subsequent 25-min period. In all the animals, the ADC returned to nearly the preischemic value before the second occlusion. The ADC changes during the second ischemic episode were indistinguishable from those observed during the first episode; the only difference we noticed was that in two animals, there was a slower increase of the ADC in the second phase of the recovery.
During prolonged severe ischemia (Fig. 3, prolonged ischemia), the ADC decrease during the first 10 min paralleled that of the severe ischemia group, although with a higher interanimal variability. At 10 min the ADC was 0.58 ± 0.04 (31% decrease with respect to the preischemic value). Between 10 and 22 min following occlusion, the ADC remained almost constant (mean of the ADCs at the end of this period = 0.54 ± 0.03). The four animals responded differently to reperfusion. Two animals showed a recovery profile similar to that of the severe ischemia group, but with more profound fluctuations of the ADC. One animal showed an initial partial recovery with a subsequent reduction. The fourth animal did not recover at all. This interanimal variability causes the SD bars shown in the figure to be relatively large during the reperfusion phase.
In the group of animals where cardiac arrest was induced without previous episodes of severe ischemia, the first time point after KCl injection (43 s) was already significantly different (2 SD) from the preischemic value, whereas in the ischemia protocols, the mean ADC became significantly different from the preischemic value between 1.5 and 2.5 min after occlusion. The ADC decreased exponentially and was almost complete in 5 min (Fig. 3, cardiac arrest). The time constants of this decay process (Table 1) were significantly different from those in the ischemia group (2.7 ± 0.6 vs. 6.0 ± 2.6 min). At 10 min, the mean ADC was 0.48 ± 0.03 (37% decrease vs. preischemic values). Over the next 30 min, the ADC decreased by only a small amount, ultimately reaching a mean value of 0.45 ± 0.03 some 40 min after cardiac arrest (41% decrease vs. baseline).
Comparing ADC values in the ischemia protocols with those in the KCl injection protocol, we observed that between the two groups there were no significant differences in baseline values, no significant differences in ΔADC in the time period 0–10 min, significant differences in ADCs at 10 min, and significant differences in time constant values.
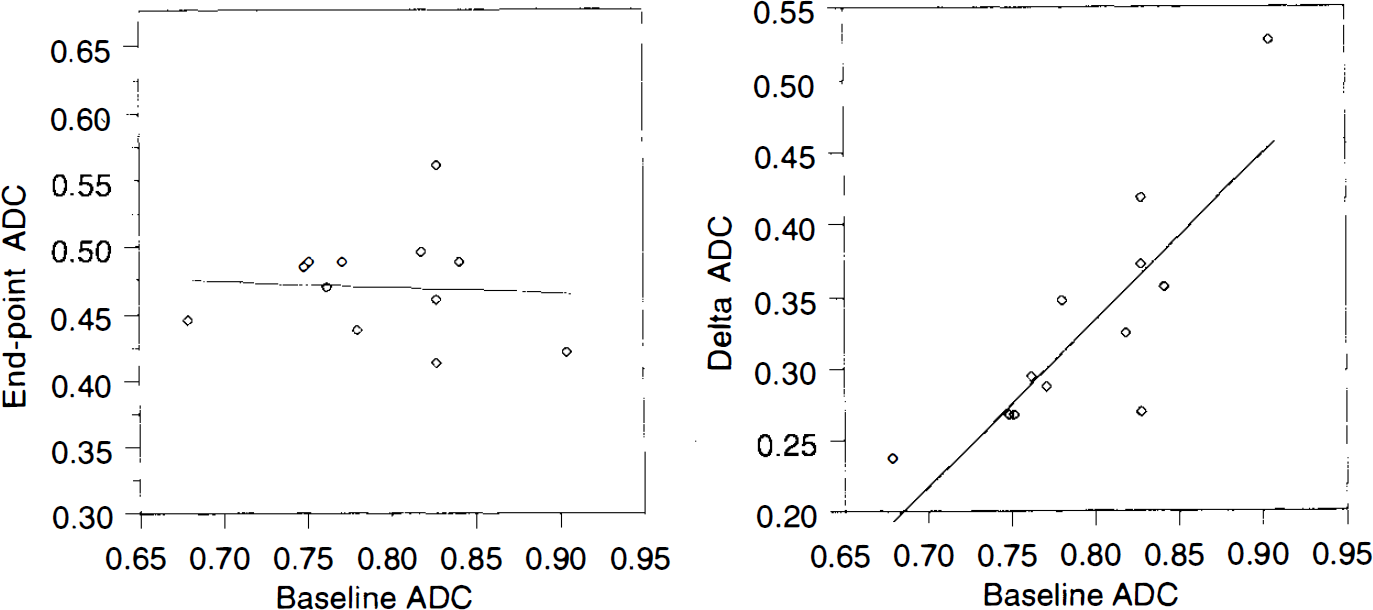
Figure 6 shows, for all animals, the scatterplot of the preischemic ADCs (baseline ADC) versus the ADCs measured at the end of the experiment 40 min following the injection of KCl (end-point ADC) and the scatterplot of the baseline ADC versus the decrease of the ADCs (ΔADC = baseline ADC — end-point ADC). The mean end-point ADC was 0.47 ± 0.04 (×103 mm2/s) and the mean ΔADC was 0.33 ± 0.06. This result shows that the end-point ADCs were similar to one another, while the preischemic ADCs and ΔADCs showed a larger variability. Moreover, the end-point values of the ADC and the baseline ADCs were completely uncorrelated, while the ΔADCs and baseline ADCs showed a significant correlation (Fig. 6). This correlation tells us that the higher the baseline ADC, the larger the drop in ADC following complete ischemia. This is a surprising result because if all of the variability in baseline ADC, end-point ADC, and ΔADC were due to stochastic processes, we would not expect any correlation between them. Our result therefore implies that much of the variability in baseline ADC might be physiological in origin and that this variability is reduced following ischemia. The physiological bases of the variation in the initial ADC and of the similarity of the end-point ADCs are unknown to us and are worthy of further investigation. These results argue against using ΔADC as an index of the severity of ischemia [as has been previously proposed (Hasegawa et al., 1994)] as opposed to the absolute ADC value.
ADC—white matter
The mean preischemic ADC in white matter was 0.56 ± 0.07 (×10−3 mm2/s) (n = 12), which is significantly lower than in gray matter. This result is consistent with the known anisotropy of water diffusion in white matter (Moseley et al., 1991a). The low ADC arises because the direction of the diffusion-sensitizing gradients were approximately perpendicular to the white matter fiber tracts. Data from white matter are also noisier than from gray matter. We believe this is because the white matter ROIs were smaller and because the signal intensity is inherently lower in white matter.
No significant changes in ADC were found during hypoperfusion (Fig. 4, hypoperfusion).
During the first episode of severe ischemia, the mean ADC was 0.44 ± 0.06 (a 23% decrease) after 10 min (Fig. 4, severe ischemia). Just as in the gray matter, this decrease is well fit by an exponential. All animals recovered completely after reperfusion; ADC changes during the second ischemic episode were indistinguishable from those observed during the first episode.
After 10 min of prolonged ischemia (Fig. 4, prolonged ischemia), the ADC was 0.41 ± 0.07 (a 26% decrease with respect to the preischemic value) and reached 0.36 ± 0.06 at 22 min. The recovery of the ADC during reperfusion in the prolonged ischemia group was similar to the recovery of the ADC in the thalamus, except for the animal that showed only a partial recovery followed by a decline. In this animal, the recovery of the ADC in the white matter was almost complete and the subsequent decrease of the ADC was delayed.
In the cardiac arrest group (Fig. 4, cardiac arrest), the ADC at the first time point after KCl injection (43 s) was not significantly different from its preischemic value. The decrease in the ADC was exponential and approached an asymptote within ∼20 min. At 10 min, the mean ADC was 0.37 ± 0.06 (a 32% decrease compared with preischemic values). Over the next 30 min, it showed only a small reduction, ultimately reaching a mean value of 0.33 ± 0.04 at 40 min after cardiac arrest (a 39% decrease vs. baseline).
The ADC decay time constant (Table 1) in the cardiac arrest group was not significantly different from that in the ischemia group (6.6 ± 1.8 min vs. 9.0 ± 2.1 min). The groups subjected to ischemia and KCl injection showed no significant differences in baseline values, ΔADCs, ADCs at 10 min, or time constants.
DISCUSSION
Although brain ischemia has been extensively studied with DWI, the time resolution in most of these studies was inadequate to resolve the time course of the ADC changes in hyperacute ischemia. In almost all studies, the ADC was already abnormal at the time of the first image acquisition. This is mainly a consequence of the long acquisition time (usually several minutes per image) required by the multiple-shot phase encoding in conventional DWI. Moreover, in conventional DWI, an increased time resolution is often obtained by calculating the ADC from diffusion images acquired with a small number of b-values (usually only two b-values), with no opportunity to assess whether linear semilogarithmic fitting is appropriate. In this work, we found that linear semilogarithmic fitting was not appropriate in cortical ROIs. Temporal resolution can be improved by using single-volume DW spectroscopy, in which the absence of phase encoding enables one to obtain reliable estimates of the ADC using multiple b-values in <1 min. With this approach, Davis et al. (1994) demonstrated that in complete ischemia, the ADC changes occur very rapidly after a lag period of 1–2 min, and Decanniere et al. (1995) were recently able to measure rapid changes in the average diffusion constant and changes in lactate and other metabolites with a combined temporal resolution of 36 s. The principal drawbacks of using single-volume spectroscopy are, however, that it is impossible to monitor ADC changes in different regions of the brain simultaneously and that it is difficult to control for partial volume contamination. Using DW-EPI, we were able to acquire diffusion images with a time resolution comparable with that of a spectroscopic diffusion measurement. To our knowledge, although preliminary results have been reported in abstract form (Moseley et al., 1991b; Pierpaoli et al., 1993a), this is the first imaging study that documents rapid changes in ADC during ischemia with a time resolution below 1 min/ADC image.
In this study, we chose to maximize our time resolution information and used continuous acquisition of diffusion data. This precluded the simultaneous determination of blood flow and changes in energy metabolism. Blood flow has been measured, in the same animal model with experimental conditions that closely resemble the ones in the severe ischemia protocol, by using 19F MR spectroscopy to detect freon-23 washout (Brunetti et al., 1990). Brunetti et al. (1990) found a small residual flow during occlusion in about half of the animals studied, even if they counteracted the increase in systemic blood pressure that occurs during vascular occlusion. This is in agreement with our experience. In preliminary experiments performed using single-shot gradient echo EPI to follow the first passage of a bolus of Gd-diethylenetriamine pentaacetate in the brain, we observed a small residual perfusion in most of the animals (data not shown). In the hypoperfusion protocol, we found no reduction of the ADC in either white or gray matter, but the absence of direct blood flow data prevents us from determining a quantitative threshold value above which the ADC is not reduced. We have, however, indirect evidence that the reduction in perfusion must be severe to provoke an ADC reduction. First, the sustained increase of the arterial pressure for the entire duration of the occlusion suggests that the perfusion pressure to the brain was reduced. Second, during hypoperfusion, we noticed a statistically significant reduction in the magnitude of the T2-weighted intercept images, S(b=0), which is consistent with an increased deoxyhemoglobin content at the capillary level (Turner et al., 1991; de Crespigny et al., 1993).
Correlation of ADC changes in g ray matter with changes of other physiological parameters
The first time point after vascular occlusion or cardiac arrest is useful in identifying the contribution to the ADC decrease of events that occur instantly after the interruption of brain perfusion. One of these is the cessation of brain pulsation. Bulk motion and CSF pulsation produce gross motion artifacts in DWI that are easy to identify. Small vibration of the parenchyma secondary to the cardiac cycle could potentially result in an artifactually high ADC without any evident artifact in the images. Our data do not preclude that brain micropulsation could contribute to the observed normal ADC value, but certainly the contribution is small. The ADC at the first time point after severe ischemia was not significantly different from the baseline. Although the ADC at the first time point after cardiac arrest was significantly different from the baseline in all the animals, the decrease seen by the first time point was a small fraction of the total decrease that is eventually observed. The absence of ADC changes during hypoperfusion, a condition in which ischemia was not produced but the cerebral hemodynamic was altered, speaks also against a significant contribution of brain pulsation.
Very shortly after the onset of global ischemia, spontaneous EEG activity disappears. In this model, the EEG has been reported to be flat within 15 s of ischemia (Hossmann, 1971; Alger et al., 1989). In our observations, the ADC was still normal at 45 s. The suppression of the EEG activity has been reported to last for 17 min after reflow (Alger et al., 1989), while we found that the ADC recovery began immediately after reperfusion. This suggests that EEG and ADC values reflect different aspects of the pathophysiological events occurring during ischemia and that the ADC is probably not directly associated with the brain electrical activity as measured by the EEG.
Data on energy metabolism in this model were acquired by Alger et al. (1989) and Behar et al. (1989) using single-volume phosphorus spectroscopy with a time resolution comparable with that of our study. There is a remarkable resemblance between the temporal profile of the ADC changes that we observed in gray matter and the changes in the energy metabolism parameters measured by these authors. Alger et al. reported that ATP, phosphocreatine (PCr), and pH began to drop immediately after occlusion and that after 10 min of ischemia ATP and PCr were undetectable. Behar et al. reported a decrease of ATP and PCr to noise levels within 4–8 min after the onset of ischemia. Following reperfusion, ATP returned toward normal values in 5 min and PCr renormalized after 10 min (Alger et al., 1989). In our study, the ADC began to drop 1.5–2.5 min after occlusion, reached an asymptote at 10 min, and started to recover immediately after reperfusion. Both groups described a delay in the beginning of the normalization of pH that we did not observe in our ADC data. In summary, the ADC behavior seems to parallel the changes in high energy metabolites reported in previous literature: Apparently, a significant decrease in ADC occurs before complete ATP depletion and the ADC begins to recover before ATP has returned to normal values. These results are consistent with the findings of Kohno et al. (1995) who found in rat focal ischemia that the area of reduced ADC was larger than that in which ATP was depleted. However, their finding that a reduced ADC is related to a reduced pH is not supported by our finding of a prompt renormalization of the ADC after reperfusion at a time when pH is reported to be still reduced.
Other aspects in which ADC and energy metabolism show a similar behavior are the sensitivity to repetitive episodes of ischemia of short duration and the recovery profile after prolonged ischemia. In repetitive ischemia, we found that the time course of the decrease and recovery of the ADC in the second episode of ischemia was essentially indistinguishable from that of the first episode. In prolonged ischemia, when ADC recovery occurred, it did not evolve more slowly than after the 10-min ischemia. This is in line with the findings of Alger et al. (1989) of no metabolic differences in three repetitive ischemic episodes of 10 min each and of a recovery rate that was not affected by the length of ischemia.
One of the most popular hypotheses to explain the reduction of the ADC during ischemia is that water is redistributed from the extracellular space into the intracellular compartment in the early stages of ischemia (Moseley et al., 1990; Benveniste et al., 1992). While early works focused on the enlargement of the intracellular space as the factor primarily responsible for the ADC decrease, more recent articles (Hossmann et al., 1994; Latour et al., 1994; Norris et al., 1994; Verheul et ah, 1994; van der Toorn et ah, 1995) underline the role of an increased tortuosity of the extracellular compartment. Electrical impedance measurements, which provide an estimate of the relative size of the extracellular space, have been performed by Hossmann (1971) in this model. In Fig. 7 we report the time course of the percentage change in the extracellular space from a table in Hossmann's publication to juxtapose with the time course of the changes in the ADC presented in Fig. 3 (severe and prolonged ischemia). Although Hossmann's measurements were performed in the cortex and our ADC measurements in the thalamus, there is a high degree of similarity between the two temporal profiles. While the simple temporal correlation between two events itself does not prove a causal relationship, this remarkable coincidence may in part be explained on theoretical grounds, since the effective diffusivity (measured by the ADC) and the effective electrical conductivity (used to infer extracellular volume) are functionally related by the Einstein relation. In ischemia, many physiological parameters change simultaneously so the identification of those responsible for the ADC changes would require more experimental and theoretical work. Nevertheless, our results support the idea that changes in extracellular space contribute to the ADC changes. Clearly, it would be interesting to be able to decouple the changes in intra- and extracellular volume as well as energy metabolism so as to identify their respective contributions to changes in the ADC. Studies underway, in which we are able to reduce extracellular space osmotically without producing metabolic impairment or changing intracellular volume, should be helpful in resolving this issue (Pierpaoli et ah, 1995a).
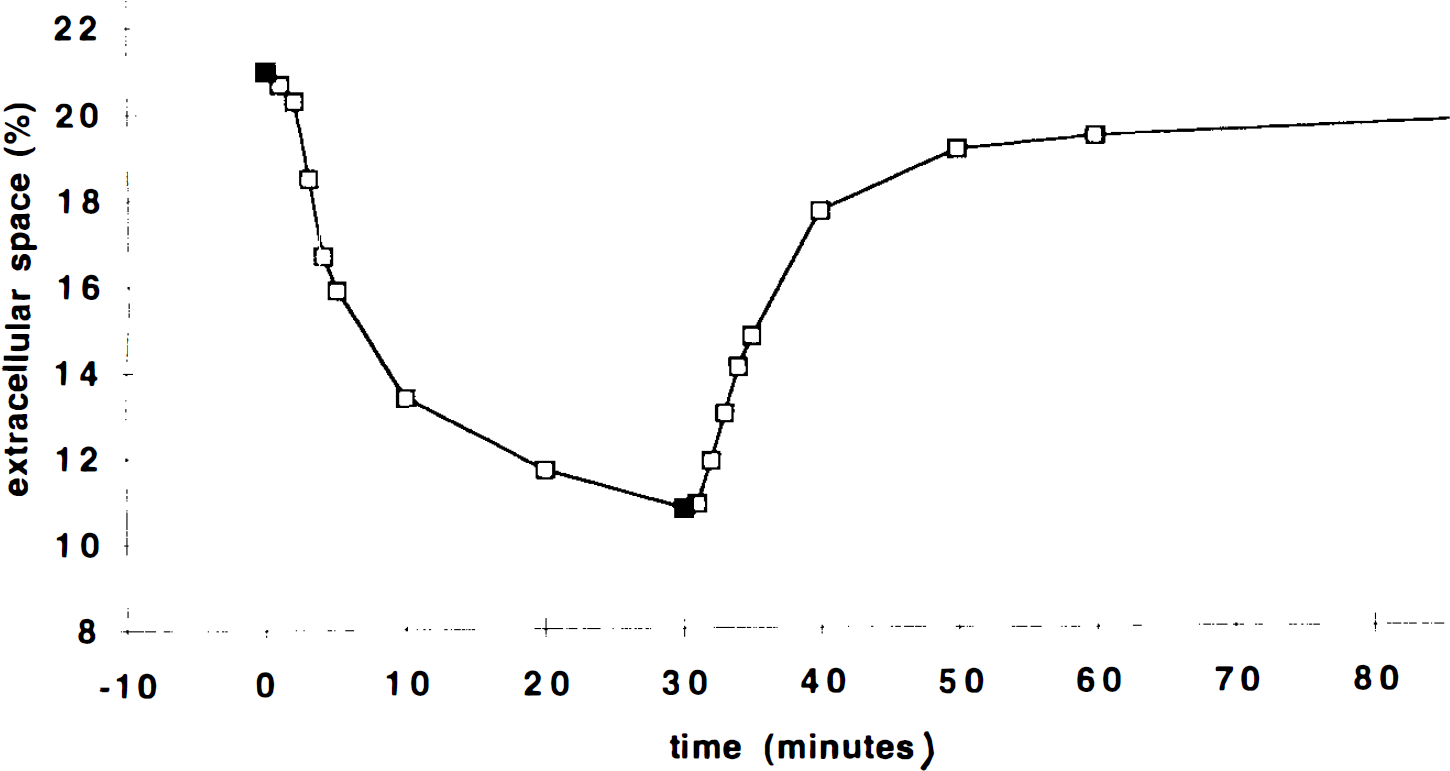
The percentage cortical extracellular space (as measured by electrical impedance method) vs. time in the same cat ischemia model used in the present experiment [data replotted from Hossmann (1971)].
White matter
In many aspects, the white matter curves resemble the gray matter ones. No significant changes were found during hypoperfusion. The decrease of the ADC during ischemia and cardiac arrest showed a profile that is better represented by an exponential rather than a linear time function. In the severe ischemia group, white matter ADC in all the animals recovered completely after reperfusion and the ADC changes during the second ischemic episode were indistinguishable from those observed during the first episode.
In addition to these similarities, one clear difference is that the rate of ADC decrease during ischemia and after cardiac arrest is much slower in the white matter than it is in the gray matter. Another rather surprising result is that while in the gray matter the rate of ADC decrease is significantly slower in ischemia than in cardiac arrest, in white matter we found no difference between the two conditions. We think that in gray matter the slower ADC decrease rate in ischemia relative to cardiac arrest is likely caused by residual perfusion. Residual perfusion was probably not present in the white matter during ischemia. The anatomy of the cerebral vasculature causes the blood flow reduction to be more severe in the white matter than in the gray matter in incomplete global ischemia (Welsh et al., 1978a; Lesnick et al., 1984). The more severe reduction in blood flow is accompanied by a more severe metabolic impairment as indicated by Welsh et al. (1978b) who reported that carotid clamping and systemic arterial hypotension in cats caused metabolic alterations (reduction of ATP, depletion of PCr, increase in lactate) that were considerably greater in white than in gray matter.
A simple interpretation of the slower ADC decrease in white matter compared with gray matter would be that the disturbances leading to ADC reduction evolve more slowly in white matter. This line of reasoning suggests that the white matter is intrinsically more ischemia resistant and that diffusion imaging is sensitive enough to detect it. We must consider, however, that if the ADC is affected by the tissue microstructure (i.e., geometry of the extracellular space), different kinetics of the ADC changes could be expected in regions with different histological characteristics even for the same level of metabolic impairment. In white matter, water diffusion is highly anisotropic (Chenevert et al., 1990; Moseley et al., 1991a), being much higher in the direction parallel to the fibers than in the direction perpendicular to them. In this study, the diffusion gradients were approximately perpendicular to the white matter tract that we considered for our ROIs. In the future, it would be desirable to estimate the effective diffusion tensor (Basser et al., 1994a, b ) rather than the ADC in white matter during ischemia. The effective diffusion tensor furnishes three principal diffusivities: one that is parallel to the fiber tract direction of the white matter and two that are perpendicular to it. In ischemia, it is likely that the time course of the decrease of each of these three principal diffusivities is different. We expect that the principal diffusivities for directions perpendicular to the fiber tracts will be very sensitive to changes in the packing geometry of the nerve axons that will markedly change the tortuosity of water in the extracellular compartment. We also expect these transverse diffusivities to be more sensitive to changes in membrane permeability that will affect the exchange of intra- and extracellular water. However, we expect that changes in the principal diffusivity parallel to the fiber tract direction will be less sensitive to changes in the interaxonal spacing but be more sensitive to changes in viscosity and temperature in the extracellular space.
One issue that is important to address is whether there was some gray matter contamination in the white matter ROIs. Although we carried out our study in cats rather than in rats, white matter tracts are still thin, comparable in size to our voxel dimensions. Snider et al. (1961) illustrate that, at the level of our slice, the internal capsule has an average cross-section of ∼2 mm. The dimension of a single voxel in our images was 1 times; 1 times; 2.5 mm. This suggests that some of our white matter ROIs may contain tissue other than white matter. This partial volume artifact would tend to make the measured ADC and the time course of its changes in white matter appear more similar to, rather than different from, those in gray matter (e.g., in the thalamus). What we found, however, were substantial differences between white matter and thalamus. Therefore, we must conclude that these partial volume artifacts did not eliminate the possibility to detect differences between gray matter and white matter, although they are likely to cause us to underestimate them.
Potential clinical significance
One contentious clinical issue is whether it is possible to define a threshold value of the ADC below which brain tissue is irreversibly damaged. Some studies have addressed this issue, and it has been reported that irreversible ischemia occurs only in regions where ΔADC > 0.25 × 10⁻³ mm2/s (Hasegawa et al., 1994) and when ADC < 0.55 × 10⁻³ mm2/s (Dardzinski et al., 1993).
In our studies, we observed that the ADCs in cats that recovered from prolonged ischemia and in the cats that did not recover were similar. Moreover, while the ADC at 40 min after cardiac arrest was significantly lower than the ADC at 10 min after ischemia (a condition from which all the animals recovered), these values were still very close to one another. This casts doubt on whether the ADC can be used to determine if the tissue is reversibly or irreversibly damaged, particularly in a clinical setting where the potential confounding variables cannot be controlled as well as in an experimental study. For instance, in focal ischemia, partial volume artifacts arise because a voxel contains a mixture of gray and white matter or because a voxel contains some tissues that are adequately perfused and others that are inadequately perfused (Jones et al., 1994). These can complicate the interpretation of the clinical significance of an ADC value. These artifacts can be eliminated by using high resolution fast MRI methods for acquiring DW images (Pierpaoli et al., 1995b).
CONCLUSION
To follow physiological changes occurring during ischemia, DWI must be performed with high temporal resolution and preferably with high spatial resolution. Time constants for decay of the ADC were more rapid in gray matter than in white matter, suggesting a different susceptibility to damage of these two tissues owing to a reduction in blood flow. In ischemia, although the variability in the time constants was high, the ADC values at 10 min were very similar in all the animals. This suggests that when blood flow is diminished enough to induce an ADC reduction, differences in perfusion affect the rapidity of the decrease but not the final asymptotic value of the ADC.
A comparison of our ADC data with phosphorus spectroscopy data acquired previously in our laboratory using the same model suggests that, during ischemia, a significant decrease in ADC occurs before complete ATP depletion and that, after reperfusion, the ADC begins to recover before ATP levels have returned to normal. We also noticed a high temporal correlation between time series of the ADC and reported data of the percentage extracellular space (measured using an electrical impedance method). This supports the hypothesis that changes in extracellular space contribute to the ADC changes observed during ischemia.
Footnotes
Acknowledgment:
The MRI study described in this work was performed in the In Vivo NMR Research Center. Ms. Heather Young provided helpful support with data analysis. We are particularly grateful to Dr. Peter Basser for his critical revision of the manuscript.