
Abstract
Color duplex flowmetry of internal carotid and vertebral arteries permits estimation of intravascular flow volumes and global cerebral blood flow volume (CBFV) by summing the flow volumes measured in each of the four extracranial vessels. Intravascular flow volumes were calculated as the product of angle-corrected time-averaged flow velocity and the cross-sectional area of the vessel. The reliability of this new method was tested in a prospective, intra- and interdiane, intra- and interobserver reproducibility study of 32 healthy subjects aged 7–57 years. In each subject, CBFV was tested by each observer twice on day 1 and once on day 2 in consecutive recordings. In each artery, both examiners found closely similar mean intravascular flow volumes. Intradiane interobserver reproducibility of CBFV was high on both days (correlation coefficient, CC, 0.90 and 0.85, p ≤ 0.0001; coefficient of variance, CV, 10.0 and 10.4%, respectively), as was the interdiane comparison (CC = 0.81, p ≤ 0.0001; CV ≤ 13.3%). Intraobserver reproducibility was even higher. On both days, there was a progressive decrease in CBFV from each subject's first to the last examination within a 1-h examination period (day 1: 717 ± 150 ml/min to 690 ± 120 ml/min; difference, p ≤ 0.05; day 2: 700 ± 120 ml/min to 665 ± 126 ml/min; difference, p ≤ 0.01). This habituation effect was more pronounced in subjects with high initial CBFV. Reproducibility of CBFV is comparable to that of mean CBF measurements with 133Xe inhalation and H215O positron emission tomography techniques reported by other groups. This method makes serial bedside-monitoring of CBFV feasible without posing the risks of radiation exposure.
Until recently, estimation of CBF volume (CBFV) by Doppler flowmetry was limited to the examination of the common carotid arteries (Keller et al., 1976; Fitzgerald et al., 1982; Payen et al., 1982; Uematsu et al., 1983; Müller et al., 1984, 1987; Wada et al., 1991)and internal carotid arteries (Leopold et al., 1987; Juul et al., 1991; Fortune et al., 1992). In the first study on total CBFV measurements in healthy adults (Schöning et al., 1994), it was shown that common carotid artery flow volumes were not representative because an age-related rise in the flow rate of this vessel was mainly due to an equivalent increase in the external carotid artery flow volume. Because approximately one-quarter of CBFV is transported through the vertebrobasilar system (Schöning et al., 1994), duplex flowmetry of the internal carotid and the vertebral arteries of both sides was considered essential in accurate estimating CBFV.
The level of global CBFV (701 ± 104 ml/min, equivalent to ∼54 ± 8 ml/100 g/min) found in adults (Schöning et al., 1994) is comparable to those arising from the nitrous oxide method (Kety and Schmidt, 1948) and the 133Xe inhalation and single-photon emission computed tomography technique (Shirahata et al., 1985; Waldemar et al., 1991). However, long-term reproducibility of CBFV measurements was moderate, whereas the accuracy of the method became questionable (Bladin and Burns, 1994).
Quantitative Doppler flowmetry can be performed by measuring angle-corrected time-averaged flow velocity (TAV) and the cross-sectional area of the vessel. The product of both measurements corresponds to the intravascular flow volume during the time of measurement. This can be easily transformed into the flow volume rate per minute. It is well known that quantitative flow volume measurements are prone to a range of errors (Smith, 1984; Gill, 1985; Hoskins, 1990): e.g., in the internal carotid artery, errors of 1° in angle determination, of 0.1 mm in diameter, and of 1 cm/s in TAV measurement result in 3, 4, and 4% deviation of flow volume estimation, respectively (Schöning et al., 1994). The combined measurement of flow volumes in all extracranial cerebral vessels could possibly reinforce the rate of errors. The reliability of CBFV flowmetry must, therefore, be verified before it can be accepted as a new diagnostic tool.
Because the positron emission tomography (PET) and the 133Xe inhalation techniques used currently in the evaluation of regional and mean CBF pose the risk of radiation, we considered them unsuitable for comparison with noninvasive flowmetry in healthy subjects. Hence, in the first instance, an intra- and interdiane, intra- and interobserver reproducibility study was held to be appropriate for testing the reliability of volumetric CBFV estimation.
METHODS
Study group
In a prospective study, two investigators examined 32 healthy subjects (9 female, 23 male) who had no history or physical signs of cerebrovascular disease in a blind manner. In all, six examinations were done during 2 consecutive days using color duplex sonography of the internal carotid and vertebral arteries. Mean age of the subjects was 26.6 ± 11.8 years (range, 7–57 years).
Written informed consent was given by all test persons (or the parents of the children examined) before the investigation. The study was approved by the Ethical Committee of the University of Tübingen.
Examination procedure
Color duplex sonography of cervical arteries began on both days after each subject rested in a supine position for exactly 10 min. A 7.0-MHz linear array transducer of a computed sonography system (Acuson 128 XP10, Mountain View, CA, U.S.A.) was used. The examination sequence was uniform in all subjects, and all measurement cycles began with the left vertebral artery (VA), after which the left internal carotid artery (ICA), the right ICA, and the right VA were explored.
The VA was examined most frequently in the C4-C5 intertransverse segment with the subject in supine position, with the head tilted slightly upwards and turned to the contralateral side at ∼10° from midline position. In aiming for good exposure of the ICA, the head had to be tilted and turned to a greater degree (250°), depending on the topographic site of the carotid bifurcation. Measurements were, as a rule, taken at a distance of 1.5–2.0 cm above the bifurcation.
To start with, a high-resolution B-mode image of the vessels was obtained by magnifying the region of interest. Because the cross-section of the extracranial arteries appeared to be circular in the B-mode image, the luminal diameter was taken as a measurement of the cross-sectional area of the vessel. This was read exactly at the site of color duplex measurement, perpendicular to the artery's longitudinal axis, between the bright internal layers of the parallel vessel walls. The calipers could be adjusted at 0.1-mm graduations.
Color duplex measurement comprised a color Doppler image of the vessel plus an angle-corrected pulsed Doppler time frequency analysis of the intravascular flow. In the color Doppler mode, the flow was depicted over the entire segment of the vessel's course displayed in the enlarged B-mode image. The velocity of the color scale was set slightly higher than the Nyquist limit to facilitate the detection of sites with flow disturbance.
Subsequently, a pulsed Doppler sample volume was positioned over the entire width of the vessel at a site of undisturbed flow. Because of electronic steering of the linear probe, the angle of the color Doppler image as well as of the pulsed Doppler cursor could be tilted at ∼20° from the vertical axis so that the angle between the course of the vessel and the Doppler beam could be reduced. Visual control of the maximal luminal width and acoustic control of an optimum time frequency Doppler signal made certain that the sample volume passed through the center of the vessel. A pulsed Doppler spectral curve was then obtained. Flow velocities were evaluated only if the signal was stable during the time of measurement (5 s) while the color Doppler signal was “frozen.” Furthermore, spectra containing low-frequency bidirectional elements—indicating disturbed flow—were not evaluated.
Finally, the angle of insonation between the pulsed Doppler beam and the course of the vessel was measured by adjusting an angle indicator at 1° graduations along the walls of the vessels in the B-mode image as well as along the intravascular color Doppler stream. The velocity scale of the recorded time frequency Doppler signal was corrected automatically during angle adjustment.
Angle-corrected flow velocities could then be determined. We measured TAV, calculated as the time-integral below the mean frequency line that was automatically displayed by the computed sonography system. TAV was measured over as many (minimum of three) complete cardiac cycles as were depicted on the screen. The intravascular flow volume, FV, can be determined by calculating the product of angle-corrected TAV and the cross-sectional area of the circular vessel (A) in the formula: FV = TAV · A = TAV · [(d/2)2 · π].
In each vessel, duplicate measurements of diameter and TAV were taken in two separate, consecutive recordings, and the mean of two flow volume measurements was evaluated. Each measurement was processed by a video printer recording important data (luminal width, TAV, incident-angle). A complete CBFV measurement cycle, consisting of duplicate flow volume measurements of both ICAs and VAs required ∼15 min. Because in each subject four complete CBFV measurements were taken on the first day, and two on the second day, the total time of examination added up to 60 min, and 30 min, respectively.
Design of the study
The test persons were assigned numbers according to the sequence of examination. Odd-numbered subjects first underwent two consecutive complete measurement cycles (named “I” and “II”) done by examiner “A,” which were immediately followed by two cycles done by examiner “B” on the first day. Both examiners did one complete examination (named “III”) on day 2 (in the same order as in the previous day). Conversely, even-numbered test persons were first tested by examiner “B” and then by examiner “A” on both days. The nomenclature of all measurements taken is shown in the scheme in Table 1.
Measurement nomenclature

Neither of the observers was allowed to be present in the examination room when the other took the measurements. The second examiner always began his measurements as soon as the first examiner had finished. We tried to keep the environmental conditions (hour of examination, dimmed light, acoustic level of the Doppler audio signal) unchanged during all sessions.
Evaluation of the study
Intradiane intraobserver reproducibility was tested by comparing examination “A-I” with “A-II,” and “B-I” with “B-II,” whereas interdiane intraobserver reproducibility was tested by comparing examination “A-I” with “A-III,” “A-II” with “A-III,” “B-I” with “B-III,” and “B-II” with “B-III,” respectively.
For evaluation of intradiane interobserver reproducibility both examiners' measurements directly following each other had to be compared (bold letters in Table 1). That meant that as the sequence of the investigators alternated, the examinations “A-II” with “B-I” among the odd-numbered test persons, and “B-II” with “A-I” among the even-numbered test persons had to be compared on day 1 (“mixed” evaluation, called “A-Im” and “B-Im” in Tables 2 and 3). Day 2 examinations, i.e., “A-III” and “B-III,” were also compared. By evaluating in this way, a possible supervening habituation effect could be ruled out.
Intradiane interobserver reproducibility of CBF volume (CBFV) measurements on the 1st and 2nd day of examination in 32 subjects
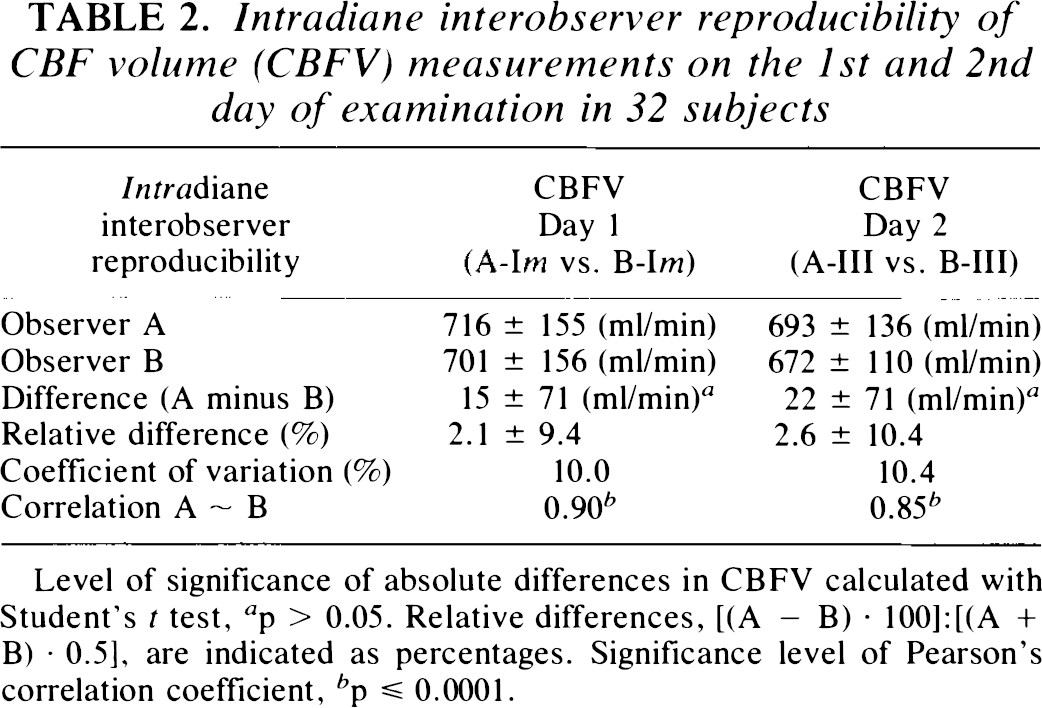
Level of significance of absolute differences in CBFV calculated with Student's t test, a p > 0.05. Relative differences, [(A — B) · 100]:[(A + B) · 0.5], are indicated as percentages. Significance level of Pearson's correlation coefficient, b p ≤ 0.0001.
Interdiane interobserver reproducibility of CBF volume (CBFV) measurements between the 1st and 2nd day of examination in 32 subjects
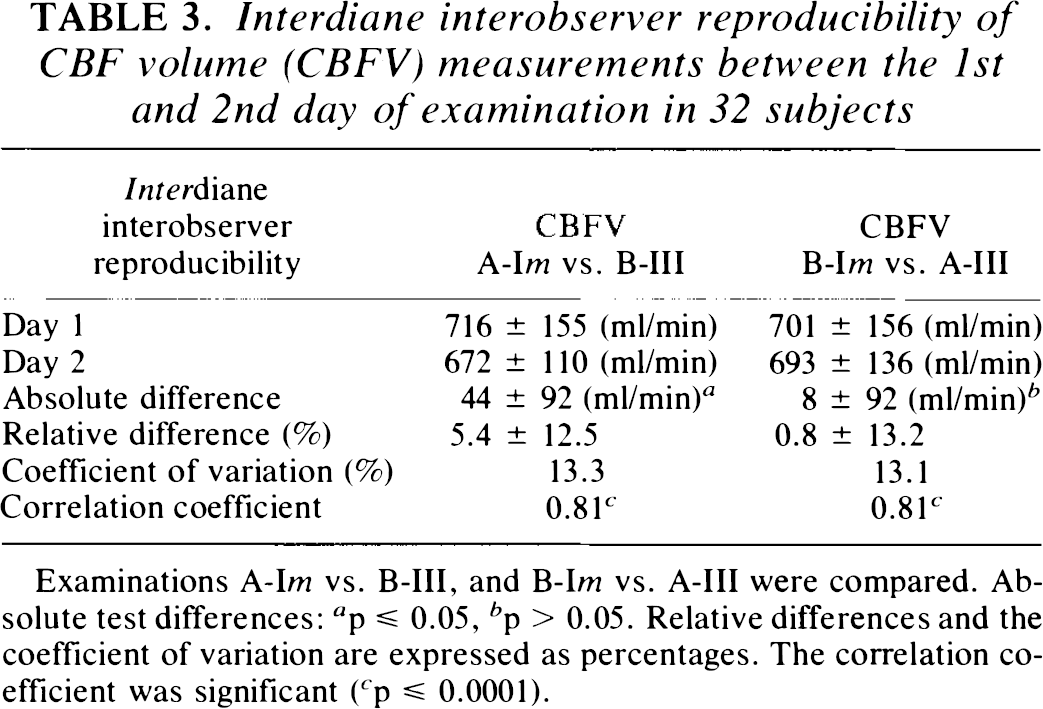
Examinations A-Im vs. B-III, and B-Im vs. A-III were compared. Absolute test differences: a p ≤ 0.05, b p > 0.05. Relative differences and the coefficient of variation are expressed as percentages. The correlation coefficient was significant ( c p ≤ 0.0001).
Interdiane interobserver reproducibility was analyzed by comparing examination “A-Im” with “B-III,” and “B-Im” with “A-III.” The results of both observers were evaluated and compared only after completion of the 32nd subject's final examination.
The effect of possible habituation to the procedure on the part of the subjects was explored by assessing each subject's sequence of examination (1–6). Due to the alternating sequence of the observers, half the test persons were examined by observers A and B in the first and each subsequent examination, respectively. By testing in this way, specific operator-related errors of judgment on the CBFV magnitude were statistically excluded and any CBFV changes arising from the order of examination were ascribed to a habituation effect. Statistical analysis was done using the SAS program (version 6.04, SAS Institute, Cary, NC, U.S.A.). All parameters and test differences are indicated as mean ± SD. Relative test differences (test difference as percentages of the mean value of both tests) were calculated according to the formula [100 · (scan 1 — scan 2)]: [(scan 1 + scan 2) · 0.5]. Intra-and interobserver differences were tested by using the Student's t test, while correlations were evaluated through the Pearson correlation coefficient. The coefficient of variance (CV) was determined by comparing the SD of the test differences as percentages of the average in both series. Finally, intradiane interobserver reproducibility was tested using the reliability test according to Bland and Altman (1986) in which the 95% interval of confidence of the mean test differences' SD was calculated.
RESULTS
In the case of one of the test persons, a 45-year-old woman, the carotid bulb on one side was situated high in the neck, which led to the examination being discontinued and the test person being excluded in the consecutive numeration. In the other 32 subjects, all vessels could be explored in each examination. In 31 subjects, there was a 1-day interval between the first and second day of examination; for technical reasons it was 2 days in one subject. Most interdiane investigations could be performed at the same time of day, none with >2-h difference.
Intraobserver reproducibility
Table 4 shows the mean ± SD of all CBFV measurements done by both examiners. A continuous decline in mean values and SD of CBFV between the first and third examination was noted by both observers. The coefficient of variance was lower in the intra- than in the interdiane comparison. The correlation coefficient was highly significant (p ≤ 0.0001) in all tests compared.
Intra- and interdiane intraobserver reproducibility of CBF volume (CBFV) in 32 subjects
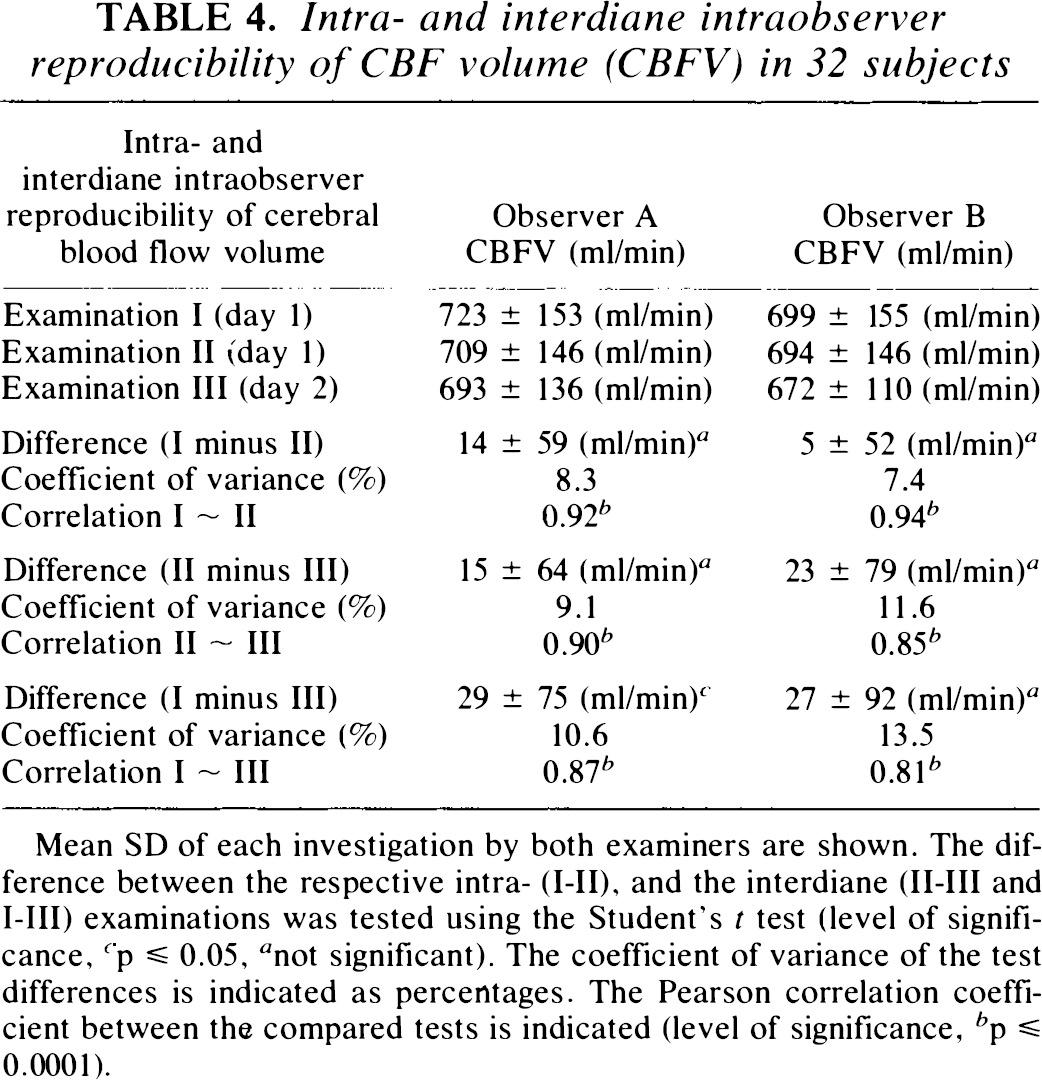
Mean SD of each investigation by both examiners are shown. The difference between the respective intra- (I-II), and the interdiane (II-III and I-III) examinations was tested using the Student's t test (level of significance, c p ≤ 0.05, a not significant). The coefficient of variance of the test differences is indicated as percentages. The Pearson correlation coefficient between the compared tests is indicated (level of significance, b p ≤ 0.0001).
Interobserver reproducibility
The mean values relating to luminal diameter, TAV, and the angle of insonation in each vessel were almost identical. Some minor differences, however, did prove to be significant; e.g., the intradiane interobserver examination on day 1 (examinations “A-Im” and “B-Im”) revealed that the luminal diameter in the ICAs measured by observer A and B on both sides was 4.6 ± 0.4 and 4.5 ± 0.4 mm, respectively (difference 0.1 ± 0.2 mm, p ≤ 0.01; CV = 5.1%; n = 64), whereas both measurements of the vertebral arteries were 3.3 ± 0.06 mm (difference 0.0 ± 0.2 mm; p > 0.05; CV = 4.6%). The TAV in the ICAs on both sides was 0.28 ± 0.06 and 0.29 ± 0.07 m/s (interobserver difference −0.01 ± 0.04 m/s, p ≤ 0.05; CV = 13.3%), whereas in the vertebral arteries it was 0.16 ± 0.04 m/s and 0.15 ± 0.05 m/s, respectively (difference 0.00 ± 0.03 m/s, p > 0.05; CV = 18.7%). The angle of insonation determined in the ICA was 57 ± 6 and 56 ± 5°, whereas in the VA it was 62 ± 4 and 61 ± 6° in the two respective examinations.
The flow volumes of the internal carotid arteries and vertebral arteries measured by both examiners are listed in Tables 5 and 6. There were only minor interobserver differences in mean values and SDs of all vessels (p > 0.05 in all cases). A consistently significant side difference in flow volumes of the left and right VAs was found by both observers on both days (Table 6). Interobserver correlation was higher in the vertebral arteries (Pearson's correlation coefficient, r ≥ 0.92; p ≤ 0.0001) than in the internal carotid arteries (0.61 ≤ r ≤ 0.85; p ≤ 0.001 and p ≤ 0.0001, respectively).
Intradiane interobserver reproducibility of intravascular flow volumes in the left and right internal carotid artery (ICA) on days 1 and 2 in 32 subjects
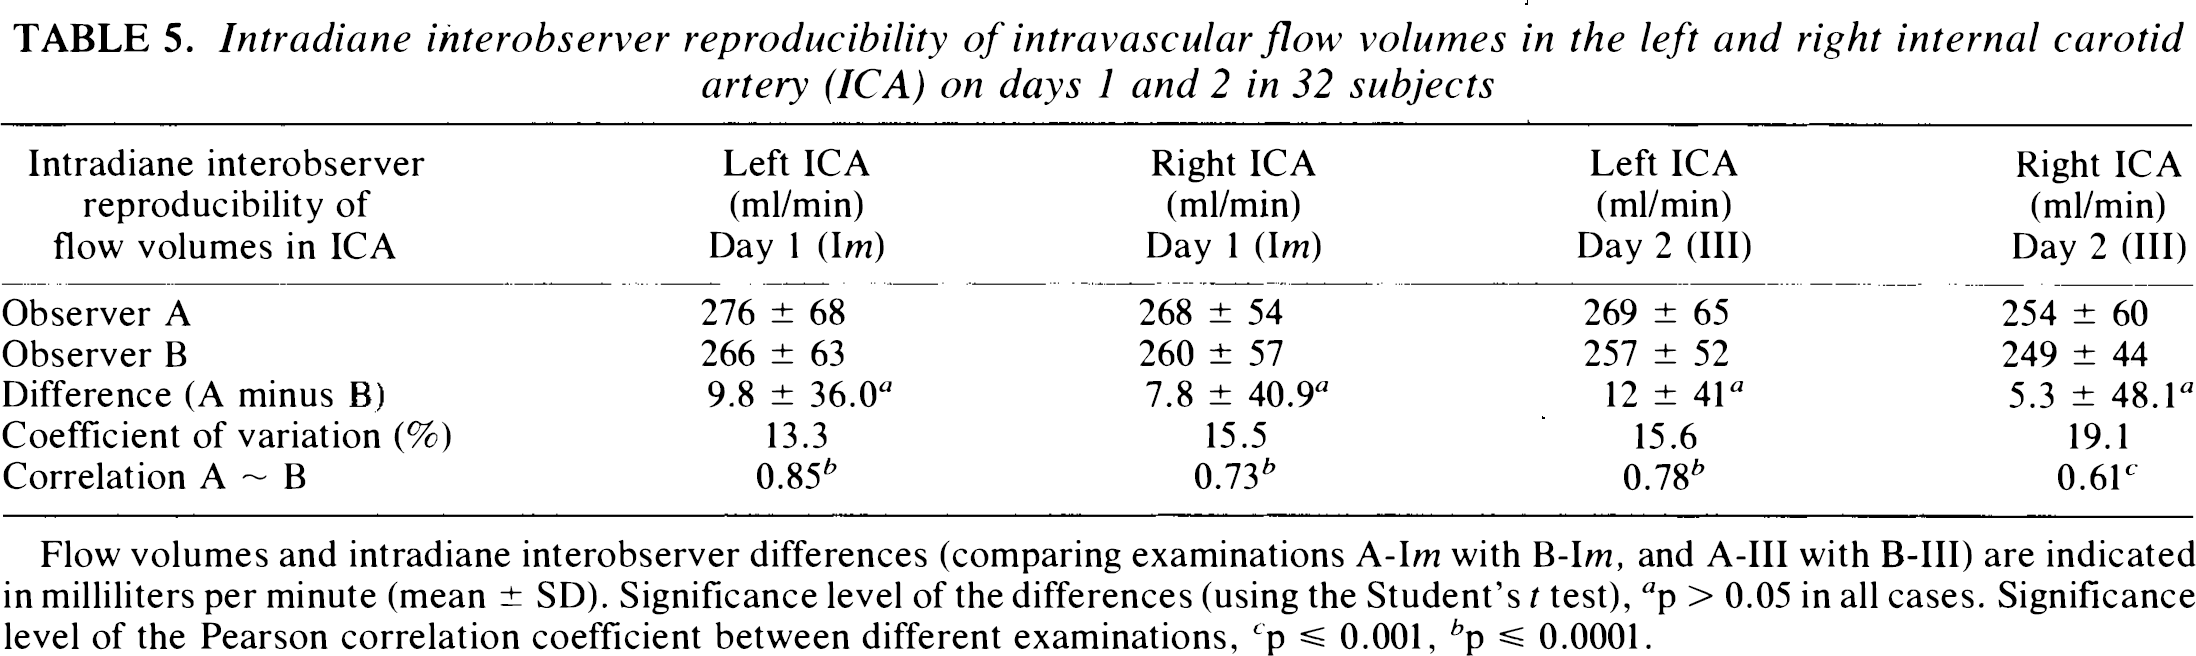
Flow volumes and intradiane interobserver differences (comparing examinations A-Im with B-Im, and A-III with B-III) are indicated in milliliters per minute (mean ± SD). Significance level of the differences (using the Student's t test), a p > 0.05 in all cases. Significance level of the Pearson correlation coefficient between different examinations, c p ≤ 0.001, b p ≤ 0.0001.
Intradiane interobserver reproducibility of intravascular flow volumes in the left and right vertebral artery (VA) on days 1 and 2 in 32 subjects
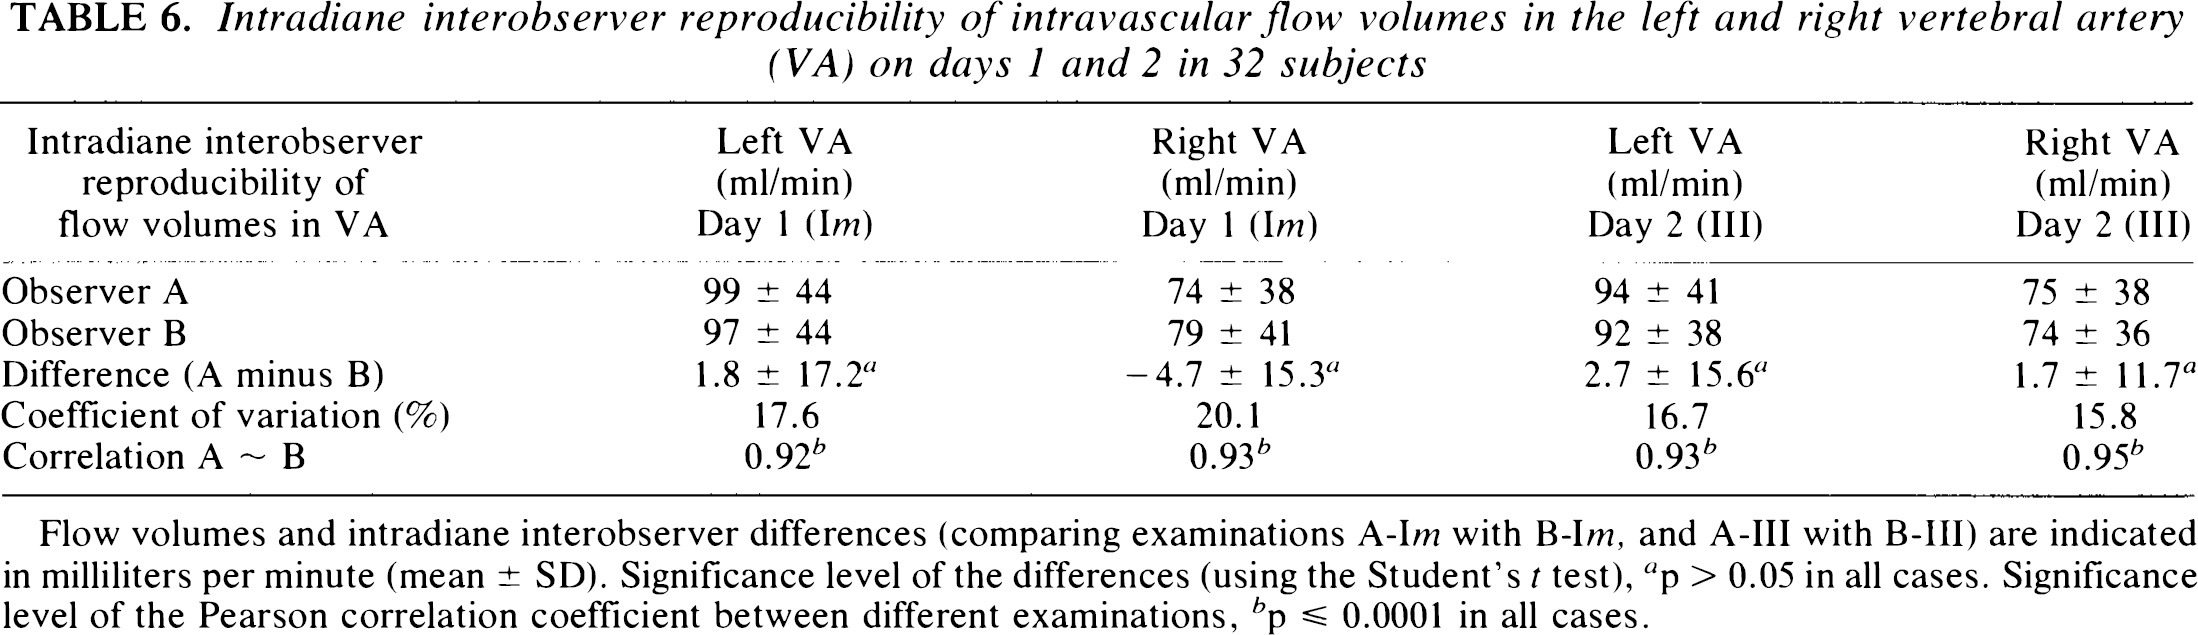
Flow volumes and intradiane interobserver differences (comparing examinations A-Im with B-Im, and A-III with B-III) are indicated in milliliters per minute (mean ± SD). Significance level of the differences (using the Student's t test), a p > 0.05 in all cases. Significance level of the Pearson correlation coefficient between different examinations, b p ≤ 0.0001 in all cases.
CBFV of successive interobserver examinations on either day are shown in Table 2. Interobserver correlation was highly significant (p ≤ 0.0001) on both days (cf. Fig. 1A and B). There was a consistently minor, insignificant difference in the mean data of observer A and B, and standard deviations were identical on both days (cf. Fig. 2A and B). The interobserver CV was ∼10% on either day. On day 1, interobserver differences relating to the same individual were below 5% in 13 of 32 subjects, between 5 and 10% in 11 subjects, between 10 and 15% in four, and between 15 and 20% in three, the maximum difference being 26% in one subject. According to the reliability test of Bland and Altman (1986) the 95% upper limits of agreement in interobserver examinations were 24% on day 1 and 27% on day 2.
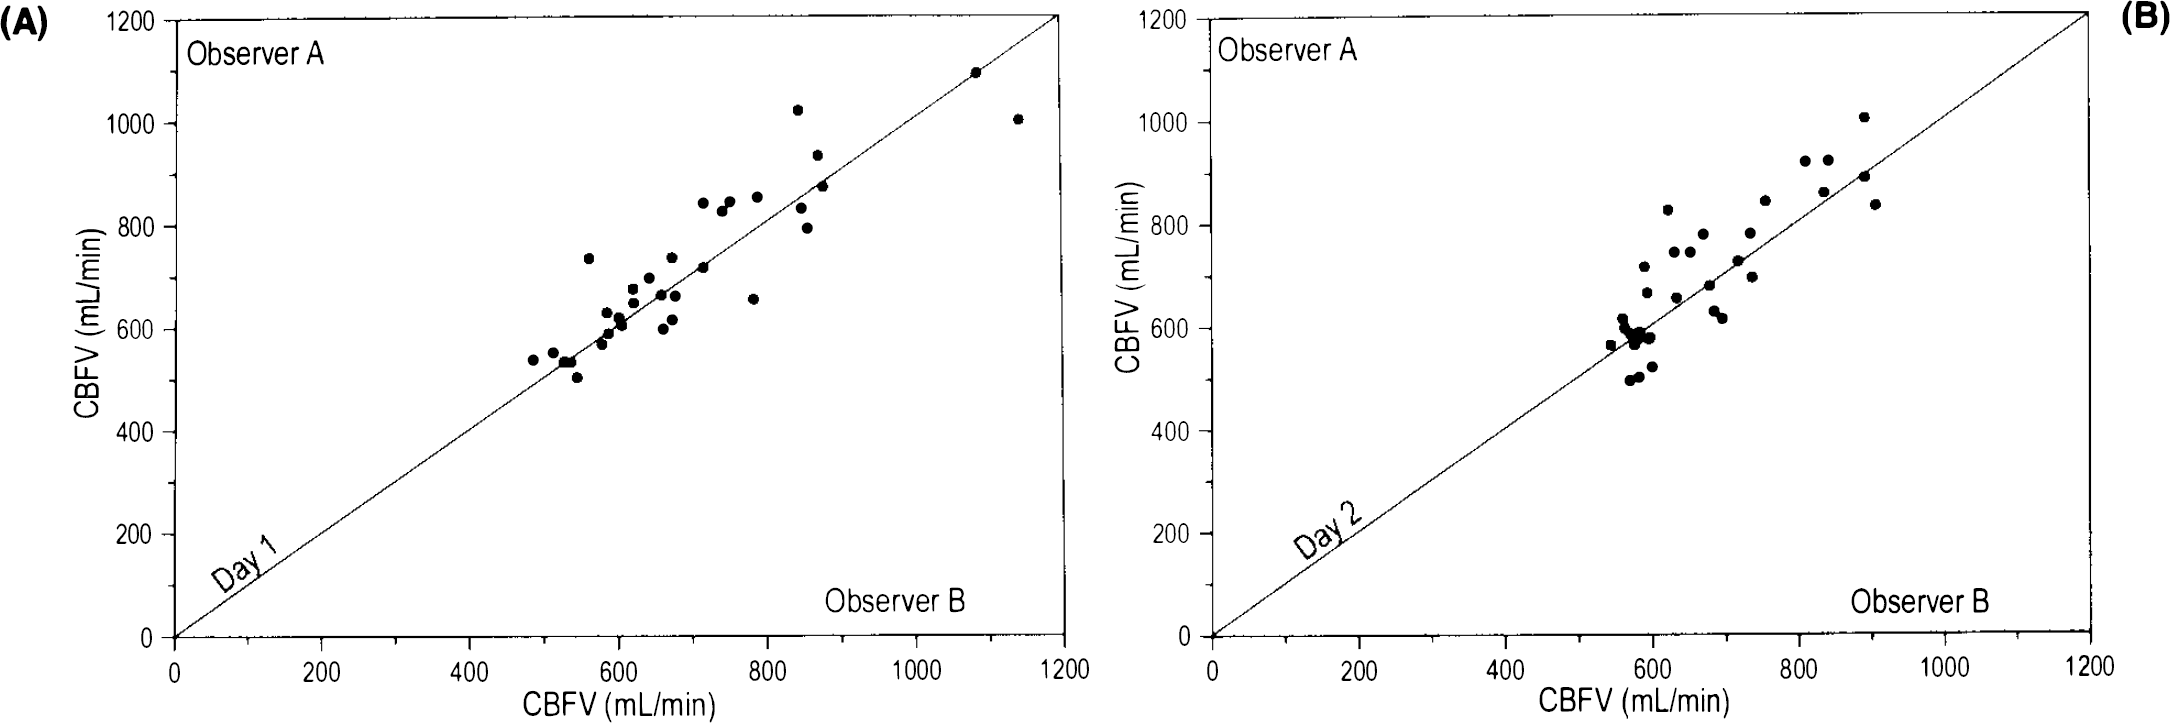
Interobserver correlation of CBF volume (CBFV). CBFV measurements of both examiners on day 1
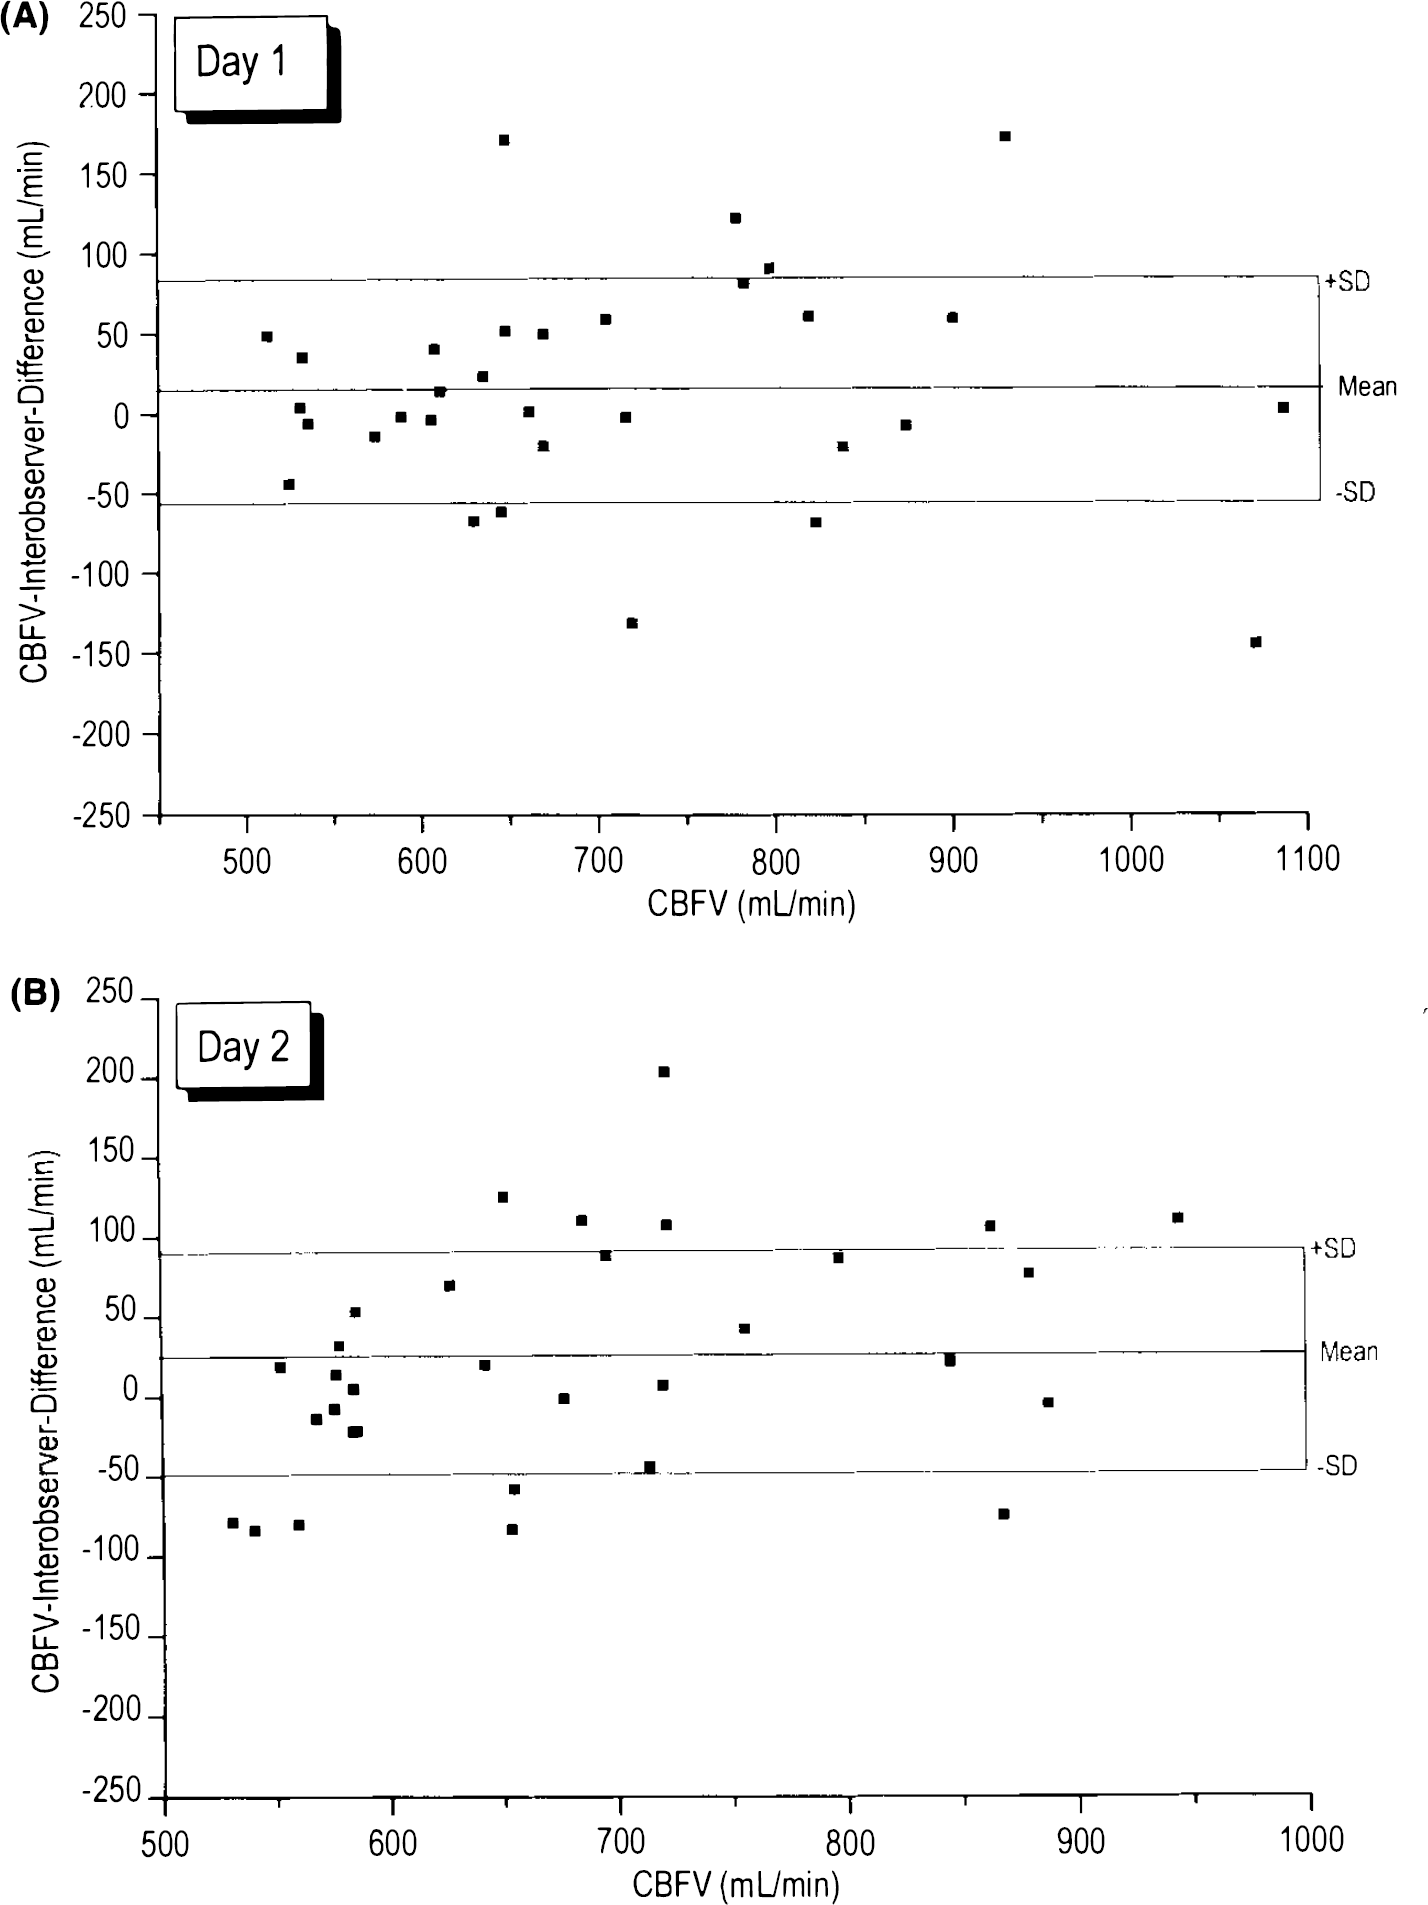
Interobserver differences in CBF volume (CBFV) in relation to the mean CBFV values. The differences in CBFV measurements of both examiners on day 1
The CV in the interdiane interobserver examination was somewhat higher than in the intradiane comparison (Table 3); the correlations were still highly significant (p ≤ 0.0001).
The habituation effect of the subjects' CBFV in relation to the order of examination can be seen in Table 7. A slight, but progressive decrease in CBFV could be observed from the first to the last examination on day 1; the difference of the first to the fourth examination being significant (p ≤ 0.05). On day 2, subjects started on an already slightly lower CBFV level than the previous day and a continuing significant decrease in CBFV was observed until the last examination (p ≤ 0.01). Furthermore, subjects with high initial CBFV showed a more pronounced decrease until the final examination on day 2 (r = 0.55, p < 0.01), and a marked decline in SDs was observed between the third and subsequent examinations. CBFV was higher in children than in adults. There was a negative correlation between CBFV and age (Pearson's correlation coefficient, r = −0.56 and r = −0.60 in the first day's series of observers A and B, respectively, p ≤ 0.001). However, the correlation of age with the habituation effect (CBFV difference between first and last examination) was not significant (r = −0.23).
Habituation effect of subjects' CBF volume (CBFV) to sequential examination
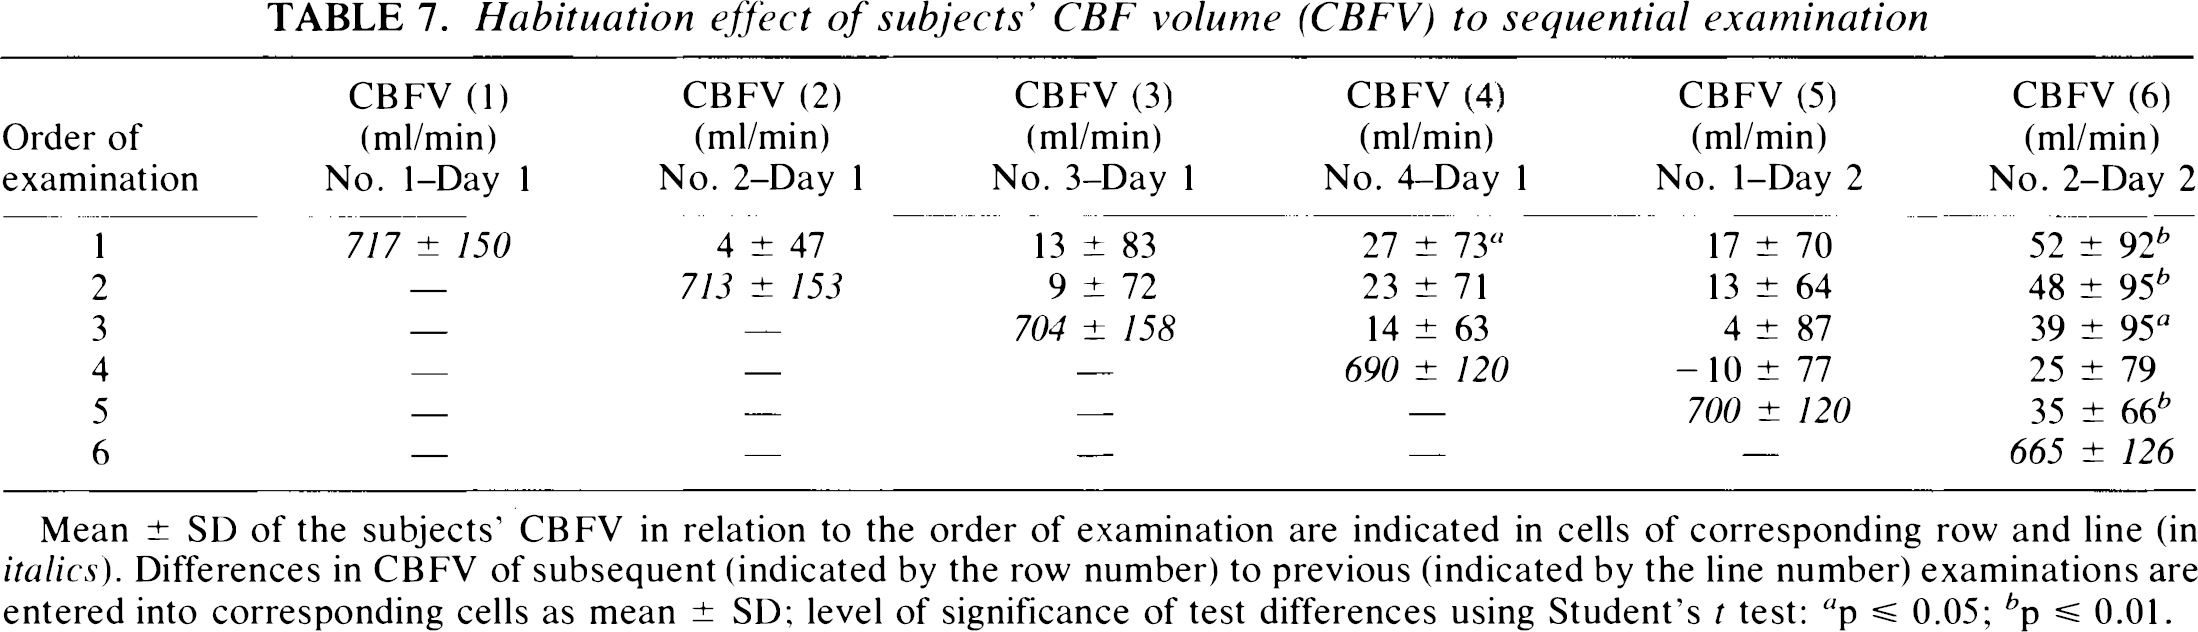
Mean ± SD of the subjects' CBFV in relation to the order of examination are indicated in cells of corresponding row and line (in italics). Differences in CBFV of subsequent (indicated by the row number) to previous (indicated by the line number) examinations are entered into corresponding cells as mean ± SD; level of significance of test differences using Student's t test: a p ≤ 0.05; b p ≤ 0.01.
DISCUSSION
In this study, global CBFV was found to be reproducible to a large extent. Very close results emerged from both examiners' observations on mean data and SDs of ICA and VA flow volumes, and high correlation coefficients were determined. Although the second examiner was unaware of the exact site of measurement, the luminal width of all arteries examined could be reproduced rather accurately (the SD of the interobserver differences amounted to merely 0.2 mm in ICA as well as in VA). The reproducibility of the diameter measurement was surprisingly high because the luminal diameter is considered to be the most unreliable part of the Doppler volume flow measurement (Smith, 1984; Gill, 1985; Bladin and Burns, 1994). In our opinion, meticulous observation of an exact examination technique is crucial. The reproducibility of the mean flow velocity (TAV) was distinctly lower than that of the luminal width, which possibly indicates that, on the level of the extracranial cerebral arteries, TAV is the variable in the variations of total CBF whereas the luminal diameter remains constant.
CBFV could be reproduced rather more exactly by the same investigator than by different investigators, which indicates an unintentional examiner bias occurring in intraobserver test-retest studies (and emphasizes the necessity of interobserver reliability tests in operator-bound examinations). Furthermore, interobserver reproducibility of CBFV was closer on the same than on consecutive days. Although the environmental conditions were very similar on both days, the magnitude of CBF could not be expected to remain constant. Natural flow volume fluctuations in a single brain-supplying artery occur even within short periods and may be compensated by variations in other arteries because the variance of flow volumes in single arteries was higher than that of CBFV (cf. Tables 2, 5, and 6). The physiological variability of normal, resting CBF is, therefore, a strong factor of interference, which partly explains why two separate intra- and interdiane CBFV examinations did not tally completely.
To date, only a few Doppler flowmetry reproducibility studies have been conducted on extracranial cerebral arteries. Uematsu et al. (1983) reported a 3.8% SD of repeated measurements in intradiane and 10.6% on interdiane test-retest examinations of flow volumes in the common carotid artery in five subjects. Juul et al. (1991) performed 8 reproducibility measurements in one subject and found a 10% and 22% CV in the common and external carotid artery, respectively. In the internal carotid artery a 15% CV was calculated, which corresponds with our interobserver results in 32 subjects.
At present, quantitative CBF measurements are done by using radionuclide substances mainly with the 133Xe inhalation and H215O PET techniques. The reproducibility tests that have been done with these methods are listed in Table 8: The variance of the interdiane reproducibility tests was within the same range as in the interdiane intra- and interobserver section of our study. As far as the intradiane test-retest investigations are concerned, variance was slightly lower in some studies investigating smaller groups (Frackowiak et al., 1980; Warach et al., 1987; Cameron et al., 1990).
Reproducibility of CBF measurements reported in different studies
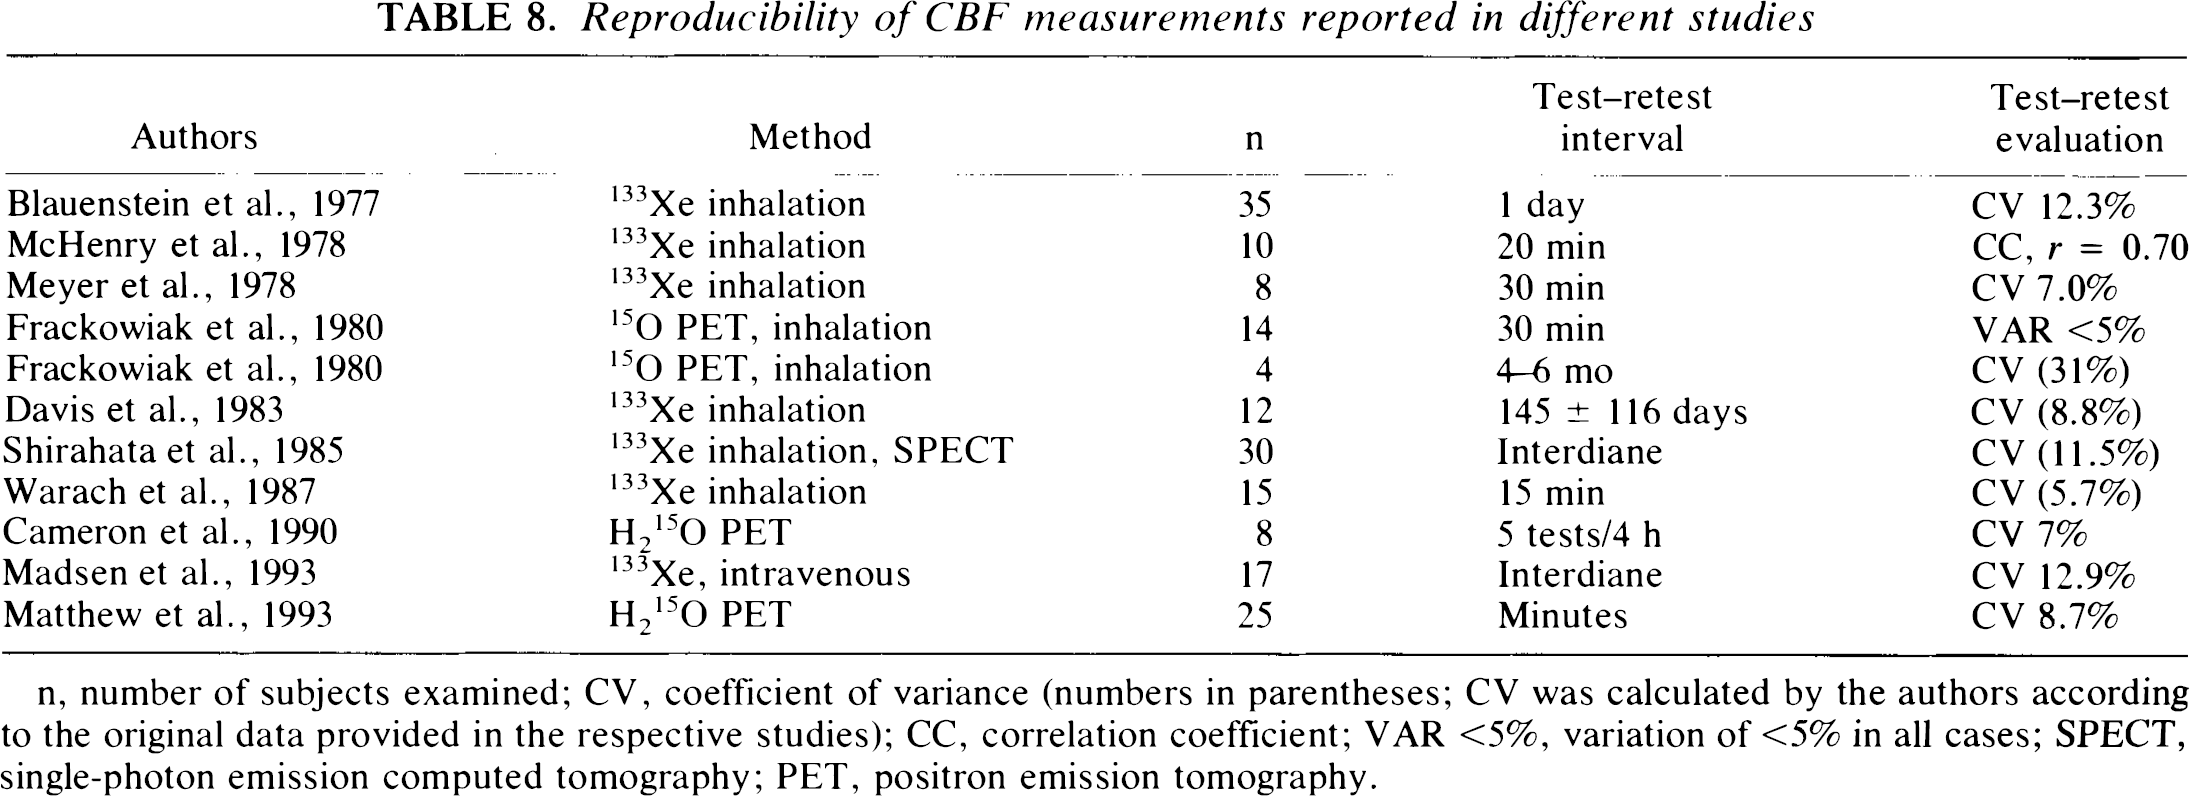
n, number of subjects examined; CV, coefficient of variance (numbers in parentheses; CV was calculated by the authors according to the original data provided in the respective studies); CC, correlation coefficient; VAR <5%, variation of <5% in all cases; SPECT, single-photon emission computed tomography; PET, positron emission tomography.
Recently, Matthew et al. (1993) published an intradiane reproducibility study on H215O PET measurements of CBF. Its design and evaluation are similar to ours and it may thus serve as a genuine reference study. In 25 male subjects, the tracer was applied intravenously and arterial blood samples were drawn. Each subject first underwent a “sham scan” followed by two resting H215O PET scans to lower the risk of a possible habituation effect (the sequence of the studies was not revealed to the test persons). Global CBF was 40.3 ± 6.4 ml/100 g/min and 39.3 ± 6.5 ml/100 g/min in the first and second examination, respectively. The correlation coefficient amounted to 0.83 (p ≤ 0.001), and the relative difference (determined with the test difference as a percentage of the first scan) was 2.3 ± 8.7%. Using these original data, our calculation of the 95% interval of confidence of the mean test differences (according to the reliability test of Bland and Altman, 1986) was 2.3 ± 23.3%. By using the same formula as in Matthew's evaluation, the relative interobserver CBFV difference proved to be 1.7 ± 9.2% on day 1, and 2.0 ± 10.2% on day 2, and the 95% limits of agreement (Bland and Altman, 1986) amounted to 1,7 ± 23.8% and 2.0 ± 26.4%, respectively, in our study. Hence, there is only a minor difference in the reproducibility of global CBF measurements between the H215O PET and the color duplex methods.
A direct and simultaneous comparison of these techniques in the same study group is necessary, although it must be remembered that possible differences in the results of both methods might remain unexplained because no absolute standard exists. Besides this, the exact weight of the individual brain as a criteria in converting global CBFV (measured in milliliters per minute) to mean CBF (measured in milliliters per 100 g per minute with PET) is not yet known. Furthermore, a different state of “arousal” resulting from an invasive technique using radionuclides or from a noninvasive method may influence the results.
Using the 133Xe technique, some groups have shown that CBF tends to decrease in successive examinations (Blauenstein et al., 1977; Maximilian et al., 1978; Meyer et al., 1978; Warach et al., 1987; Warach et al., 1992). In four consecutive measurements taken under resting conditions, Prohovnik et al. (1980) found a 7% (insignificant) decrease of mean CBF and a 50% reduction of SD between the first and second examinations in 16 test persons, whereas in subsequent examinations there was no further change.
In the present study, a marked habituation effect was seen during consecutive recordings within the observation period of 1 h on day 1 and 30 min on day 2. This habituation effect was more pronounced in subjects with high initial CBFV and could be statistically proven because it was independent of the order of the examiners. The subjects adapted to the procedure on day 2 even during much shorter periods, almost as if the habituation effect would be a trained reflex (cf. Table 7).
Serial CBF measurements using radionuclide methods cannot be conducted for ethical reasons because of radiation exposure. Our results suggest that the “true” resting CBFV level may possibly be reached only after four or more examinations. Therefore, the habituation effect must be taken into consideration before any study on the effect of sensory–cognitive input or pharmacological substances on CBF is designed.
To summarize, color duplex flowmetry of the extracranial cerebral arteries is a new noninvasive method of determining global CBFV. By strictly following a precise examination technique, the repeatability of the method is comparable to that of mean CBF measurements using the 133Xe inhalation or the H215O PET techniques. Serial CBFV measurements can be repeated without posing the risk of radiation. The method can be easily applied for bedside examinations in the intensive care unit, and could be particularly suitable in monitoring patients with impaired cerebral perfusion, e.g., head trauma, brain edema, subarachnoid hemorrhage, cerebrovascular lesions and malformations.
Until recently, bedside determinations of CBF were possible only through blind Doppler examination of flow velocities in basal cerebral arteries (Aaslid et al., 1982). The development of transcranial color duplex sonography provided the means to determine “true,” angle-corrected mean TAV in the anterior and posterior cerebral circulation (Schöning and Walter, 1992; Schöning et al., 1993a, 1993b), which are directly proportional to intravascular flow volumes. Color duplex flowmetry of the extracranial cerebral arteries now permits measurement of the volume flow to the brain and has the potential to become a powerful diagnostic tool in the noninvasive assessment of normal and pathological brain circulation.
Footnotes
Acknowledgment:
We thank Mr. C. Meisner for his support in the statistical evaluation of data.