
Abstract
The difference between 1H nuclear magnetic resonance (NMR) spectra obtained from the human brain during euglycemia and during hyperglycemia is depicted as well-resolved glucose peaks. The time course of these brain glucose changes during a rapid increase in plasma glucose was measured in four healthy subjects, aged 18–22 years, in five studies. Results demonstrated a significant lag in the rise of glucose with respect to plasma glucose. The fit of the integrated symmetric Michaelis–Menten model to the time course of relative glucose signals yielded an estimated plasma glucose concentration for half maximal transport, Kt, of 4.8 ± 2.4 mM (mean ± SD), a maximal transport rate, Tmax, of 0.80 ± 0.45 μmol g–1 min–1, and a cerebral metabolic glucose consumption rate (CMR)glc of 0.32 ± 0.16 μmol g“1 min”1. Assuming cerebral glucose concentration to be 1.0 μmol/g at euglycemia as measured by 13C NMR, the fit of the same model to the time course of brain glucose concentrations resulted in Kt = 3.9 ± 0.82 mM, Tmax = 1.16 ± 0.29 μmol g–1 min–1, and CMRglc = 0.35 ± 0.10 μmol g–1 min–1. In both cases, the resulting time course equaled that predicted from the determination of the steady-state glucose concentration by 13C NMR spectroscopy within the experimental scatter. The agreement between the two methods of determining transport kinetics suggests that glucose is distributed throughout the entire aqueous phase of the human brain, implying substantial intracellular concentration.
Human brain function depends upon a continuous supply of glucose from the blood. The specific glucose transport mechanism from the blood has been shown to be of the insulin-independent facilitated diffusion type with saturation kinetics (Crone, 1965; for reviews see e.g. Pardridge 1983; Lund-Andersen, 1979; Pelligrino et al., 1992; Gjedde, 1992) and is mediated by transporter molecules (Mueckler et al., 1985; Kalaria et al., 1988), mostly GLUT-1 (Pardridge et al., 1990) in the capillary endothelial cells, referred to as the blood–brain barrier (BBB). Free glucose is measurable in animal brain (Gjedde and Diemer, 1983; Holden et al., 1991; Mason et al., 1992). Under physiological conditions, free glucose is measurable in the human brain (Gruetter et al., 1992a) providing direct evidence that transport rates are in excess of the metabolic rate. Glucose transport may, however, become rate-limiting to the metabolic rate in a variety of situations, such as hypoglycemia, seizures (Siesjö, 1978), molecular defects of glucose transporter (De-Vivo et al., 1991), hypoxic-ischemic encephalopathy, and Alzheimer's disease (Kalaria and Harik, 1989). Quantitative measurements of glucose transport using radioactive tracers have been difficult to interpret in humans (Brooks et al., 1986; Feinendegen et al., 1986; Gutniak et al., 1990; Blomqvist et al., 1991), because the contribution of radiolabeled glucose or glucose analogs to the time course of measured tissue radioactivity needs to be deconvolved from the accumulation of radioactivity in metabolic intermediates or products. It is well established that the brain glucose concentration is a critical parameter in the analysis of results from experiments using radiolabeled glucose or glucose analogs (Gjedde and Diemer, 1983; Gjedde 1982; Holden et al., 1991; Sokoloff, 1984).
A study performed in this laboratory by noninvasive 13C nuclear magnetic resonance (NMR) determined the brain glucose concentration in humans to be 1.0 ± 0.1 μmol/ml brain volume at euglycemia (Gruetter et al., 1992a). The kinetic parameters of glucose transport were determined by measuring the steady-state brain glucose concentration as a function of plasma glucose and by fitting the data to the symmetric Michaelis–Menten model of glucose transport (Lund-Andersen, 1979; Gjedde and Christensen, 1984). This model assumes that the blood-brain barrier is rate-limiting for glucose transport into the entire brain with transport from extracellular to intracellular space being relatively rapid.
A limitation of determining kinetic constants from the relationship between brain and plasma glucose concentrations is the dependence upon the assumption that the rate-limiting step for glucose transport into the brain cells is at the BBB. Alternatively, the rate-limiting step could be at the cell membrane, and the glucose measured by 13C NMR is entirely within the extracellular space at near-equilibrium with plasma glucose. In this case, intracellular glucose would be zero and transport at the cell membranes would be rate-limiting for metabolism. To test these possibilities, we derived brain glucose transport kinetics from the time course of the change in brain glucose measured by the more sensitive 1H NMR difference spectroscopy after a rapid increase in plasma glucose concentration. The observed time course of changes in brain glucose concentration in the occipital lobe was compared directly to the time course predicted from the kinetic constants derived from steady-state measurements of brain glucose concentrations (Gruetter et al., 1992a). Included are also some quantitative estimates of the contribution of the glucose signal to the *H NMR signal at euglycemia. A preliminary report has appeared previously (Novotny et al., 1992).
METHODS
All experiments were carried out on a 2.1 Tesla whole-body magnet (Oxford Magnet Technology, Oxford, England) with an extensively modified Biospec spectrometer (Bruker-ORS, Billerica, MA, U.S.A.) equipped with an active-shielded gradient set (Oxford) of 72 cm clear diameter. Subjects were positioned in the supine position on an elliptic 6 × 7 cm diameter surface coil. Positioning was based on MR inversion recovery images—inversion time (TI) = 800 ms, echo time (TE) = 10 ms, repetition time (TR) = 2.5 s)—obtained as gradient echoes in sagittal and transverse planes. Localized automatic shimming was performed on all first- and second-order shim coils using FASTMAP (Gruetter, 1993). A volume of 36 ml was localized in the occipital lobe of the brain using the pulse sequence described previously (Gruetter et al., 1992b), with some modifications: Three-dimensional localization was obtained with ISIS (Ordidge et al., 1986) in conjunction with 5.5 ms phase-swept hyperbolic secant pulses (Silver et al., 1984; Baum et al., 1985) with μ = 8 resulting in 4 kHz bandwidth. Outer volume suppression using 9-ms noise pulses (Connelly et al., 1988) was applied in the two planes perpendicular to the coil. The signal was detected as a spin echo (TE = 16 ms) generated by a sine pulse defined over ± 5π exciting a slice parallel to the surface coil plane in conjunction with a semiselective binomial refocusing θx — η — θ–x pulse, where η was set to 5 ms. Use of the semiselective refocusing pulse separated the spatial and frequency selectivities and generated a positive amplitude throughout the spectrum (Blondet et al., 1987). A 9/3 pulse prior to the localization sequence was used to reduce signals from high B1 flux regions (Shaka and Freeman, 1985). Unwanted transverse coherences were dephased by gradient pulses and surface gradient spoiler pulses (Chen and Ackerman, 1989) throughout the sequence. Longitudinal magnetization was minimized after the data acquisition period of 256 ms by applying a 90° composite pulse (Levitt and Ernst, 1983), i.e., (θ/2)x(θ/2)y(θ/2)x(θ/2)–y. Water suppression was achieved by the semiselective refocusing pulse and by low power presaturation (<0.2 Watts total) during the recovery delay, which was applied with a second low-power amplifier through a directional coupler. In order to correct for field drift during blood sampling, spectra were collected in 3-min blocks (64 scans, 2.5 s repetition time). Difference spectra were obtained by extensive zero filling and corrected for frequency shifts only. Constant phase corrections were maintained throughout each study. Difference spectra were processed with Lorentzian-to-Gaussian conversion (Gaussian factor = 0.15, Lorentziån = −5Hz) plus baseline correction between 2.5 and 4.5 ppm and were expressed in % of the maximum increase, defined by the mean of the last four measurement points.
Catheters were placed into the left antecubital vein for the glucose infusion and the right upper extremity was catheterized to obtain blood samples. To aid with sampling of arterialized blood, preheated saline bags were placed at the elbow and at the wrist. Plasma glucose concentrations were measured every 5 min in a Beckman glucose analyzer (Beckman, Fullerton, CA, U.S.A.) using the glucose oxidase technique. A variable priming infusion of glucose, dextrose, 20% (wt/vol) was begun at t = 0 min so that the plasma glucose concentration was raised acutely and maintained ∼10 mM above baseline for 60 min according to previously described procedures (De Fronzo et al., 1979; Shulman et al., 1990). A total of five studies were performed in four subjects (18–22 years). Full written informed consent was obtained prior to each study, which was approved by the Yale Human Investigations Committee. Sensory stimulation was minimized by having subjects wear eye patches and ear plugs.
Kinetic analysis of time courses
To analyze the time course of incremental brain glucose changes, we used the integrated symmetric Michaelis–Menten model of glucose transport (Lund-Andersen, 1979; Carruthers, 1990), shown in Fig. 1A. This model assumes identical apparent Michaelis–Menten kinetics for both transport in, Tin, and out, Tom, of the brain. The model is entirely characterized by the apparent half-saturation constant Kt (mM plasma glucose concentration), the apparent maximal transport rate, Tmax μxmol g−1 min−1), the glucose consumption rate, CMRglc μxmol g−1 min−1), and the distribution volume of glucose, Vd = 0.77 ml/g (Lund-Andersen, 1979; Gjedde and Diemer, 1983). Using the kinetic constants of this model, the differential equation
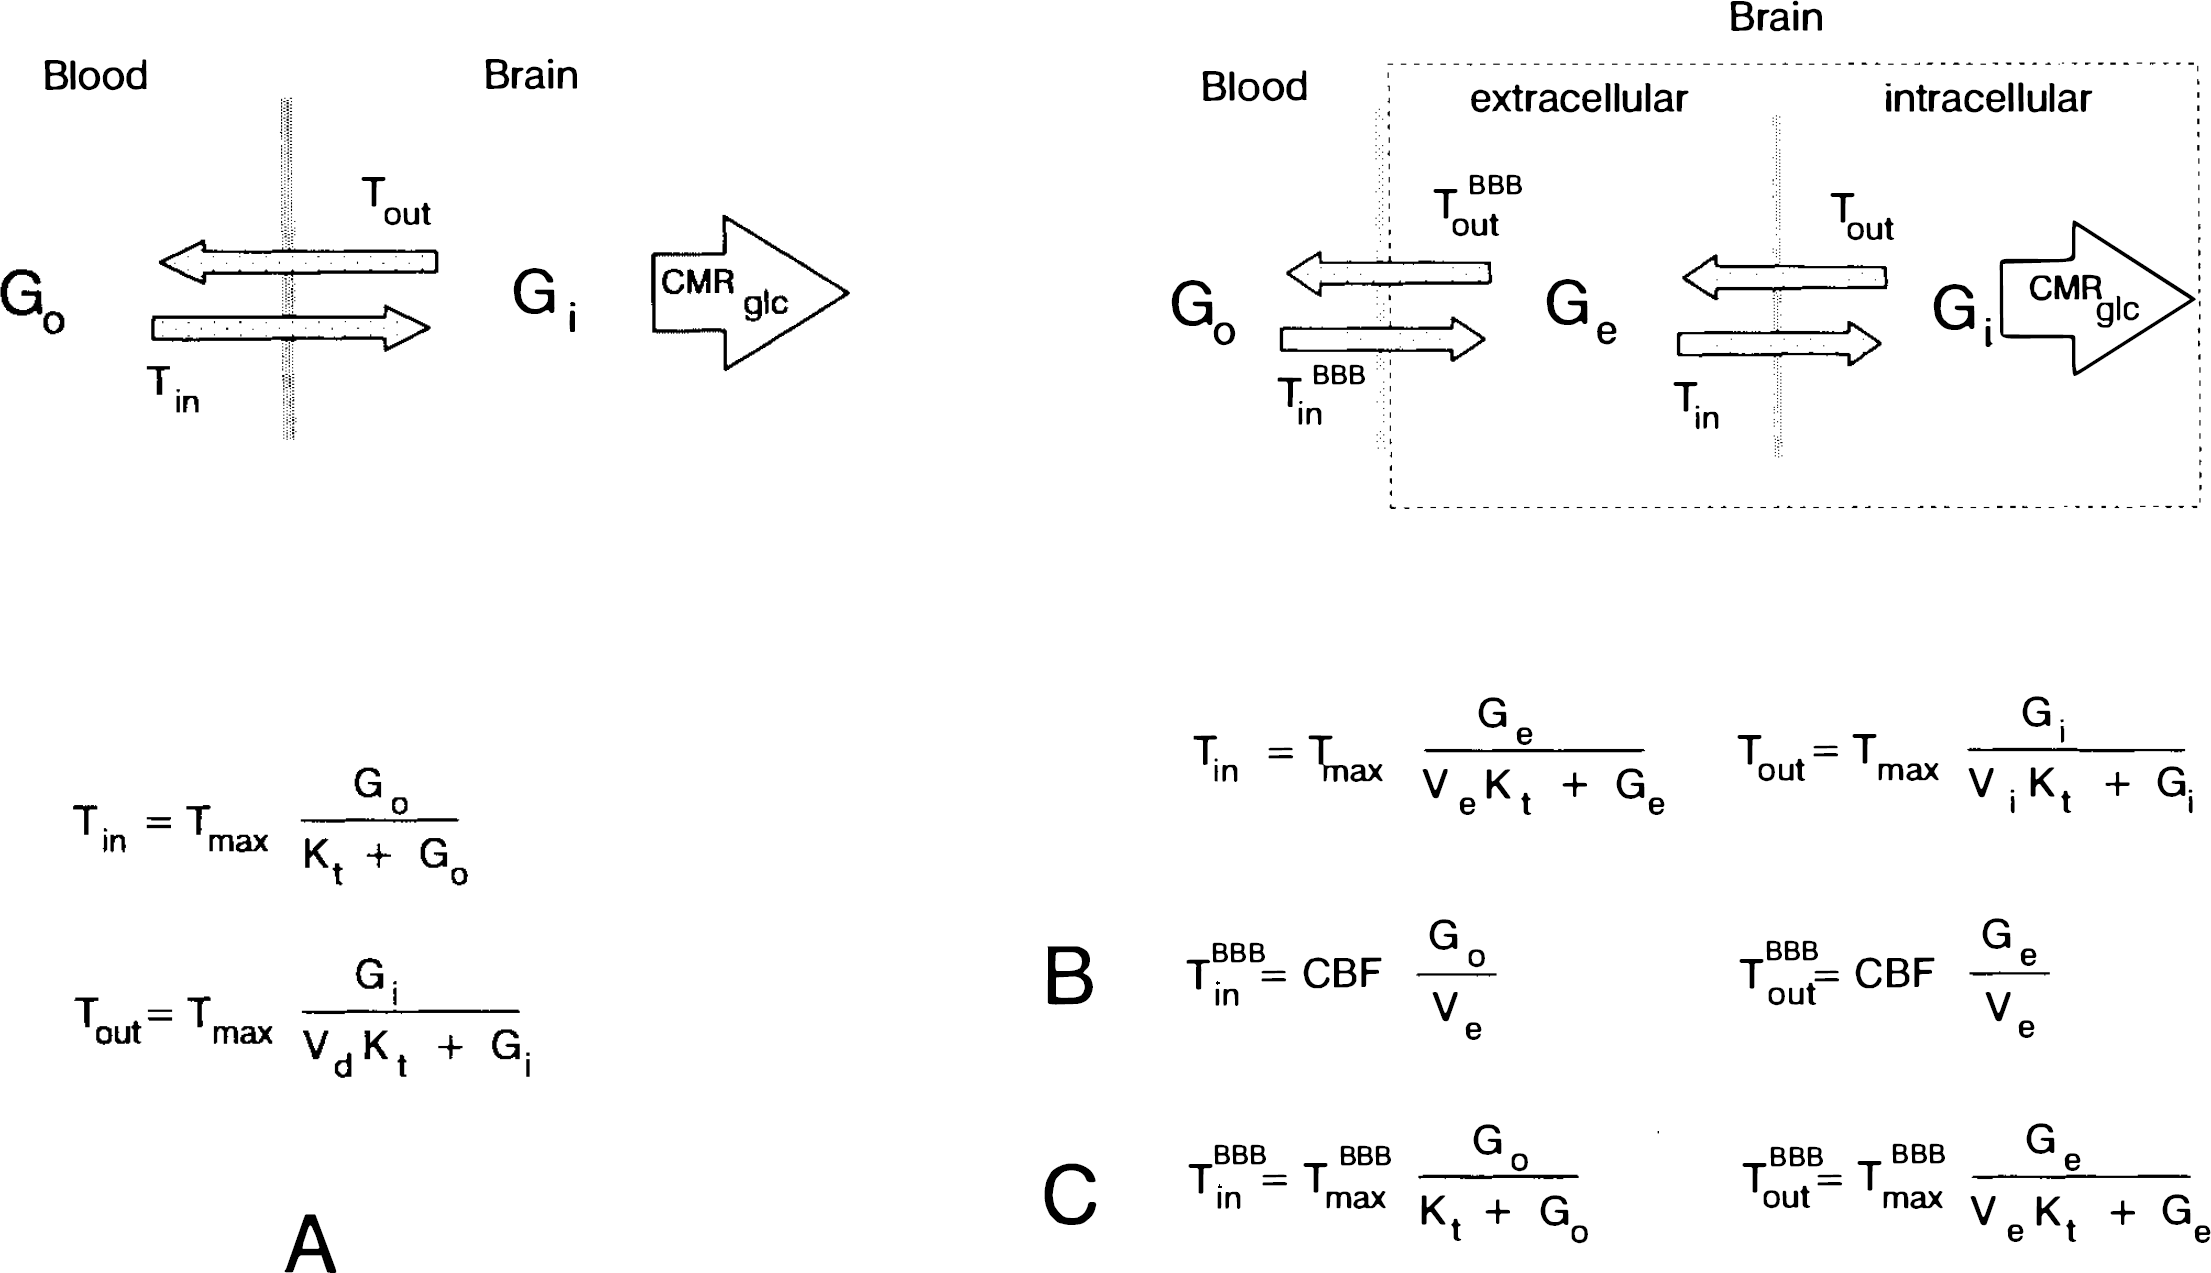
Models of glucose transport in the human brain.
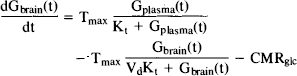
describes the change in brain glucose Gbrain(t) μmol/g) as a function of changes in plasma glucose Gplasma(t) (mM). The time-independent form of this equation (Eq. 3) has been used in a number of studies to determine glucose transport kinetics from steady-state glucose measurements in animal (e.g., Gjedde and Christensen, 1984; and refs therein; Holden et al., 1990; Mason et al., 1992) and human brain (Gruetter et al., 1992a).
Tmax represents the rate of product formation when the enzyme substrate complex concentration equals the total enzyme concentration, Etot. In the present model, Tmax is, therefore, by definition a constant with respect to Gplasma. Conversely, Kt is the Michaelis–Menten constant, i.e., the plasma glucose concentration at which the transport rate is half-maximal. Note that this model assumes that the rate of product formation (transport of glucose into the brain) is not significantly product inhibited. CMRglc is assumed to be constant since hexokinase is heavily saturated under the conditions of this study. An alteration of CMRglc through, e.g., a change in Vmax, is unlikely based on the evidence of studies showing that net glucose uptake at hyperglycemia is constant (e.g., Pappenheimer and Setchell, 1972). In addition, evidence from studies using 13C-labeled glucose and NMR from this brain region measured under identical experimental conditions (Gruetter et al., 1994; Mason et al., 1995) show that at glycemia similar to that of this study, the measured CMRglc agrees with values obtained by other methods at euglycemia.
Equation 1 is justified from the Michaelis–Menten condition, which requires the rate of the enzyme-substrate complex formation and breakdown to be fast compared to the rate of product formation (Mahler and Cordes, 1971). A rise in plasma glucose from 5 to 15 mM in 10 min corresponds to change from 50 to 75% transporter saturation (assuming a Kt of ∼5 mM), i.e., a 2.5%/min rise, which is much slower than the 0.1 s of equilibration reported ported for endothelial cells (Gjedde and Christensen, 1984) suggesting that the rate of glucose-transporter complex formation is several orders of magnitude faster than the rate of plasma glucose concentration change achievable in humans.
Since changes in glucose concentration were measured, Eq. 1 was rewritten as
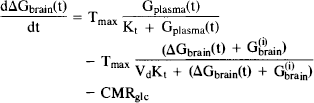
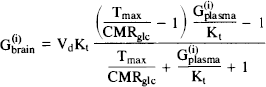
Differential brain glucose is given by ΔGbrain(t) = Gbrain(t) − G(i)brain and the initial steady-state brain glucose concentration G(i)brain is given by Eq. 3, the steady-state formulation of Eq. 1 at the initial plasma glucose concentration G(i)plasma:
For numerical simulations, Eq. 2 was solved to give ΔGbrain(t) using nonlinear methods with Gplasma(t) derived from the linear interpolation of the measured plasma glucose concentrations. The term Vblood × ΔGplasma(t) was added to give the change in total observed glucose signal ΔGobs(t), i.e.,

to account for a small potential contribution of plasma glucose to the signal. Vblood was set to 0.035 ml/g based on position emission tomography (PET) and other measurements of blood volume in human gray matter (Marchal et al., 1992; Hino et al., 1992; Sabatini et al., 1991). The average of the last four time points of ΔGobs(t), i.e., G(f)obs was used to scale ΔGobs(t) to 100%, giving G*norm(t) (Eq. 5).
Differential equations were solved using the Bulirsch-Stoer algorithm (Press et al., 1989). All numerical solutions were performed on a 16 MHz Zenith 386SX desktop computer equipped with a 387SX coprocessor using Turbo Pascal 6.0 Professional (Borland). In order to maintain computational efficiency, n ≤ 3 variables fitted to the data.
In order to further evaluate the assumptions of the symmetric Michaelis–Menten model of glucose transport, e.g., large physical distribution space and the rate-limiting step for transport at the BBB, three models were tested as described in Fig. 1; the numerical analysis performed is described below:
Model A: Symmetric Michaelis–Menten model (Fig. 1A). This model assumes that transport across the BBB is rate-limiting and equilibration within the brain is fast, resulting in a single kinetic pool within the brain. Influx, Tin, and efflux, Tout, across the BBB are characterized by Michaelis–Menten kinetics with identical kinetic constants, Tmax and Kt. Physical distribution volume of glucose is the entire aqueous phase of water, Vd = 0.77 ml/g (Eq. 1). Fitting of the resulting Eq. 5 to the experimental time course was performed by minimizing the sum of squared residuals over a grid search of Tmax = 0.4..1.6 μmol g−1 min−1, CMRglc = 0.20–0.50 μmol g−1 min−1, and Kt = 1.0..8.0 mM. This fit was then compared with the values determined by the 13CMR experiments.
In a different analysis, we used the kinetic constants from the 13C NMR measurements (Gruetter et al., 1992a) to determine the initial and final glucose concentrations based on plasma glucose concentration. The time course of brain glucose Gobs(t) was then fitted based on Eq. 4 in order to assess whether this additional information improved the precision of Tmax, and Kt, and CMRglc determination.
Model B: Fast exchange between plasma and extracellular glucose. An alternative explanation for the 13C NMR measurements is that the observed brain glucose enters the brain by rapid free diffusion only into the extracellular space. In this model, intracellular glucose G; is assumed to be zero and extracellular glucose Ge in free exchange with plasma glucose, Go, using Fick's principle, shown in Fig. 1B, by solving
instead of Eq. 1 and scaled analogously. As shown in Results, with an average CBF = 0.5 ml/g−1 min−1 and an extracellular volume of 0.20 ml/g, the resulting time course of glucose in extracellular space follows closely that in plasma with a lag <1 min.
Model C: Michaelis–Menten kinetics for fast exchange at the BBB. In this model, it is assumed that all of the brain glucose is in extracellular space (Ve = 0.2 ml/g, G1 = 0), but that glucose transport across the BBB is described by Michaelis–Menten kinetics using Eq. 1 with Vd = Ve = 0.2 ml/g as indicated in Fig. 1C, assuming Gi = 0, i.e., Tout = 0, Tin = CMRglc. The previous quantification by 13C NMR is, in that case, consistent with a lower limit for Tmax/CMRglc of 25, as derived by fitting Eq. 3 to the measured steady-state glucose concentrations given in Gruetter et al. (1993). In these simulations Tmax/CMRglc = 25 was, therefore, assumed, resulting in a lag to plasma glucose that was similar to that in model B, i.e., 1 min.
Calculation of the distribution space of glucose. In a fourth set of simulations, we fitted Vd in Eq. 1, instead of CMRglc, which was set to 0.35 μmol g−1 min −1, based on previous measurements in the occipito-parietal region by radioisotope methods (Heiss et al., 1984; Tyler et al., 1988) and by 13C NMR (Gruetter et al., 1994; Mason et al., 1995). For this purpose, the differential Eq. 4 was fitted to the change in brain glucose expressed in μmol/g, as described in model A. The minimization of χ2 was performed using the direction set (Powell) method (Press et al., 1989).
RESULTS
Assignment of in vivo glucose resonances
Measurement of the brain glucose concentrations by localized 13C NMR had the advantage of being a direct quantitative measurement of well-resolved peaks, albeit with relatively low spatial and temporal resolution. In another study, we showed that 1H NMR difference spectroscopy can be used to measure changes in brain glucose content after a rapid increase in plasma glucose (Gruetter et al., 1991; Gruetter et al., 1992b; Gruetter et al., 1993) with much higher sensitivity than 13C NMR.
Figure 2A shows regions of short-echo 1H NMR spectra (TE = 16 ms) obtained at euglycemia (4.8 mM) and hyperglycemia (18 mM) during a study. The dominant resonance was that of H2O at 4.72 ppm. At hyperglycemia, significant signal increases were seen at 5.23, 3.81, and 3.44 ppm in the spectra, as indicated by the dotted vertical lines. The corresponding difference spectrum is shown in Fig. 2B and is compared to a spectrum of a phantom, containing equimolar creatine and glucose [∼150 mM phosphate buffer (pH 7.1), 2 mM NaN3, 10 mM acetate, T 37°C]. The solution spectrum was line-broadened to match in vivo creatine linewidths. Chemical shifts and relative amplitudes in the in vivo difference spectrum (Fig. 2B) corresponded to those of glucose in the line broadened solution spectra.
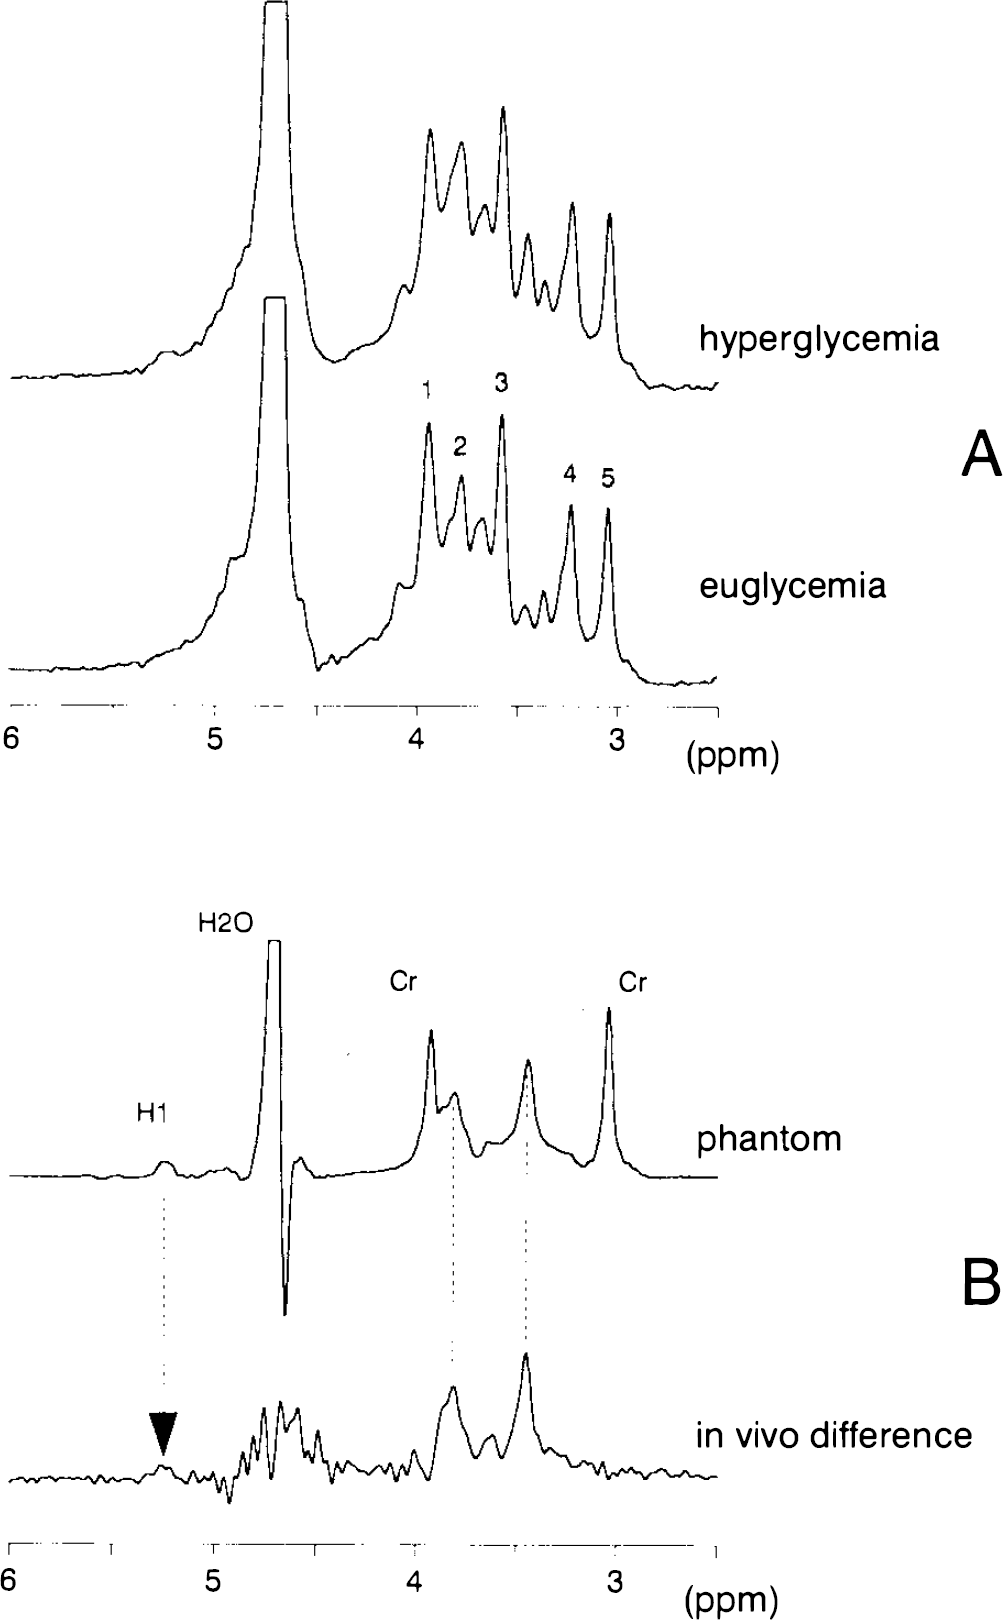
1H MR spectra (TE = 16 ms) acquired before and during glucose infusion.
Assessment of spectral overlap
Although measurement of total brain glucose levels by 1H NMR has been attempted without taking into account contributions of other compounds to the NMR signal (Gyngell et al., 1991; Merboldt et al., 1992; Kreis and Ross, 1992), direct measurement is difficult due to overlap with resonances of other brain metabolites, in contrast to difference spectra, which are well resolved (Gruetter et al., 1992b).
While increments of glucose concentrations are measurable from the difference spectra, the direct quantification of glucose by 1H NMR spectroscopy is hampered by the close proximity of the water signal and by overlap with resonances from taurine, inositol, glutamate, and glutamine, all of which are more concentrated than is glucose in the brain (Petroff et al., 1989). At 3.44 ppm overlap from taurine and myo-inositol can be expected at 2.1 Tesla based on chemical shifts, coupling patterns, and concentrations in human brain. The average increase of plasma glucose, from 5 to 17 mM, doubled the amplitude at 3.44 ppm. From the 13C NMR measurement of brain glucose (Gruetter et al., 1992a), this corresponds to a 2.8 μmol/ml brain volume change in brain glucose concentration, suggesting that ∼1/3 of the amplitude in the euglycemic spectrum is due to glucose.
To estimate the contribution of myo-inositol at the 3.44 ppm glucose resonance, the myo-inositol solution spectrum was subtracted from the in vivo spectrum (Fig. 3). The subtraction was performed interactively using standard spectrometer software (DISR88) and minimized the amplitude at 3.57 ppm to 7 ± 5% of its original value (mean ± SD). An analysis of five 15-min spectra yielded a concomitant 55 ± 3% (mean ± SD) decrease in amplitude at the glucose position (3.44 ppm). Note that the shape and area of the trimethylamine peak (peak 4 in Fig. 3) is affected by the contributions of myo-inositol, reducing an apparent asymmetry. That contribution is from the triplet of H2 of myo-inositol at this field strength.
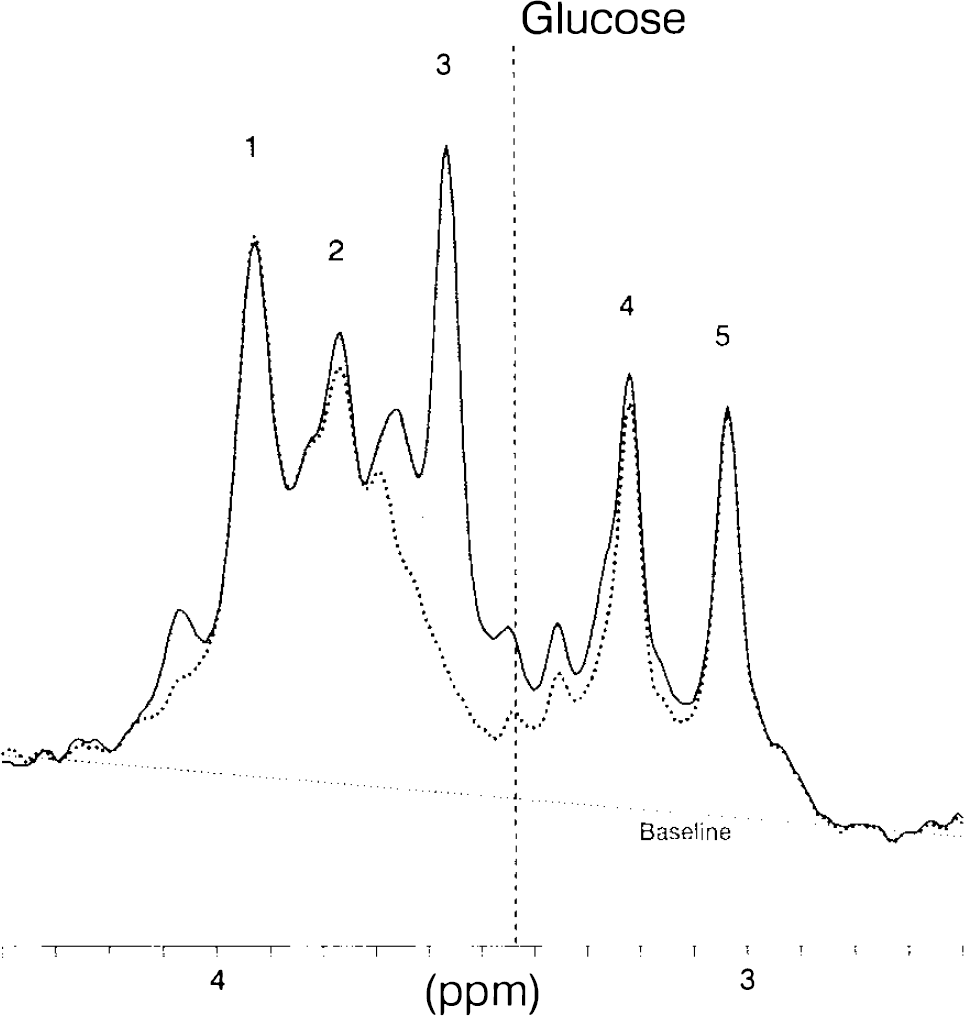
Influence of myo-inositol on glucose amplitude at 3.44 ppm at short echo-time TE = 16 ms. Shown is the in vivo spectrum (solid line) and the same spectrum with the line-broadened solution spectrum of myo-inositol subtracted (dotted line). The shaded area indicates the contribution of myo-inositol to the in vivo spectrum. The vertical dashed line indicates the position of glucose at 3.44 ppm. For peak assignments, see Fig. 2.
Elevated 1H NMR glucose resonances in patients with hyperglycemia due to diabetes have been reported previously at this chemical shift (Michaelis et al., 1991). However, poor correlation between glycemia and the signal area at 3.44 ppm was found in the study by Kreis and Ross, (1992). Our attempts to further resolve that spectral region (Fig. 3) indicate that a substantial nonglucose signal is present at 3.44 ppm, stemming predominantly from myo-inositol, as confirmed by measuring at echo TEs of 16–160 ms (not shown). The majority, i.e., half of the amplitude at euglycemia is from myoinositol and we estimate, based on the predicted value from 13C NMR, that just one-third of the amplitude is from glucose. A tight correlation between steady-state brain glucose concentration and plasma glucose, however, was observed by 13C NMR in normal and diabetic humans (Novotny et al., 1993). The low degree of correlation between plasma glucose and brain glucose signal in 1H NMR spectra of diabetics reported by others hence may have been due to variations in overlapping myoinositol resonances, levels of which have been shown to change in diabetes (Stewart et al., 1967).
Time course of observed brain glucose concentration during infusion
During the intravenous infusions of glucose, difference spectra were obtained at 4–5 min intervals. Figure 4 shows the time course of difference spectra from one study. Both the 3.81 and 3.44 ppm glucose peaks are clearly discernible and well resolved from other background resonances, which are completely subtracted over the entire time period. The pulse sequence and shimming used resulted in a highly stable baseline, water suppression, and a frequency selective amplitude. To obtain the time courses for kinetic analysis, spectra were processed with Gaussian multiplication and the amplitude was measured at 3.44 ppm in baseline-corrected difference spectra.
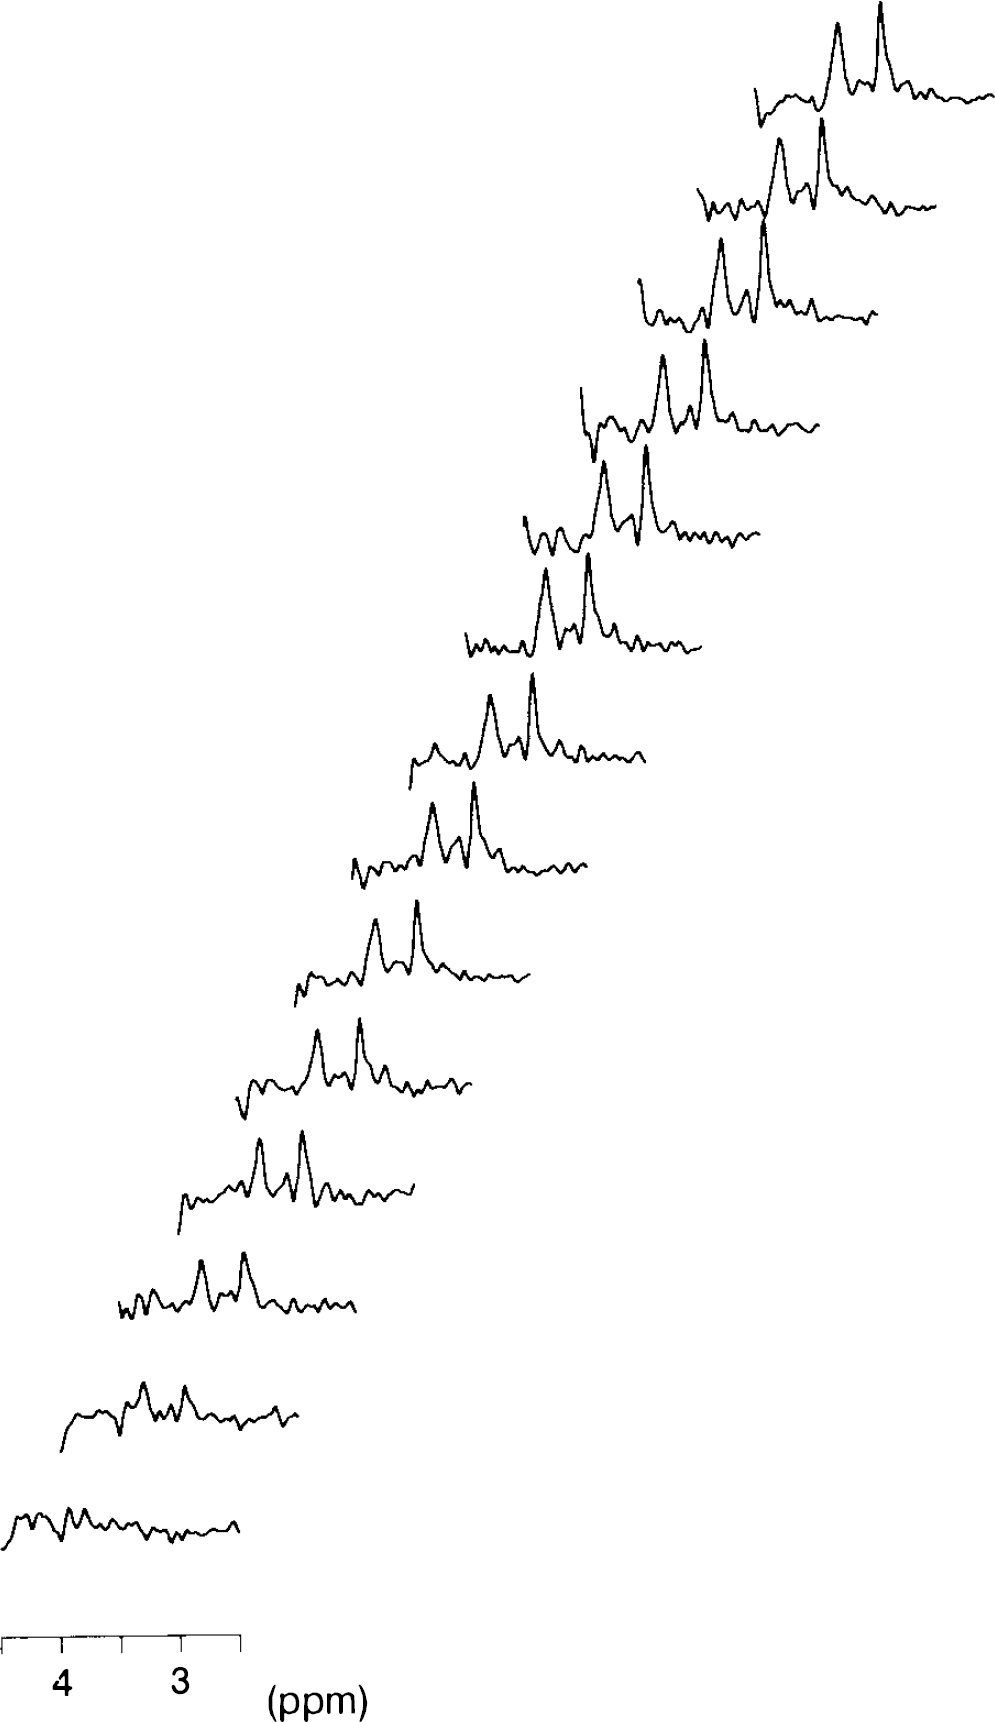
Time course of the change in the glucose signal. Stack plot of the upfield glucose resonances in the in vivo difference spectra. A time resolution of 3–4 min was achieved by subtracting an averaged spectrum obtained at euglycemia from each 3-min spectrum obtained during infusion. Processing consisted of Gaussian multiplication and baseline correction from 2.5 to 4.5 ppm.
Both parts of Fig. 5 show the time course of plasma and brain glucose of Fig. 4. At t = 0 min, a steep increase in plasma glucose (triangles) was achieved by the variable priming infusion of glucose. The solid squares represent the difference amplitude of glucose as measured by 1H NMR and show a clear lag of brain glucose behind plasma glucose, i.e., 4.0 ± 1.0 min (mean ± SEM) at 50% of the maximum increase (p < 0.05). The solid line in Fig. 5A is the time course calculated from the parameters of the symmetric Michaelis–Menten model of glucose transport measured by 13C NMR (Gruetter et al., 1992a), assuming a cerebral blood volume of 0.035 ml/g (Eq. 5). The dashed line (which almost completely overlaps the solid line) is the best fit of the model to the time course of this study. In Fig. 5B, the solid line is the expected time course assuming brain glucose in extracellular space (∼20% of brain volume) to be in free exchange with blood. The solid line parallels the change in plasma glucose, which is inconsistent with the experimental observation. The dashed line is the time course derived by assuming Michaelis–Menten kinetics at the BBB with all glucose being in extracellular space, for which Tmax/CMRglc must be >25, based on the previous quantification of brain glucose (see methods and below).
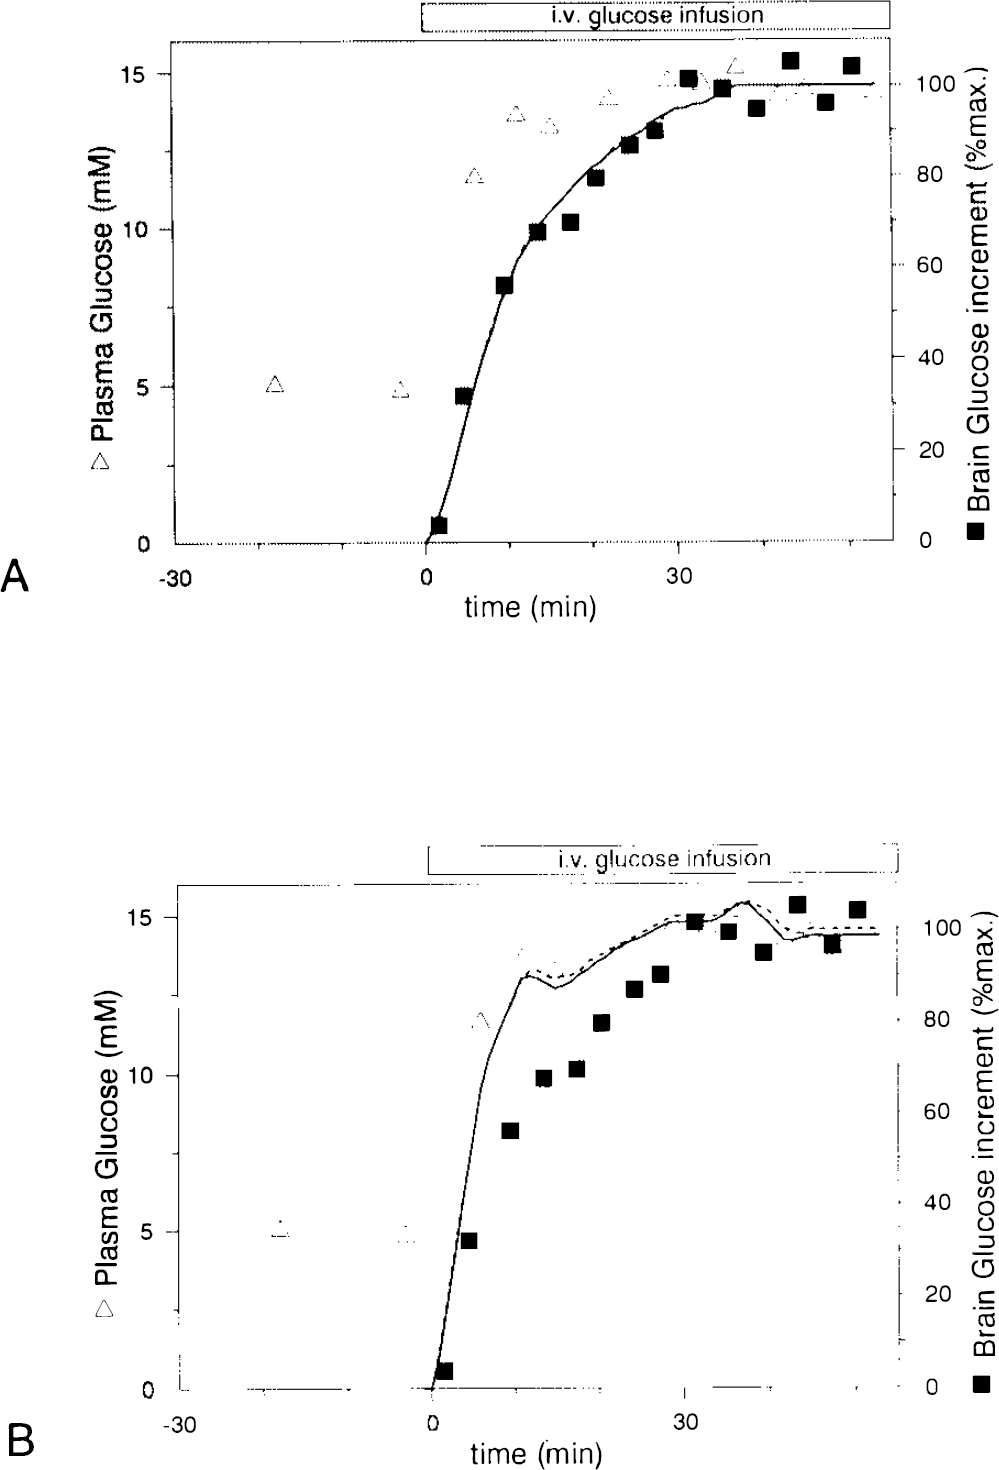
Time course of the peaks in Fig. 4. The amplitude of the downfield glucose peak at 3.44 ppm (solid squares) was measured and expressed in % of the maximum increase, defined as the average of the last four points. Plasma glucose concentrations (triangles) were measured in a Beckman glucose analyzer.
Assessment of transport kinetics
The kinetic analysis distinguished several possibilities, as described in methods:
Model A: Symmetric Michaelis–Menten model. Based on the aforementioned difficulties in measuring steady-state glucose concentrations directly by 1H NMR, we used relative glucose signal increases to derive experimental fits of Eq. 5 to obtain kinetic constants (Fig. 5). A plasma glucose concentration of half-maximal transport Kt = 4.8 ± 2.4 mM (mean ± SD), a maximal transport rate of rmax = 0.80 ± 0.45 μmol g−1 min−1, and a glucose consumption rate of CMRglc = 0.32 ± 0.16 μmol g−1 min−1 were obtained from the fit of Eq. 5 to the five studies (row 1 in Table 1).
Summary of performed numerical analyses of the time courses
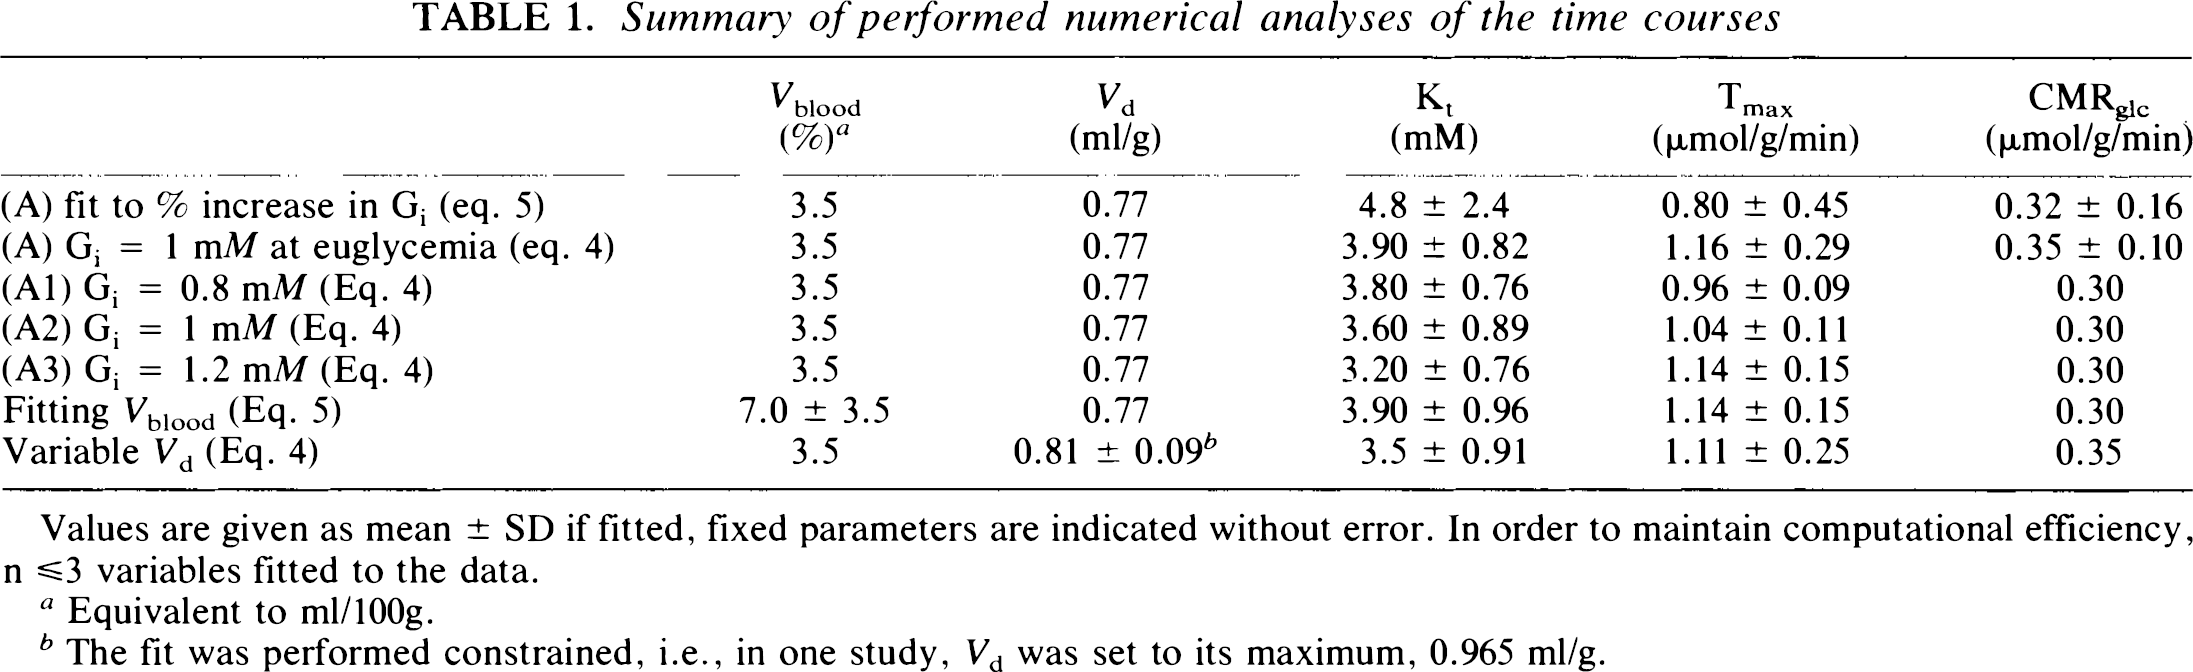
Values are given as mean ± SD if fitted, fixed parameters are indicated without error. In order to maintain computational efficiency, n ≤3 variables fitted to the data.
Equivalent to ml/100g.
The fit was performed constrained, i.e., in one study, Vd was set to its maximum, 0.965 ml/g.
Since we established, in a previous study, that cerebral glucose concentration is 1.0 ± 0.1 μmol/g (mean ± SEM) at euglycemia, we also solved for time course by replacing signal increases with this initial euglycemic glucose concentration and by using the final glucose concentration obtained by extrapolating to the corresponding final plasma glucose concentration from Gruetter et al. (1992a). The resulting constants were Kt = 3.90 ± 0.82 mM (mean ± SD), a maximal transport rate of Tmax = 1.16 ± 0.29 μmol g−1 min−1, and glucose consumption rate of CMRglc = 0.35 ± 0.10 μmol/g (row 2 in Table 1).
(Model A1–A3) The effect of assuming different euglycemic glucose concentrations on Tmax and Kt was judged by varying G(i)brain within the 95% confidence interval (rows 3–5 in Table 1), i.e., between 0.8 and 1.2 mM, within which Kt varied by δKt = 1.5×δG(i)brain and Tmax by Tmax = 0.45×δG(i)brain. These variations are within the experimental error.
In order to evaluate the possibility that intracellular glucose is 0 (G1 = 0), two cases were solved:
Model B: Fast exchange between plasma and extracellular glucose. The assumption that intracellular glucose is 0 (Gi = 0) (see methods) results in glucose time courses that parallel the plasma time course closely in the case of free diffusion (solid line in Fig. 5B). This observation is consistent with the estimation that with an average cerebral blood flow of 0.5 ml/g min the glucose influx into the human brain is 2.5 μmol g−1 min−1, for an increase from 5 to 10 mM plasma concentration, which exceeds the reported change in glucose concentration (Gruetter et al., 1992a).
Model C: Michaelis–Menten kinetics for fast exchange at the BBB. When all the glucose is assumed to be confined to the extracellular space (∼0.2 ml/g), glucose concentrations that we reported by 13C] NMR (Gruetter et al., 1992a; Gruetter et al., 1993) resulted in a Tmax/CMRglc > 25 when fitting the Michaelis–Menten model with Vd = Ve = 0.2 ml/g (not shown). Assuming Gi = 0 and Michaelis–Menten kinetics at the BBB (Fig. 1C) with Vd = 0.20 ml/g, Tmax/CMRglc = 25 or (virtually any range of Tmax/CMRglc) gave time courses that closely paralleled plasma glucose as illustrated by the dashed line in Fig. 5B.
The measured time courses, however, contained only a very small fraction of the signal that parallels the plasma glucose, as shown by fitting Vblood instead of CMRglc (row 6 in Table 1), which is consistent with only a small signal fraction being from the blood compartment.
Calculation of the distribution space of glucose. Since models B and G, which assumed a small distribution space of glucose, are inconsistent with the lag in brain glucose observed, Vd in Eq. 1 was also fitted as follows:
We fitted Vd to the time courses, assuming concentrations based on the previous quantification (as in model A) and setting Vblood = 0.035 ml/g and CMRglc = 0.35 μmol g−1 min−1 (based on previous measurements of this region of the brain) (Heiss et al., 1984; Tyler et al., 1988). The result of this calculation was Kt = 3.5 ± 0.9 mM (mean ± SD), Tmax = 1.11 ± 0.25 μmol g−1 min−1, and Vd = 0.77 ± 0.01 ml/g (n = 4). In one study, Vd was 2.1 ml/g, which is above the physical upper limit of 0.965 ml/g. Using, for that study, Vd = 0.965 ml/g gave an average Vd = 0.81 ± 0.09 ml/g (n = 5, row 7 in Table 1), which is within the experimental error identical to the distribution space of water, i.e., 0.77 ml/g.
DISCUSSION
Previous measurements of steady-state human cerebral glucose concentrations by 13C NMR gave a concentration of 1 μmol/ml brian volume at euglycemic (4.8 mM) plasma concentration (Gruetter et al., 1992a). This direct brain glucose measurement was also consistent with all of the brain glucose being in extracellular space, which comprises −20% of total brain volume (Lund-Andersen, 1979) at a concentration equal to that of plasma glucose. In that extreme case, glucose concentration in the brain cells would be close to zero and transport across the brain cell membranes would be rate-limiting for phosphorylation of glucose. Such a situation is consistent with the observation of saturation kinetics for 2-deoxyglucose transport in brain slices (Bachelard, 1971). Later evidence, however, argued in favor of a very rapid equilibration of glucose in the aqueous phase of animal brain based on diffusion measurements of glucose analogs (Lund-Andersen, 1979), distribution volumes of glucose (Holden et al., 1991), and glucose analogs (Gjedde and Diemer, 1983), suggesting that the BBB is rate-limiting for glucose transport, but not phosphorylation. In addition, previous direct 13C NMR measurements of total rat brain glucose concentration (Mason et al., 1992) are similar to very recent measurements of extracellular glucose concentration using microelectrodes (Silver and Erecinska, 1994) suggesting that concentrations of intra- and extracellular brain glucose are similar in rat brain. The present results argue in favor of a similar situation in the human brain in vivo under normal physiologic conditions, since this study demonstrates a significantly delayed rise in brain glucose relative to plasma glucose, indicating saturation kinetics and a large physical distribution space of glucose in human brain (row 7 in Table 1).
The parameters for glucose transport obtained from the time courses of plasma glucose increments (row 1 in Table 1) are similar to those reported previously from the relationship of plasma glucose versus brain glucose at steady-state (Gruetter et al., 1992a). Both approaches used the symmetric Michaelis–Menten model for glucose transport across the BBB to calculate the kinetic constants. The kinetic parameters of steady-state glucose transport obtained by 13C NMR spectroscopy predict the time course of brain glucose increments accurately, as illustrated in Fig. 5A, further emphasizing the consistency of the experimental evidence. Comparison of this study with previous measurements of brain glucose transport in humans using radioisotope methods (Table 2) shows that the Kt values are highly consistent among the different methods used and falls slightly below the normal fasting glucose concentration. However, as shown in Table 2, Tmax values obtained by radioisotope methods scatter by a fivefold range. Euglycemic brain glucose concentrations calculated from the symmetric transport model (Eq. 3), using the respective kinetic constants given in columns 4 and 5 in Table 2 and the accepted standard of 0.3 μmol g−1 min−1 for CMRglc. for gray matter (Heiss et al., 1984; Tyler et al., 1988), range thus from −0.6 to 2 μmol/g (column 6 in Table 2), with none of the previous studies being consistent with the NMR measurement (row 5 in Table 2). This discrepancy becomes more apparent when comparing direct in vivo NMR quantification at 10 mM plasma glucose concentration with predicted values from isotope measurements (column 7 in Table 2): Three of the four PET studies predict glucose concentrations below the euglycemic NMR value. If the Km for hexokinase is assumed to be on the order of 50 μM, then it is clear that the brain glucose concentrations derived from these studies predict that brain glucose transport is rate-limiting for metabolism at euglycemia in contrast to the conclusion of the present report.
Michaelis–Menten constants of blood–brain glucose transport in humans
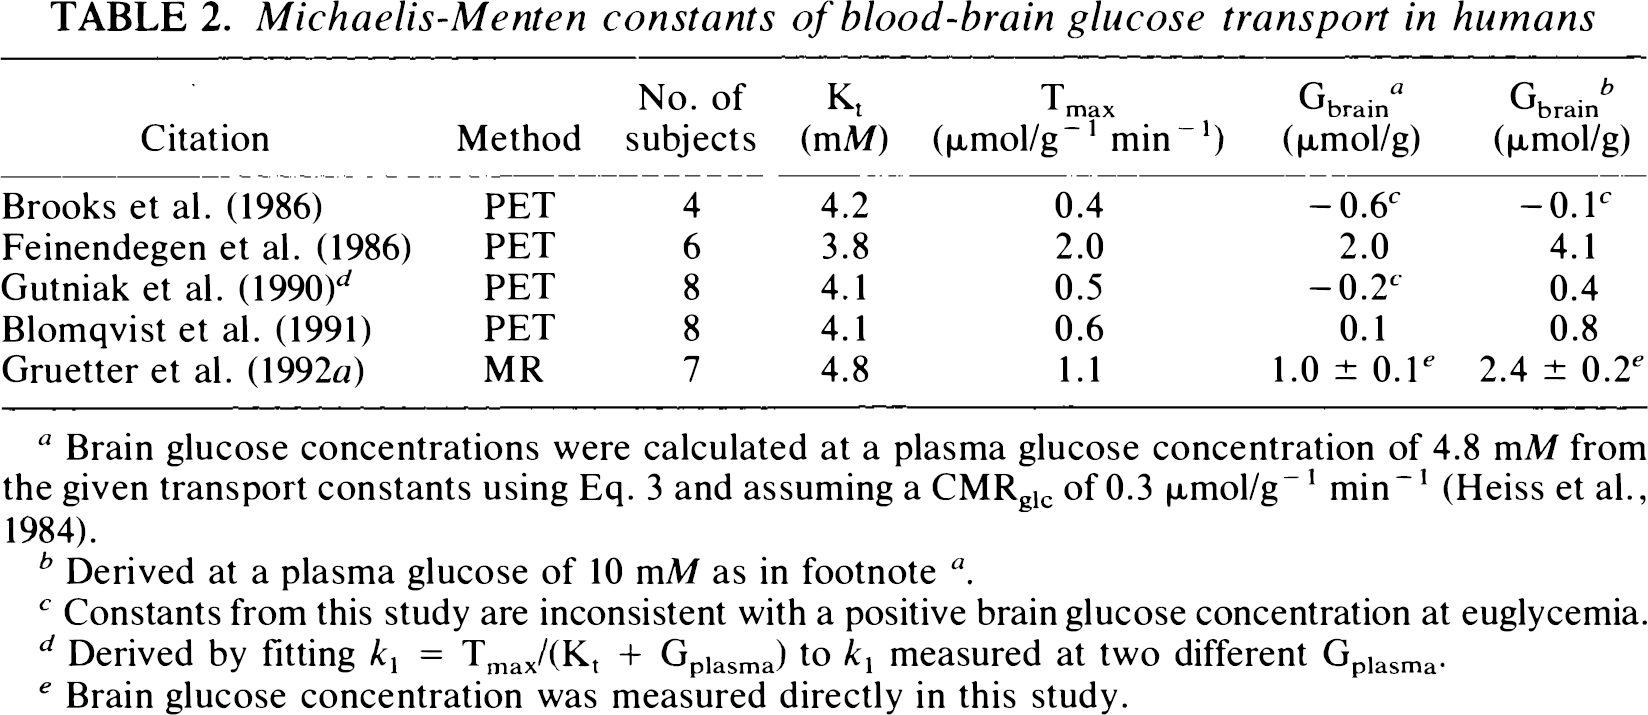
Brain glucose concentrations were calculated at a plasma glucose concentration of 4.8 mMfrom the given transport constants using Eq. 3 and assuming a CMRglc of 0.3 μmol/g−1 min−1 (Heiss et al., 1984).
Derived at a plasma glucose of 10 mM as in footnote a .
Constants from this study are inconsistent with a positive brain glucose concentration at euglycemia.
Derived by fitting k1 = Tmax/(Kt + Gplasma) to k1 measured at two different Gplasma.
Brain glucose concentration was measured directly in this study.
It is well established that glucose transport is mediated by glucose transporters, which are a homologous class of transmembrane proteins with transporter-type and species-specific differences (Mueckler, 1994). Most of the present evidence suggests that the erythrocyte/liver type glucose transporter, GLUT-1, is the abundant transporter molecule at the membranes of the endothelial cells comprising the BBB (Pardridge et al., 1990). A different, recently identified, brain-type glucose transporter, GLUT-3, (Gerhart et al., 1,992) seems to be distributed mainly within brain tissue that has little measurable GLUT-1 (Maher et al., 1993; Mantych et al., 1992). The evidence we obtained suggests that the BBB is the major rate-limiting step for glucose entry into human brain, with an overall higher transport capacity at the intracellular/extracellular interface compared to that at the BBB. Even though transport rates within the brain might be extremely high, leading to a single, well-mixed brain glucose pool, the transport rate will be limited by the slowest step of the multiple sequential transport steps, which we propose in the human brain to be at the BBB.
We have obtained 1H NMR spectra of glucose from the brain of healthy volunteers by taking the difference between spectra obtained at euglycemia and during a glucose infusion. Since these difference spectra contain only signals from glucose, the high sensitivity of 1H NMR allowed measurement of changes in glucose levels with 3-min time resolution. The noninvasive, time-resolved measurement of brain glucose changes from small volumes by 1H NMR opens the prospect of measuring glucose transport and rates of glycolysis noninvasively; decreases in brain glucose concentrations have been reported using 1H NMR during brain visual activation (Merboldt et al., 1992; Chen et al., 1993). Observations of the (resolved) αH1 resonance at 5.23 ppm, as indicated in the difference spectrum (Fig. 2B), may become a routine method to quantify cerebral glucose, particularly at hyperglycemia. Alternatively, it has been shown in cat brain that measurement of the H1 proton coupled to the C1 carbon can be measured during [1-13C] glucose infusions, when using strong gradients and multiple-quantum coherence to eliminate the water signal, with a sensitivity that may be sufficient to measure glucose influx rates and spatial distribution during hyperglycemia (van Zijl et al., 1992; Inubushi et al., 1993; van Zijl et al., 1993). Using either method, from the subsequent difference spectra it may, thus, be possible to deduce cerebral glucose concentrations at lower plasma glucose concentrations. Simulations based on the 13C NMR quantification of cerebral glucose indicate that measurement of the cerebral glucose concentration considerably improves the accuracy of the determination of transport kinetics.
Conclusions
This study confirms our earlier observations that difference 1H spectroscopy is a useful tool to investigate glucose transport in the human brain since these difference spectra contain only intensity from glucose. As such, NMR is to date the only method that permits noninvasive measurement of cerebral glucose in human brain under physiological conditions.
The direct measurement of glucose concentration and, potentially, transport and metabolism by 1H NMR spectroscopy adds to existing measurements of PET, indicator-dilution, and other techniques since it does not use ionizing radiation and is less invasive. Hence, NMR may be a useful and cost-effective alternative to PET for certain studies such as longitudinal and pediatric studies.
The time course of the brain glucose difference is consistent with the previous determination of BBB transport kinetics by 13C NMR in humans (Gruetter et al., 1992a). The large distribution space derived from the present study indicates that intracellular and extracellular glucose levels are similar in the human brain. The implied rapid transport rates within the brain suggest that transport across the BBB is the rate-limiting step of the multiple steps involved in glucose transport. Demonstration of a significant brain glucose concentration is direct experimental evidence that glucose transport is not rate-limiting for metabolism, which suggests that glucose transport does not regulate human brain glucose metabolism.
Footnotes
Acknowledgment:
Supported by U.S. Public Health Service grants NS28790 and DK34576 from the National Institutes of Health, Bethesda, MD, U.S.A. and by a grant from the Juvenile Diabetes Foundation (E.J.N.).