
Abstract
Cerebral glucose consumption and glucose transport across the blood–brain barrier are crucial to brain function since glucose is the major energy fuel for supporting intense electrophysiological activity associated with neuronal firing and signaling. Therefore, the development of noninvasive methods to measure the cerebral metabolic rate of glucose (CMRglc) and glucose transport constants (KT: half-saturation constant; Tmax: maximum transport rate) are of importance for understanding glucose transport mechanism and neuroenergetics under various physiological and pathological conditions. In this study, a novel approach able to simultaneously measure CMRglc, KT, and Tmax via monitoring the dynamic glucose concentration changes in the brain tissue using in-vivo1H magnetic resonance spectroscopy (MRS) and in plasma after a brief glucose infusion was proposed and tested using an animal model. The values of CMRglc, Tmax, and KT were determined to be 0.44±0.17 μmol/g per minute, 1.35±0.47 μmol/g per minute, and 13.4±6.8 mmol/L in the rat brain anesthetized with 2% isoflurane. The Monte-Carlo simulations suggest that the measurements of CMRglc and Tmax are more reliable than that of KT. The overall results indicate that the new approach is robust and reliable for in-vivo measurements of both brain glucose metabolic rate and transport constants, and has potential for human application.
Keywords
Introduction
Glucose is a major fuel for brain energy production in the form of ATP molecules that are essential to restore transmembrane ion gradients and maintain electrophysiological activity and neuronal signaling. The neuronal activity and brain function depend on a continuous supply of glucose through blood circulation and the specific glucose transport mechanism mediated by glucose transporters, predominately GLUT1 in the capillary endothelial cells (Kalaria et al, 1988; Mueckler et al, 1985), referred to as the blood–brain barrier (BBB; Lund-Andersen, 1979; Pardridge, 1983a,1983b). Glucose consumption and transport have key roles in maintaining brain function. Therefore, the development of noninvasive methods suitable for in-vivo measurements of cerebral metabolic rate of glucose (CMRglc) and two glucose transport constants (KT: the half-saturation constant; Tmax: the maximum transport rate) are of importance for studying and understanding underlying glucose transport mechanism and brain energy utilization in various physiological and pathological conditions such as hypoglycemia, diabetes, and Alzheimer's disease (Siesjo, 1978). For instance, glucose transport across BBB has been found to change significantly after chronic hyperglycemia (Cornford et al, 1995; Harik et al, 1988; Lutz and Pardridge, 1993).
Interestingly, the brain glucose concentration has been found to decrease significantly in the rat brain at the isoelectric state in the absence of EEG activity under deep anesthesia with a high dose of pentobarbital, despite a large reduction of CMRglc (∼37%) compared with the anesthesia condition using 2% isoflurane (Du et al, 2009). This finding seemingly contradicts other studies that show a decreased brain glucose concentration accompanied by an increased CMRglc due to the elevated neuronal activity by visual stimulations (Chen et al, 1993; Mangia et al, 2007; Merboldt et al, 1992). However, this apparent discrepancy can be explained by the glucose transport regulation and plasma glucose concentration alteration, which was substantially decreased under the isoelectric condition (Du et al, 2009). A significant reduction in plasma glucose level could lead to a large decrease in brain glucose concentration, since the brain glucose concentration is tightly coupled to the plasma glucose concentration and is regulated by the glucose transport across BBB. Therefore, the brain glucose concentration can be affected by plasma glucose concentration, blood–brain glucose transport, and cerebral glucose consumption.
Moreover, it has been suggested that pentobarbital could change the blood–brain glucose transport in the rat brain with reduced glucose transport constants (KT and Tmax) compared with the awake condition (Gjedde and Rasmussen, 1980). These KT and Tmax changes, while providing important physiology measures reflecting the effect of pentobarbital anesthesia on glucose transport, could complicate the quantitative relationship between CMRglc and the brain glucose concentration under either physiological or pathological condition. The aim of the present study is to establish a noninvasive method to robustly, simultaneously measure CMRglc and transport constants of KT and Tmax in the rat brain using localized in-vivo1H magnetic resonance spectroscopy (MRS).
Materials and methods
Glucose Solution Preparation
In all, 99.5%
Animal Preparation
Seven fasted adult male Sprague-Dawley rats (body weight: 260 to 380 g) were used for in-vivo MRS measurements and other three (fasted, 285 to 390 g) were applied for bench tests with the similar animal preparation procedures. The rats were anesthetized by inhalation of 2% (volume-volume) end-tidal isoflurane mixed with nitrous oxide/oxygen gases (3:2 volume ratio). Animal rectal temperature was maintained at 37±0.5°C with a warm-water circulating pad throughout the experiments. The rat right femoral vein was catheterized for the glucose infusion and two femoral arteries were catheterized for physiological monitoring and blood sampling, respectively. After the surgery, the rats were positioned in a home-built holder and then relocated to the 9.4-T magnet for MRI/MRS measurements. Animal surgical procedures and experimental protocols were approved by the Institutional Animal Care and Use Committee of the University of Minnesota.
Magnetic Resonance Measurements
To noninvasively measure brain glucose concentration, magnetic resonance experiments were performed at a 9.4-T/31-cm horizontal magnet (Magnex Scientific, Abingdon, UK) equipped with Varian INOVA console (Varian, Palo Alto, CA, USA). Anatomic magnetic resonance images and in-vivo1H MRS were acquired using an elliptical surface RF coil with a long axis of 2 cm and a short axis of 1.2 cm. Scout images were obtained using a turbo fast low-angle shot (TurboFlash) MRI sequence (Frahm et al, 1986) with the following parameters: 6 ms repetition time, 3 ms echo time, 3 × 3 cm field of view; 256 × 128 image matrix size; 1 mm slice thickness.
An MRS voxel of 6 × 4 × 6 mm3 covered the cortical region and a portion of subcortical region symmetrically along the brain central fissure line was selected and shimmed by FASTMAP algorithm (Gruetter, 1993). Outer volume suppression was based on the BISTRO (B1-insensitive selective train to obliterate signal) method (de Graaf et al, 1996). The localized 1H spectra were acquired by the PRESS (point-resolved spectroscopy) approach (Bottomley, 1987) with repetition time/echo time=3,000/13 ms.
When the animals were under a stable physiological, euglycemia condition inside the magnet, the localized in-vivo1H spectra from the rat brain were acquired. Artery blood was sampled for analyzing blood gas parameters and determining plasma glucose concentration before a glucose infusion. Plasma glucose concentrations were measured by a glucose analyzer (GM7; Analax Instruments, London, UK). After these procedures were completed, the prepared glucose solution was infused into the femoral vein with the infusion rate of 0.16 mg/min per gram body weight for 5 minutes, then followed by a reduction of the infusion rate to 0.065 mg/min per gram for 20 minutes to reach constant levels of plasma and brain glucose concentrations, then another artery blood sample was taken for analysis.
Immediately after stopping glucose infusion, time zero was established, and 1H spectra with eight signal averages (NT=8) were continuously and repeatedly acquired along with the artery blood sampling (∼0.15 mL) every ∼15 minutes for measuring blood gas parameters and plasma glucose concentrations. This measurement lasted ∼120 minutes and the time courses of glucose concentrations in the brain tissue and plasma were simultaneously obtained by in-vivo1H MRS and blood sampling, respectively.
In-vivo1H Magnetic Resonance Spectroscopy Quantification
After correcting spectral frequency and phase shifts due to physiological variations and blood sampling, a series of free induced decays were summed with 10 minutes temporal resolution for gaining signal-to-noise ratio. In-vivo1H spectra of rat brain were analyzed using the LCModel fitting method (Stephen Provencher Inc., Oakville, ON, Canada) in the frequency domain (Provencher, 1993, 2001). The basis set for LCModel was simulated using density matrix simulations (Henry et al, 2006) and chemical shifts and J-coupling constants taken from the literature (Govindaraju et al, 2000). The macromolecule spectrum for the basis set of the LCModel was measured experimentally in vivo by using the same localized 1H MRS pulse sequence and parameters except by adding an inversion-recovery preparation and adjusting the inversion-recovery time to null the metabolite signals (Pfeuffer et al, 1999). The glucose concentrations were calculated using the internal reference of the total creatine/phosphocreatine (tCr) signal at 3.01 p.p.m. ([tCr]=8 mmol). The detailed approach about LCModel spectral fitting for metabolite quantification has been described previously (Du et al, 2009; Iltis et al, 2008).
Quantification of Cerebral Metabolic Rate of Glucose and Blood–Brain Transport Constants
The values of CMRglc and Tmax and KT were calculated by the least square algorithm according to the standard Michaelis-Menten glucose transport equation (Lund-Andersen, 1979) as described by equation (1),
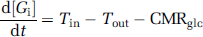
with
[Gi] is the brain glucose concentration that was measured by in-vivo1H MRS and quantified by the LCModel fitting; [G0] is the plasma glucose concentration that was measured by the blood sampling and quantified by glucose analyzer. To test reliability for measuring individual CMRglc, Tmax or KT value, Monte-Carlo simulations were performed.
Under the steady-state condition in which [Gi] becomes time independent, i.e., d[Gi]/dt=0, equation (2) can be deduced from equation (1) as the following:
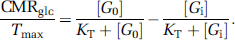
Thereby, equation (2) can be used to determine CMRglc with the known glucose transport constants (Tmax and KT) and steady-state concentrations of [Gi] and [G0], or the ratio of CMRglc/Tmax. In this study, the values of rat brain CMRglc and CMRglc/Tmax were also calculated according to equation (2) under the euglycemia condition before glucose infusion using the Tmax and KT value determined from the dynamic glucose infusion measurement for comparison and validation purposes.
Data and results are reported as mean±standard deviation (s.d.) summarized from seven in-vivo rat measurements. A P value of <0.05 is considered to be statistically significant.
Results
Table 1 summarizes the comparison results of blood gas physiology parameters measured before and immediately after the glucose infusion, showing no changes for most measured parameters except a very small pH change.
Physiology parameters of seven rats measured by blood gas analysis before and after glucose infusion
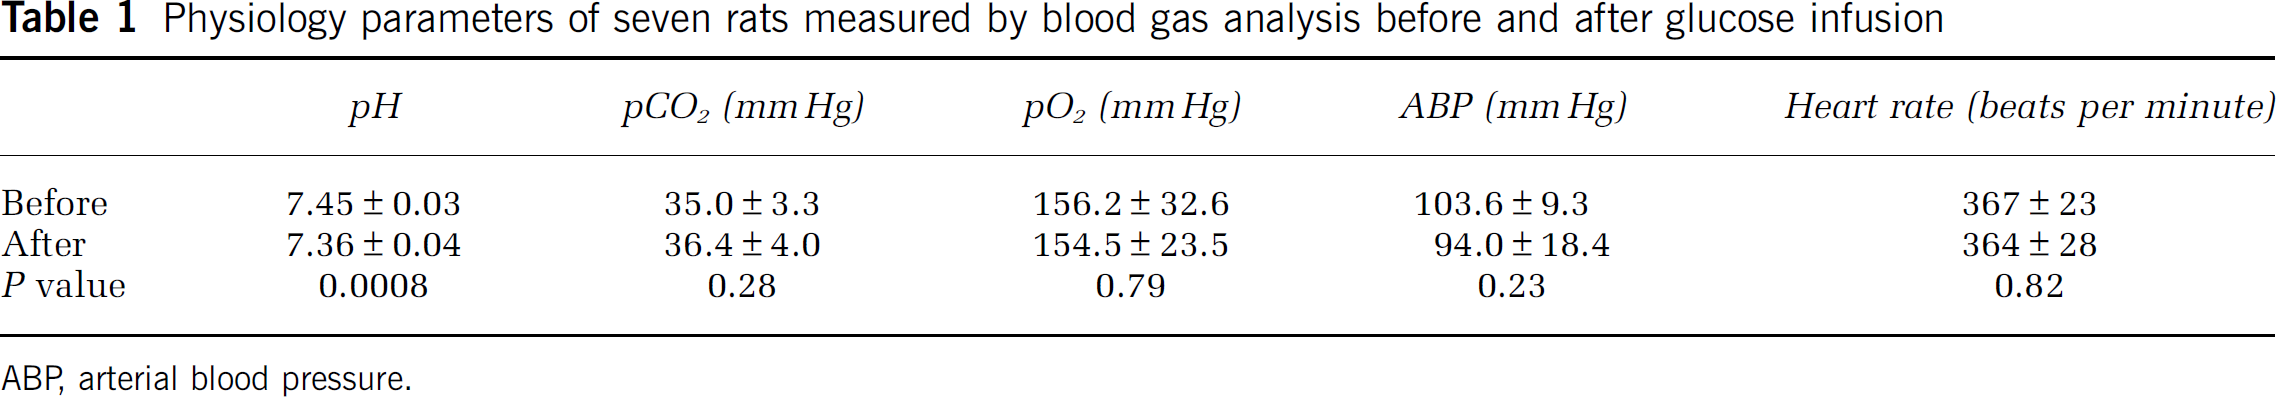
ABP, arterial blood pressure.
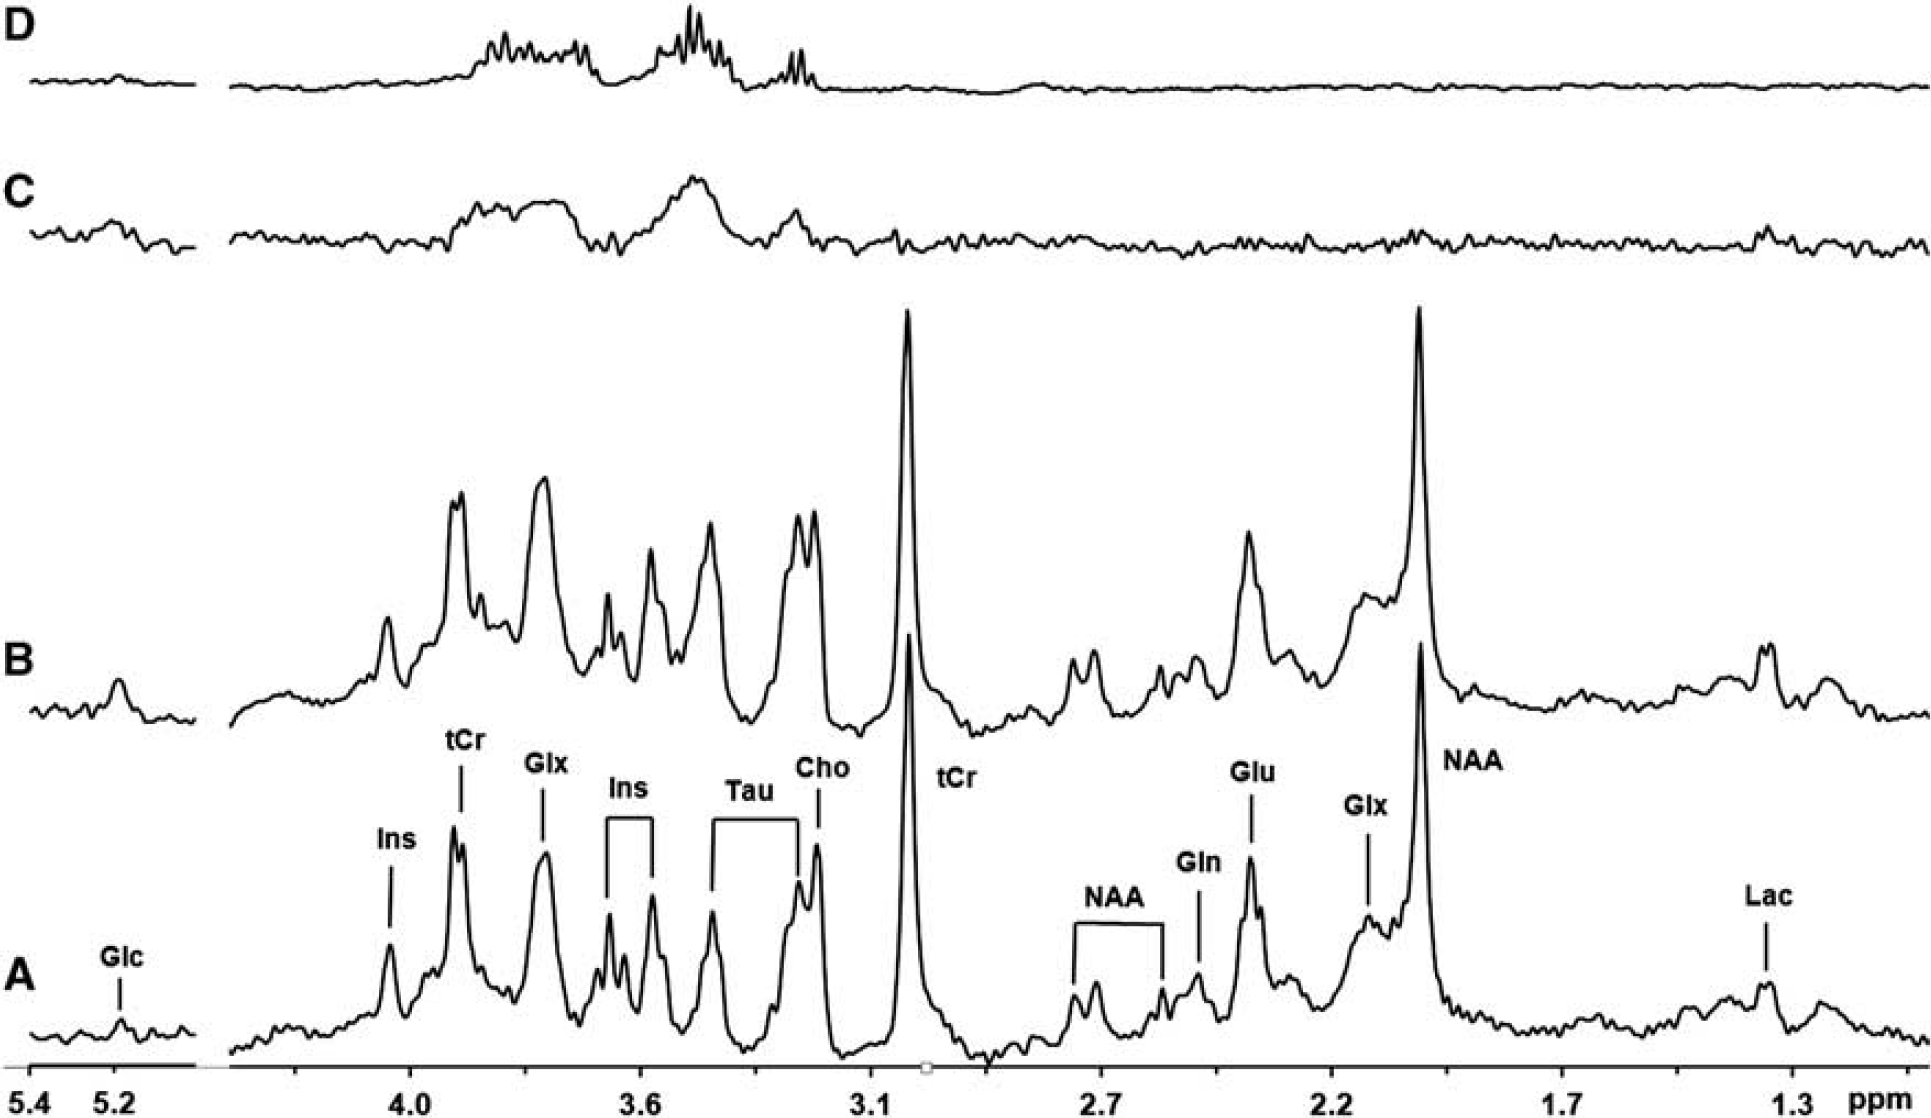
In-vivo1H spectra acquired before (euglycemia) and after glucose infusion (hyperglycemia) from a representative rat brain (No. 7 listed in Table 2), and the difference spectrum between them are illustrated in Figures 1A to 1C, respectively. After glucose infusion, the nuclear magnetic resonance (NMR) signals of multiple glucose resonance peaks in the chemical shift range of 3.0 to 5.2 p.p.m. increased substantially and are clearly evident in the difference spectrum shown in Figure 1C. 1H spectrum acquired from the phantom with 1 mmol/L glucose solution is shown in Figure 1D, which was processed by a 6-Hz linewidth broadening to match the in-vivo spectral profile shown in Figure 1C. There is a high similarity between the in-vivo1H difference spectrum (Figure 1C) and the phantom glucose spectrum (Figure 1D). The results of glucose concentrations measured in the blood and brain tissue at euglycemia and hyperglycemia conditions were summarized in Table 2.
Summary of glucose concentrations in the brain and plasma, measured CMRglc and glucose transport constants
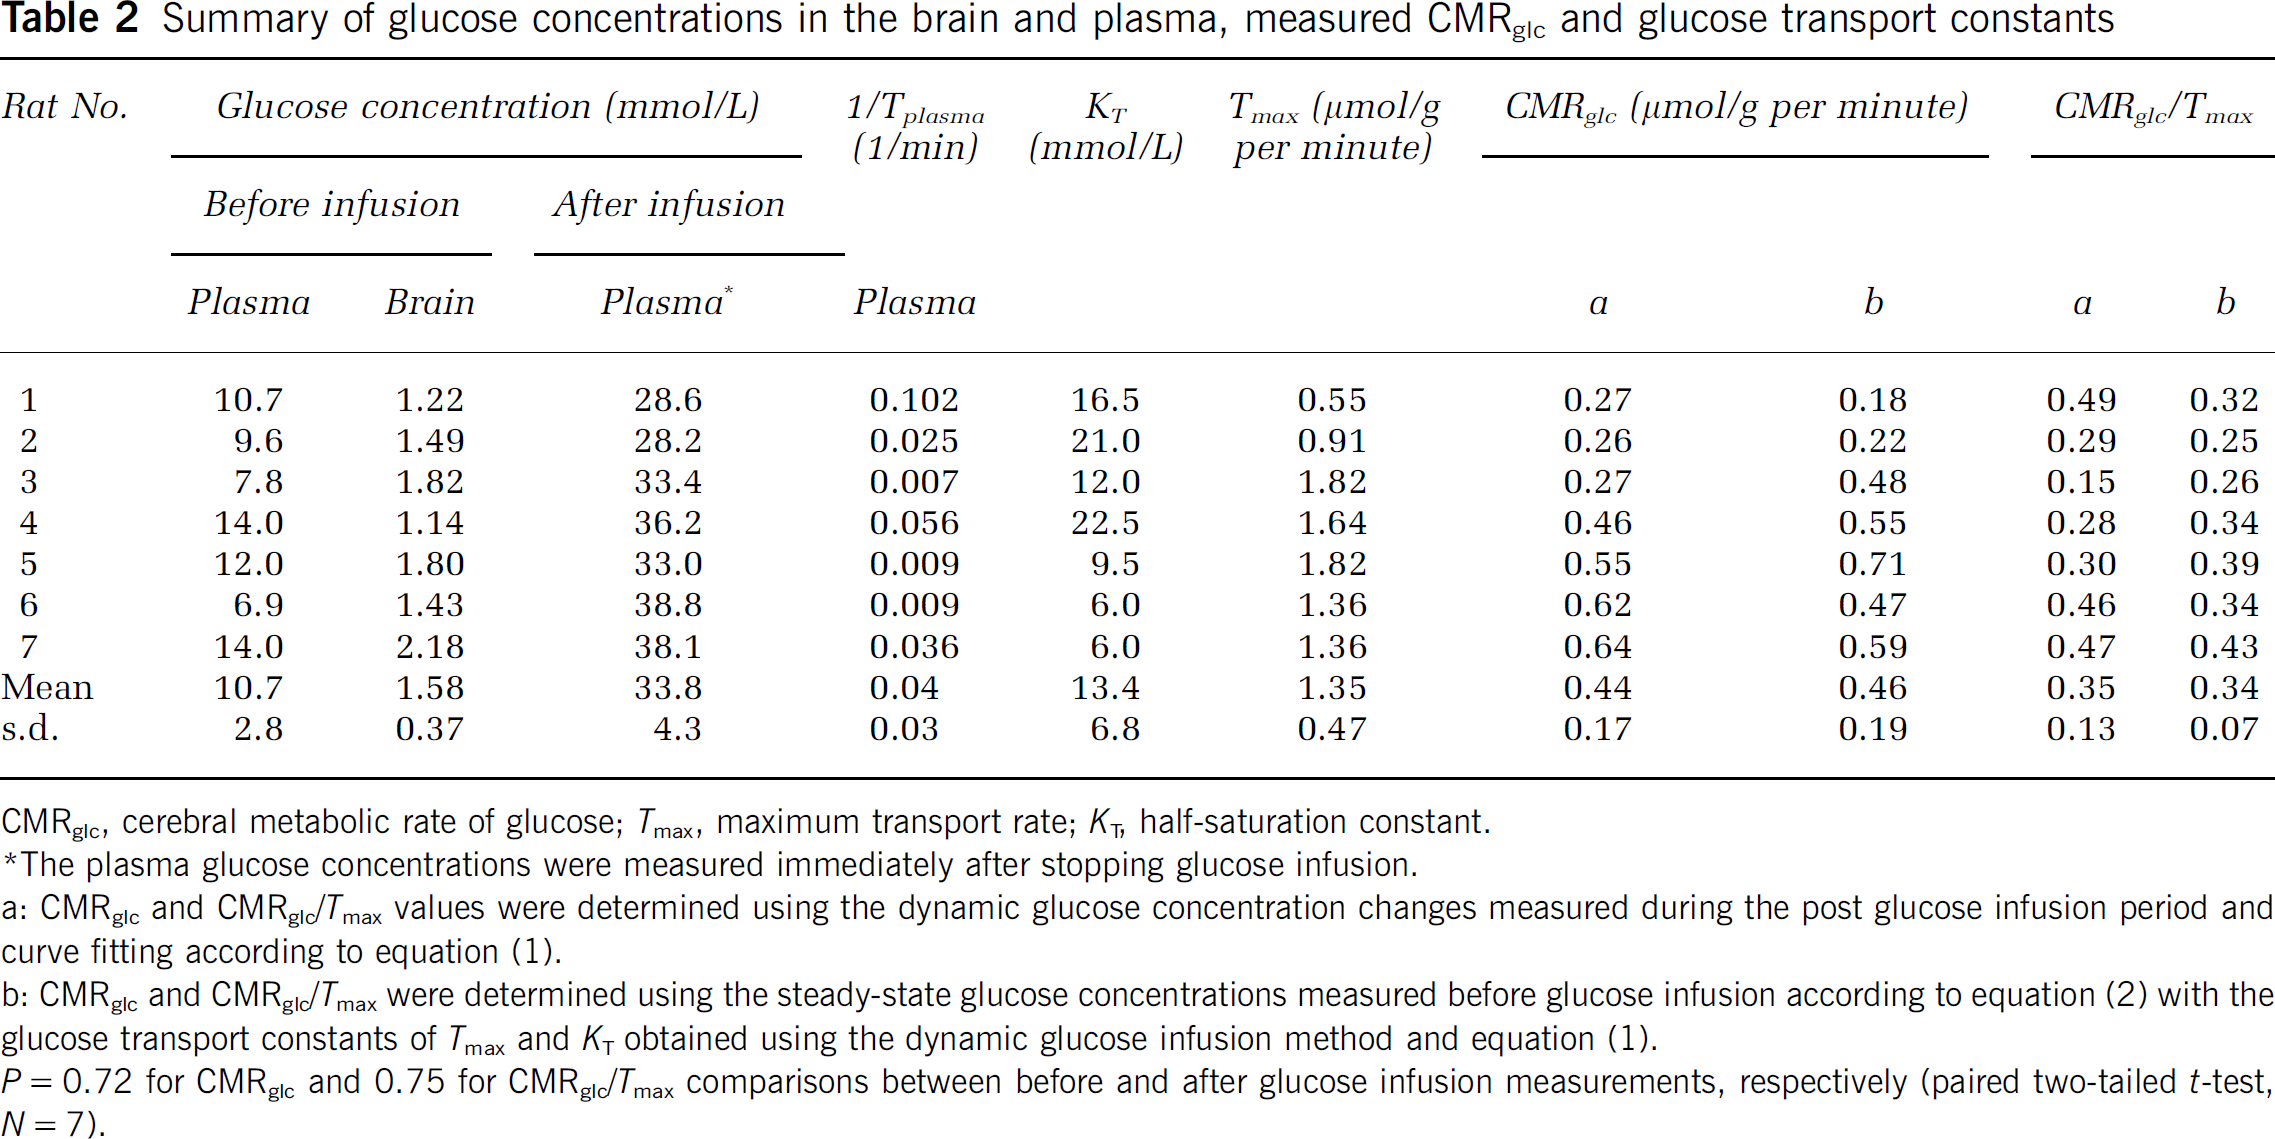
CMRglc, cerebral metabolic rate of glucose; Tmax, maximum transport rate; KT, half-saturation constant.
The plasma glucose concentrations were measured immediately after stopping glucose infusion.
a: CMRglc and CMRglc/Tmax values were determined using the dynamic glucose concentration changes measured during the post glucose infusion period and curve fitting according to equation (1).
b: CMRglc and CMRglc/Tmax were determined using the steady-state glucose concentrations measured before glucose infusion according to equation (2) with the glucose transport constants of Tmax and KT obtained using the dynamic glucose infusion method and equation (1).
P=0.72 for CMRglc and 0.75 for CMRglc/Tmax comparisons between before and after glucose infusion measurements, respectively (paired two-tailed t-test, N=7).
In-vivo1H spectra acquired from a representative rat brain (No. 7 in Table 2) and a phantom glucose solution. In-vivo1H spectra obtained (
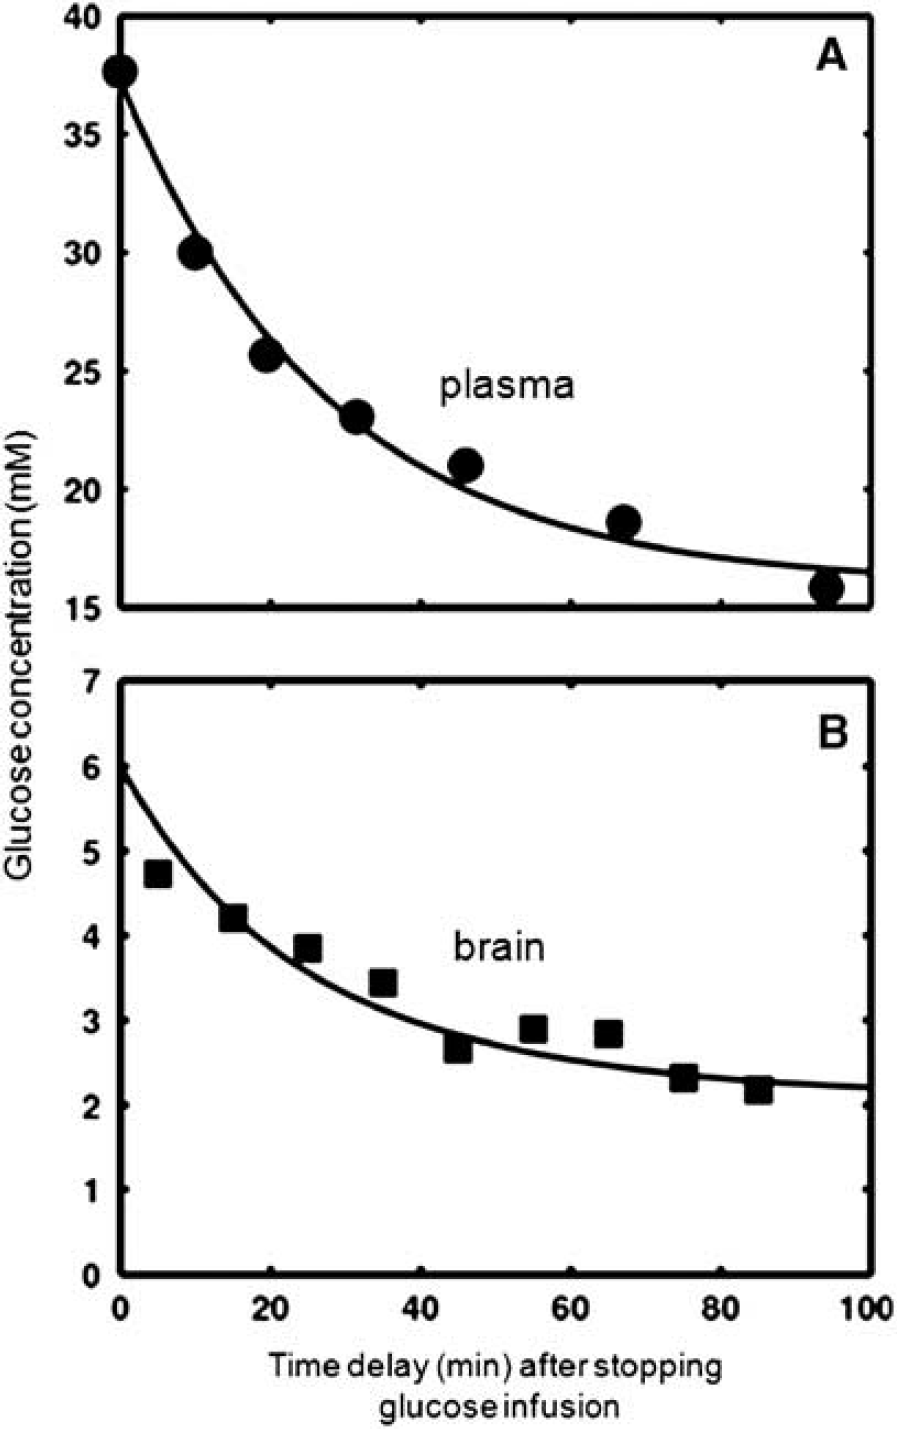
Figure 2 shows the dynamic glucose concentration changes in the plasma and brain tissue during the post glucose infusion period and curve-fitting results from the same rat (No. 7). Plasma glucose concentration changed approximately according to an exponential decay function, which was regressed and then applied to solve the glucose transport differential equation of equation 1. Table 2 summarizes the average results of glucose transport constants (Tmax=1.35±0.47 μmol/g per minute and KT=13.4±6.8 mmol/L), CMRglc (=0.44±0.17 μmol/g per minute) and the apparent blood glucose decay rates (1/Tplasma) measured from seven rats anesthetized with 2% isoflurane.
Dynamic changes of (
The curve-fitting error analyses are presented in Figures 3 and 4, through varying the desired parameters (Figure 3) and Monte-Carlo simulations (Figure 4). Interestingly, varying the parameter of Tmax or CMRglc results in a unidirectional trend in changing the brain glucose concentration (Figures 3A and 3B). In contrast, the increment of KT leads to bidirectional changes of the brain glucose concentration (Figure 3C). The Monte-Carlo simulation results reveal that the measurement error indicated by the linewidth at 50% of maximum of gauss function for KT (σ=0.15) was larger than that of CMRglc and Tmax (Φ=0.02), suggesting a large error in KT measurement compared with that of CMRglc and Tmax.
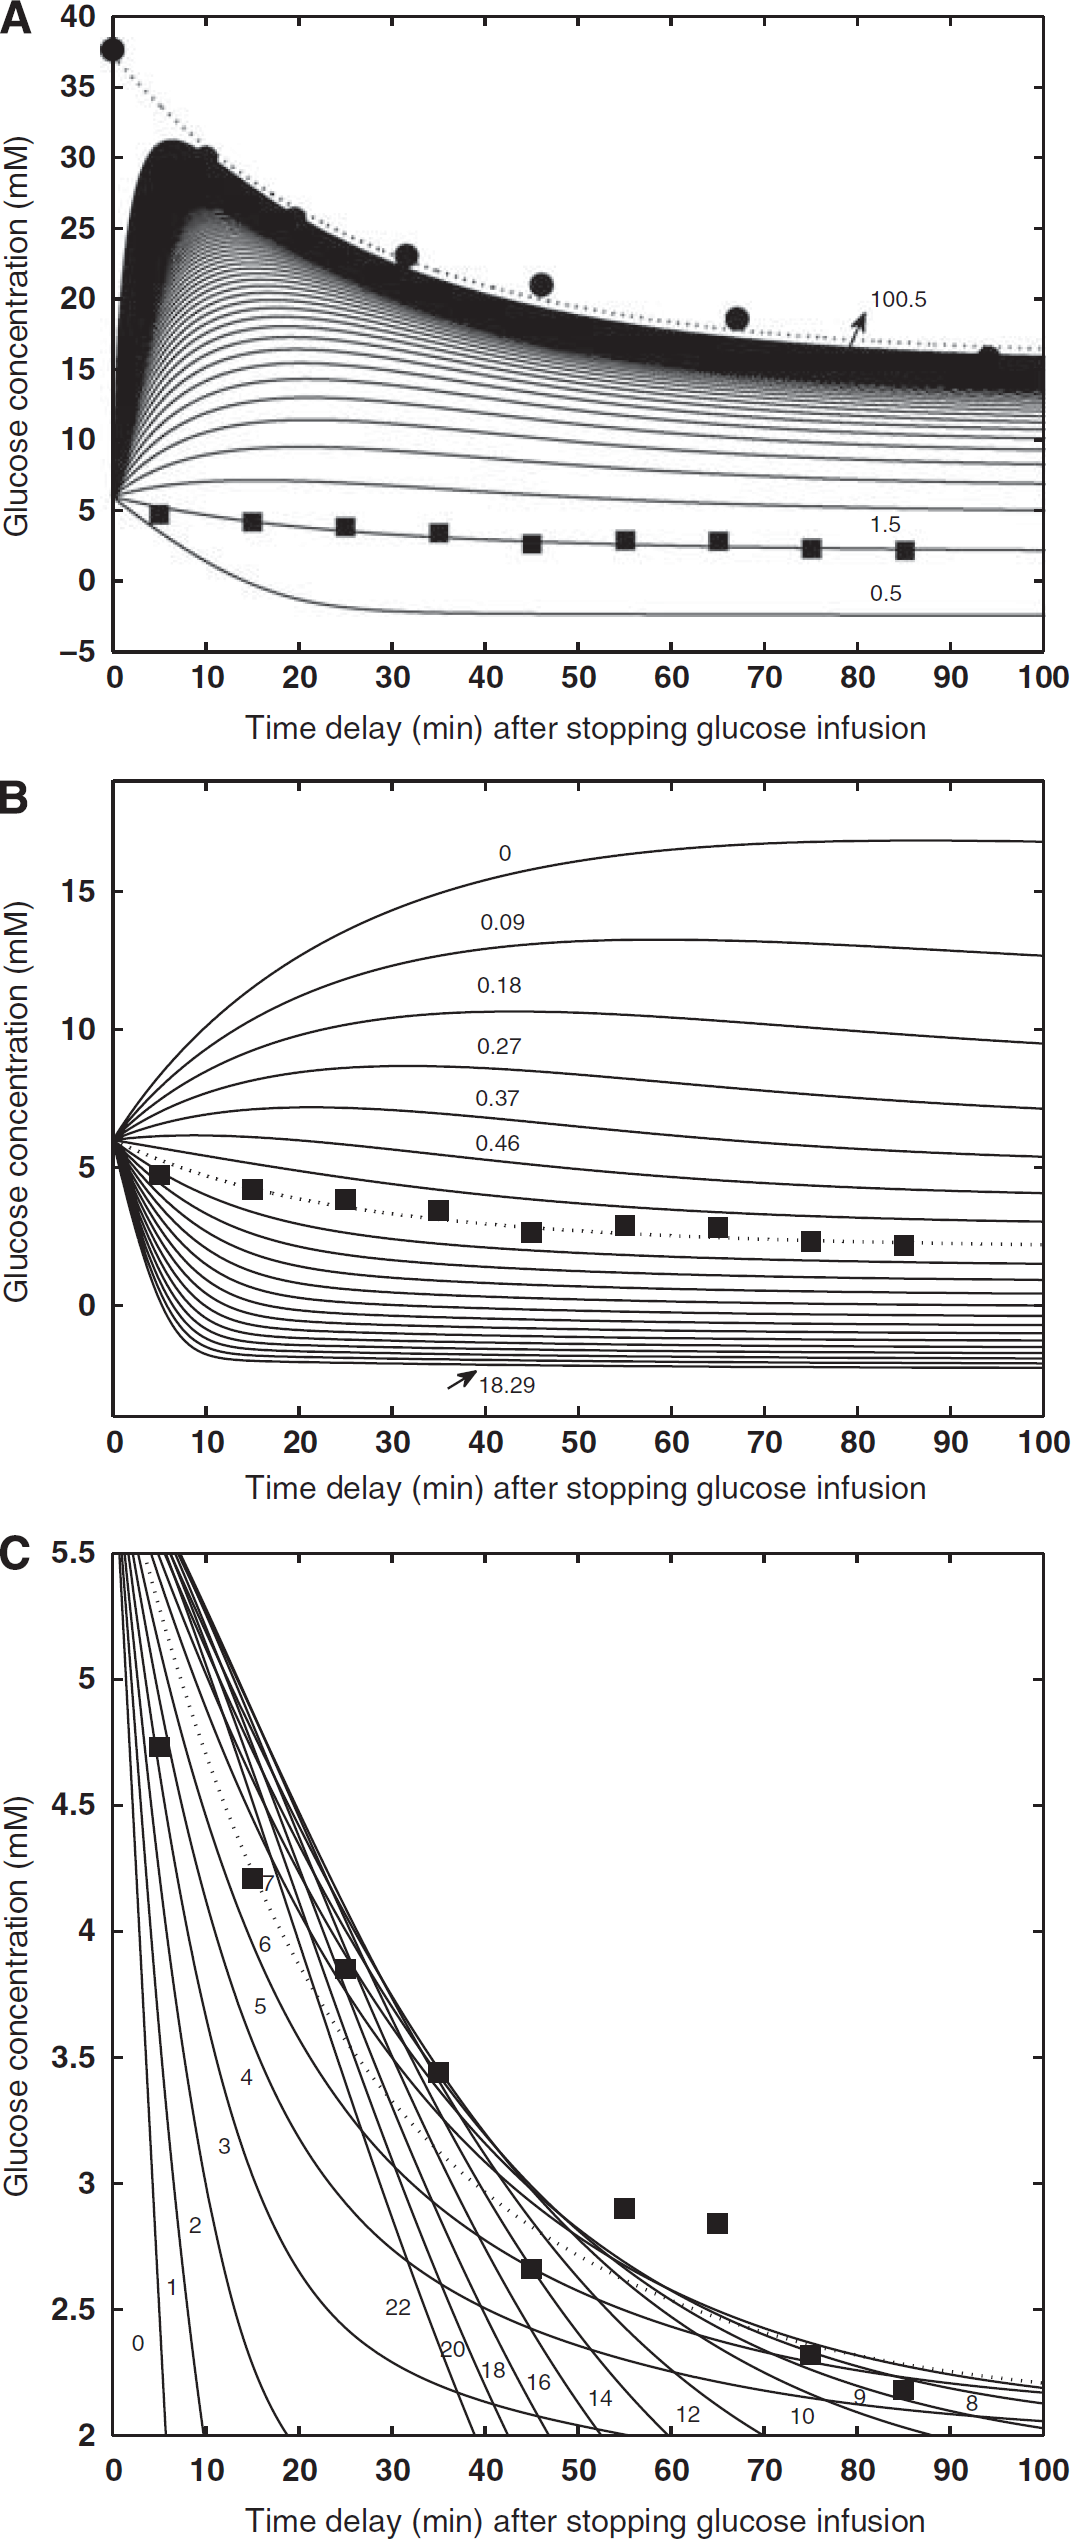
Simulated brain glucose concentration changes with the varied glucose transport constants and consumption rates. The measured glucose concentrations in the plasma and brain tissue were displayed as solid circles and squares, respectively. The simulations were performed based on the plasma glucose exponential decay function and equation (1) with varied parameters of (
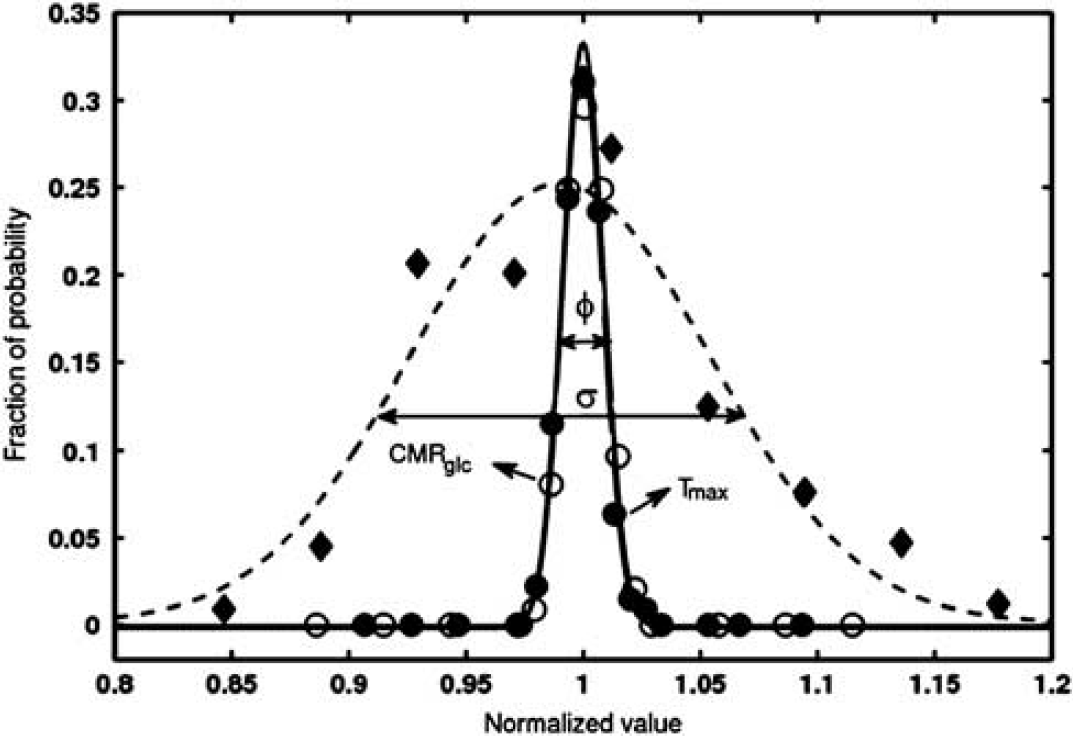
Quantitative description of curve-fitting error predicted by the Monte-Carlo simulation. The error distributions of each simulated parameter in the curve fitting were obtained from 2,000 sets of time courses of glucose concentrations in the brain tissue, which were achieved from the best fitted brain glucose curve plus the random noise based on the curve-fitting error (see Figure 2). The error distributions were fitted by the gauss function and the results were shown by the dashed (half-saturation constant, KT), dotted (maximum transport rate, Tmax), and solid lines (CMRglc), respectively. The linewidths at the half maximum height are indicated by σ=0.15 for half-saturation constant (KT), and Φ=0.02 for CMRglc and maximum transport rate (Tmax) that had the same error distributions. CMRglc, cerebral metabolic rate of glucose.
Discussion
In-vivo Brain 1H Magnetic Resonance Spectroscopy and Glucose Quantification
In-vivo1H MRS acquired from the rat brain at 9.4 T shows excellent sensitivity and spectral resolution. The doublet of lactate NMR resonance peaks at ∼1.3 p.p.m. and the resonance peaks of phosphocreatine/creatine at ∼3.9 p.p.m. are well resolvable (see Figure 1). It is clear that the observed signal increases of multiple 1H NMR resonance peaks (chemical shifts 3.0 to 5.2 p.p.m.) after glucose infusion come from a brain glucose concentration change, which has been observed in previous human or animal brain glucose infusion studies (Gruetter et al, 1992, 1996, 1998). The rat brain glucose resonance peak at ∼5.2 p.p.m. was detectable and resolved at 9.4 T as shown in Figure 1. Its signal intensity was small compared with the resonance peaks around 3.0 to 4.2 p.p.m. and quantification can be affected by the spectrum baseline and water residual signal. Therefore, only the glucose NMR resonance peaks from 3.0 to 4.2 p.p.m. were applied in this study to quantify the brain glucose concentration using the LCModel fitting approach, though these resonances are partially overlapped with other brain metabolites. The concentration of lactate in the rat brain (No. 7) shown in Figure 1 increased slightly (∼7%) after glucose infusion; however, the overall results from seven rats suggest that there is no statistical difference in lactate concentration between euglycemia and hyperglycemia conditions.
In the hyperglycemia condition, all brain metabolites except glucose had no significant changes as illustrated by the difference spectrum (Figure 1C) in comparison with the euglycemia condition. Therefore, the glucose concentrations before and after glucose infusion were quantified by the intrareference of the total creatine/phosphocreatine (tCr) signal at 3.01 p.p.m. ([tCr]=8.0 mmol/L). Before glucose infusion, the measured concentrations of glucose in the plasma and brain were 10.7±2.8 and 1.58±0.37 mmol/L, respectively, which are in good agreement with previous studies (Du et al, 2009; Gyngell et al, 1991; Iltis et al, 2009). After glucose infusion, the brain glucose concentration increased as glucose concentration in the plasma was elevated to 33.8±4.3 mmol/L, about a threefold increase in the plasma glucose concentration measured at euglycemia without major changes in blood physiology parameters (Table 1). Right after stopping glucose infusion, both plasma and brain glucose levels started to decrease as illustrated in Figure 2. The temporal behaviors of glucose concentration changes in the plasma and brain tissue suggest that glucose transport across BBB is highly efficient and well regulated, and it has a key role to adjust and facilitate the concentration of glucose in the brain tissue. This results in an increase in the brain glucose concentration; however, this concentration always remains lower than the plasma glucose concentration.
In-vivo Assessment of Glucose Metabolic and Transport Kinetics
Brain glucose transport and metabolic rate can be quantitatively measured using radioactive tracers (Brooks et al, 1986a,1986b; Gaitonde et al, 1965; Reivich et al, 1977; Sokoloff et al, 1977). For instance, positron emission tomography provides a sensitive method to measure the glucose phosphorylation rate in the brain using the F-2-DG tracer (Herholz et al, 1992; Piert et al, 1996; Reivich et al, 1979; Schwartzman et al, 1979). However, the interpretation and quantification of radioactive signals are complicated by the fact that all radioactive labels including glucose, metabolic intermediates, and products have contributions to the detected radioactivity signals (Holden et al, 1991; Mason et al, 1992; Sokoloff et al, 1977).
NMR provides an alternative approach since the brain glucose under physiological conditions and its change after glucose infusion are measurable by noninvasive in-vivo MRS approach although with a low sensitivity compared with the radioactive tracer's methods (Holden et al, 1991; Mason et al, 1992). The kinetic parameters of glucose transport and CMRglc can be measured by two popular strategies incorporated with a glucose infusion (Chen and Zhu, 2005; Gruetter et al, 1996; Holden et al, 1991; Mason et al, 1992). One is the steady-state glucose infusion approach, i.e., measuring the brain glucose concentration change as a function of plasma glucose concentration under the steady-state condition (i.e., at constant G0 and Gi levels). This strategy has been applied in several brain studies. For instance, it has been found that the steady-state glucose concentration in the brain tissue is approximately a linear function of the plasma glucose concentration across a wide range of plasma glucose concentrations (Choi et al, 2001, 2002; Gruetter et al, 1998; Lei and Gruetter, 2006). Regression of the measured [Gi] and [G0] data to the steady-state Michaelis-Menten model described by equation (2) can determine the ratio of CMRglc/Tmax and KT; however, this approach is unable to separately calculate the Tmax and CMRglc values.
Another strategy is based on the dynamic glucose infusion approach, i.e., measuring the glucose time courses of incremental brain and plasma glucose concentration changes during a well-controlled glucose infusion; consequently the absolute values of Tmax, CMRglc, and KT can be obtained by analyzing the brain and plasma glucose time courses and solving the glucose transport differential equation (Chen and Zhu, 2005; Gruetter et al, 1996; Mason et al, 1992; Shestov et al, 2007; Van Zijl et al, 1997). However, the measurement of the brain glucose time course and its fitting results are sensitive to the glucose infusion protocol for raising the plasma glucose concentration continuously and smoothly, which is a challenging task practically.
In the present study, we applied the dynamic glucose infusion approach but with an improved strategy by measuring the time courses of brain and plasma glucose concentration changes after stopping glucose infusion, i.e., during the post glucose infusion period rather than during the glucose infusion. This new approach offers several advantages.
First, the reliability and accuracy of glucose measurements should be improved since most data points of glucose time course measured from the brain tissue were obtained under a hyperglycemia condition, leading to large brain glucose NMR signals and lower LCModel fitting errors. In the present study, the Cramer-Rao lower bound of LCModel for fitting glucose NMR signals after glucose infusion (hyperglycemia condition) was ∼15%, which was significantly smaller than that measured before glucose infusion (∼30%, euglycemia condition). It is known that glucose NMR sensitivity is relatively low owing to strong homonuclear coupling among proton spins on the sugar ring (see the glucose spectrum shown in Figure 1D) even with a short echo time (13 ms) and high field strength at 9.4 T. The glucose concentration measurement errors could substantially degrade the curve-fitting accuracy for quantitative assessment of glucose metabolic kinetics.
Second, the time window for observing the dynamic decay of brain glucose concentration change is longer for the post glucose infusion strategy than that for observing a glucose increase during glucose infusion. In this study, it took ∼120 minutes for the brain glucose approaching a new steady state, low level after stopping glucose infusion. Therefore, more data points of the brain and plasma glucose time courses or more NMR signal averages can be realized for improving curve-fitting accuracy.
Third and more importantly, the new approach is convenient and robust to implement glucose infusion with less constraint. For the new strategy used in the present study, it is not necessary to follow a specific infusion protocol with desired infusion time delay and rate control. etc. that are crucial for the steady-state glucose infusion experiment or dynamic glucose measurement during a glucose infusion. After stopping glucose infusion, both the plasma and brain glucose concentrations naturally start to decay. The plasma glucose decay measured from 9 of 10 rats including 3 used for bench tests followed a simple exponential decay function although its decay rate varied from 0.1 to 0.007 per minute (see Table 2). Although the plasma glucose decay might not strictly follow an exponential function, this simple function provided a good approximation of the limited experimental measurements for solving the glucose differential equation of equation 1. These advantages make the in-vivo measurements of CMRglc, Tmax, and KT more robust and reliable.
In addition, one can further modify the current glucose infusion protocol for raising the plasma and brain glucose concentrations simply by a rapid glucose bolus injection through a vein. This could further simplify the procedure for introducing glucose into the blood stream and offer valuable utility for potential human applications.
Several lines of evidence suggest that the strategy for measuring CMRglc, Tmax, and KT during a post glucose infusion period and the dynamic Michaelis-Menten model (e.g., equation (1)) applied in the present study for solving the glucose transport equation are valid.
First, the values of CMRglc, Tmax, and KT determined by the dynamic post glucose infusion measurement and the standard dynamic Michaelis-Menten model were 0.44±0.17 μmol/g per minute, 1.35±0.47 μmol/g per minute, and 13.4±6.8 mmol/L, respectively, and are in good agreement with the values reported in the literature (Brender et al, 1975; Chen et al, 1993; Du et al, 2009; Lei and Gruetter, 2006; Mason et al, 1992; Ori et al, 1986; Pardridge, 1984). Specifically, the KT value has been reported to be 13.9±2.7 mmol/L from an in-vivo MRS study (Mason et al, 1992), and 11.0 mmol/L as well as Tmax=1.4 to 1.6 μmol/g per minute measured by the radioactive tracer method (Brender et al, 1975; Pardridge, 1984), respectively. These results from the literature show good concordance with our results. In addition, the average CMRglc value measured from the rat motor, visual, auditory, and somatosensory cortical regions was 0.53 μmol/g per minute under 1.5% end-tidal isoflurane anesthesia (Ori et al, 1986). Considering the higher metabolic rate of rat cortex region under relatively mild anesthesia condition with 1.5% isoflurane in this previous study, it is again consistent with our CMRglc result of 0.44±0.17 μmol/g per minute.
Second, the CMRglc and CMRglc/Tmax values were also independently determined as 0.46±0.19 μmol/g per minute and 0.34±0.07 at euglycemia condition (before glucose infusion) using equation (2) and the glucose transport constants (Tmax and KT) obtained from the dynamic glucose infusion study (see Table 2). They are in excellent agreement with the results (CMRglc=0.44±0.17 μmol/g per minute and CMRglc/Tmax=0.35±0.13) measured at hyperglycemia condition during the post glucose infusion period using the dynamic glucose infusion approach. Moreover, the results of CMRglc/Tmax between 0.34 and 0.35 are also consistent with the reported value of CMRglc/Tmax≈0.38 measured in the rat brain with α-chloralose anesthesia (Choi et al, 2002; Koga and Miura, 1988; Lei and Gruetter, 2006; Oz et al, 2004) as well as CMRglc/Tmax between 0.3 and 0.4 from our previous study (Du et al, 2009). The ample evidence of excellent consistency within the comparison results of the present study as well as compared with the literature reports validates the in-vivo1H MRS approach for simultaneous measurements of CMRglc, Tmax, and KT, and also supports the validity of the standard Michaelis-Menten glucose transport model within the hyperglycemic glucose range studied herein. It also suggests that the physiological conditions of rat brains and the associated glucose metabolic rate and transport constants were similar between before and after glucose infusion periods. Moreover, the Tmax and KT constants measured by the dynamic glucose infusion approach could be useful for determining the CMRglc value using a single [G0] and [Gi] paired data and the standard Michaelis-Menten glucose transport equation as described by equation (2). This could significantly reduce the CMRglc measurement time and make it possible to measure CMRglc under the euglycemia condition without the use of glucose infusion.
Measurement Error Analysis
To investigate the experimental errors for measuring the values of CMRglc, Tmax and KT, numerical simulations were performed and the results are shown in Figures 3 and 4. With an increment of Tmax, the brain glucose concentration will increase and gradually approach the plasma glucose concentration (see Figure 3A). The Tmax value reflects the glucose permeability and it should be sensitive to the change of brain glucose transporters. In contrast, an increment of CMRglc will decrease the brain glucose concentration if the glucose transport constants are fixed (see Figure 3B), and it indicates a complementary relationship between the glucose metabolism and brain glucose concentration. The simulation results suggest that the brain glucose concentration changes unidirectionally with the varied Tmax (Figure 3A) or CMRglc (Figure 3B). However, the KT dependence of brain glucose concentration has a distinct behavior showing bidirectional changes as shown in Figure 3C; thus, the same brain glucose concentration value could relate to two different KT values. This ambiguity leads to large curve-fitting uncertainty and KT measurement error. This notion was supported by the results of the Monte-Carlo simulation (Figure 4), showing a more broad error distribution of KT measurement compared with that of CMRglc and Tmax measurements. Nevertheless, the in-vivo1H MRS method as described in this study provides a valuable, robust tool to access regional alterations of brain glucose metabolism and transport associated with the physiological or pathological changes.
Potential Impact on Human Study and Clinical Application
Although this study aimed to test and validate the new in-vivo1H MRS approach for simultaneous measurements of CMRglc, Tmax, and KT using the rat animal model, the same approach can be readily translated to human brain and potentially to clinical applications. Glucose infusion is a useful protocol commonly applied to study brain glucose metabolism and transport in human subjects, and the plasma glucose concentration has been increased to a high level of 30 mmol/L (similarly to the level used in the present rat study) without obvious side effect, resulting in a large increase of brain glucose concentration >5 to 6 folds reaching several mmol/L concentration (Gruetter et al, 1998). Moreover, several studies have shown the reliability of in-vivo1H MRS for detecting a small (<0.5 mmol/L) reduction of brain glucose concentration in the human visual cortex during visual stimulation at 1.5 T (Merboldt et al, 1992), 2.1 T (Chen et al, 1993), and 7 T (Mangia et al, 2007). Another fact in favor of the human application is the big human brain size that is >600 times of the rat brain size; this translates to a large MRS voxel size suitable for human brain application. Collectively, these discussions suggest that the new in-vivo1H MRS approach is likely more favorable for human application in considering high detection sensitivity and accuracy for in-vivo assessment of brain glucose metabolic rate and glucose transport.
Conclusions
A novel approach to simultaneously measure CMRglc, KT, and Tmax via monitoring the dynamic glucose concentration changes in the brain tissue and plasma right after glucose infusion was complemented and tested in the rat brain. The results of CMRglc, Tmax, and KT determined by the standard Michaelis-Menten model (Lund-Andersen, 1979) have good agreements with the previously reported values. The simulation results suggest that the measurements of CMRglc and Tmax using the post glucose infusion approach are more reliable than that of KT. The new approach significantly simplifies the in-vivo measurement and quantification of brain glucose metabolic rate and transport constants. It may provide an alternative, robust, and promising neuroimaging tool suitable for human brain studies under physiological and pathological conditions.
Footnotes
Acknowledgements
The authors thank Drs. Pierre Gills Henry, Gulin Oz, Alexander Shestov and Mr. Christopher Nelson for technical assistance and scientific discussion.
Disclosure/conflict of interest
The authors declare no conflict of interest.