
Abstract
There is a characteristic decrease in glucose metabolism in associative frontal and temporo-parietal cortices of patients suffering from Alzheimer's disease (AD). The decrease in metabolism might result from local neuronal loss or from a decrease of synaptic activity. We measured in vivo [11C]methionine accumulation into proteins with positron emission tomography (PET) to assess cortical tissue loss in AD. Both global regional activity and compartmental analysis were used to express [11C]methionine accumulation into brain tissue. Glucose metabolism was measured with [18F]fluorodeoxyglucose and autoradiographic method. Combined studies were performed in 10 patients with probable AD, compared to age-matched healthy volunteers. There was a significant 45% decrease of temporo-parietal glucose metabolism in patients with AD, and frontal metabolism was lowered in most patients. Temporo-parietal metabolism correlated to dementia severity. [11C]methionine incorporation into temporo-parietal and frontal cortices was not significantly decreased in AD. There was no correlation with clinical symptoms. Data suggest that regional tissue loss, assessed by the decrease of [11C]methionine accumulation, is not sufficient to explain cortical glucose hypometabolism, which reflects, rather, reduced synaptic connectivity.
Keywords
Patients suffering from probable and definite Alzheimer's disease (AD) show a characteristic decrease in glucose metabolism in associative temporoparietal and frontal cortices demonstrated in vivo by positron emission tomography (PET) (Foster et al., 1984; Duara et al., 1986; Herholz et al., 1993; Salmon et al., 1994). The relationship between this metabolic dysfunction and the neuropathology of AD remains unclear. Macroscopic atrophy in AD might affect in vivo PET measurements by the inclusion of metabolically inert cerebrospinal fluid (CSF) in the regions of interest (Herscovitch et al., 1986;Chawluk et al., 1987). Comparison of PET and computed tomography (CT) scan data suggest that the metabolic defect is not merely a reflection of the imaging of less tissue (de Leon et al., 1983; Kuhl et al., 1985; Schlageter et al., 1987; Smith et al., 1992). However, glucose hypometabolism could still be explained by atrophy in terms of regional decrease in total protein content (Najlerahim and Bowen, 1988) or in terms of cortical neuronal loss (McGeer et al., 1986). Alternately, the reduction of cerebral metabolic rates of glucose may reflect a decrease of synaptic activity (DeKosky and Scheff, 1990). Glucose hypometabolism would then correspond more to degeneration and loss of dendritic arborization than to loss of neurons (Flood and Coleman, 1986). Moreover, decreased synaptic activity could also depend upon functional and/or anatomical deafferentation of cortical neuronal cells (Procter et al., 1988; Hamos et al., 1989).
We capitalized on the idea that neuronal loss should be detectable by a determination of the local rate of perikaryal protein synthesis (Lajtha et al., 1993) in patients undergoing combined PET studies of [11C]methionine accumulation and cerebral metabolic rate of glucose who suffer from probable AD and a wide range of dementia severity. The aim was to assess the influence of tissue loss (estimated by reduction of protein synthesis) on regional glucose utilization.
SUBJECTS AND METHOD
Subjects
We studied 10 patients (six men, four women) with dementia (American Psychiatric Association, 1987), suffering from probable AD (McKhann et al., 1984). They were 61.5 ± 8.4 years old and their mean score at mini-mental state examination (MMSE) (Folstein et al., 1975) was 15.8 ± 7.2 (range, 4–23). Disease onset corresponded to the first memory difficulties noticed by the family, and mean dementia duration was 2.6 ± 1.3 years. CT scans were normal or showed moderate diffuse atrophy. All patients underwent both [18F]fluorodeoxyglucose (18FDG) and L-[methyl-11C]methionine scans. Scans were performed at 1–6-week intervals, since the 18FDG pattern was used as a further selection criterion before proceeding with the [11C]methionine study. Demented subjects were compared to 16 healthy age-matched controls who comprised one control group of 11 subjects (six men and five women, 59.0 ± 9.9 years old) for 18FDG studies, and one control group of nine subjects (five men and four women, 60.7 ± 7.4 years old) for [11C]methionine. Only five control subjects underwent both 18FDG and [11C]methionine scans. Volunteers did not have any medical problems; their neurological examinations were normal; they did not take any medication; and all had maximal scores (30/30) for MMSE. The project was approved by the Ethics Committee of the University of Liège. Informed consent was obtained from all subjects.
Radiochemistry
No-carrier-added 18FDG was prepared using the nucleophilic reaction and the method of Hamacher et al. (1986).
L-[methyl-11C]methionine was synthesized by a reaction between 11CH3I and L-homocysteine thiolactone (Comar et al., 1976) and subsequent high-performance liquid chromatography (HPLC) purification. The radio-synthesis was fully automated (Delfiore et al., 1986), and it produced 5.55 GBq (150 mCi) L-[methyl-11C]methionine, 40 min after the end of bombardment. Mean specific activity at the end of synthesis was 46 ± 14 GBq/μmole (1243 ± 378 mCi/μmole). Initially, pure [11C]methionine did not reach 100% in the radiopharmaceutical ready for injection since some products of oxidation such as [11C]methionine sulfoxide were found in small amounts. For the subsequent nine procedures, ascorbic acid was added at the end of the synthesis to avoid the formation of by-products.
Data acquisition
Brain activity was measured with a whole body Ecat 951/31R tomograph with retractable septa (CTI-Siemens, Knoxville, TN, U.S.A.). All studies were performed in stationary mode with septa in, allowing acquisition of 31 contiguous transverse slices each spaced 0.3375 cm apart in a 10.8 cm axial field of view.
Reproducible positioning was insured by maintaining the patient's head with a thermolabile plastic face mask fixed on a head holder. The lower transaxial plane of the scanner was aligned parallel to and 10 mm above the orbito-meatal line. This position was checked every 5 min through crossed laser beams. All scans were performed in the morning (mean time of injection was 11:15 a.m.), in a quiet and darkened room with the fasting subjects keeping their eyes closed.
Correction for absorption was performed with attenuation measured in a transmission scan using three retractable rotating rod sources.
An 8 mCi of 18FDG was injected intravenously. Blood samples were withdrawn manually throughout the study from a radial artery catheter, for both plasma radioactivity and plasma glucose measurements. The autoradiographic method was applied and a 20-min emission scan was acquired 30 min after 18FDG injection.
Mean injected dose of L-[methyl-11C]methionine was 19.5 ± 2.8 mCi. Arterial whole blood activity was measured at 1-s intervals through a blood counter during the first 6 min of acquisition. Blood samples were also withdrawn manually at 1-min intervals until 6 min had elapsed, then every 5 min until the end of the study. Blood and plasma radioactivity were measured for each syringe sample. Tomographic acquisitions started at injection time and ended 75 min later. Scan duration progressively increased from 5 s to 10 min.
Scan data were reconstructed with a Hanning filter and cut-off frequency set at 0.5, giving a spatial resolution of 8.7 × 8.7 × 5.8 mm at the center of the field of view (Degueldre and Quaglia, 1992).
Plasma analysis
Percentage of unmetabolized tracer in plasma was estimated at 10, 20, 30, 45, and 60 min in 10 subjects (seven controls and three AD patients), according to Planas et al. (1992). Briefly, radioactivity was measured with an automatic sample changer Berthold BF 5300 equipped with a ring-shaped NaI(Tl) crystal. Trichloroacetic acid was added to plasma to precipitate proteins. The supernatant was used for HPLC analysis after derivatization with o-phtaldialdehyde, and fractions were collected to determine the percentage of radioactivity due to free methionine and labelled metabolites.
Table 1 shows the percentage of plasma free [11C]methionine from the injection time to 60 min after tracer injection. Free [11C]methionine did not reach 100% in the injectate due to the fact that products of oxidation were present in small amounts in the initial products. The percentage of free [11C]methionine in samples obtained 10 min after tracer injection is not significantly different from that in the injectate (paired t-test, p = 0.3). This percentage progressively decreases in subsequent samples, and the coefficient of variation of the measurement increases. Table 1 also shows the percentage of plasma radioactivity corresponding to proteins and metabolites.
Relative contribution of different constituents to total plasma radioactivity a
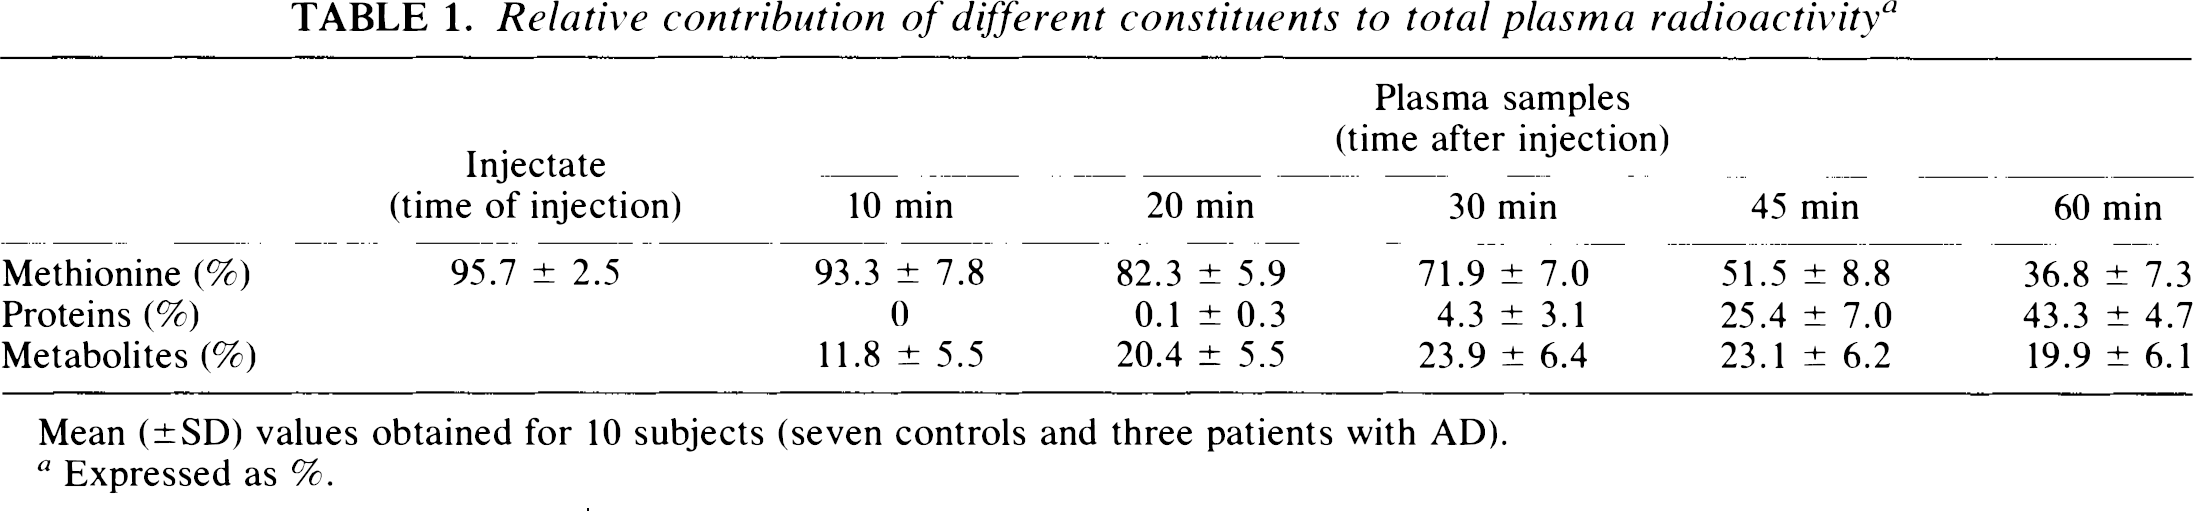
Mean (±SD) values obtained for 10 subjects (seven controls and three patients with AD).
Expressed as %.
Data analysis of 18FDG studies
Cerebral metabolic rates of glucose were calculated using the operational equation derived by Phelps et al. (1979). Values of rate constants were those of the literature (k1 = 0.102, k2 = 0.130, k3 = 0.062, and k4 = 0.0068), and the lumped constant was 0.42.
Circular regions of interest (1.96 cm2) were placed on parametric images of glucose consumption, in medial occipital, frontal and temporo-parietal cortices on 10 contiguous planes. Values were then lumped together into one occipital region as well as left and right frontal and temporo-parietal areas in order to simplify analysis. Ratios of metabolic values in associative versus occipital cortices were also calculated (Messa et al., 1994).
Data analysis of methionine studies
Time-activity curves of [11C]methionine brain distribution are characterized by a rapid initial accumulation for 5–10 min, after which the activity level reaches a plateau (O'Tuama et al., 1988). Regions of interest defined on 18FDG scans were copied, displayed, and eventually repositioned on a summed image of [11C]methionine scans, and time-activity curves in the different brain areas were then created from dynamic acquisitions. Three different approaches were used to analyse tracer kinetics.
Cortex to occipital ratio. The cortex/occipital ratio was derived from brain activity averaged from 15 to 65 min (plateau) and expressed in percentage of injected dose per liter. The medial occipital region was taken as a reference to comply with 18FDG analysis.
Patlak-Gjedde graphical analysis. This analysis is frequently used in tumor studies with [11C]methionine (Bergström et al., 1987; Sato et al., 1992). It assumes that the tracer is trapped in an irreversible compartment, and this condition seems to occur at ∼15 min after injection.
Compartmental modelling. A dynamic three-compartment model was used (Bustany et al., 1985), and three rate constants (k1, k2, and k3) were calculated for each area. Vascular activity in the region of interest was also included in the model. The time delay between cerebral input function and that observed for remote blood sampling was estimated; the dispersion time constant was fixed at 12 s according to our blood counter characteristics. The modelling procedure involved a classical weighting function, using variance of observed data. A Raphson-Newton method was applied for the minimization step.
The two latter approaches required an input function representing the amount of free [11C]methionine in plasma. The percentage of unmetabolized tracer in plasma was measured directly for the last 10 studies (see plasma analysis). A “mean” free labelled methionine percentage curve was then derived and applied to the first studies. High frequency (1/s) continuous measurement of blood activity during the first 6 min was important for good estimation of k1 in the modelization process (see data acquisition). We then assumed that whole blood and plasma activity reached an equilibrium within a few seconds. Ratios of whole blood over total plasma radioactivity calculated 20–75 min after injection were relatively constant, since coefficients of variation varied only from 2.9 to 8.9%. Those ratios were not significantly different between AD patients (0.83 ± 0.04) and controls (0.85 ± 0.01, p = 0.44 using an unpaired t-test) and were used to generate a total plasma time-activity curve from early continuous recording of whole blood radioactivity.
Statistics
A group analysis (control versus patient groups) was performed by analysis of variance (ANOVA). Trends were then explained in figures showing individual values. Correlations were demonstrated by a Spearman rank test.
RESULTS
Metabolic rates of glucose
Table 2 shows regional cerebral metabolic rates of glucose in 10 patients with probable AD compared to 11 healthy age-matched volunteers. All values of cortical metabolism are significantly lower in AD than in controls. Reduction of metabolism was more significant in the temporo-parietal cortex (45% decrease) than in frontal or occipital regions (25 and 22% decreases, respectively, compared to mean control values).
Metabolic rates of glucose
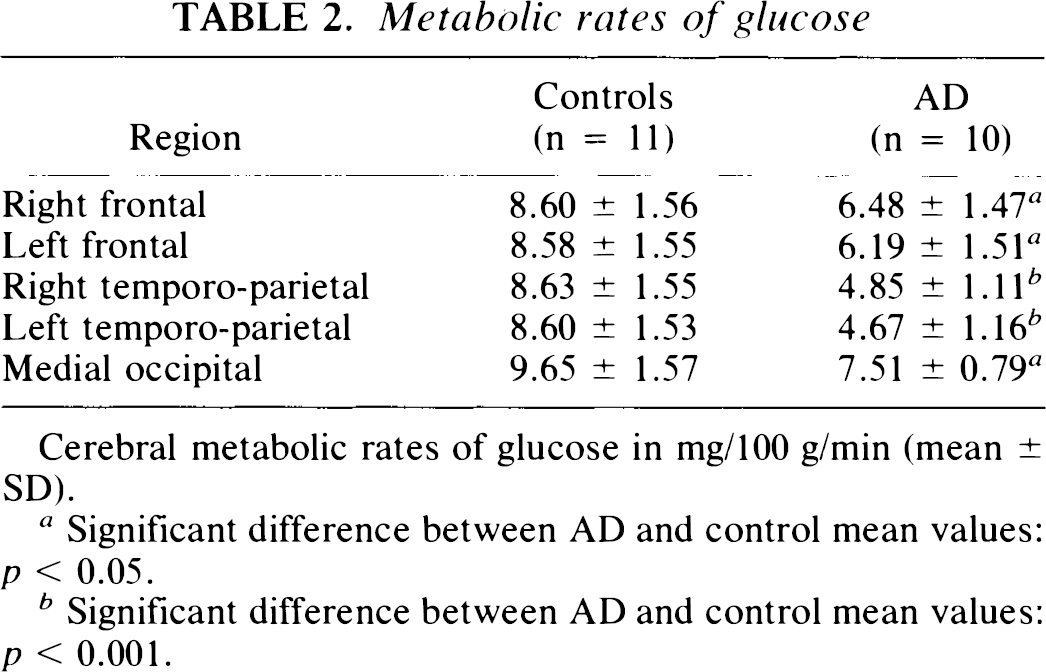
Cerebral metabolic rates of glucose in mg/100 g/min (mean ± SD).
Significant difference between AD and control mean values: p < 0.05.
Significant difference between AD and control mean values: p < 0.001.
In the population of AD patients, ratios of associative over occipital cortical metabolic values were significantly decreased in temporo-parietal cortices only. When left and right values were averaged, there was an optimal discrimination in temporoparietal regions, where all ratios were decreased in patients compared to healthy volunteers (Fig. 1). Most frontal metabolic ratios of AD patients were in the normal range.
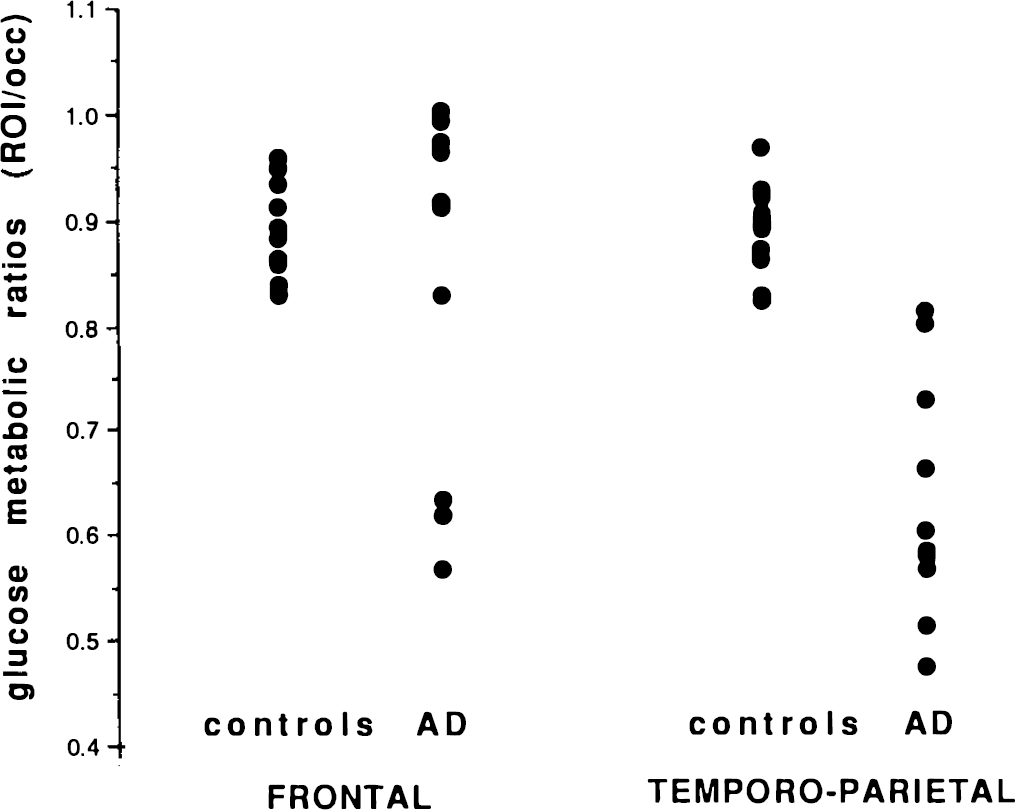
Averaged (right and left) values of regional over occipital glucose metabolic ratios in frontal and temporoparietal associative cortices for controls and patients with AD.
[11C]Methionine distribution
Values of cerebral activity after [11C]methionine distribution, expressed as a percentage of injected dose per liter, ranged from 1.9 in frontal to 2.4 in occipital regions. They were not significantly different between patients and controls. Cerebellar activity measured in AD patients was higher than in any other region of both controls and AD; thus, we did not consider the cerebellum as a reference.
When the occipital region was used as reference to calculate ratios of [11C]methionine distribution, values were not significantly different between patients and controls. Fig. 2, however, shows that all but one patient had temporo-parietal values lower than the control mean, while frontal values were similarly distributed between both groups.
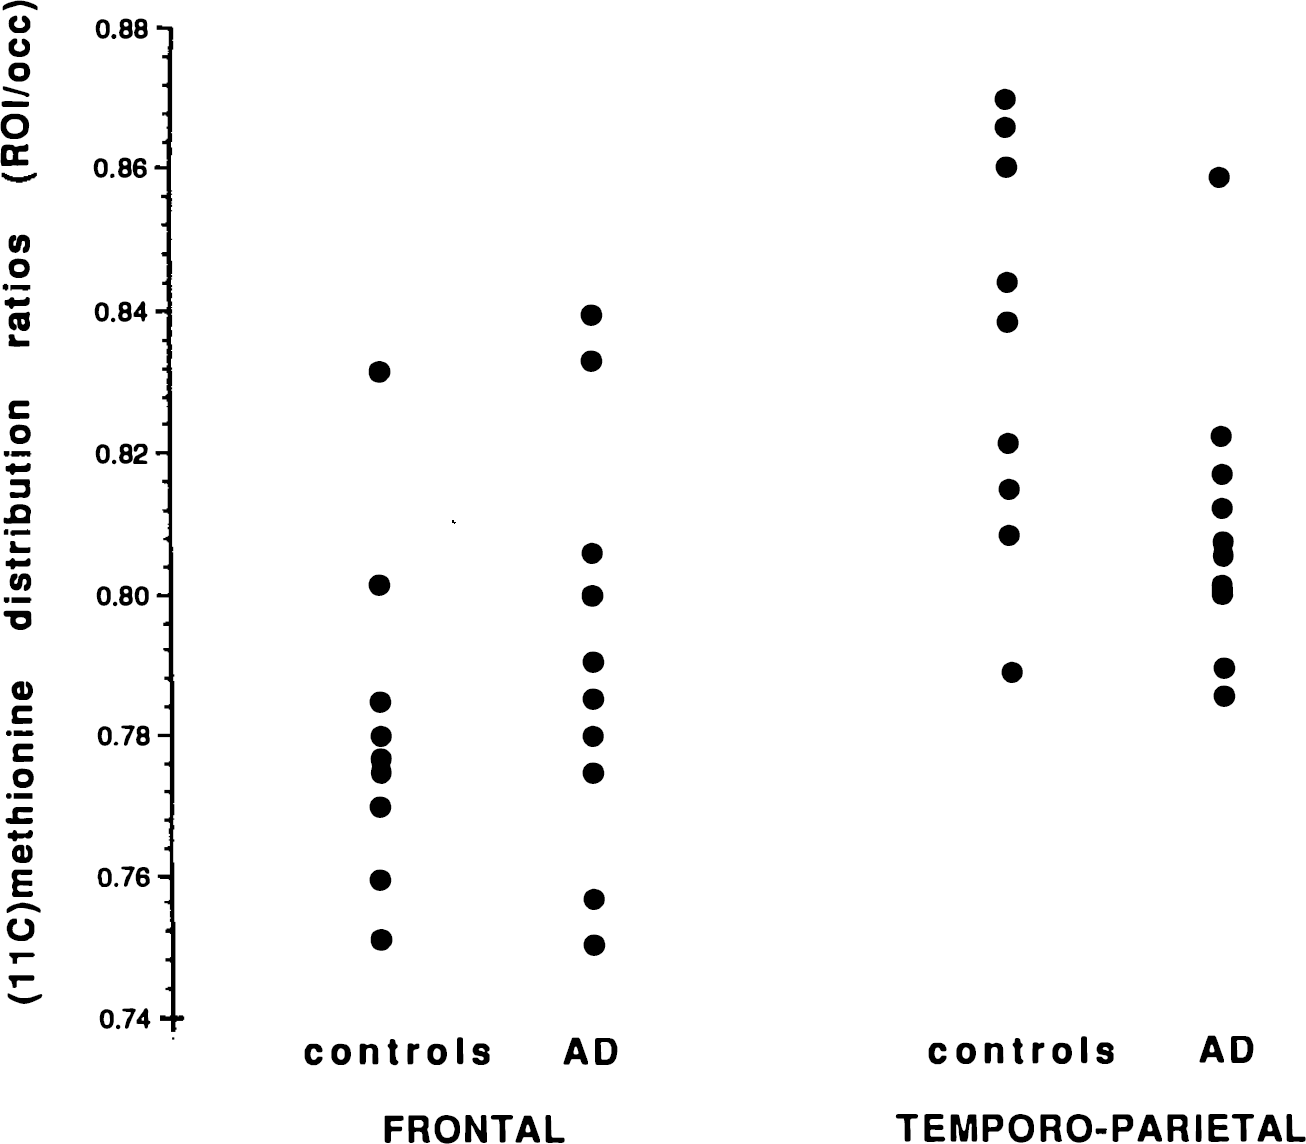
Averaged (right and left) values of [11C]methionine distribution ratios in frontal and temporo-parietal associative cortices for controls and patients with AD.
[11C]Methionine Patlak-Gjedde analysis
Values of the unidirectional influx constant of [11C]methionine from plasma to associative cortices (Ki) were obtained in nine patients and seven controls (data not shown). The plasma-free [11C]methionine curve was not available in one patient and two controls. Mean values, expressed as min−1, ranged from 1.42 (frontal) to 1.82 (occipital) in controls and from 1.32 (frontal) to 1.69 (occipital) in patients. There was a moderate but not significant decrease of Ki in AD compared to controls, with a maximal mean reduction of 13 and 15% in right and left temporo-parietal cortices, respectively.
[11C]Methionine modelling
Table 3 contains the values of rate constants k1, k2, and k3 obtained in cortical regions using the compartmental modelling approach. Values of k1 and k2 are generally lower but not significantly different in patients than in controls. Similar brain-plasma distribution volumes of [11C]methionine (k1/ k2 + k3) were obtained in the AD and control groups, with occipital values (0.34) slightly higher than values in associative cortices (mean 0.30; data not shown). Values of k3 are decreased in the temporo-parietal cortex of AD patients (22% and 20% in right and left regions, respectively) but the decrease is significant on the right side only. Table 3 also displays the values of [11C]methionine plasma to brain accumulation rate constant (k1 × k3/k2 + k3), showing a nonsignificant decrease predominant in both temporo-parietal regions of the AD group. The decrease reaches 17% and 20% of control values in right and left regions, respectively.
Rate constants of compartmental model describing (11C)methionine distribution
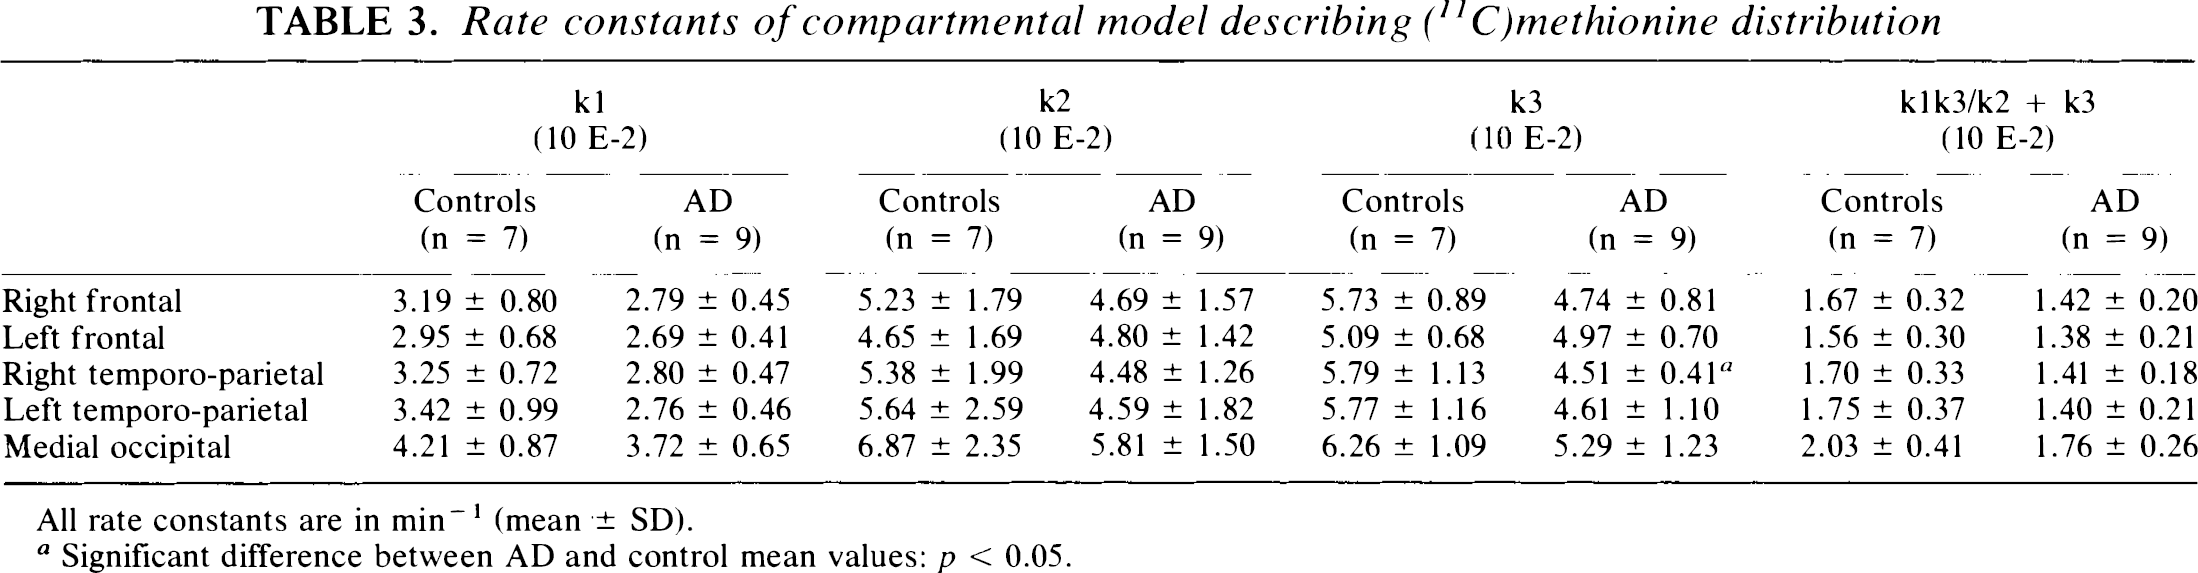
All rate constants are in min−1 (mean ± SD).
Significant difference between AD and control mean values: p < 0.05.
Rate constants of plasma to brain [11C]methionine accumulation obtained with the three-compartment model are highly correlated with those derived from Patlak-Gjedde analysis.
Relationships between glucose metabolism, [11C]methionine distribution and severity of dementia
The severity of dementia, expressed by the MMSE score, is significantly correlated with the metabolic rates of glucose in right and left temporoparietal cortices (Spearman correlation, p = 0.02 and p = 0.005, respectively), but not in frontal regions. There is no relationship between MMSE scores and the different values describing regional [11C]methionine distribution.
When we paired percentages of decrease for each patient (compared to respective mean control values), cerebral metabolic rates of glucose were significantly more reduced than were rate constants of plasma to brain [11C]methionine accumulation (paired t-test, p < 0.001). We did not observe any direct correlation between metabolic rates of glucose and values of [11C]methionine cerebral distribution in our AD patients. However, Fig. 3 shows a positive correlation between asymmetries of distribution of glucose metabolism and [11C]methionine in temporo-parietal cortices, i.e., right/left ratios of cerebral metabolic rates of glucose and cerebral activity after [11C]methionine administration (Spearman correlation, p = 0.004). The correlation is negative between asymmetries of glucose metabolism and asymmetries of k2 and k3 rate constants describing [11C]methionine exchanges in temporoparietal cortices (Spearman correlation, p = 0.005 and p = 0.007, respectively).
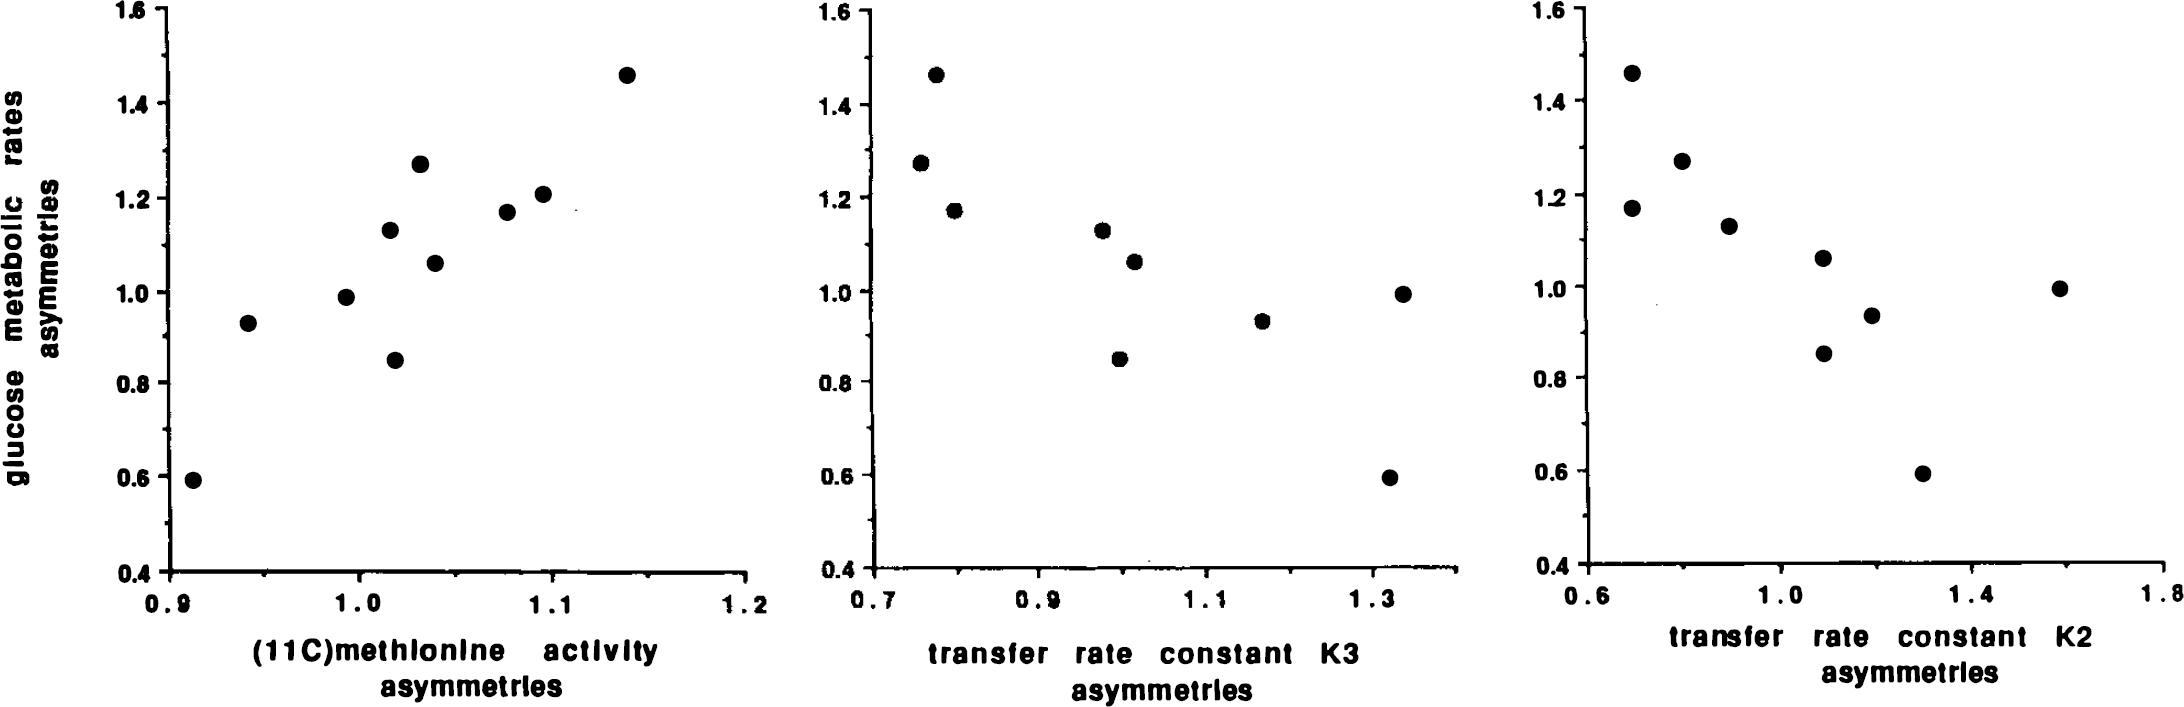
Correlation between asymmetries (right/left ratios) of glucose metabolic rates in temporo-parietal cortex of patients with AD and asymmetries of different parameters describing [11C]methionine cerebral distribution: brain activity after [11C]methionine administration and transfer rate constants k3 and k2.
DISCUSSION
Glucose metabolism in AD
All patients fulfill NINCDS-ADRDA work group criteria for probable AD (McKhann et al., 1984). Mean cerebral metabolic rates of glucose are decreased in all cortical regions and all patients show reduced glucose metabolic ratios in temporoparietal cortices (Foster et al., 1984; Kuhl et al., 1985; Duara et al., 1986; Haxby et al., 1986; Herholz et al., 1993). Although significantly reduced in the patient group, metabolism of individual subjects is less frequently affected in frontal than in posterior associative cortices (Kuhl et al., 1985). In our population, mean disease duration is only 3 years and shows no correlation to cerebral metabolic rates of glucose. Patients have a wide range of MMSE scores, significantly correlated to temporoparietal metabolism (Haxby et al., 1985). Thus, cerebral glucose consumption is a functional parameter related to the severity of dementia in AD.
Behavior of [11C]methionine in brain tissue
Tracer kinetic measurement of cerebral protein synthesis can be approached with PET (Phelps et al., 1984). L-[11C-methyl]methionine is relatively easy to synthesize and it is frequently used as a tracer (Comar et al., 1976; Vaalburg et al., 1993). A brief review of [11C]methionine behavior will help to interpret our results. L-methionine is transported through the blood-brain barrier and accumulates in neurons and glial cells. Methionyl-tRNA, the real precursor pool for protein synthesis, represents only a small fraction of the free methionine pool. However, the specific activity of both pools is the same and they can be combined in a simplified model describing amino acid incorporation into proteins (Grange et al., 1992). Brain proteins comprise a large pool (mainly structural proteins) with several days' half life and a small fraction (probably enzymes) with few hours' half life. Mean brain protein half life is ∼4 days (Lajtha et al., 1976; Lajtha and Dunlop, 1981). There is a constant turnover; and, since the amount of the amino-acid in proteins is much larger than its free concentration, most of the labelled amino-acid will be detected in cerebral proteins in the hour following its intravenous administration. L-[11C-methyl]methionine also follows transmethylation (and transsulfuration) cycle. Methionine is transformed in S-adenosyl-methionine, a major methyl donor for many biochemical reactions. Labelling is then transferred to various methyl acceptors. The relative rate of methionine flux into the transmethylation cycle is estimated at 10% of the rate of methionine incorporation into brain proteins, so that metabolism of methionine is mainly directed towards protein synthesis (Grange et al., 1992). Kinetic analysis is based on a three-compartment model that does not take minor metabolic pathways into account (Bustany et al., 1985; Blomqvist et al., 1993). Labelled amino-acid accumulation rate into tissue proteins can then be determined. However, the kinetic approach assumes that the specific activity of the precursor pool is similar to that measured in plasma. In fact, the precursor pool is further diluted by amino acid originating from intracellular protein breakdown. Thus, tracer approach measures an apparent amino acid incorporation rate that depends both on the exact rate of amino acid incorporation into proteins and on dilution of the precursor pool by protein breakdown. The exact amino acid incorporation rate is then underestimated since amino-acid recycling cannot be taken into account in the mathematical model. To date, methionine is the amino acid that presents the lowest degree of dilution in the precursor pool for protein synthesis (Grange et al., 1992). Finally, amino acid incorporation into proteins is rapid compared to the brain proteins' average half life of several days, and recycling of the labelled amino acids from protein breakdown can be neglected during the time of PET.
Plasma analysis
Our values of plasma [11C]methionine and [11C]-labelled proteins measured at 60 min are very close to those obtained in the plasma of patients with brain tumors (Sato et al., 1992; Ishiwata et al., 1989). These authors suggested that the fraction of labelled metabolites in plasma could vary considerably between subjects. Their percentage of plasma [11C]methionine and plasma labelled proteins varied between 16 and 72% and between 13 and 74%, respectively. Our standard deviations are quite lower (Table 1), and “standard” averaged values seem acceptable in our groups of subjects and for our study conditions.
[11C]Methionine distribution
Values of regional cerebral activity after [11C]methionine administration and regional to occipital ratios did not differ significantly between patients and controls. The main drawback of simple regional activity values is their dependence upon whole body distribution of the injected dose. The drawback of all ratio methods is that the measurement is impaired in the reference tissue itself.
Patlak-Gjedde analysis
Our control values of accumulation rate constant obtained with Patlak-Gjedde graphical evaluation are very close to those already published (Bergström et al., 1987). There is a trend for a decrease of the values in AD, but the difference between patients and controls do not reach significance. The main drawbacks of this analysis are the inclusion of cerebral blood volume in the rate constant and the difficulty in defining the portion of the curve to analyze.
[11C]Methionine distribution modelling
Mean transfer constants of [11C]methionine between plasma and cerebral precursor pool (k1 and k2) are lower in AD than in controls, but the tracer distribution volume is similar in both groups. The rate constant for incorporation of [11C]methionine from the precursor pool into proteins (k3) is significantly decreased in the right temporo-parietal cortex of AD only. This decrease, nevertheless, reflects a local reduction of protein synthesis. The rate constant for accumulation of plasma [11C]methionine into tissue (k1 × k3/k2 + k3) is (nonsignificantly) decreased in the temporo-parietal cortex more than in the frontal regions of our patients. Because we cannot estimate amino acid recycling, it is impossible to differentiate between decreased rates of labelled amino acid incorporation into proteins and increased rates of protein degradation (with dilution of the amino-acid precursor pool). However, cytoplasmic RNA content and nuclear and nucleolar volumes are reduced in AD (Tomlinson, 1984; Neary et al., 1986; Mann et al., 1988), and a decrease of protein synthesis is more likely than is an increase of protein breakdown. We will discuss this hypothesis further in the next paragraph. It is not possible to specify whether the small fast fraction is more or less affected than is the large slow bulk of brain proteins (Lajtha et al., 1981), but a decrease of enzymatic or structural protein synthesis corresponds, in any case, to neuronal loss and degeneration.
Bustany et al. (1985) reported an important decrease in protein synthesis rate in the frontal lobes of patients with senile AD. Their mean decrease was 15% in patients with mild dementia, and reached 65% when cognitive troubles were severe. In their figures, temporo-parietal cortices appeared to be less affected. We obviously studied a different population. In our younger patients with short disease duration, [11C]methionine accumulation rate constants showed a mean 15% reduction in the frontal cortex and a mean 20% reduction in the temporo-parietal. cortex. The maximal individual decrease was 37%. Overlapping of values may come from methodological limitations. Coefficients of variation reached 14–21%, which, although not bad for PET (Friedland et al., 1989; Jagust et al., 1991), might mask a physiologically significant change of [11C]methionine accumulation. Modelling [11C]methionine distribution with three compartments is clearly a simplification, but it is hardly possible to introduce more variables into the model. Finally, the relatively small size of regions of interest and correction of plasma activity for metabolites may introduce noise into data that affects estimates of k1, k2, and k3.
The main drawback is that PET measures only an apparent rate of accumulation of plasma [11C]methionine into proteins, because dilution of the amino-acid precursor pool is not taken into account. However, assuming a plasma concentration in methionine of 20 nmol/ml (O'Tuama et al., 1988; Clarke et al., 1989), we obtained apparent protein synthesis rates of 0.34 and 0.28 nM/min/ml in the temporo-parietal cortex of controls and AD, respectively. These values are in agreement with those reported in the literature (Bustany et al., 1985; Lestage et al., 1987).
Comparison of glucose metabolism and protein synthesis
A possible methodological problem when we compare measurements of glucose metabolism and protein synthesis in our patients is that we used two different control groups and two different methods of analysis—autoradiographic 18FDG studies versus kinetic analysis of labelled methionine distribution. The autoradiographic method also tends to underestimate glucose utilization in hypometabolic areas. However, comparison of our five controls with combined 18FDG and [11C]methionine studies to AD patients did not modify our results. On the other hand, previous studies with 18FDG showed a highly significant correlation between cerebral metabolic rates of glucose obtained with kinetic analysis and autoradiography in AD and controls (Fukuyama et al., 1989), and values calculated from dynamic acquisitions were significantly decreased in associative cortices of patients (Fukuyama et al., 1989; Jagust et al., 1991; Antonini et al., 1995). We can then rely on the very significant difference we obtained in our patients between paired percentage of decrease in glucose utilization, on the one hand, and in rate constants for [11C]methionine accumulation, on the other.
In contrast to glucose metabolism in the temporoparietal cortex, our indices of [11C]methionine brain accumulation did not correlate with severity of dementia. There was a single positive correlation in the temporo-parietal cortex between asymmetries of glucose metabolism, on the one hand, and those of cerebral activity after [11C]methionine administration, on the other, pointing to a very crude relationship between metabolic rates of glucose and rates of protein synthesis in those regions. However, there was also a negative correlation in the same regions between asymmetries of glucose consumption and those of k2 and k3 values. Higher apparent k2 and k3 values in areas with lower glucose metabolism might correspond to a lesser dilution of the precursor pool due to decreased protein breakdown. In other words, higher apparent rate constants in tracer kinetic analysis correspond, in fact, to a higher specific activity in the precursor pool, where free endogenous amino acid concentration is lowered. A simplified explanation for this negative correlation might be that there is an important decrease of functional activity in the temporo-parietal cortices and, to a lesser degree, a reduction of the number of neurons (with lower rates of global protein synthesis), while neurofibrillary tangles, as well as senile plaques, sequester structural proteins.
Conclusion
Our AD patients had a significant (45%) decrease of mean temporo-parietal glucose metabolism compared to that of healthy age-matched controls. Cortical accumulation rates of [11C]methionine were lower in AD than in controls, with a mean decrease of 20% in temporo-parietal regions; however, the majority of measurements were not significantly decreased.
We avoided the problem of regional macroscopic atrophy (Chawluk et al., 1987). Our data were obtained in the same population and with the same PET technique; partial volume effect should affect both 18FDG and [11C]methionine measurements similarly, because of similar spatial distribution. PET studies with [11C]methionine only provide an apparent protein synthesis rate. Dilution of the amino-acid precursor pool cannot be taken into account in the model. However, our data suggest that dilution of the precursor pool becomes less important in AD, because protein breakdown might be decreased.
We discussed methodological drawbacks in [11C]methionine analysis that could hamper the detection of significant decreases in most of our measurements of protein synthesis in AD. Alternately, neuropathological studies demonstrated a 27–52% decline in the ratio of neurons to glia in AD (Hansen et al., 1988). A relative increase of glial cells in associative cortices could mask the modifications in neuronal biochemical measurements. This was not the case, however, for 18FDG studies (McGeer et al., 1986). Neither is there evidence in the literature that protein synthesis of the glial population is increased in AD or might counterbalance the decrease of mean amino-acid accumulation related to neuronal loss. The differential incorporation of amino-acids into neurons or glia is a matter of discussion, but neurons seem to synthesize proteins at a higher rate than do glial cells (Hamberger et al., 1971; Hamberger and Sourander, 1978; Reisertl et al., 1979; Shahbazian et al., 1986). Although there is a prominent increase in fibrous astrocytes in AD, they can derive by transformation from protoplasmic astrocytes (Schechter et al., 1981). Effectively, modification of the entire population of glial cells is highly variable in AD. While there is a significant 26–36% decrease in all neurons, glial cells are either decreased (12%) in the superior temporal cortex or nonsignificantly increased (54%) in the inferior parietal cortex (Hansen et al., 1988). Finally, when specific changes of mRNA pool size are studied, there is a global decrease of 18S ribosomal RNA in AD. There is no significant change of glial fibrillary acid protein or neurofilament associated tau protein mRNA pool sizes in the neocortex of AD compared to controls, while the concentration of some neuron-specific mRNA shows the greatest reduction (Lukiw et al., 1991).
Thus, admitting that the decrease of cortical accumulation rates of [11C]methionine reflects mainly neuronal loss and reduction of cytoplasmic RNA content (Lajtha, 1993; Mann et al., 1988; Neary et al., 1986), our in vivo data show that tissue loss is not sufficient to explain the cortical glucose hypo-metabolism in AD. Neuronal protein synthesis is restricted to the perikarion, and peripheral transport can hardly be important for the PET study time (Hammersschlag and Brady, 1989). Markers of neuronal membranes are preferentially decreased in AD in comparison to decreases in DNA and RNA levels (DeKosky and Bass, 1982). Neurohistochemical studies of glucose transport and pyruvate dehydrogenase in rat suggest that anaerobic glucose degradation occurs mostly in neuropil (dendrites and axons), while aerobic oxygen metabolism is localized to neuronal perikaria (Bagley et al., 1989; Dick and Harik, 1986). Our data, together with these observations, favor the hypothesis that decrease of synaptic connectivity (Flood and Coleman, 1986; Davies et al., 1987) is more important than neuronal loss in accounting for reduction of cortical glucose utilization.
Footnotes
Acknowledgment:
We thank the Department of Neurology and the Cyclotron Research Center staffs for assistance. R. Czichosz performed plasma analysis. E. Salmon was Senior Research Assistant at the Belgian National Fund for Scientific Research. The program was supported by the Belgian Queen Elizabeth Medical Foundation and by a grant given to G. Franck by the Belgian National Fund for Scientific Research (FRSM 3454293). The authors thank P. Bobillier and A. Lajtha for their valuable comments.