
Abstract
This study was undertaken to test whether transient depolarizations occurring in periinfarct regions are important in contributing to infarct spread and maturation. Following middle cerebral artery (MCA) occlusion we stimulated the ischemic penumbra with recurrent waves of spreading depression (SD) and correlated the histopathological changes with the electrophysiological recordings. Halothane-anesthetized, artificially ventilated Sprague–Dawley rats underwent repetitive stimulation of SD in intact brain (Group 1; n = 8) or photothrombotic MCA occlusion coupled with ipsilateral common carotid artery occlusion (Groups 2 and 3, n = 9 each). The electroencephalogram and direct current (DC) potential were recorded for 3 h in the parietal cortex, which represented the periinfarct border zone in ischemic rats. In Group 2, only spontaneously occurring negative DC shifts occurred; in Group 3, the (nonischemic) frontal pole of the ischemic hemisphere was electrically stimulated to increase the frequency of periinfarct DC shifts. Animals underwent perfusion-fixation 24 h later, and volumes of complete infarction and scattered neuronal injury (“incomplete infarction”) were assessed on stained coronal sections by quantitative planimetry. Electrical induction of SD in Group 1 did not cause morphological injury. During the initial 3 h following MCA occlusion, the number of spontaneous periinfarct depolarizations in Group 2 (7.0 ±1.5 DC shifts) was doubled in Group 3 by frontal current application (13.4 ± 2.7 DC shifts; p < 0.001). The duration as well as the integrated negative amplitude of DC shifts over time were significantly greater in Group 3 than in Group 2 rats (duration, 5.7 ± 3.8 vs. 4.1 ± 2.5 min; p < 0.05). Histopathological examination disclosed well-defined areas of pannecrosis surrounded by a cortical rim exhibiting selectively damaged acidophilic neurons and astrocytic swelling in otherwise normal-appearing brain. Induction of SD in the ischemic hemisphere led to a significant increase in the volume of incomplete infarction (19.0 ± 6.1 mm3 in Group 3 vs. 10.3 ± 5.1 mm3 in Group 2; p < 0.01) and of total ischemic injury (100.7 ± 41.0 mm3 in Group 3 vs. 66.5 ± 24.7 mm3 in Group 2; p < 0.05). The integrated magnitude of DC negativity per experiment correlated significantly with the volume of total ischemic injury (r = 0.780, p < 0.0001). Thus, induction of SD in the ischemic hemisphere accentuated the development of scattered neuronal injury and increased the volume of total ischemic injury. This observation may be explained by the fact that, with limited perfusion reserve, periinfarct depolarizations are associated with episodic energy failure in the acute ischemic penumbra.
Keywords
The phenomenon of undulating changes in the extracellular potassium concentration occurring in the border zone of evolving brain infarcts was first described by Branston and co-workers in 1977. This observation was later confirmed by potassium ion activity measurements (Strong et al., 1983a) and direct current (DC) potential recordings (Nedergaard and Astrup, 1986), which demonstrated that these transients of potassium ion activity were due to transient depolarizations similar to spreading depression (SD). In a previous study, periinfarct depolarizations were compared with potassium chloride-evoked SD and distinct differences in the electrophysiological behavior, hemodynamic responses, and pattern of tissue oxygenation were described: periinfarct depolarizations were not accompanied by a brief phase of hyperperfusion as in normal SD; there was a paradoxical decrease in tissue oxygenation leading to repeated episodes of hypoxia during periinfarct DC shifts; and repolarization was significantly delayed following periinfarct depolarizations (Back et al., 1994a).
It is known that SD induced in healthy tissue, or recorded in cortical regions distant from an evolving infarct, is accompanied by a marked increase in regional cerebral blood flow (CBF) (Hansen et al., 1980; Dietrich et al., 1994), by a steep increase in glucose utilization (Shinohara et al., 1979), by increased oxygen consumption (Mayevsky and Weiss, 1991), and by a decrease in ATP content and tissue acidosis (Mies and Paschen, 1984; Csiba et al., 1985). The propagation of SD waves is a glutamate-mediated process (Marrannes et al., 1988), and interstitial microdialysis shows a transient increase in excitotoxic neurotransmitters during SD (Fabricius et al., 1993). Regarding the sum of energy-consuming and potentially excitotoxic metabolic events accompanying SD, the question arises whether the ischemic penumbra surrounding the infarct core is able to cope with this energy/metabolic load in a situation of constrained substrate and oxygen transport. In intact brain, repetitive generation of SD does not cause neuronal injury (Nedergaard and Hansen, 1988). However, in moderately ischemic brain as is present in the ischemic penumbra, periinfarct depolarizations may be harmful.
In the setting of experimental focal ischemia, treatment with the N-methyl-
Following induction of focal ischemia, two types of histopathological injury have been described: overt infarction, in which all tissue compartments undergo necrosis due to the severe degree of CBF reduction; and selective neuronal injury, which occurs primarily in the periinfarct zone (Nedergaard, 1987; Markgraf et al., 1993; Strong et al., 1983b). The latter type of injury has been attributed to the condition of the ischemic penumbra—an area with abolished synaptic transmission but intact ionic gradients (Nedergaard, 1988).
Recent nuclear magnetic resonance (NMR) and positron emission tomography (PET) investigations allowing repetitive studies in experimental stroke have shown that the ischemic penumbra (or its assumed imaging correlate) is a highly dynamic structure that may slowly migrate toward the periphery of the ischemic lesion during the initial hours of vascular occlusion (Heiss et al., 1994; Kohno et al., 1995). To test whether periinfarct depolarizations are an important factor contributing to the pathogenesis of infarct spread and maturation, we stimulated the infarcted hemisphere of focally ischemic rats by repeated SD and evaluated the histopathological outcome with regard to the volumes of complete infarction and scattered neuronal injury (incomplete infarction).
MATERIALS AND METHODS
General preparation and experimental groups
The experiments were performed on 30 male Sprague–Dawley rats, weighing 270–480 g. In Group 1, cortical SD was repetitively evoked by application of an epidural current to the frontal pole of intact (control) rats (n = 8). Animals in Groups 2 and 3 underwent photothrombotic middle cerebral artery (MCA) occlusion coupled with permanent ipsilateral common carotid artery (CCA) occlusion (n = 9 each). In both groups, electroencephalogram (EEG) and DC potential were measured in the ischemic penumbra for 3 h following the onset of vascular occlusion. In Group 2, only spontaneously occurring negative DC deflections were recorded. In Group 3, the frontal pole of the ischemic hemisphere was electrically stimulated to double the number of total DC potential shifts during the first 3 h following MCA/CCA occlusion. Eighteen rats were assigned to Groups 2 and 3 in a randomized fashion. Four additional rats served as sham-operated controls (Group 4). All brains were studied by light-microscopic histopathology following 1-day survival, except for Group 1 animals, which survived 3 days to exclude the occurrence of delayed neuronal injury in these brains.
After 12 h of food deprivation, anesthesia was induced with 3% halothane and continued with 1.5% halothane in a 70:30 gas mixture of nitrous oxide and oxygen delivered via a face mask. The right femoral vessels were cannulated with PE-50 tubing for continuous blood pressure recording, to obtain arterial samples for blood gas analysis, and to administer drugs. Rectal and temporal muscle temperature were feedback-controlled by two heating lamps placed above the animal's body and head, and maintained at 37.1 ± 0.1 and 36.4 ± 0.2°C (means ± SD), respectively. The rats were endotracheally intubated, paralyzed with pancuronium bromide (0.3 mg/kg), and artificially ventilated at a rate of 50 breaths/min. Blood gases were repeatedly analyzed and appropriate ventilatory adjustments were carried out as needed to maintain normal physiological conditions. In addition, plasma glucose was determined. The halothane concentration was reduced to 0.75%, and the animal's head was mounted in a stereotaxic frame. This halothane concentration was maintained throughout the experiment and has been shown not to influence the electrical threshold for triggering SD in rats or to affect NMDA receptor-mediated neurotransmission (Verhaegen et al., 1992).
SD experiments and electrophysiology
In rats of Group 1, a midline incision was made to expose the skull. A right-sided trepanation was drilled (spanning 1.5–4 mm lateral to the midline and 1 mm posterior to 4.5 mm anterior to the bregma). Care was taken to keep the dura intact. Two miniature calomel electrodes were placed, one on the exposed right dura at bregma level, and the other on the contralateral skull. The connection between tissue and electrode was established by a saline-rinsed cotton wick. The animals were grounded by a silver-filled steel needle inserted into the neck skin. The signal was transduced to a differential amplifier (Model BMA-931; CWE Inc., Ardmore, PA, U.S.A.) and was displayed as an electrocorticogram (EEG) and DC potential on a chart recorder (TA5000, Gould Inc., Valley View, OH, U.S.A.). An insulated Ag/AgCl electrode was placed on the dura 3.5 to 4 mm anterior to the bregma for electrical stimulation of SD. Cathodal currents of 8 ± 3 mA and 3- to 6-s duration were applied according to the strength-duration properties for eliciting SD in rat cerebral cortex (Reid et al., 1987). Over a 3-h period of observation, 5–11 waves of SD were electrically induced per animal.
MCA occlusion experiments
In the experimental Groups 2 and 3, the ipsilateral CCA was exposed by a ventral midline incision in the neck, dissected free, and surrounded by a loop of PE-10 tubing contained within a 20-mm segment of bilumen Silastic tubing. Skull preparation for the recording of electrophysiology and placement of the stimulation electrode were identical to the procedure in Group 1 animals. The right calomel electrode was located in the ischemic penumbra, as discerned from previous autoradiographic blood flow studies (Back et al., 1995). The subsequent preparation for photothrombotic distal MCA occlusion was performed as described previously (Markgraf et al., 1993; Back et al., 1995).
In brief, the midline scalp incision was extended between the right eye and the right ear in an L-shaped fashion. The zygomatic and squamosal bones were exposed by separation and retraction of the temporalis muscle. A burr hole, ∼3 mm in diameter, was made rostral to the anterior junction of the zygomatic and squamosal bones, leaving the dura intact. In this manner, the distal segment of the right MCA was exposed above the rhinal fissure and was irradiated at 562 nm with an argon laser-activated dye laser for 3.5 min as described previously (Markgraf et al., 1993; Back et al., 1995) following the injection of the photosensitizing dye rose bengal (15 mg/ml; 1.34 ml/kg body weight, i.v.). Complete MCA occlusion was verified by microscopic observation. Five minutes following MCA irradiation, the snare ligature around the right CCA was tightened for tandem CCA occlusion. Sham experiments of Group 4 were performed surgically in an identical manner and included MCA laser irradiation but not rose bengal injection or CCA ligation.
Both EEG and DC potentials were measured before, during, and for 3 h after MCA/CCA occlusion. The initial postischemic DC deflection occurred within 3 min following the onset of laser irradiation (i.e., before vascular occlusion was completed) and very probably was caused by the photoactivation of rose bengal as described for the isolated retina preparation (Netto and Martins-Ferreira, 1989). In Group 2, the spontaneously occurring DC potential transients were measured, with the stimulation electrode placed as described for animals in Group 3. In Group 3, cathodal stimulation currents were applied every 20 min following MCA occlusion in the same manner as described for the SD experiments; i.e., nine SDs were induced over a 3-h observation time.
Histopathology and morphological evaluation
The animals in Group 1 (n = 8) underwent perfusion fixation of the brain on day 3 to confirm the absence of acute or delayed neuronal injury following recurrent SD generation, as has been reported previously by Nedergaard and Hansen (1988). For technical reasons, histology was obtained in only five of eight rats. In animals in Groups 2, 3, and 4, perfusion-fixation of the brain was carried out 24 h following MCA/CCA occlusion. After induction of deep anesthesia with 4% halothane in a mixture of oxygen and nitrous oxide for 10 min, the ascending aorta was cannulated via the left ventricle and the right atrium was incised. Physiological saline solution was infused at a pressure of 120 mm Hg for 2 min, followed by infusion of a mixture of 40% formaldehyde, glacial acetic acid, and methanol (1:1:8, by volume) for 20 min. The brains were carefully removed, paraffin-embedded, and sectioned coronally at 10 μm. These sections were stained with hematoxylin and eosin and were evaluated at nine standardized coronal levels, ranging from bregma −7.5 mm to bregma +5.2 mm. Overt infarction as well as foci of scattered neuronal injury (i.e., eosinophilic cytoplasm and condensed nuclei of selected neurons but with grossly preserved neuropil) were assessed at nine selected coronal levels by quantitative planimetry. The investigator (W.D.D.) was blinded to the experimental group during histological evaluation. The volumes of complete infarction and of total ischemic injury were computed by numeric integration of sequential affected areas. As an integration algorithm was used that is valid for confluent areas, the volume of incomplete infarction (selective neuronal necrosis) was derived by subtraction of the volume of overt infarction from the volume of total ischemic injury.
Data analysis and statistics
Values are given as means ± standard deviation. Differences between experimental groups were tested by analysis of variance (ANOVA) and Student's t test. Repeated-measures ANOVA followed by Tukey's test was used to evaluate the electrophysiological data for time-dependent alterations of the DC potential shifts, p < 0.05 was accepted as significant, unless otherwise stated. DC potential tracings were analyzed by computed area integration with respect to the areas of negative DC amplitude excursion during SD and of periinfarct DC deflections (in Vs).
RESULTS
Physiological variables
Physiological variables were kept in the normal range in all experimental groups (Table 1). Measurements of mean arterial blood pressure were compared at three time points: 5 min before, and 0.5 h and 3 h after MCA occlusion (Groups 2–4). Within the experimental groups, no significant changes in blood pressure were seen over the course of the experiments. Thus, in Table 1, mean blood pressure data were pooled. No significant differences were detected among the experimental groups.
Physiological variables
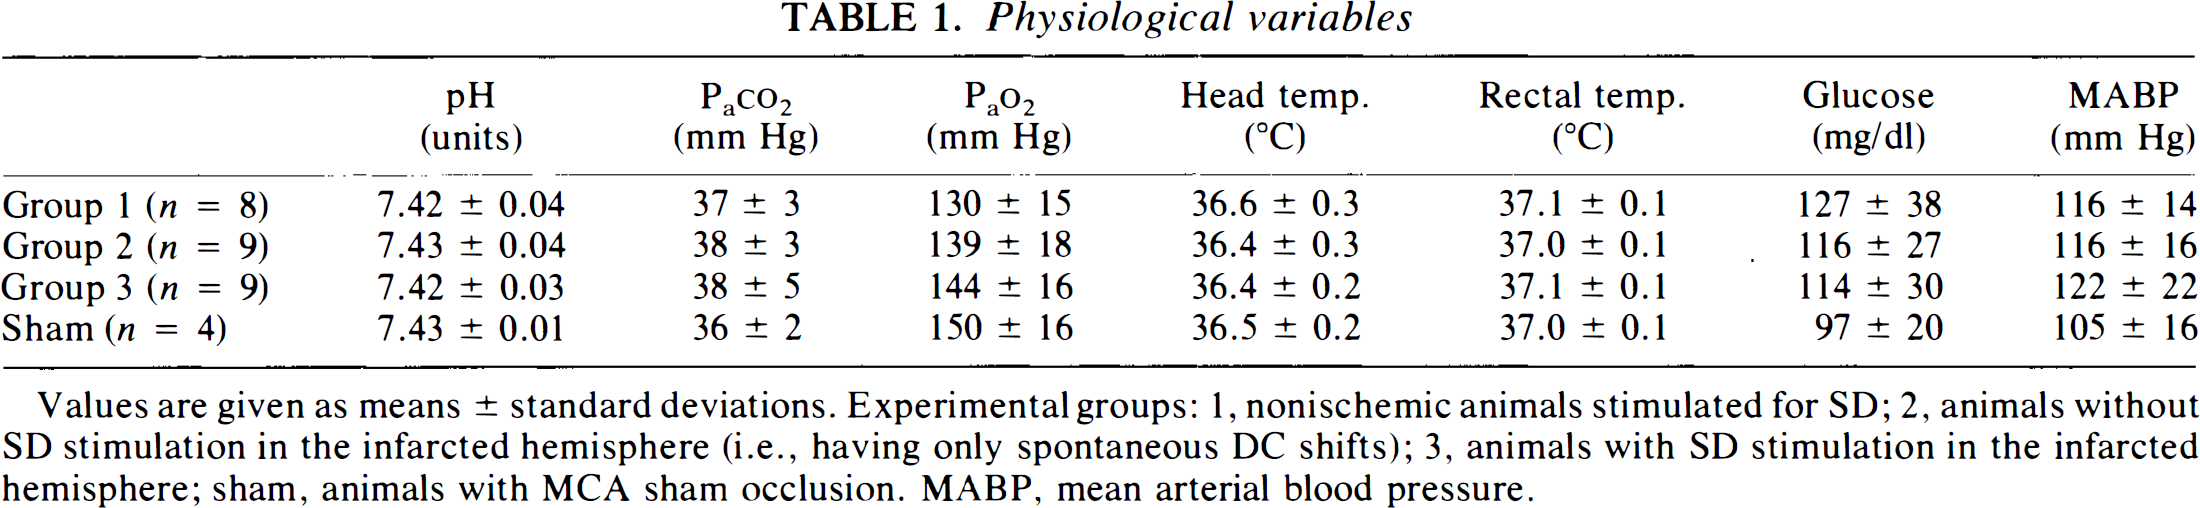
Values are given as means ± standard deviations. Experimental groups: 1, nonischemic animals stimulated for SD; 2, animals without SD stimulation in the infarcted hemisphere (i.e., having only spontaneous DC shifts); 3, animals with SD stimulation in the infarcted hemisphere; sham, animals with MCA sham occlusion. MABP, mean arterial blood pressure.
Electrophysiological measurements
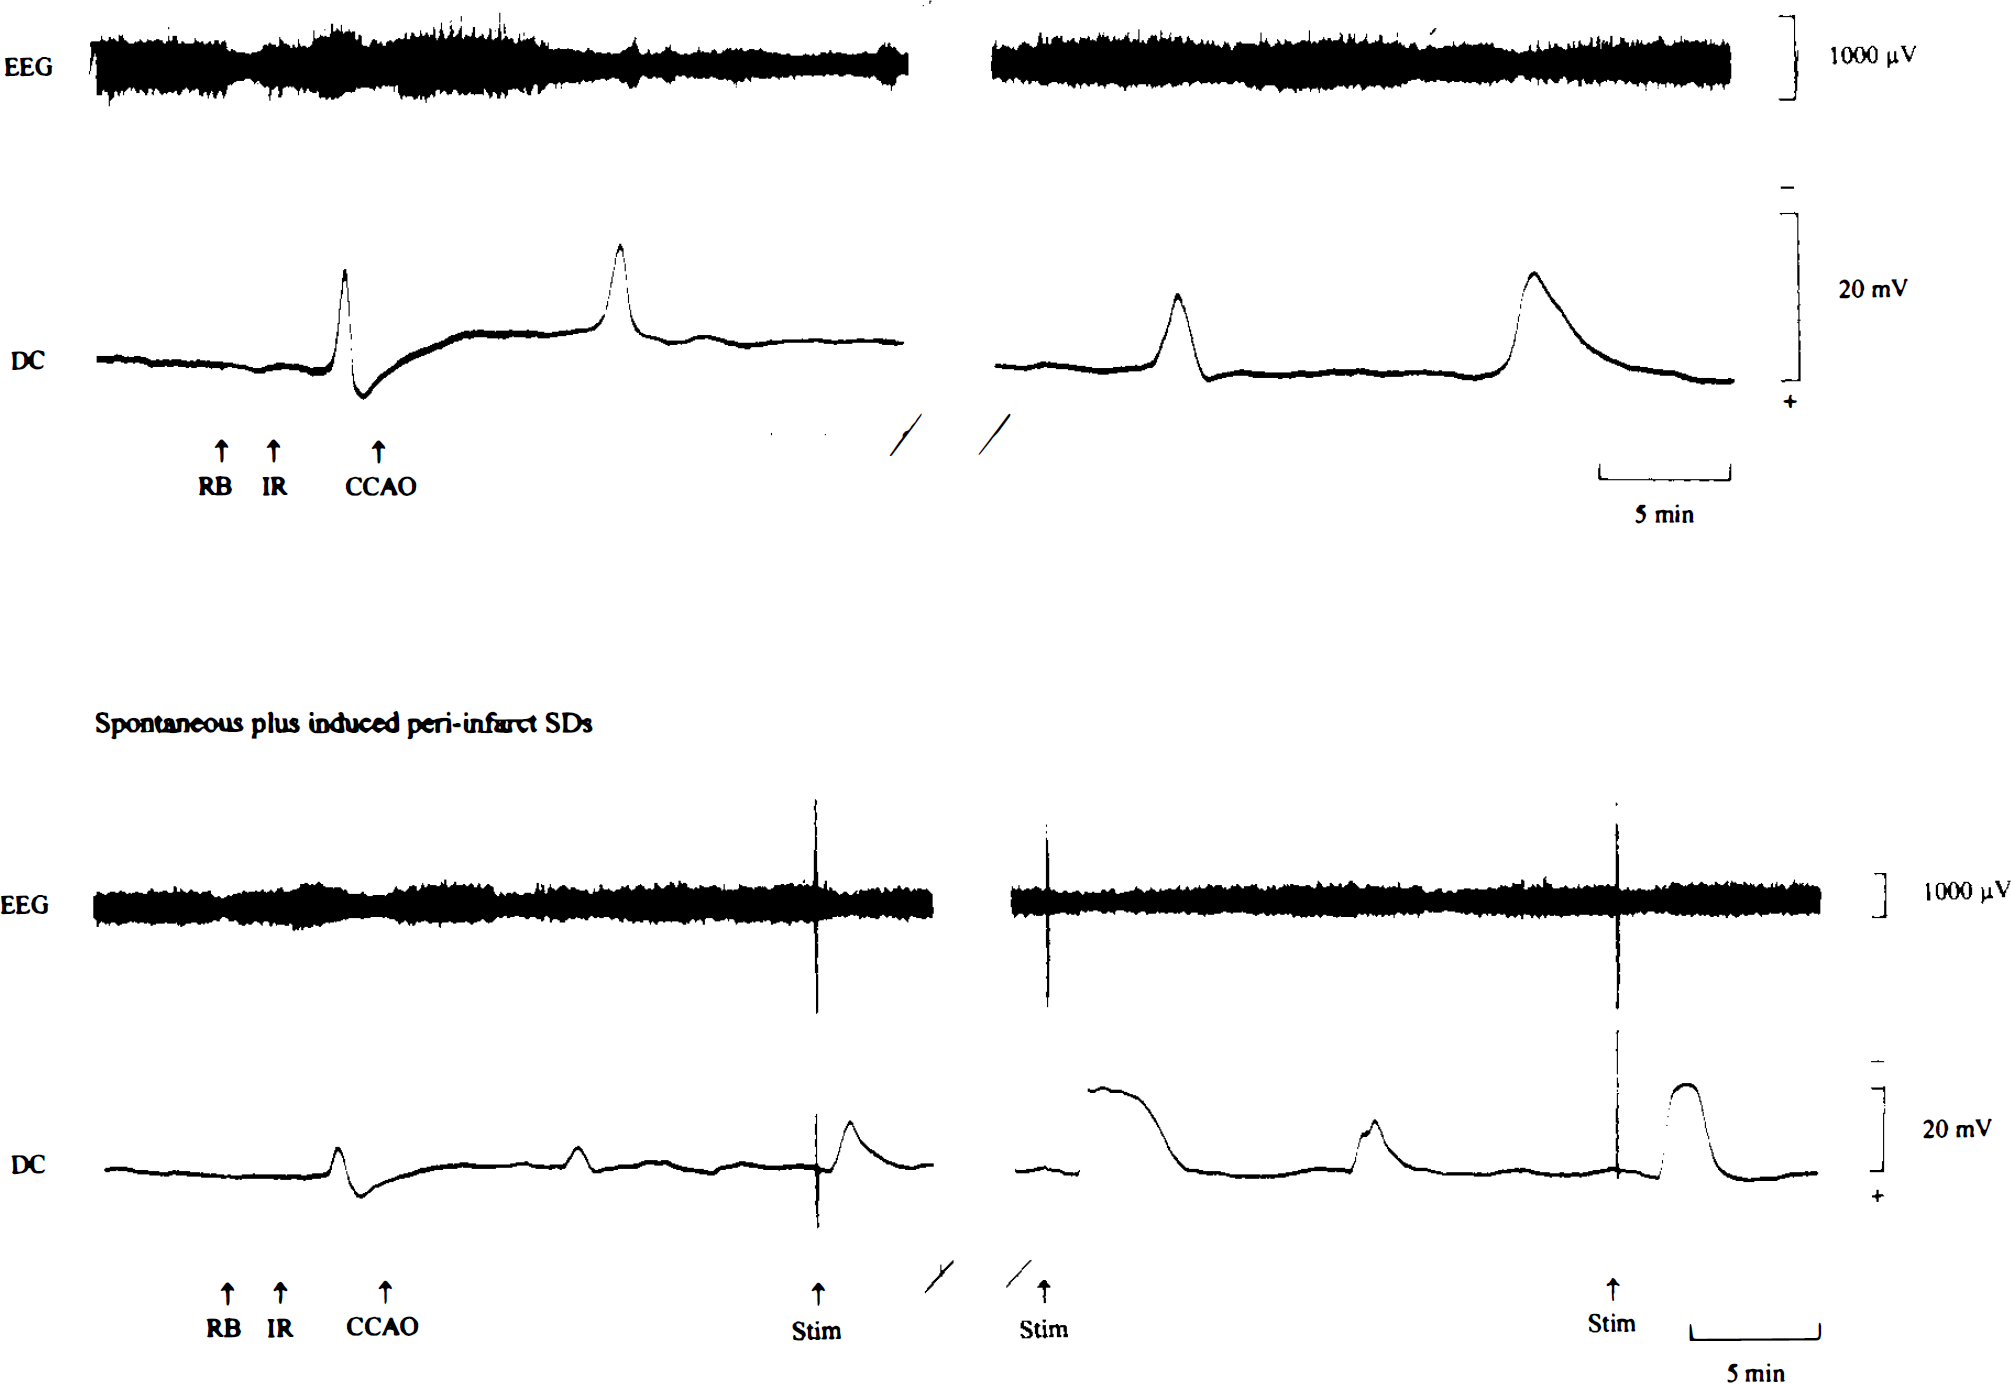
The characteristics of the negative DC deflections measured in Groups 1, to 3 are shown in Table 2. Sixty-six waves of SD (5–11 SDs per experiment) were induced in control animals in Group 1. Cathodal currents of 8 ± 3 m A (range, 4–10 mA) were applied for 3–6 s to evoke SD reproducibly. Negative excursion of the DC potential lasted for 1.7 ± 0.5 min and was accompanied by a gross reduction in EEG amplitude, which recovered completely following normalization of the DC potential (Fig. 1). In the ischemic animals in Groups 2 and 3, the initial depolarization was observed 1.8 ± 0.5 min following the onset of laser irradiation (Fig. 2, top). In the majority of animals, vascular occlusion was accompanied by a permanent reduction in EEG amplitude, but in some animals slow high-amplitude waves occurred postocclusion or in the recovery phase following DC transients. The occurrence of transient depolarizations caused a further decline in EEG amplitude, which did not recover as quickly as observed in Group 1 following SD. In Group 2 (n = 9), a total of 63 spontaneous periinfarct DC deflections were recorded in the penumbra of the evolving infarcts (Fig. 2). The duration of these depolarizations was ∼2.5 times longer than that of SDs in Group 1 (p < 0.05) (Table 2). In animals in Group 3 (n = 9), the number of periinfarct DC shifts was doubled compared to that in Group 2 by electrical stimulation of the frontal pole (spontaneous plus induced DC shifts: n = 121) (Fig. 2, bottom). In this group, spontaneously occurring DC transients did not differ from electrically induced ones with regard to their electrophysiological properties: the durations were 6.1 ± 4.0 min (spontaneous DC shifts) and 5.1 ± 3.5 min (induced DC shifts); the amplitudes were 10.8 ± 6.7 mV for spontaneous DC shifts versus 10.3 ± 5.7 mV for evoked DC shifts (p > 0.05 for both parameters). Therefore, the data on induced and spontaneous DC transients were pooled in Group 3. The frequency distribution of DC transients in Groups 2 and 3 is shown in Fig. 3. There was no significant change in the electrophysiological behavior of DC potential shifts over time. The duration of DC shifts as well as the cumulative DC negativity per experiment (integrated over a 3-h period of time following MCA occlusion/induction of SD) was significantly greater in Group 3 animals in comparison to corresponding values for Groups 1 and 2 (p < 0.01) (Table 2).
Characteristics of DC potential shifts
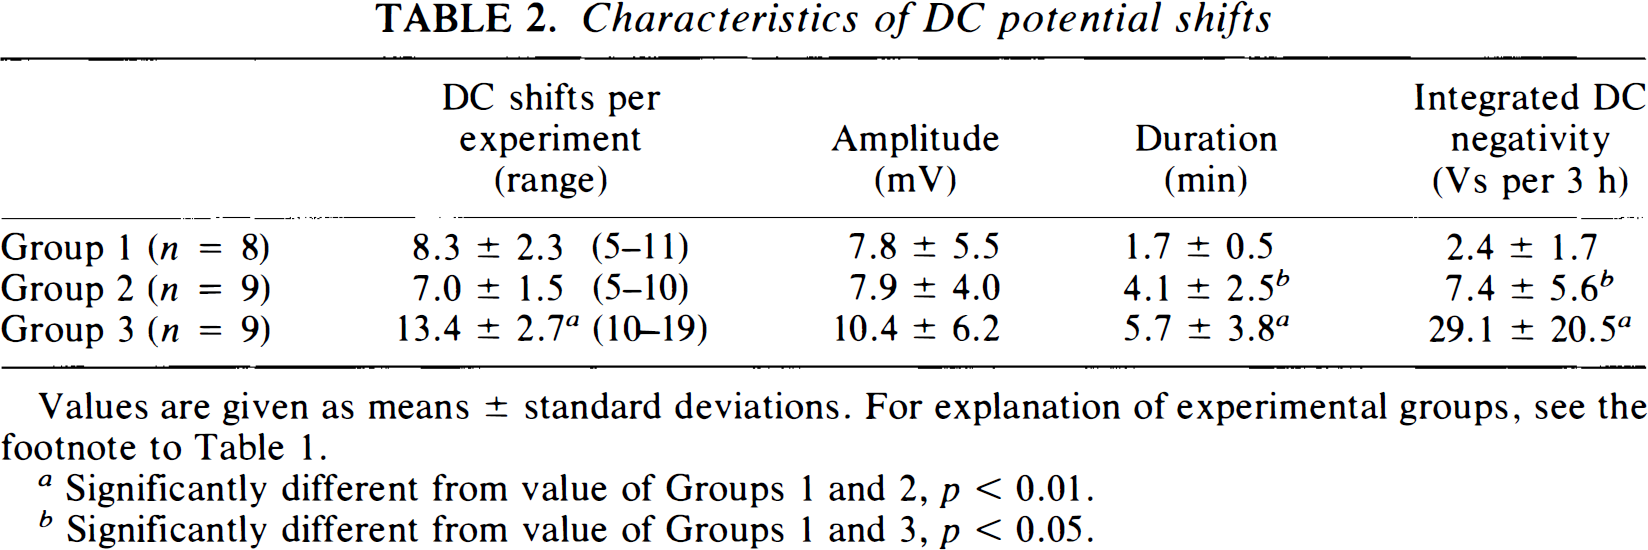
Values are given as means ± standard deviations. For explanation of experimental groups, see the footnote to Table 1.
Significantly different from value of Groups 1 and 2, p < 0.01.
Significantly different from value of Groups 1 and 3, p < 0.05.
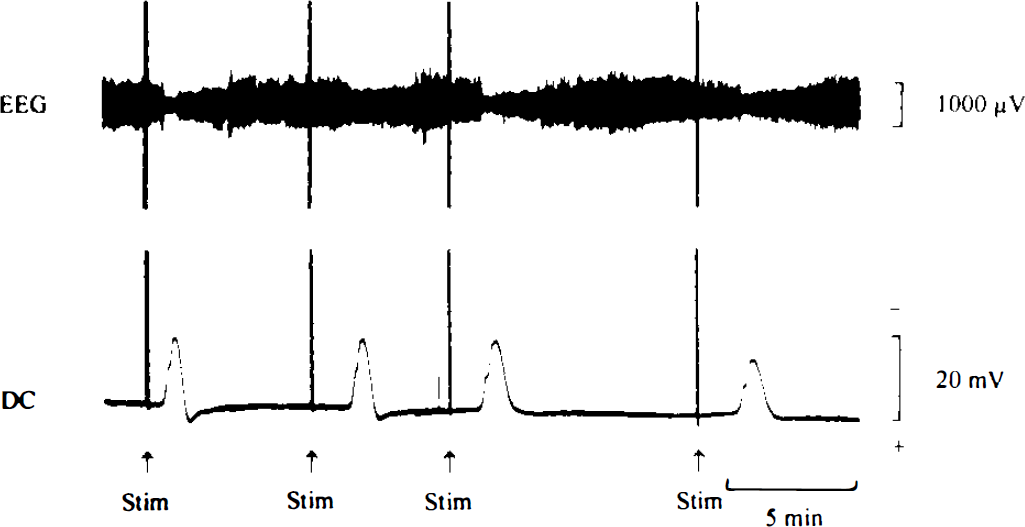
Electrophysiological recording of cortical EEG
Typical recordings of EEG and DC potential are shown for an animal with spontaneously occurring periinfarct DC shifts
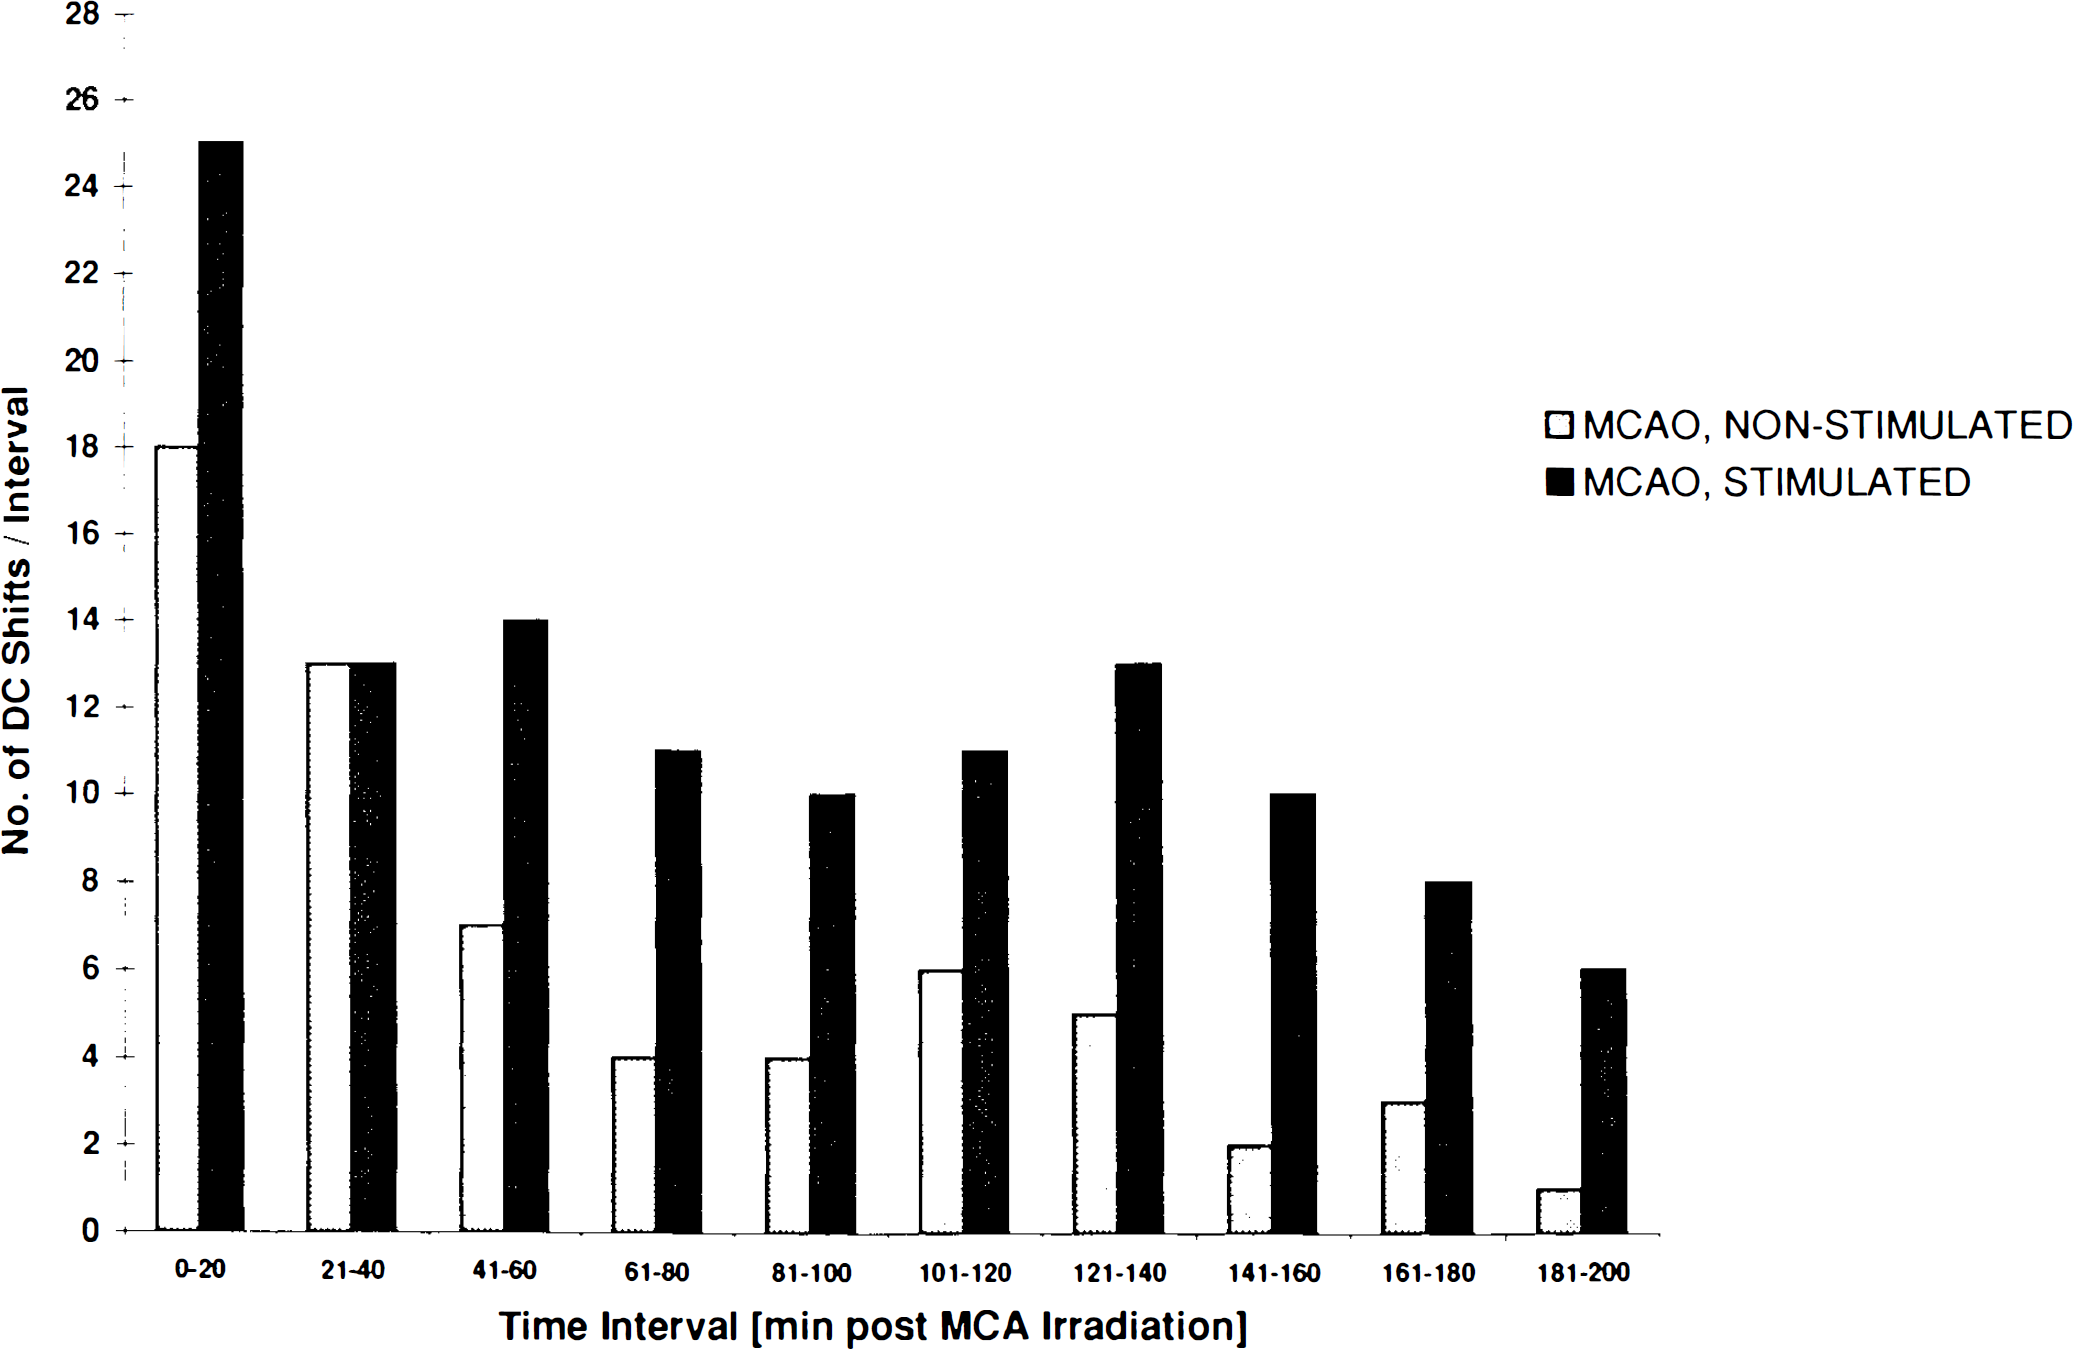
Bar graph showing the frequency distribution of periinfarct DC shifts following tandem occlusion of the MCA and CCA in animals in Group 2 (nonstimulated) and Group 3 (stimulated). Data were pooled in 20-min intervals. Note the more uniform increase in DC shift frequency over time in stimulated animals compared to the spontaneous experimental course.
Histological evaluation
Combined occlusion of the MCA and the ipsilateral CCA caused a consistent infarct pattern as visualized 24 h following vascular occlusion, involving large parts of the frontoparietal/temporal cortex between bregma coordinates −7.5 mm and +5.2 mm (Fig. 4). As seen in coronal sections, the zone of dense ischemia leading to pannecrosis was surrounded at the parietal and temporal (and, very rarely, striatal) border zone by a rim of neurons exhibiting eosinophilic cytoplasm and condensed nuclei as an indicator of selective neuronal cell loss. Typical histopathological examples of Groups 2 and 3 are shown in Fig. 4a and b. Microscopic examination of the border zone areas revealed condensed nuclei in selected neurons accompanied by perineuronal and astrocytic swelling, as shown in Fig. 4c and d. Scattered neuronal injury was not necessarily present in all cortical layers. The histopathological pattern of scattered injury and glial swelling was more severe and affected significantly larger zones in stimulated animals than in nonstimulated ones. Small circumscribed foci of ischemic damage suggestive of arterial embolism were detected in both groups that underwent focal ischemia (19 small, well-demarcated infarcts in Group 2, and 22 circumscribed defects in Group 3 animals; Fig. 4e). In one case, a platelet thrombus could be detected in the lumen of a pial artery (Fig. 4f). Both observations, the occurrence of lacunar damage and the presence of intraluminal thrombi, demonstrate that in the present model downstream embolism of small platelet aggregates does occur during the irradiation period before the occlusion becomes complete. In addition to neocortical infarction, two of nine animals showed morphological changes in the striatum in Group 2, and four of nine rats in Group 3. Except in one case, striatal damage presented as scattered neuronal injury. No areas of ischemic damage were observed in the contralateral cerebral hemisphere.
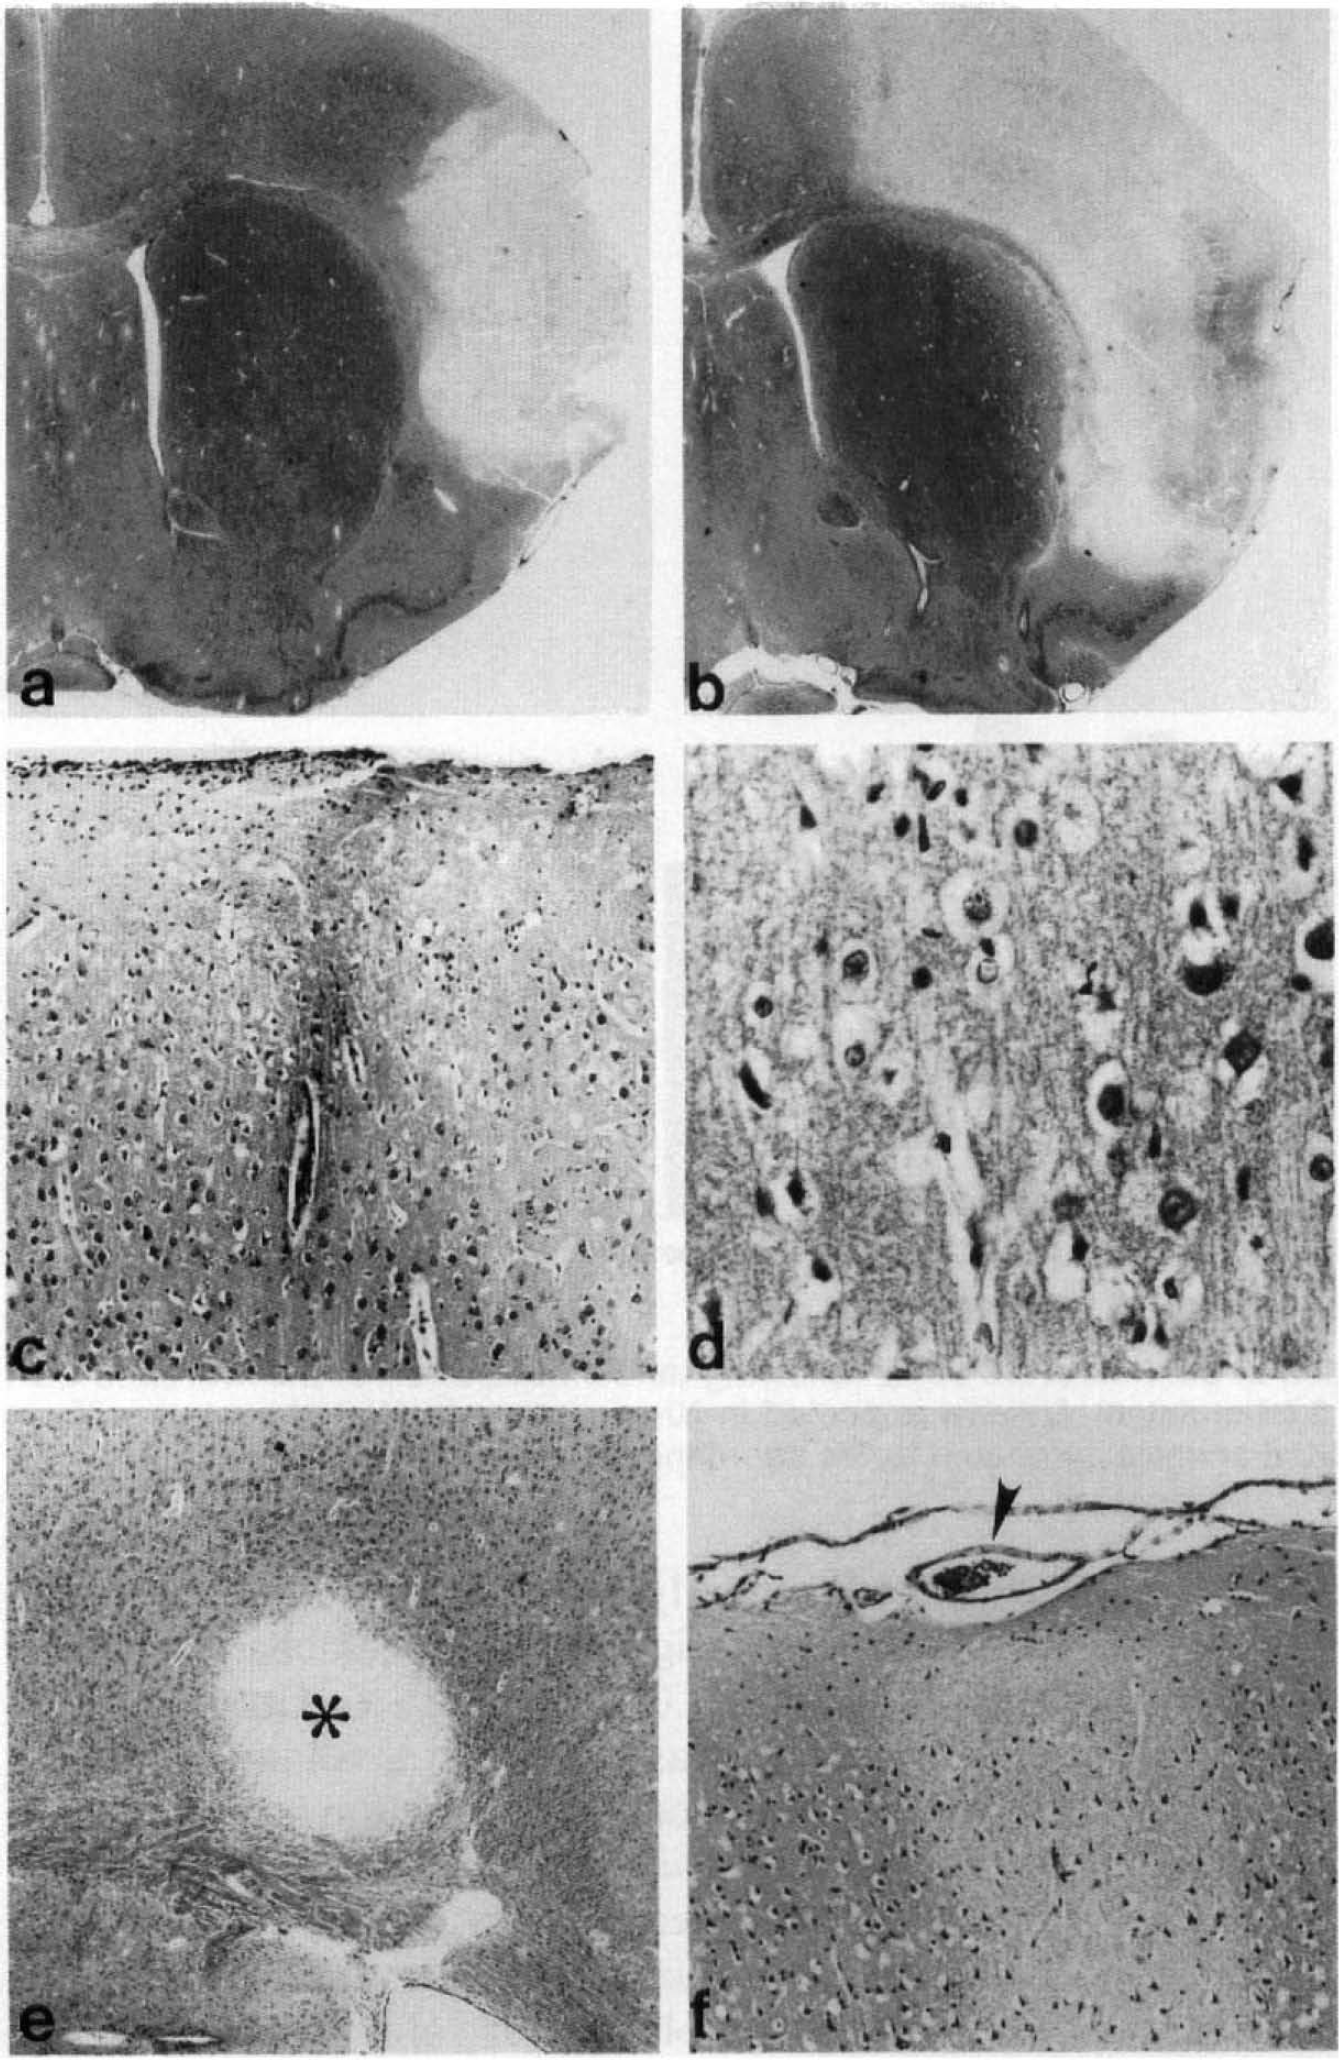
Paraffin-embedded brain sections stained with hematoxylin and eosin 24 h after combined MCA and CCA occlusions, a: A representative cortical infarct is shown in an unstimulated rat (original magnification, ×27). b: A large cortical infarct is present in a rat in which episodes of cortical SD were induced in the frontal pole of the affected hemisphere (×27). c: Noninfarcted cortical forelimb region from a stimulated rat, showing selective neuronal injury (×270). d: Higher magnification of the forelimb region from a stimulated rat, showing perineuronal and astrocytic swelling (×1,070). e: A well-demarcated embolic infarct is present within layer 6 of the cortical forelimb region (×110). f: A pial arteriole contains thrombotic material consisting predominantly of platelets (×270).
Brains in Group 1 did not show areas of complete ischemic damage. In three of five animals, the cortex directly underlying the site of electrical stimulation exhibited slight ischemic cell changes affecting a volume of 1.0 ± 0.9 mm3. In Group 2, complete infarction was present in a volume of 56.2 ± 20.3 mm3, and incomplete infarction (scattered neuronal injury) was visible within 10.3 ± 5.1 mm3 (total volume of ischemic injury, 66.5 ± 24.7 mm3). In comparison, Group 3 animals exhibited significantly greater volumes of total ischemic injury (100.7 ± 41.0 mm3; p < 0.05) and of incomplete infarction (19.0 ± 6.1 mm3; p < 0.01). At the coronal levels of morphological evaluation, significant intergroup differences for both total ischemic injury and incomplete infarction were detected in four coronal planes (+2.7, +1.2, −0.3, and −1.3 mm to the bregma) located in the center of the infarcts (p < 0.05) (Figs. 5 and 6). The volume of complete infarction was 81.8 ± 39.2 mm3 in Group 3 and was not significantly different from that in Group 2. In sham animals, no morphological abnormalities were observed.
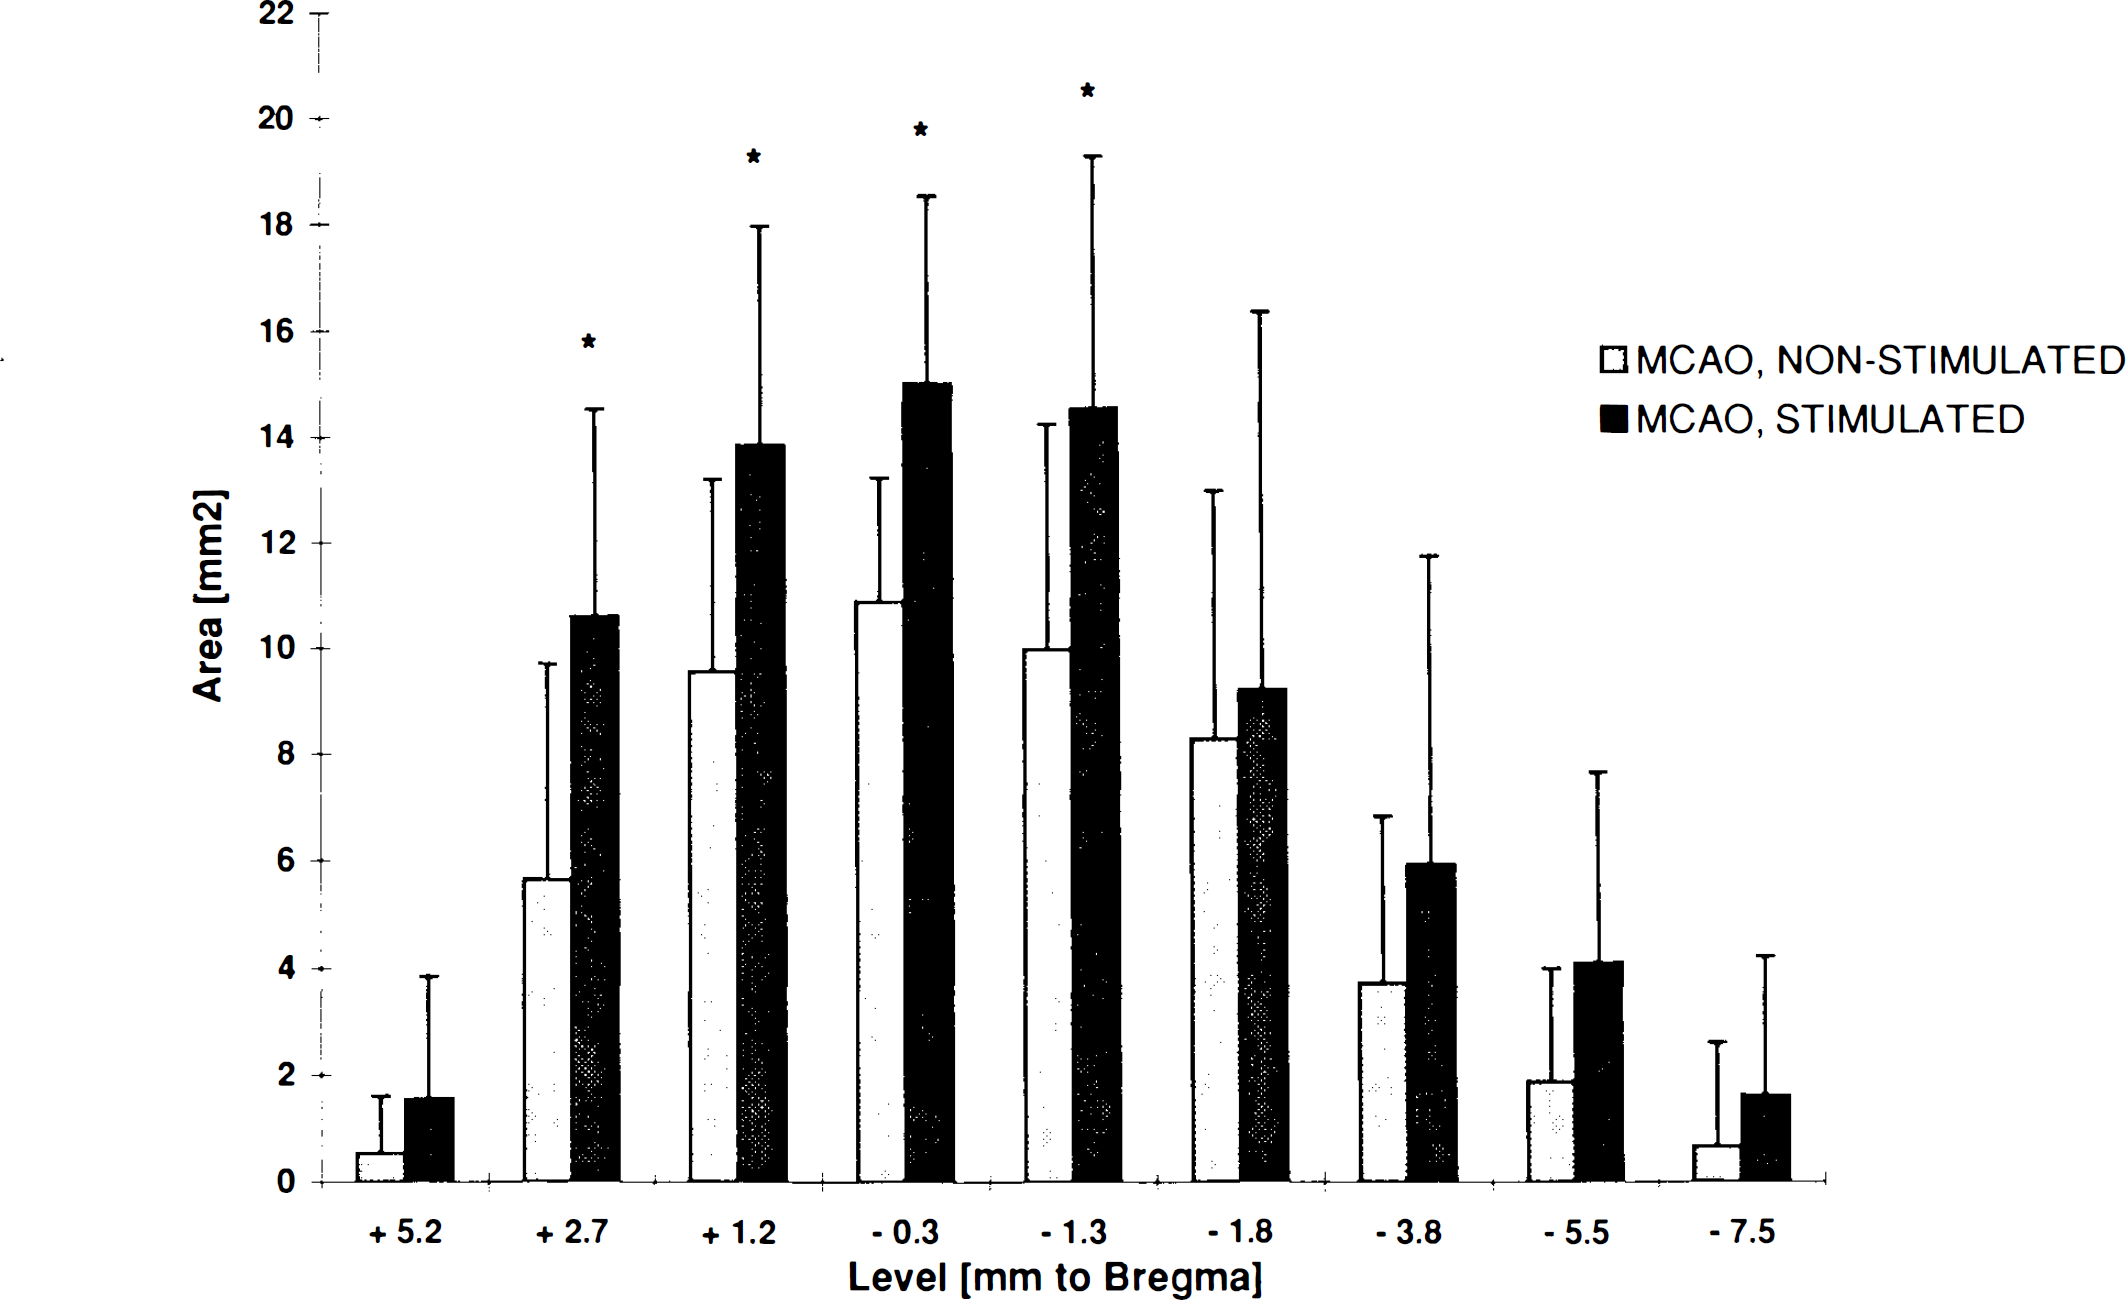
Area of total ischemic injury (complete and incomplete infarction) in mm2 for each of the nine standardized coronal levels following combined occlusion of the MCA and the CCA. Light shaded bars: Unstimulated ischemic rats in Group 2 with spontaneous periinfarct DC shifts. Dark shaded bars: Ischemic rats in Group 3 with stimulation of SD in the ischemic hemisphere. Significant differences between groups are marked by asterisks (p < 0.05).
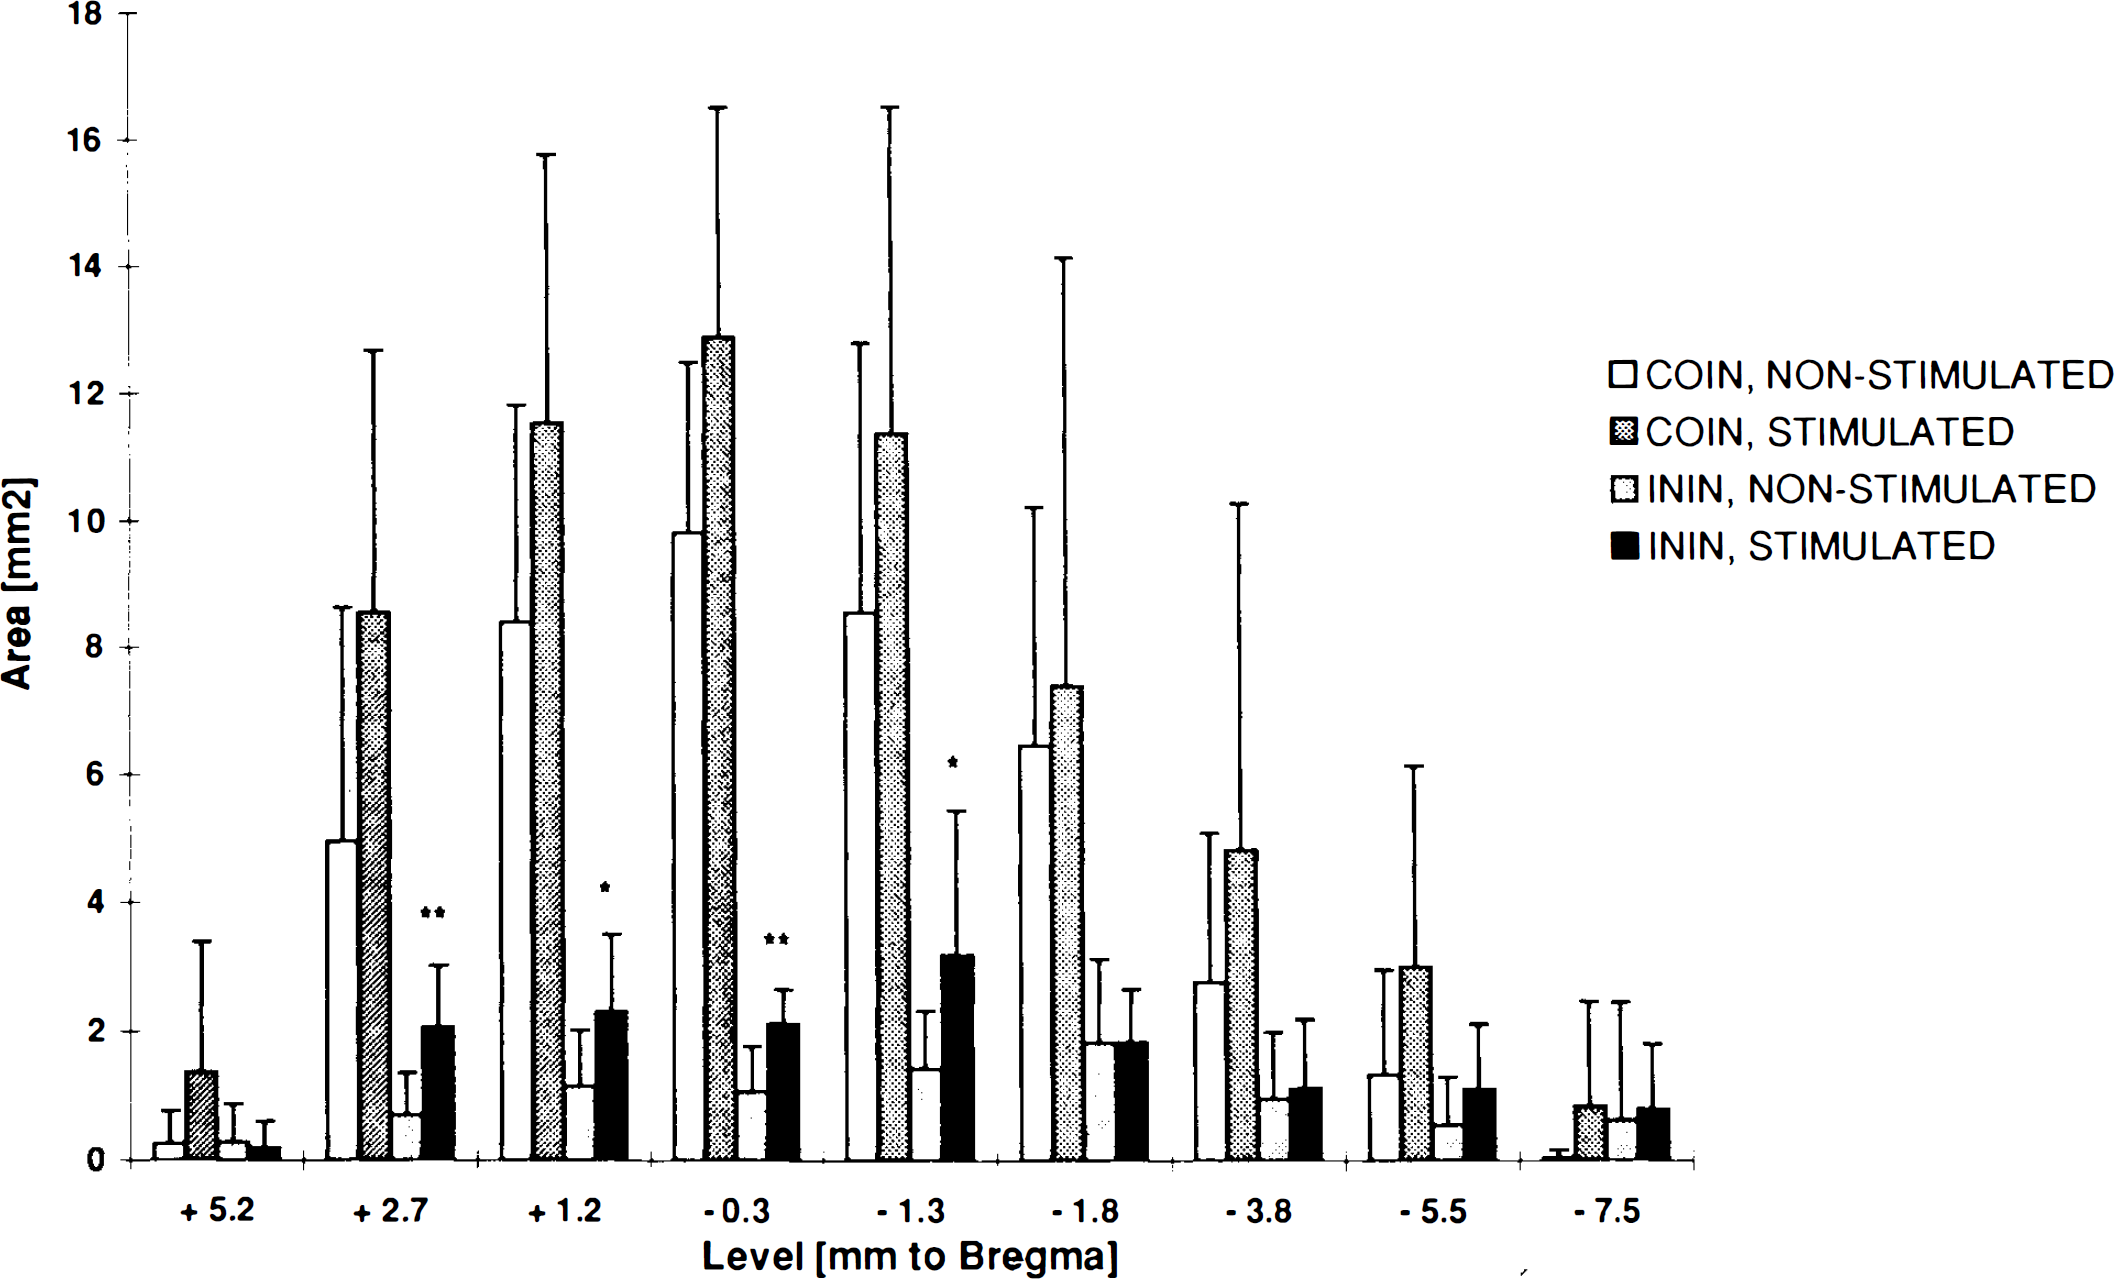
Areas of complete (COIN) and incomplete (ININ) infarction (mm2) for each standardized coronal level following MCA/CCA occlusion. Open bars: COIN in unstimulated rats in Group 2. Dark shaded bars: COIN in stimulated rats in Group 3. Light shaded bars: ININ in unstimulated rats in Group 2. Black bars: ININ in stimulated rats in Group 3. The two groups did not show a significant difference in the size of complete infarction. Areas of incomplete infarction that were significantly different between the two groups are marked: *p < 0.05 and **p < 0.01, respectively.
Correlation analysis
Correlation analysis was performed using the pooled electrophysiological and morphological data for Groups 2 and 3. The volume of complete infarction was not significantly correlated with the number of periinfarct DC shifts (p = 0.4) (Fig. 7a). However, integration of DC negativity per experiment correlated significantly with the volume of complete infarction (p < 0.001) (Fig. 7b). The volume of total (complete and incomplete) ischemic injury correlated, but more weakly, with the frequency of periinfarct depolarizations (p < 0.05) (Fig. 7c), whereas total ischemic injury was highly correlated with integrated DC potential negativity (p < 0.0001) (Fig. 7d). Correlations between the volume of incomplete infarction and the frequency and cumulative negativity of periinfarct DC shifts also attained significance (p < 0.05).
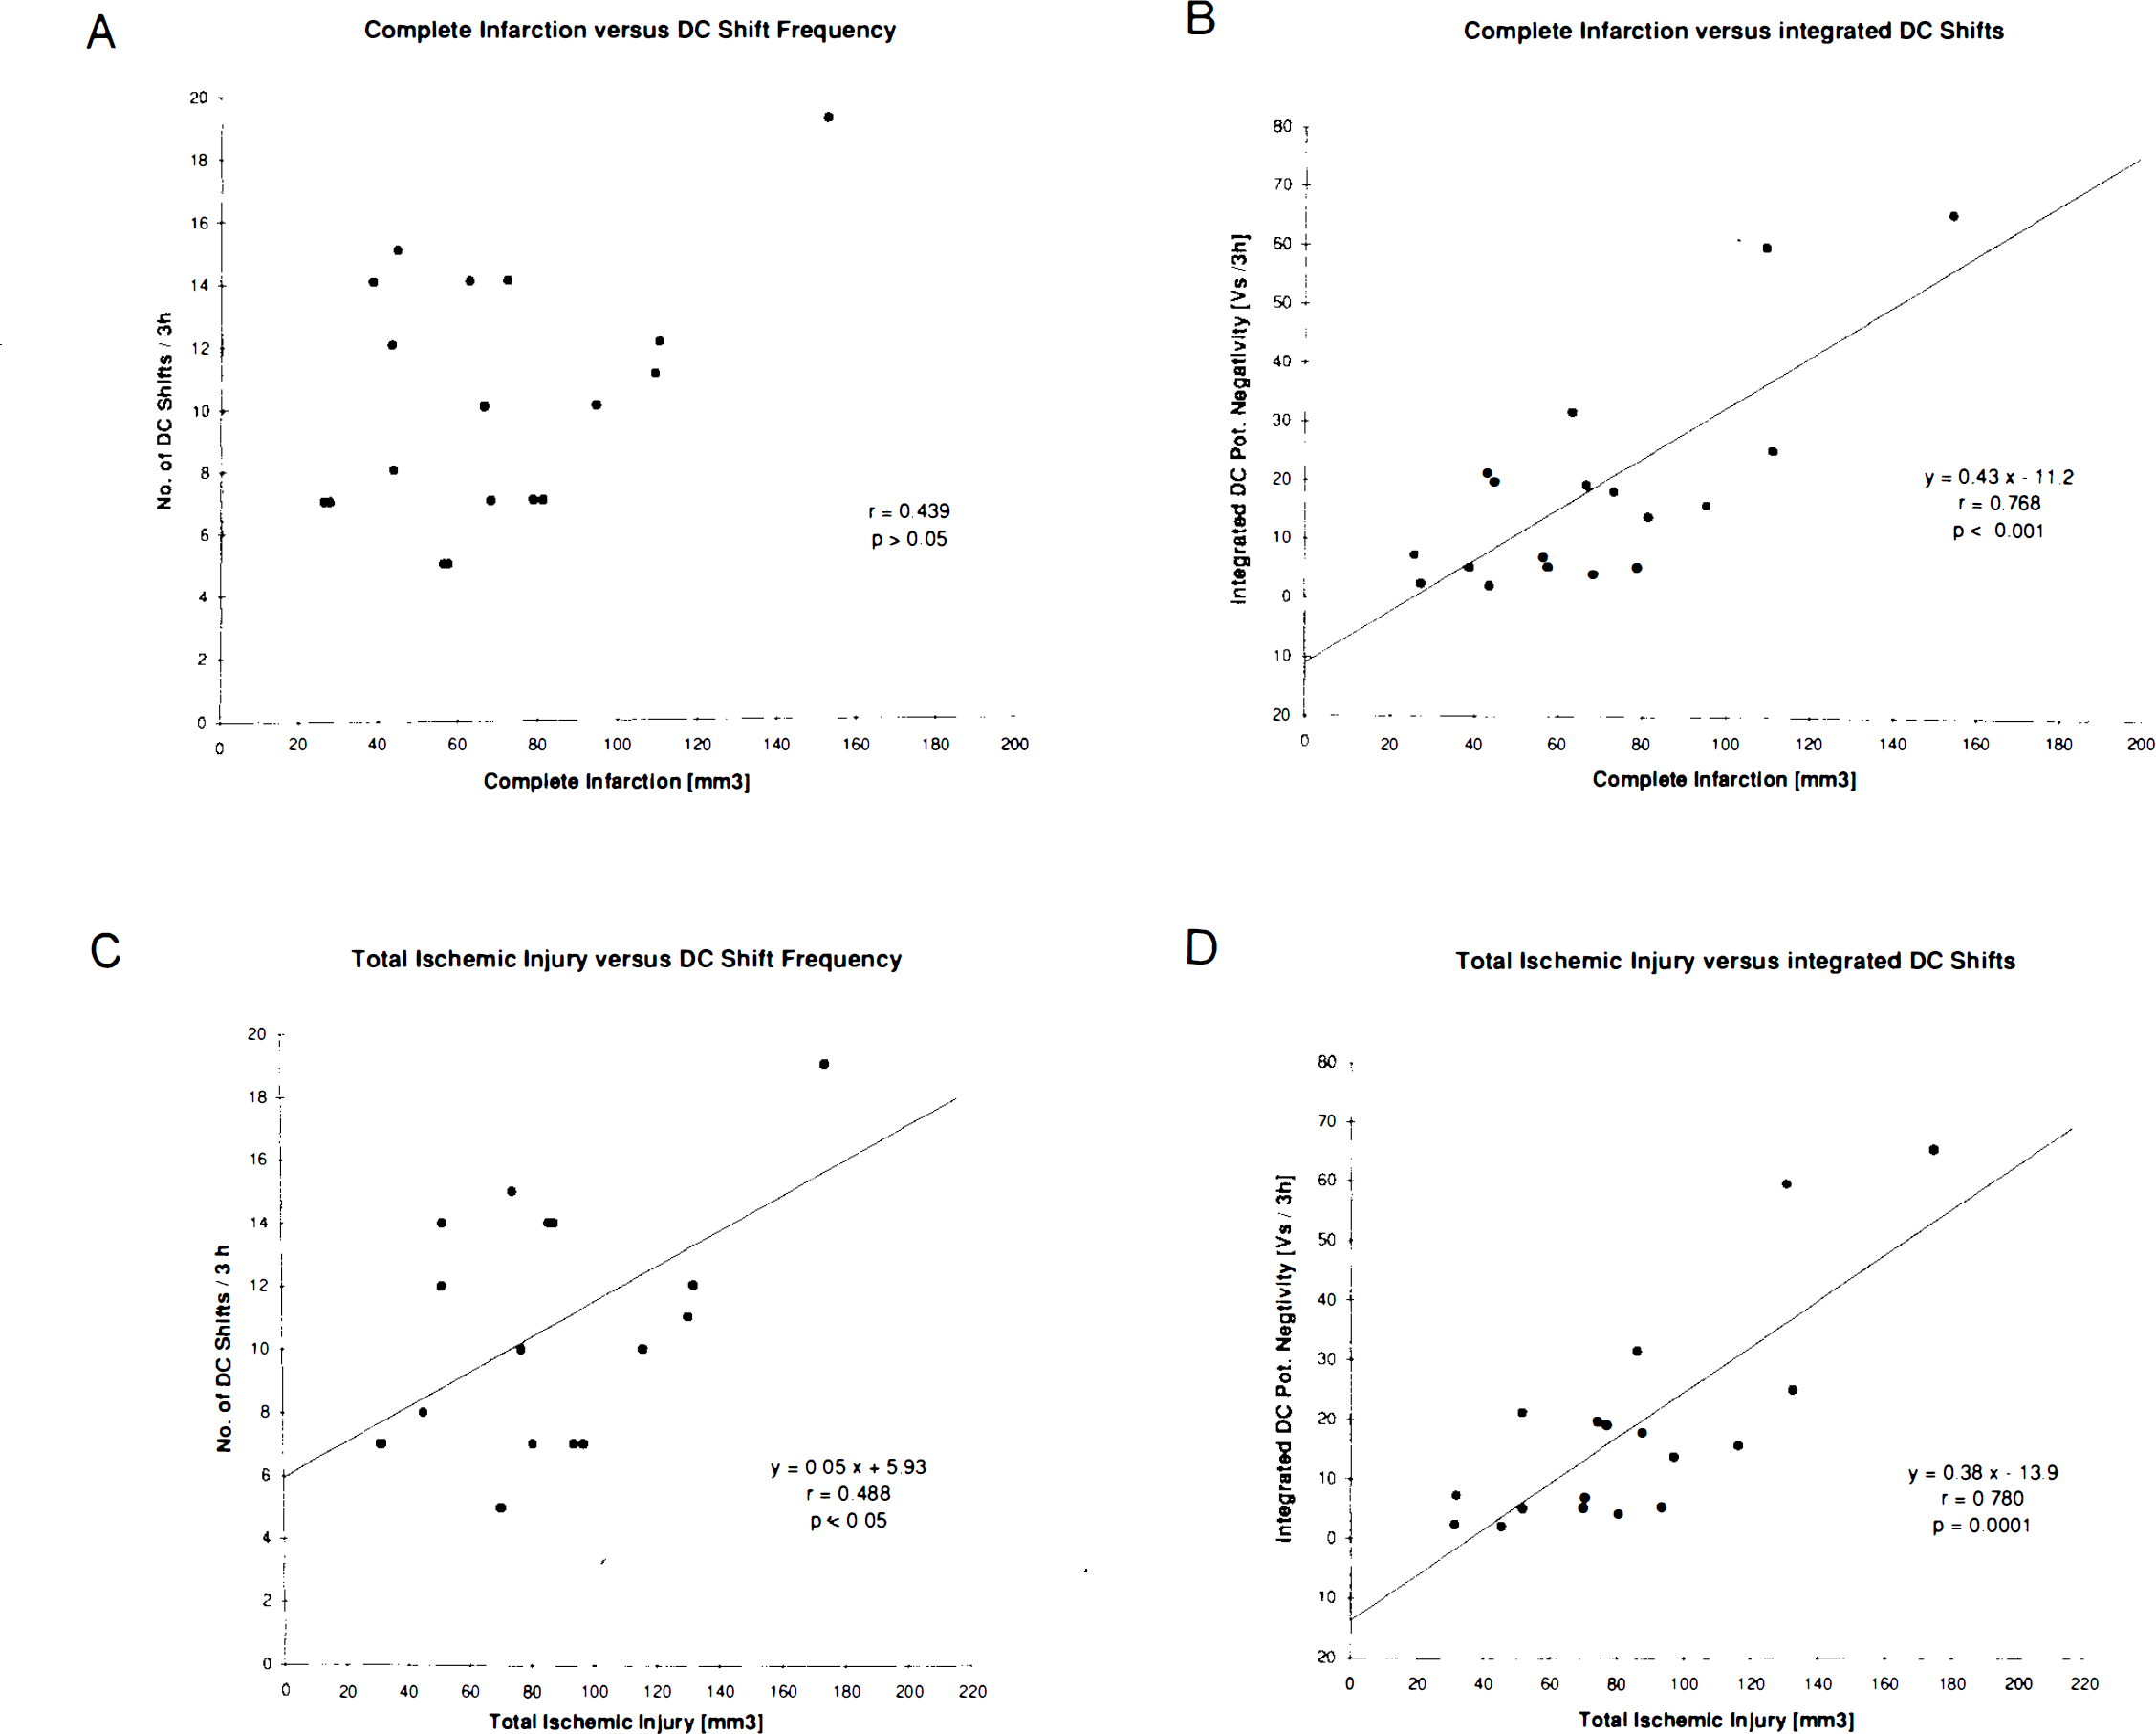
Correlation analysis between frequency of periinfarct DC shifts, cumulative DC potential negativity, total ischemic injury, and complete infarction. Correlation coefficients and regression equations are given for each plot.
DISCUSSION
Evidence has accumulated that the ischemic core and, in particular, the surrounding penumbra of evolving brain infarcts are highly dynamic structures (Heiss et al., 1994; Kohno et al., 1995). During the initial hours of focal ischemia, the ischemic core region enlarges as adjacent, formerly penumbral, areas undergo irreversible deterioration (Kohno et al., 1995). At the same time, the residual penumbra becomes restricted to the periphery of the initial ischemic focus, and its fate may depend critically upon early therapeutic intervention. The occurrence of these transient depolarizations in the penumbra is known to produce marked metabolism-flow uncoupling (Back et al., 1995), to evoke episodes of tissue hypoxia due to the absence of an appropriate flow response (Back et al., 1994a), to stimulate anaerobic glycolysis leading to lactacidosis (Back et al., 1994b; Gyngell et al., 1994), and to compromise energy metabolism (Takeda et al., 1993).
In this study we tested the hypothesis whether an increased frequency of depolarizations as measured in the penumbra of the acutely ischemic MCA territory aggravates the amount and degree of the ischemic injury as assessed by standard histopathology 24 h after onset of stroke. Induction of SD in the ischemic hemisphere produced a significant increase in the total volume of ischemic injury, 51%, including areas with overt infarction and scattered neuronal injury. To the best of our knowledge, this is the first report that provides direct evidence that the aggravation of morphological damage associated with focal cerebral ischemia correlates with the cumulative effect of periinfarct depolarizations. This is reflected in the highly significant correlation between the cumulative negativity of the DC potential and the volume of total ischemic injury in both stimulated and nonstimulated animals (Groups 2 and 3). Integration of the DC potential over time is a measure mainly of the cumulative duration of depolarizations. In comparison, the correlation between the number of periinfarct DC shifts and the ischemic injury volume was less significant (p < 0.05), indicating that the total duration that the tissue spent in a depolarized state is crucial in determining subsequent recovery or damage. This is in good agreement with in vitro data obtained in rat hippocampal slices, in which the delay in recovery of synaptic function following hypoxia was directly dependent on the duration of the preceding depolarization (Somjen et al., 1990).
It was essential to the present study to confirm that SD per se did not produce any histological changes, as reported previously (Nedergaard and Hansen, 1988). Apart from a very small localized area directly underlying the stimulation site, no histological abnormalities could be detected in Group 1 brains.
Following the induction of focal cerebral ischemia, two distinct histopathological patterns of damage have been observed: (i) complete infarction, with necrosis of all structures contained within the tissue (neuronal and glial cells, nerve fibers, and blood vessels), and (ii) selective irreversible injury of neurons at the periphery of brain infarcts, with preservation of the tissue structure and morphological integrity of surrounding cells (Garcia et al., 1978; Strong et al., 1983b). The latter type has also been termed “incomplete cerebral infarction” (Lassen, 1982).
The separate quantification of volumes affected by the two types of morphological injury revealed that the increased number of transient depolarizations selectively augmented the volume of scattered neuronal injury by nearly 100%. In contrast, the volume of complete infarction was not significantly increased by the elicitation of SD in ischemic animals (although there was a strong trend: 56.2 mm3 in Group 2 vs. 81.8 mm3 in Group 3). Obviously, the occurrence of scattered dead neurons in the infarct rim represents the immediate morphological consequence of periinfarct depolarizations. This is in good agreement with the results of Yao et al. (1994), who reported that the glutamate antagonist MK-801, which is known to block periinfarct DC shifts (Gill et al., 1992; Iijima et al., 1992), was able selectively to attenuate incomplete but not complete infarction in the same model of MCA occlusion.
Correlation analysis revealed a significant relationship between the frequency of DC shifts and the incomplete infarction volume, but the volume of complete infarction did not correlate with the number of periinfarct depolarizations. This observation is in contradiction to the findings of Mies et al. (1993), who observed that the frequency of periinfarct DC transients correlated positively with the volume of overt infarction as measured 3 h after MCA occlusion. However, in the very acute stage of cerebral infarction (3 h postocclusion), the two types of morphological injury may, in fact, be indistinguishable so that areas of scattered selective neuronal injury may have been included in the histological analysis of Mies and co-workers (1993).
In our study, a novel MCA occlusion model was employed, involving laser-driven intraluminal photothrombosis of the distal MCA and leaving the dura intact at the site of laser irradiation (Markgraf et al., 1993; Back et al., 1995). We chose to couple MCA occlusion with permanent ipsilateral CCA ligation alone (i.e., without reversible contralateral CCA occlusion) to obtain a stable perfusion pattern over time. The mean volume of overt infarction in nonstimulated animals in Group 2 was consistently smaller (56.2 mm3) than reported by Markgraf and co-workers (1993) (130.5 mm3), due to the less severe ischemic impact.
The electrophysiological characteristics of both electrically evoked SD and periinfarct depolarizations corresponded to the values reported in the literature (Nedergaard and Astrup, 1986; Iijima et al., 1992; Back et al., 1994a). In ischemic animals, intermittent stimulation of SD in the frontal pole prolonged both the spontaneously occurring and the electrically evoked depolarizations following MCA occlusion (Group 3). This means that the delay of recovery of electrical function following periinfarct depolarizations (Back et al., 1994a) is further prolonged by any additional electrical stimulation. This observation points to energy metabolism as a critical factor for tissue/cell survival in the ischemic penumbra because repolarization is an energy-requiring process under conditions of the low-energy yield of nonoxidative (anaerobic) metabolism, as evidenced by lactacidosis in the infarct border (Back et al., 1994b). The studies by Gidö et al. (1994) support the role of energy failure as a precondition for SD-induced tissue injury by demonstrating that the tissue calcium transients accompanying SDs elicited in hypoglycemic rats resulted in moderate neuronal damage only when the hypoglycemic state had progressed to the stage of precoma.
The present model of focal cerebral ischemia led to consistent neocortical infarcts with rare involvement of the lateral striatum. The occurrence of microembolic foci was frequently seen in otherwise normally appearing cortical regions. Thus, the mechanisms of occlusion involve both the obstruction of the distal MCA and the (microscopically proven) lodging of platelet emboli downstream before the MCA photothrombosis becomes complete. Direct evidence of platelet embolization has been reported following nonocclusive CCA photothrombosis (Dietrich et al., 1993). In nonstimulated animals (Group 2) the zone exhibiting selective cell injury did not exceed 1.5 mm in width, but in some stimulated animals in Group 3 this transition zone covered a distance of >2.5 mm from the infarct margin. This is similar to the findings of Nedergaard (1987), who described a 1-mm transition zone surrounding the infarct margin in which 20–60% of cortical neurons showed damage, whereas only very few neurons displayed injury at longer distances. The degree of astrocytic swelling determined by direct microscopic examination was more extensive and pronounced in stimulated animals; however, the astrocytic response was not quantitated. It is possible that this alteration reflects the early transition to reactive astrocytes since the expression of glial fibrillary acidic protein mRNA has been observed both following SD (Kraig et al., 1991) and in focal ischemia from 24 h postocclusion onward (Dr. C. Wieβner, personal communication).
The comparison of regional histopathological changes in the ischemic animals of this study with autoradiographic flow studies in a similar MCA occlusion model (Back et al., 1995) shows that border-zone areas with gradually increasing flow values were located typically in regions that displayed selective neuronal cell loss. It is known that the phenomenon of a reduced neuronal density in the infarct border caused by scattered neuronal injury is a flow-dependent event. A positive correlation between neuronal density and regional CBF was demonstrated for different periinfarct regions with variable flow values in chronic MCA infarcts in cats (Mies et al., 1983). In a recent study, it was demonstrated that the hyperemic/hyperoxic response associated with SD in normal brain was abolished in the penumbra when periinfarct depolarizations occurred (Back et al., 1994a). During these depolarizations, episodes of hypoxia were observed, which may consequently suppress protein synthesis (Mies, 1993) and lead to a gradual deterioration of energy metabolism.
It is conceivable that neurons that depolarize recurrently in the presence of low flow and that are embedded in a microenvironment with (at least transiently) elevated interstitial concentrations of excitotoxic neurotransmitters (Takagi et al., 1993), lactate (Gyngell et al., 1994), potassium (Hansen et al., 1980; Strong et al., 1983a), and H+ (Back et al., 1994b; Csiba et al., 1985) may suffer from intracellular calcium accumulation and, finally, energy failure (Siesjö and Bengtsson, 1989; Hossmann, 1994). If this process involves the majority of glial and neuronal cells, the state of scattered injury progresses to complete infarction. At present, little is known as to whether periinfarct depolarizations may trigger the generation of oxygen free radicals. However, important predisposing conditions, such as compromised flow, acidosis, accumulation of ADP, and activation of microglia, are present in the infarct border.
In conclusion, the enlargement of both scattered neuronal injury and total ischemic damage in MCA territory infarcts following the elicitation of SD points to periinfarct depolarizations as a key pathophysiological event for the dynamic evolution of morphological damage in focal ischemia. This mechanism should thus be considered an important target for potential pharmacotherapeutic interventions. The functional implications of these observations need to be determined by further investigations.
Footnotes
Acknowledgment:
These studies were supported by the Deutsche Forschungsgemeinschaft (Research Grant Ba 1390/1–1) and by USPHS Grants NS 05820 and NS 23244. We are deeply indebted to Mr. Raul Busto for his superb assistance and to Mr. David W. Smith and Dr. Weizhao Zhao for indispensable computer system support. We are very grateful to Ms. Helen Valkowitz, who helped to prepare the typescript.