
Abstract
The hemodynamic changes occurring during obliteration procedures for arteriovenous malformations (AVM) have not been fully elucidated. Therefore, we undertook a simulation study using a compartmental flow model to investigate the role of altered autoregulatory conditions in the development of hyperperfusion during obliteration of large high-flow AVM. Induced hypotension was also simulated to evaluate its usefulness in reducing the incidence and severity of the event. As the AVM flow was decreased during the obliteration procedures, feeder pressure increased and drainer pressure decreased, with a concomitant increase in the perfusion pressure in the brain tissue surrounding the AVM. Cerebral blood flow (CBF) remained constant at 50 ml 100 g−1 min−1 in the presence of autoregulation and increased to 67 ml 100 g−1 min−1 in its absence. When the lower limit of the autoregulatory pressure range (LAR) was shifted from 60 to 50 or 40 mm Hg, the flow volume increased markedly from 67 to 77 ml 100 g−1 min−1 or to 92 ml 100 g−1 min−1 after complete obliteration. Decrease in LAR would be a cause of the hyperperfusion. Induced systemic hypotension was found to be effective in reducing the magnitude of these hemodynamic changes, when induction was appropriately performed in a stepwise fashion. A simulation study is useful in clarifying the various hemodynamic changes that develop during the treatment of AVM.
Keywords
Microsurgery and intravascular surgery have recently contributed considerably to progress in the management of formerly inoperable large arteriovenous malformations (AVM) of the brain (Andrews and Wilson, 1987; Drake, 1979; Stein and Solomon, 1990; Vinuela et al., 1991). Reduction of AVM flow volume induced by these therapeutic modalities is known to increase feeder pressure and decrease drainer pressure, both of which elevate the pressure gradient across the nidus as well as the perfusion pressure in the surrounding brain.
Under physiological conditions, an autoregulatory mechanism maintains constant cerebral blood flow (CBF). However, the brain tissue surrounding a large high-flow AVM is considered to be chronically exposed to hypoperfusion, which may result in the impairment of autoregulatory mechanisms. These increased hemodynamic loads are likely to result in an abnormal increase in CBF, with cerebral edema and hemorrhage, in some large high-flow AVM. This phenomenon is referred to as normal perfusion pressure breakthrough (NPPB) (Spetzler and Wilson, 1978). Although continuous monitoring of the hemodynamics during therapeutic procedures for AVM or during the course of NPPB is indispensable for satisfactory management of AVM, it is not always easy in clinical settings (Batjer et al., 1989; Rosenblum et al., 1987; Tamaki et al., 1990; Young et al., 1988).
One of the primary concerns in the NPPB phenomenon is the exact mechanism by which hyperperfusion develops under normal perfusion pressure. However, the mechanism has not been elucidated in humans. Moreover, hyperperfusion has not been reproduced in experimental animals. We, thus, employed a hydraulic vascular model to simulate the hyperperfusion encountered during the process of obliterating AVM (Nagasawa et al., 1993). Flow volume in the surrounding brain was found to increase from the initially adjusted value of 20 ml 100 g−1 min−1 to the physiological value of 50 ml 100 g−1 min−1 in the presence of autoregulation. Although the flow volume increased further to no higher than 61 ml 100 g−1 min−1 in the absence of autoregulation, this value was considered far below that in the condition in hyperperfusion or “breakthrough”.
In this study, a compartmental flow model of AVM was employed to investigate in more detail the hemodynamic conditions under which hyperperfusion in the surrounding brain can be induced. CBF is known to depend on perfusion pressure in some pathological conditions. Also, the autoregulatory pressure range is suggested to change; upward displacement of the upper limit has been recognized in essential hypertension and a downward shift of the lower limit has been speculated in chronic hypotension (Strandgaard et al., 1973; Paulson et al., 1990). Accordingly, impairment of the autoregulatory mechanism is presumed to manifest itself as either a loss of the constant blood flow regulation function or a decrease in the lower limit of the autoregulatory pressure range (LAR) to below 60 mm Hg. Systemic hypotension was induced in either a one-stage or stepwise fashion to evaluate its usefulness in reducing hyperperfusion.
METHODS
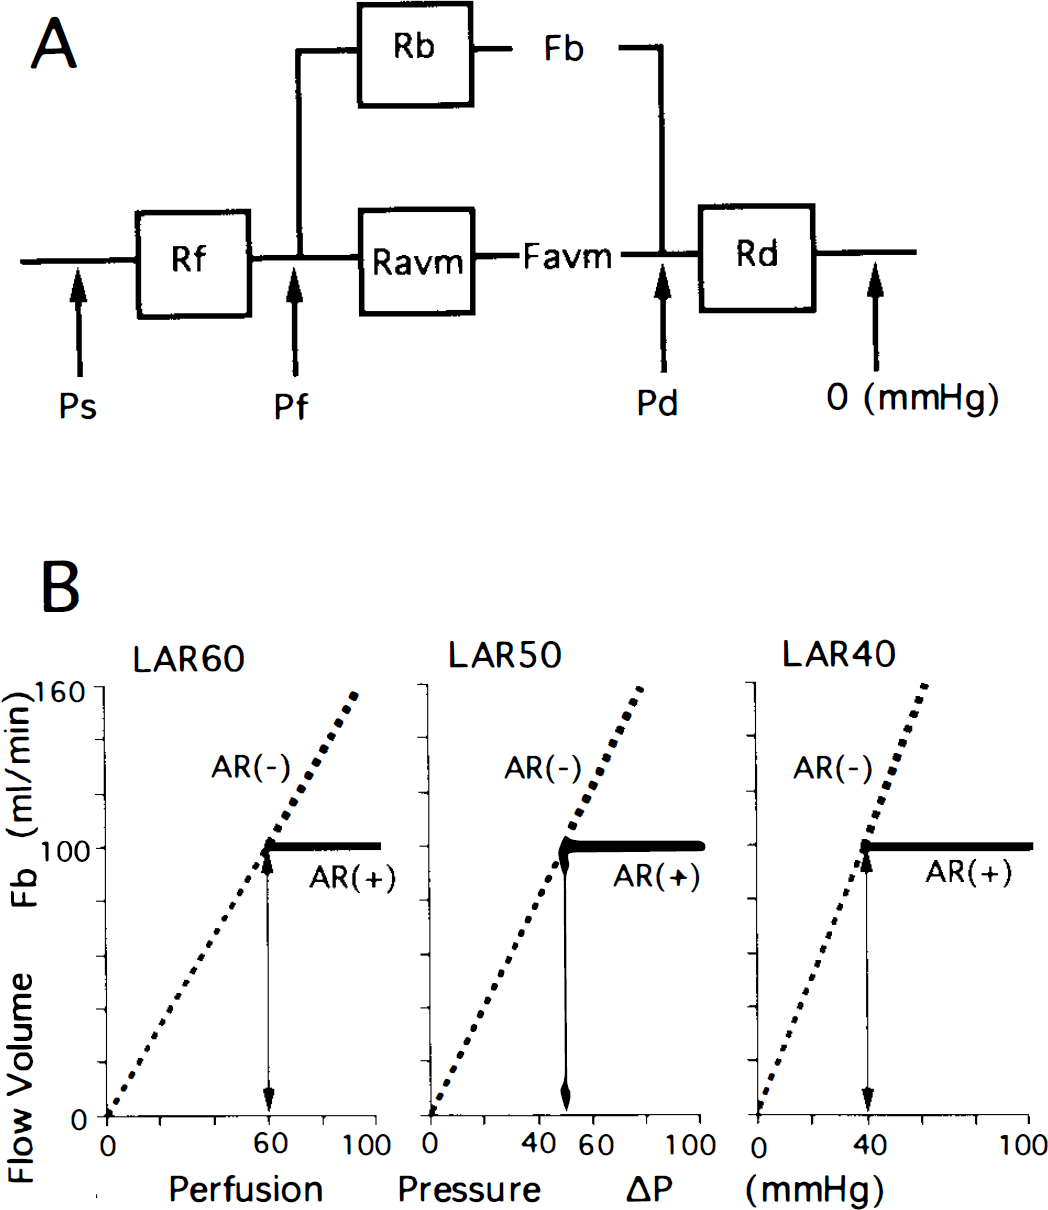
The compartmental flow model (Lo et al., 1991) used was designed to simulate the hemodynamics of an AVM composed of one feeding artery, a nidus, one draining vein, and the brain tissue surrounding the AVM (Fig. 1A). Resistant elements in these four components were designated as the resistances of the feeding artery, Rf; nidus of the AVM, Ravm; draining vein, Rd; and the brain, Rb, respectively. Flow volumes in the AVM and brain were expressed as Favm and Fb, respectively. Values of systemic blood pressure, and pressures of the feeding artery and draining vein are designated as Ps, Pf, and Pd, respectively. Although pressures in the intracranial cavity and venous sinus are related to circulation in the surrounding brain, they are considered to have less influence than other pressure parameters and were excluded to simplify the model.
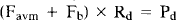
Since flow is determined by the ratio of perfusion pressure to hemodynamic resistance, the following equations were established for each compartment of the model:


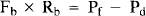
where Pf minus Pd (ΔP) corresponds to the pressure gradient across the nidus or perfusion pressure of the brain. From these equations, Favm is expressed as a function of Ravm by eliminating Rb, Pf, and Pd in

Favm is similarly expressed by eliminating Fb, Pf, and Pd in

An autoregulatory mechanism is known to maintain constant CBF at an average value of 50 ml 100 g−1 min−1 in certain pressure ranges, usually between 160 and 60 mm Hg, involving a change of the smooth muscle tone of cerebral resistance vessels. Below this pressure value, the vessels are maximally dilated and the flow volume decreases, depending upon the pressure. In this study, an AVM with a diameter of >4 cm was regarded as large. Barnett et al. (1987) demonstrated that an AVM has a pronounced effect on local cortical blood flow at a distance of 2–4 cm from the AVM margin. Accordingly, a large AVM is estimated to have some hemodynamic effects within the area of up to 6 cm from the center of the AVM. In consideration of possible variations of AVM location in the brain, the affected brain tissue surrounding a large AVM was estimated to range between 100 and 300 g with a median value of 200 g. Therefore, flow volume, Fb, was considered to be 100 ml/min in the presence of autoregulation.
The following two types of impaired autoregulation were simulated: decrease of LAR to <60 mm Hg and loss of the capacity to maintain a constant flow volume of 100 ml/min (Fig. 1B). In this report, the presence and absence of autoregulatory mechanism is denoted AR (+) and AR (−), respectively. In a model in which LAR was assumed to be 60 mm Hg (LAR60), the vascular resistance of the brain (Rb) in the autoregulatory range >60 mm Hg was adjusted such that an Fb value of 100 ml/min was maintained (Fig. 1B), [LAR60, AR (+)]. The relationships between Favm and Ravm under these conditions were readily expressed by substituting 100 ml/min for Fb in Eq. 5. Impaired autoregulatory conditions were simulated such that the Rb value was fixed at 0.60 (60 mm Hg/100 ml/min) not only in the range <60 mm Hg but also in that >60 mm Hg (Fig. 1B) [LAR60, AR (−)]. Equation 6 was easily used by substituting 0.60 for Rb.
In a model in which LAR was assumed to be 50 mm Hg (LAR50), the value for Rb was adjusted to maintain the Fb value at 100 ml/min in the presence of autoregulation >50 mm Hg, and was fixed at 0.50 (50 mm Hg/100 ml/min) in its absence (Fig. 1B) (LAR50). When the LAR was 40 mm Hg (LAR40), the Rb value was either similarly adjusted or fixed at 0.40 (40 mm Hg/100 ml/min) depending on the presence or absence of autoregulation (Fig. 1B) (LAR40).
Since this model simulated a large high-flow AVM, the values for AVM flow (Favm), feeder pressure (Pf), and drainer pressure (Pd) before treatment were initially adjusted to 500 ml/min, and 35 and 15 mm Hg, respectively (Hassler and Steinmetz, 1987; Jungreis et al., 1989; Nornes and Grip, 1980; Spetzler et al., 1987). The initial value for Ravm was then calculated to be 0.04 mm Hg/ml/min (Table 1). An example of the simulation procedures is described below for a model in which LAR is 60 mm Hg and systemic blood pressure is 100 mm Hg (LAR60/Ps100).
Initial values of parameters assumed or calculated in this study
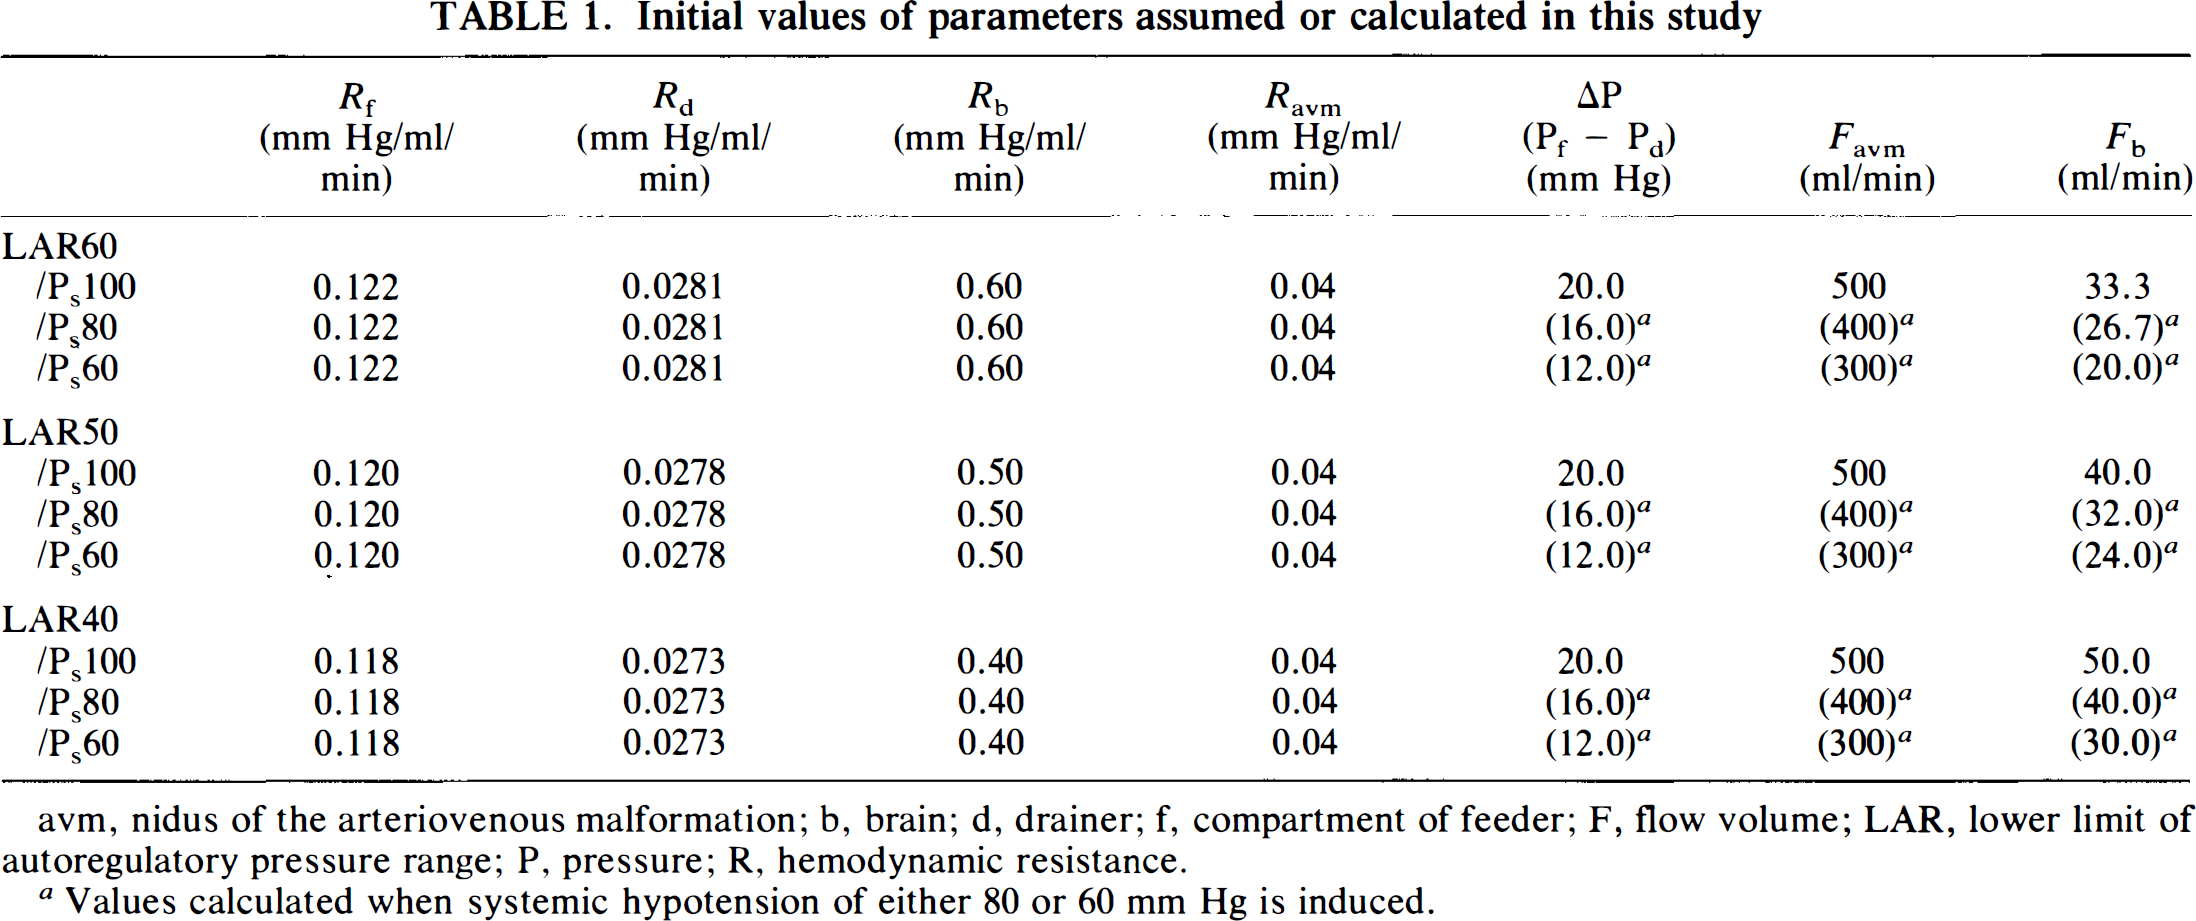
avm, nidus of the arteriovenous malformation; b, brain; d, drainer; f, compartment of feeder; F, flow volume; LAR, lower limit of autoregulatory pressure range; P, pressure; R, hemodynamic resistance.
Values calculated when systemic hypotension of either 80 or 60 mm Hg is induced.
Under the initial condition of perfusion pressure (ΔP) of 20 mm Hg, the Rb value was considered 0.60 and Fb value was one-third of the physiological value of 100 ml/min. Values for Rf and Rd can be calculated by substituting these initial values for Rb, Favm, Pf, Pd, and Ps in Eqs. 1 and 4. After substitution, Eq. 6 was then changed to

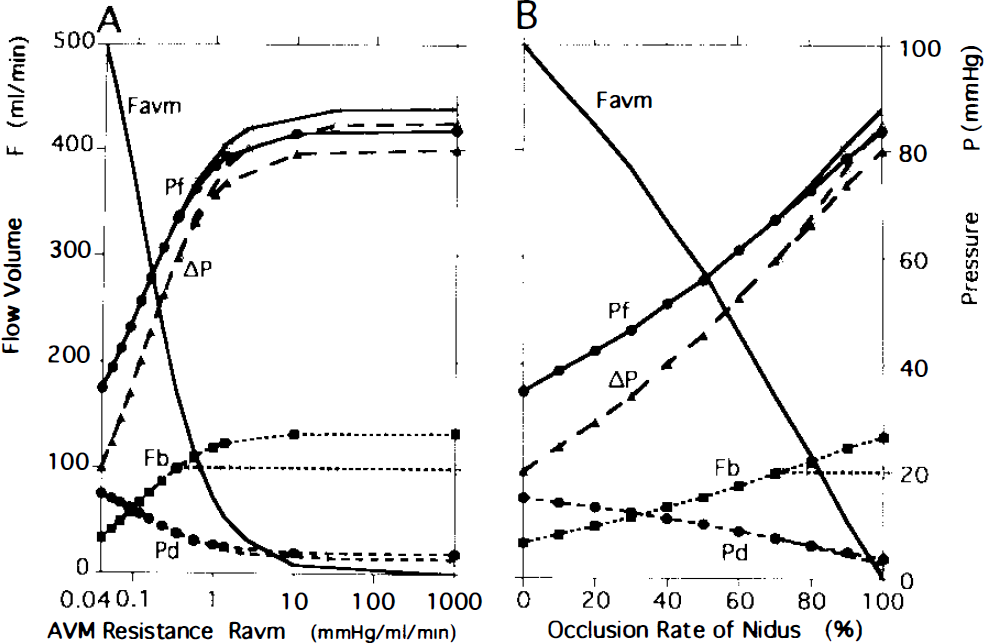
Since the value of Ravm was 0.04 before AVM obliteration and increased thereafter, Favm can be obtained by substituting arbitrary values >0.04 for Ravm in a stepwise fashion into Eq. 7. For each Ravm value substituted, Pf, Pd, ΔP, and Fb were determined using Eqs. 1–4 in the absence of autoregulation; the values obtained for each are shown as closed symbols in Fig. 2A. When Ravm increased to 0.36, perfusion pressure (ΔP) and Fb reached 60 mm Hg and 100 ml/min, respectively, which were the LAR values.
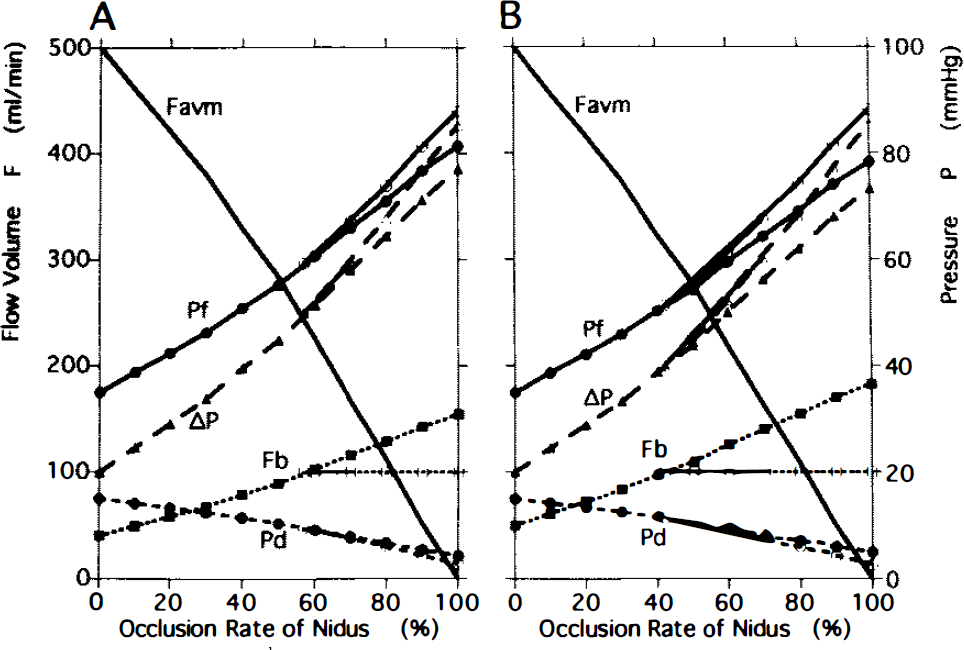
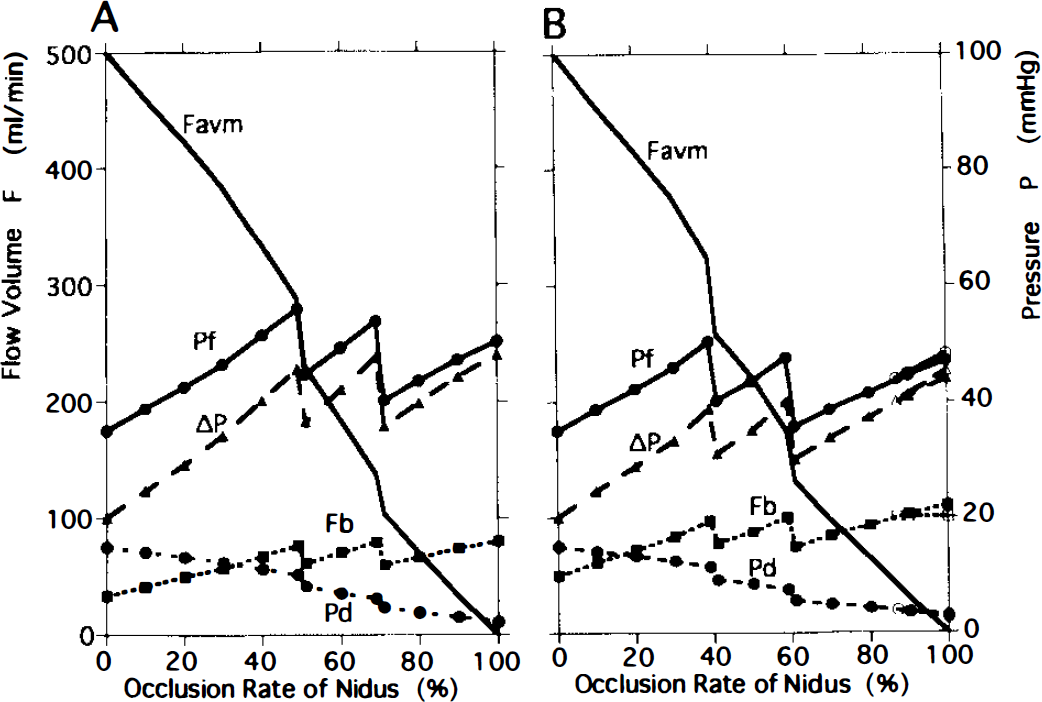
The flow volumes and pressures in the model with a systemic pressure of 100 mm Hg (Ps100) depended on the value of the lower limit of the autoregulatory pressure range. Changes in the LAR50/Ps100 model are shown on the left (A) and those of LAR40/Ps100 on the right (B). As the obliteration advanced, perfusion pressure (ΔP) increased, reaching 50 mm Hg at the occlusion rate of 57% in the model with LAR50/Ps100 and 40 mm Hg at the rate of 42% in LAR40/Ps100.
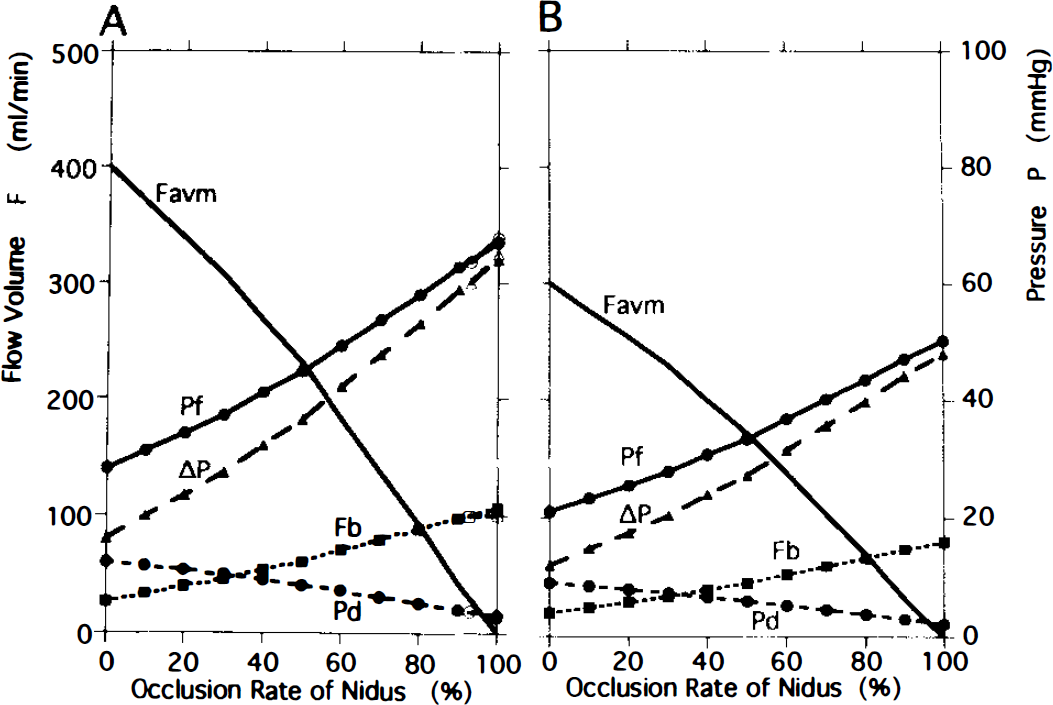
The flow volumes and pressures in the model with a lower limit of 60 mm Hg (LAR60) depended on the systemic pressure (Ps). Changes in the LAR60/Ps80 model are shown on the left
In the presence of autoregulation, where Fb is maintained constant at 100 ml/min, Fb, Pf, Pd, and Ps values can be substituted into Eq. 5:

Favm and other parameters can be obtained by substituting any value >0.36 for Ravm, and their values are shown as open symbols in Fig. 2A.
Flow volume in the AVM is usually used as one of the indicators when estimating the therapeutic progress in obliteration of the AVM. Measurement of resistance in terms of mm Hg/ml/min as used thus far for Ravm demonstrated a markedly nonlinear relationship to the AVM flow. Accordingly, it was not an appropriate parameter for resistance when clinical issues were concerned. The parameter referred to as the occlusion rate of the nidus was used in our hydraulic study (Nagasawa et al., 1993), where the AVM nidus was obliterated by one-tenth of the total cross-sectional area. This unit showed a much more linear relationship to AVM flow volume and could be used in a similar manner during the process of embolization or feeder ligation. Data for AVM flow volume and occlusion rate of the nidus from our previous study were used to convert Ravm to occlusion rate by comparing these two values at identical AVM flow volumes; the value of 0.04 for Ravm was found to correspond to a 0% occlusion rate of the nidus (before occlusion), 0.069 to 20%, 0.120 to 40%, 0.229 to 60%, 0.575 to 80%, > 1,000 to complete occlusion or 100%, and so forth. Favm, Pf, Pd, ΔP, and Fb were then replotted against the occlusion rate of the nidus (Fig. 2B).
To investigate the effects of the LAR value on the hemodynamic changes in the model of LAR60/Ps100, simulation was performed with the LAR value reduced from 60 mm Hg to either 50 (LAR50/Ps100) or 40 mm Hg (LAR40/Ps100). Changes in LAR values induce changes in the initial parameters of Rb and Fb and then Rf and Rd (Table 1). By substituting these initial values into Eq. 5 or 6, simulation can be carried out in fashion similar to that in the model of LAR60/Ps100.
The effect of induced hypotension was simulated in the model of LAR60/Ps100, LAR50/Ps100 or LAR40/Ps100. When 80 or 60 mm Hg was substituted for Ps in Eq. 5 or 6 instead of 100 mm Hg, perfusion pressure (ΔP), Favm, and Fb were found to decrease to 80 or 60% of the values at P 100. Simulation could be performed with models using LAR60, LAR50, and LAR40 in a similar way when the Ps value was constant at 100 mm Hg.
RESULTS
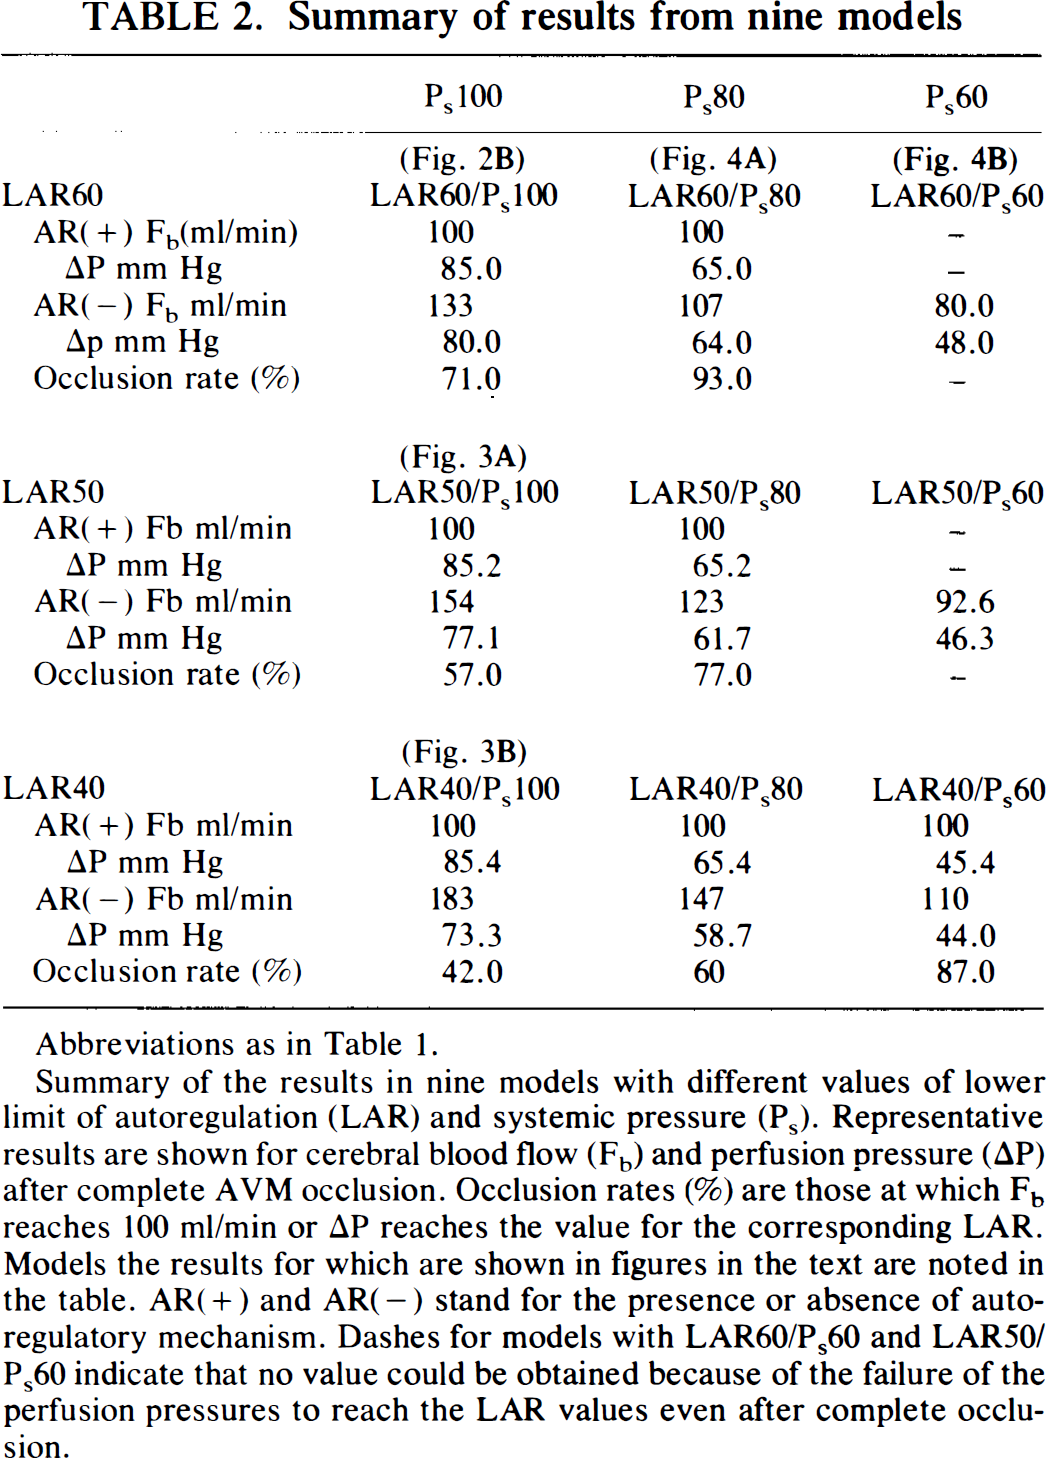
Results of 18 simulations are summarized in Table 2, which shows the values of blood flow volume in the surrounding brain and perfusion pressure as representative parameters after complete occlusion of the AVM. Under the conditions that the LAR was 60 mm Hg and Ps was 100 mm Hg (LAR60/Ps100), changes in Favm, Pf and Pd, and ΔP were illustrated as functions of Ravm (Fig. 2A) and the occlusion rate of the nidus (Fig. 2B). Favm decreased markedly at a constant rate as occlusion proceeded from 0 to 71%. The concomitant increase of feeder pressure and decrease of drainer pressure resulted in a marked increase in the pressure gradient across the nidus (ΔP) from 20 to 60 mm Hg. Further obliteration of the nidus induced different changes in these values, depending on the presence or absence of autoregulation. In the presence of autoregulation, indicated by open symbols, feeder pressure increased to 87.8 mm Hg and drainer pressure decreased to 2.8 mm Hg after complete occlusion. Although the resulting increase in perfusion pressure (ΔP) reached 85.0 mm Hg, the flow volume of the brain remained constant at 100 ml/min. In the absence of autoregulation, indicated by a closed symbol in the figure, the flow increased gradually from 100 to 133 ml/min as occlusion advanced from 71 to 100%. After complete occlusion, the value of Pf was decreased by 4.1 mm Hg and that of Pd was increased by 0.9 mm Hg compared to the respective values in the presence of autoregulation. Perfusion pressure (ΔP) was 80.0 mm Hg, which was 5.0 mm Hg lower than that in the presence of autoregulation.
Summary of results from nine models
Abbreviations as in Table 1.
Summary of the results in nine models with different values of lower limit of autoregulation (LAR) and systemic pressure (Ps). Representative results are shown for cerebral blood flow (Fb) and perfusion pressure (ΔP) after complete AVM occlusion. Occlusion rates (%) are those at which Fb reaches 100 ml/min or ΔP reaches the value for the corresponding LAR. Models the results for which are shown in figures in the text are noted in the table. AR(+) and AR(−) stand for the presence or absence of autoregulatory mechanism. Dashes for models with LAR60/Ps60 and LAR50/Ps60 indicate that no value could be obtained because of the failure of the perfusion pressures to reach the LAR values even after complete occlusion.
Changes in LAR were found to have significant hemodynamic effects and are summarized in the column headed P100 in Table 2. As LAR shifted from 60 (Fig. 2B) to 50 (Fig. 3A) or 40 mm Hg (Fig. 3B), the occlusion rate at which Fb reached 100 ml/min decreased markedly, and Fb values in the absence of autoregulation increased markedly (Table 2). In the model with LAR50/Ps100 (Fig. 3A), AP and Fb increased to 50 mm Hg and 100 ml/min, respectively, at an occlusion rate of 57%. After complete occlusion, values for Fb, Pf, and ΔP were 154 ml/min, 81.4 mm Hg, and 77.1 mm Hg, respectively, in the absence of autoregulation and 100 ml/min, 87.9 mm Hg, and 85.2 mm Hg, respectively, in the presence of autoregulation (Table 2). In the model with LAR40/Ps100 (Fig. 3B), Fb and ΔP reached 100 ml/min and 40 mm Hg, respectively, at an occlusion rate of 42%. Values for Fb, Pf, and ΔP after complete occlusion were 183 ml/min, 78.3 mm Hg, and 73.3 mm Hg, respectively, in the absence of autoregulation and 100 ml/min, 88.2 mm Hg, and 85.4 mm Hg, respectively, in the presence of autoregulation (Table 2).
Effects of a decrease in systemic pressure (Ps) in the model with LAR60 are illustrated in Fig. 4 and summarized in the row headed LAR60 in Table 2. When Ps was changed from 100 mm Hg (Fig. 2B) to 80 mm Hg (Fig. 4A), parameters for pressure and flow before occlusion decreased by 20% in proportion to the decrease in Ps, AVM flow volume decreased from 500 to 400 ml/min, feeder pressure from 35 to 28 mm Hg, and perfusion pressure (ΔP) from 20 to 16 mm Hg (Table 1). As occlusion proceeded, hemodynamic parameters changed more moderately than those in the model with LAR60/Ps100. The value for ΔP reached 60 mm Hg only when the occlusion rate was as high as 93%. When the Ps value was further reduced to 60 mm Hg (LAR60/P60, Fig. 4B), the parameters decreased by 40%, compared to those in the model with LAR60/Ps100 (Table 1). Perfusion pressure (ΔP) after complete occlusion was 48 mm Hg, which was much lower than the LAR value of 60 mm Hg.
Stepwise reduction of systemic blood pressure during the process of obliteration of the AVM was simulated in the model using LAR60 by assembling the data for LAR60/Ps100, LAR60/Ps80 and LAR60/Ps60 (Fig. 5A). This was managed so that the AP value was maintained below the LAR value of 60 mm Hg. The value for Ps was then initially set at 100 mm Hg (LAR60/Ps100) up to the occlusion rate of 50%, reduced to 80 mm Hg (LAR60/Ps80) in the range between 50 and 70%, and reduced further to 60 mm Hg (LAR60/Ps60) in the final stage of occlusion >70%. Values for ΔP and Fb remained low in relatively narrower ranges (20–48 mm Hg and 33.3–80.2 ml/min, respectively) compared to those in the LAR60/Ps100 model (Fig. 2B). A similar simulation was performed in the model with LAR40 (Fig. 5B), where Ps was initially set at 100 mm Hg when the occlusion rate was <40%, at 80 mm Hg when the rate was between 40 and 60%, and at 60 mm Hg for further occlusion. The ΔP value could be maintained below the LAR value of 40 mm Hg up to the occlusion rate of 87%, at which point Fb reached 100 ml/min and increased further in the range >87%. Changes in hemodynamic parameters were much smaller than those in LAR40/Ps100 (Fig. 3B).
DISCUSSION
Extensive hemodynamic data on AVM have been accumulated: reported total bulk flow ranged from 150 to 900 ml/min (490 ml/min average), feeder pressure ranged from 30 to 77 mm Hg or 26–72% of systemic blood pressure, while drainer pressure ranged from 8 to 23 mm Hg (Awad et al. 1990, Barnett et al. 1987, Nornes et al. 1980, Spetzler et al. 1987). These values, however, were not necessarily those of the AVM that produced hyperperfusion. While hyperperfusion is not often recognized in the process of obliteration of AVM, marked hemodynamic overload referred to as the NPPB phenomenon develops rarely, under certain conditions, in large and/or high-flow AVM. Since one of the purposes of this study was to reproduce these rare conditions, the initial values of parameters were not adjusted to averaged data for large AVM but to those of the largest AVM reported: AVM flow was 500 ml/min, feeder pressure 35 mm Hg, and drainer pressure 15 mm Hg. The resistance value of the nidus (Ravm) was taken as an independent variable and was increased in a stepwise fashion. The resulting changes in vascular resistance in the surrounding brain (Rb) were examined under specific assumed conditions. Accordingly, the model was considered to provide reasonable simulation of the hemodynamic changes during the process of AVM obliteration.
CBF volume increased markedly from 40 to 100 ml/min as perfusion pressure increased from 20 to 60 mm Hg in the model with LAR60/Ps100 (Fig. 2B). As occlusion proceeded, the flow remained constant at 100 ml/min in the presence of autoregulation. Although it increased to 133 ml/min after complete occlusion in the absence of autoregulation, the increment above the physiological value was not >33 ml/min or 16.5 ml 100 g−1 min−1.
The possible mechanisms that would account for the failure of this model to reproduce a marked increase in CBF, a phenomenon that these assumptions could not encompass, include the further dilatation of the vascular structures that were supposed to have already dilated maximally (Barnett et al., 1987; Batjer et al., 1988; Hassler and Steinmetz, 1987), presence of some potential vascular channels that were closed in the lower pressure ranges (Drake et al., 1979), or a shift in LAR (Nagasawa et al., 1993; Young et al., 1994). Simulation study of the former two mechanisms would lack accuracy due to the absence of basic data upon which the model would depend. However, the last possibility would be likely in the vasculature chronically exposed to hypoperfusion. Chronic hypotension in the rat has been documented to increase luminal diameter in association with vascular wall thinning and to decrease the contractile response (Folkow et al., 1971). Miller et al. (1971) demonstrated that the relationship between perfusion pressure and CBF in dogs subjected to hypoxia was almost linear. Even in the low pressure range between 20 and 50 mm Hg, CBF in some of their dogs was several times higher than that under physiological conditions. Young et al. (1994) investigated local CBF in areas adjacent to large AVMs. They suggested a decrease in the LAR with preserved vasoconstricting capacity, although methodological flaws in case selection might have detracted from the value of the evidence on posttreatment hyperemia or “breakthrough”.
In this study, the LAR was simulated to shift from a physiological value of 60 to 50 (LAR50) or 40 (LAR40) mm Hg. The resistance in the surrounding brain (Rb) in the pressure ranges below the LAR value was then decreased from 0.60 to 0.50 or 0.40 mm Hg/ml/min, respectively. When perfusion pressure was assumed to be 100 mm Hg in these dysautoregulatory conditions shown in Fig. 1B, the respective Fb values were 1.66, 2.00, and 2.50 times higher than the physiological value of 100 ml/min, respectively. These values seem to agree well with data obtained under impaired autoregulatory conditions in dogs, as demonstrated by Miller et al. (1971). A marked increase of CBF volume above the physiological value of 100 ml/min could be reproduced in the absence of autoregulatory conditions using the model with low LAR values. When LAR decreased from 60 (Fig. 2B) to 50 (Fig. 3A) or 40 (Fig. 3B) mm Hg, the occlusion rate where ΔP reached the LAR value decreased markedly, and Fb values increased markedly in the absence of autoregulation (Table 2). Decrease in the LAR value of large high-flow AVM could be one of the causes for the pronounced hemodynamic changes referred to as NPPB.
During obliteration procedures in either craniotomy or intravascular procedures, it is important to detect the initial signs of these changes. Young et al. (1994) measured the pressure of AVM feeders and CBF simultaneously both before and after transient increases of systemic blood pressure. Although statistically significant changes could not be documented for the blood flow, a marked increase was noted in one patient, whose resistance value was estimated to be about 0.76 mm Hg/ml/100 g/min, equivalent to an Rb value of 0.36 mmHg/ml/200 g/min in this study. Their patient would have been at higher risk for NPPB than shown by the model of LAR40/Ps100 (Fig. 3B) since the Rb value in the patient was <0.40 value in this model. Results of our study imply that the absence of autoregulation and the resulting hemodynamic changes are more likely when the ΔPf/ΔFb value, an approximation for the Rb value used in this study, is <0.60.
The ΔP or Pf increase is more pronounced in the presence of autoregulation than in its absence (Fig. 3B), which is due to the contraction of resistance vessels under the former condition. Hyperperfusion could be assumed to develop when resistance vessels, having constricted so far, yield and dilate in the autoregulatory pressure range, although this sequence was not simulated in this study. Under this circumstance, a decrease in ΔP and Pf or increase of Fb above the physiological value may be observed as initial signs of hyperperfusion.
Although induced hypotension has been used when hyperperfusion occurs during AVM surgery, the details of its management are still controversial. The effects of decreasing systemic pressure were simulated in this study and represented by the model using LAR60 (LAR60/Ps100, LAR60/Ps80, and LAR60/Ps60). As the systemic pressure decreased from 100 to 80 or 60 mm Hg, the values of initial flow and pressure decreased proportionally to the systemic blood pressure changes (Table 1). The occlusion rate when the perfusion pressure reached 60 mm Hg was 71% in the Ps100 and 93% in the Ps80 models. Perfusion pressure did not reach 60 mm Hg throughout the occlusion procedures in the model using Ps60. Based on these results, it is speculated that induced hypotension could considerably reduce the hemodynamic overload that developed in the process of AVM obliteration. It would be, however, harmful to the brain to reduce the perfusion pressure either too much or too early in the process.
Stepwise reduction of the systemic pressure was simulated to confirm whether hemodynamic overload could be decreased to the average range throughout the course of AVM obliteration. In the model with either LAR60 (Fig. 5A) or LAR40 (Fig. 5B), ΔP and Fb could be maintained at an appropriately low and stable level throughout the procedures. In this study, systemic pressure was reduced in a stepwise fashion by 20 mm Hg steps to maintain ΔP values below the value of LAR. However, this procedure cannot be used in clinical settings since the LAR value is difficult to estimate in individual cases. The avoidance of excessive reduction in systemic pressure requires that ΔP and Fb should not decrease below their corresponding initial values. It was considered reasonable that systemic blood pressure would be reduced so that CBF was maintained just below or near the physiological value of 50 ml 100 g−1 min−1.
In this simulation study, we were able to determine the necessary conditions for producing marked hyperperfusion, the initial sign of NPPB. We also suggested the possibility of its early detection and discussed the usefulness of stepwise reduction of systemic blood pressure. However, cerebral swelling and hemorrhage following hyperperfusion could not be simulated in the model, since they are primarily due to the fragility of the vascular wall, thus, basic data for these phenomena have not been obtained. In addition, the results of this simulation study do not exclude the presence of possible mechanisms for NPPB other than that which we proposed. Although the simulation study has these limitations, it is useful in understanding and speculating upon hemodynamic changes by isolating the point of primary concern among numerous, complexly interrelated factors.