
Abstract
Objective:
The primary objective of this study is to enhance the detection and staging of pressure injuries using machine learning capabilities for precise image analysis. This study explores the application of the You Only Look Once version 8 (YOLOv8) deep learning model for pressure injury staging.
Approach:
We prepared a high-quality, publicly available dataset to evaluate different variants of YOLOv8 (YOLOv8n, YOLOv8s, YOLOv8m, YOLOv8l, and YOLOv8x) and five optimizers (Adam, AdamW, NAdam, RAdam, and stochastic gradient descent) to determine the most effective configuration. We followed a simulation-based research approach, which is an extension of the Consolidated Standards of Reporting Trials (CONSORT) and Strengthening the Reporting of Observational Studies in Epidemiology (STROBE) guidelines for dataset preparation and algorithm evaluation.
Results:
YOLOv8s, with the AdamW optimizer and hyperparameter tuning, achieved the best performance metrics, including a mean average precision at intersection over union ≥0.5 of 84.16% and a recall of 82.31%, surpassing previous YOLO-based models in accuracy. The ensemble model incorporating all YOLOv8 variants showed strong performance when applied to unseen images.
Innovation:
Notably, the YOLOv8s model significantly improved detection for challenging stages such as Stage 2 and achieved accuracy rates of 0.90 for deep tissue injury, 0.91 for Unstageable, and 0.74, 0.76, 0.70, and 0.77 for Stages 1, 2, 3, and 4, respectively.
Conclusion:
These results demonstrate the effectiveness of YOLOv8s and ensemble models in improving the accuracy and robustness of pressure injury staging, offering a reliable tool for clinical decision-making.
Keywords
INTRODUCTION
Pressure injury or ulcer, also known as decubitus ulcer or bedsore, is an injury caused by shear, friction, and prolonged pressure leading to inadequate tissue perfusion, ischemic necrosis, and progressive damage to the skin and underlying tissues, usually over a bony prominence. Typically, these hard-to-heal injuries, which may become chronic, occur in patients who are immobile for a prolonged time due to age or postsurgical immobilization or who suffer from lack of sensation due to spinal cord injury or disease. Pressure injuries pose a severe health concern, contributing to reduced patients’ quality of life, health care professional burnout, and escalating health care costs.1,2 These injuries require frequent medical visits and specialized care within hospitals and long-term care facilities, particularly in patients with comorbidities such as diabetes and obesity, causing pain, infection, extended hospital stays, and increased morbidity and mortality rates. The prevalence of pressure injuries in U.S. hospitals’ intensive care units (ICUs) varies from 13.1% to 30%, with over 80% prevalence in bedridden patients. Each year 2.5 million Americans develop pressure injuries, with over 60,000 deaths and an estimated annual cost of $9–11 billion.2–4
Fateme Fayyazbakhsh

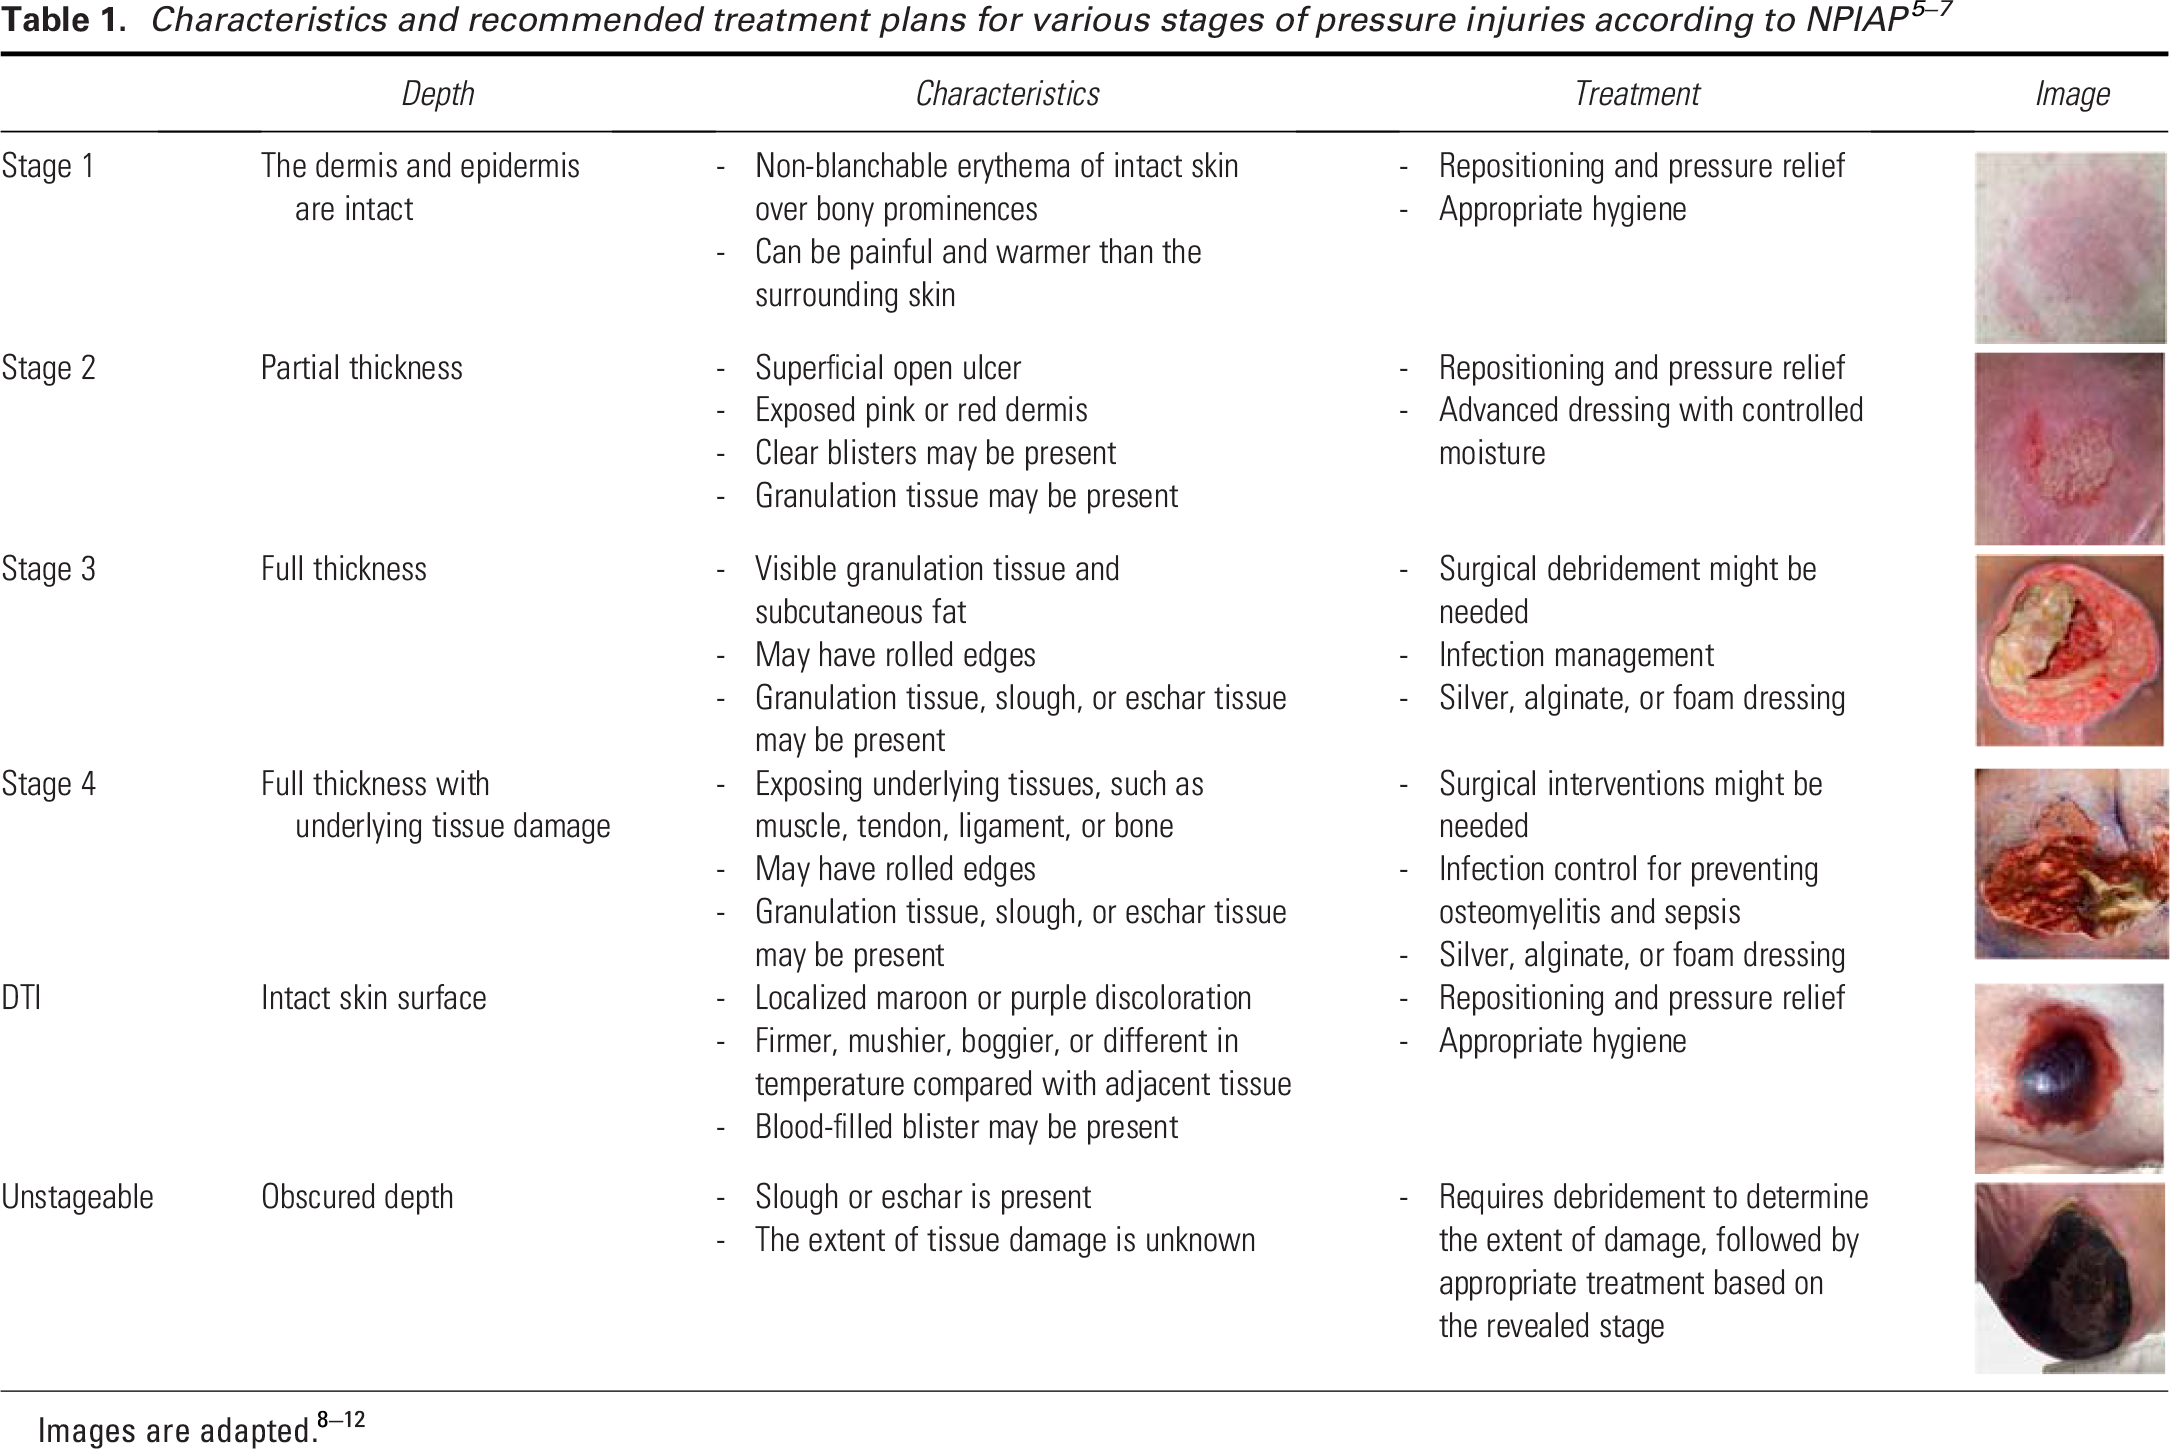
According to the National Pressure Injury Advisory Panel (NPIAP), pressure injuries are classified into four distinct stages based on the severity and depth of the damage.5–7 Table 1 outlines the distinct characteristics and recommended treatment plans for each stage.8–10 Apart from these recognized stages, pressure injury guidelines acknowledge two other conditions: (1) deep tissue injuries (DTIs) and (2) Unstageable ulcers.
Early and accurate staging of pressure injury serves as the foundation for the timely diagnosis of vulnerable areas and informed clinical decisions, preventing damage progression. In contrast, misclassification can lead to delayed healing, increased patient morbidity, and a higher burden on health care resources. As highlighted by Brennan, inconsistencies in staging, inadequate training, and varying levels of clinician expertise contribute significantly to these challenges, emphasizing the need for standardized assessment protocols and enhanced education for health care providers. 11 The current wound assessment methods often rely on subjective visual evaluations by health care professionals, suffering from several limitations including pain and discomfort, lengthy processes, inaccuracy, and subjectivity,6–8,12–15 which can affect the choice of treatment plans and lead to suboptimal outcomes. The importance of accurate assessment is further emphasized by research showing significant discrepancies in pressure injury identification—one study found a 54% disagreement between direct care nurses and wound experts on pressure injury staging, highlighting the challenges in achieving accurate classifications. 16 These discrepancies in assessment can have serious consequences, as pressure injuries are now the most common diagnosis in malpractice claims involving ICU nursing care with a hospital as the defendant. 11
The use of artificial intelligence (AI) in wound care, particularly image-based deep learning algorithms, could standardize wound assessment with enhanced accuracy. Early applications of AI in wound care started gaining traction in the 2010s with the rise of machine learning algorithms capable of analyzing medical images.17,18 AI-assisted wound assessment tools offer significant time-saving advantages by automating routine wound assessments, thus reducing the workload on health care providers and allowing them to focus on treatment. They also improve remote monitoring capabilities, which is essential for patients in rural or underserved areas. 19 However, while AI offers great promise in improving wound care, challenges related to data availability, model transparency, and generalization remain significant barriers to widespread adoption. 20 Many AI models require large, annotated datasets for training, which are difficult to access due to privacy concerns and variability in data quality. AI algorithms may struggle with generalizability, particularly when applied to diverse populations or less common medical conditions, leading to potential bias in diagnostic outcomes.12,21,22 In addition, the variability in skin tones, pressure injury locations, the presence of confounding factors such as moisture-associated skin damage (MASD), the similarity of pressure ulcer Stage 2 with MASD and Stage 3, and the presence of shadows further complicate the staging process. 23 This variability makes it challenging to create a robust and generalizable model capable of accurately staging pressure injury across diverse populations.21,22,24,25
Several AI algorithms have been developed and applied to wound care systems over the past decade, focusing on improving diagnostic accuracy, consistency, and predictive capabilities. Early machine learning algorithms, such as decision trees (rule-based models used for classification tasks) and adaptive boosting (an ensemble method that combines multiple weak classifiers to improve accuracy, e.g., AdaBoost), were implemented in the late 2000s to classify wound types. In the 2010s, convolutional neural networks (CNNs) became widely adopted for tasks such as wound segmentation and classification due to CNN’s ability to process image data efficiently. Other machine learning models, including general linear regression, naïve Bayesian classifiers, random forest, k-nearest neighbor, and support vector machines, have also been applied to wound assessment tasks.26–31 Among these machine learning models, U-Net, a specialized type of CNN designed specifically for biomedical image segmentation, has shown exceptional accuracy in identifying and analyzing wounds. 32 However, these algorithms’ complex architecture also demands high computational power and prolonged training times, reducing their efficiency in fast-paced clinical settings. 33 Faster Region Based Convolutional Neural Networks (R-CNN), on the contrary, is more accurate in detecting wound boundaries and differentiating between wound and healthy tissues, but it demands high processing power and time for training. 34 In contrast, YOLO (You Only Look Once) has emerged as a more recent AI solution for real-time object detection. Unlike traditional models, YOLO operates faster and requires fewer computational resources because it processes the entire image in one go, instead of dividing it into regions like R-CNNs. YOLO series has evolved significantly, starting with YOLOv1, which framed object detection as a single regression problem, predicting bounding boxes and class probabilities directly from images in one evaluation. This approach outperformed traditional two-stage detectors such as Mask R-CNN in speed, although it struggled with small object detection. 35 YOLOv2 introduced anchor boxes for enhanced handling of varying object sizes, along with batch normalization for stabilized training and improved feature extraction. 36 YOLOv3 advanced the model further by integrating Darknet-53, a deeper architecture with residual connections, and multi-scale predictions for better detection of various object sizes. 37 YOLOv4 optimized the architecture with CSPDarknet53, reducing computational complexity while enhancing accuracy through features such as mish activation and spatial pyramid pooling. 38 YOLOv5 prioritized usability and deployment flexibility, offering models of various sizes and introducing auto-anchor computation for better bounding box predictions. 39 YOLOv6 was optimized for faster image analysis and improved accuracy, making it suitable for real-time applications. 40 YOLOv7 introduced architectural enhancements to improve efficiency in detecting and identifying specific regions of interest in images, which is essential for accurate and reliable medical image analysis. 41 YOLOv8 marked a significant advancement with its unified and modular architecture that supports object detection, and instance segmentation. YOLOv8 utilizes the CSPDarknet53 backbone, which serves as the main structure of the model and is responsible for identifying key patterns and features in an image. It also employs a decoupled head architecture, acting as the “decision-maker” that separately handles two tasks: identifying what the object is (classification) and determining where it is located (bounding box prediction). This separation enhances the model’s accuracy and efficiency in detecting pressure injuries in medical images. Traditional object detection models rely on anchor boxes, which are predefined rectangular regions of different sizes and shapes placed across an image to predict object locations. However, anchor boxes add computational complexity and may not align well with irregularly shaped objects such as wounds. YOLOv8 introduces an anchor-free mode, enabling direct prediction of object centers, sizes, and shapes without predefined anchor boxes. This approach simplifies the detection process, making it faster and more efficient, especially for real-time medical image analysis. 42 However, despite its speed and efficiency, YOLOv8 still has room for improvement in accuracy, especially in wound staging compared with models such as U-Net or Faster R-CNN.
Lau et al. developed an AI-enabled smartphone app for real-time pressure injury detection using YOLOv4 using a dataset of 190 pressure injury images. 43 Despite the high prediction specificity in general wound detection (85.1–100%), they reported variable sensitivity at 73.3% (Stage 1), 37% (Stage 2), 76.7% (Stage 3), 70% (Stage 4), and 55.6% (Unstageable). In another work, Aldughayfiq et al. used YOLOv5 for pressure injury staging, achieving an overall mean average precision of 76.9% and class-specific prediction rates at 100%, 17%, 65%, and 82% for Stages 1, 2, 3, and 4, respectively. 44 Both works exhibited poor detection rates for Stage 2 pressure injury, which is often compromised in various AI-powered systems due to color similarities with Stages 1 and 3, as all are primarily characterized by redness. To overcome these challenges, we have developed a well-balanced dataset of pressure injury images for training YOLOv8 algorithms, as described in the present paper.
The primary objective of this study is to enhance the detection and staging of pressure injuries using YOLOv8’s advanced capabilities for precise image analysis utilizing a dataset of 720 high-quality images. To ensure unbiased evaluation, we will test the model on an independent image set that was not used in training. Five YOLOv8 models (n, s, m, l, and x) and five optimizers (Adam, AdamW, NAdam, RAdam, and stochastic gradient descent [SGD]) will be employed, along with hyperparameter tuning for a comprehensive analysis. Final predictions will be generated using ensemble methods, including hard and soft voting, and weighted voting averages for models and classes. This approach addresses data scarcity and variability through rigorous validation, aiming to provide clinicians with a reliable tool for pressure injury staging, ultimately contributing to better patient care and outcomes.
INNOVATION
Deep learning offers significant promise in pressure injury staging by eliminating challenges associated with subjective human assessments. However, its performance often depends on large datasets for reliable predictions. The YOLOv8 model, with its five variants, is designed to handle different dataset sizes and optimize results. In this study, we train and test all YOLOv8 variants to identify the best-performing model. Furthermore, we develop an ensemble system combining all variants, which processes a single input image and uses voting strategies to generate a final prediction with the highest confidence. The summary graphical illustration of our study is shown in Fig. 1.
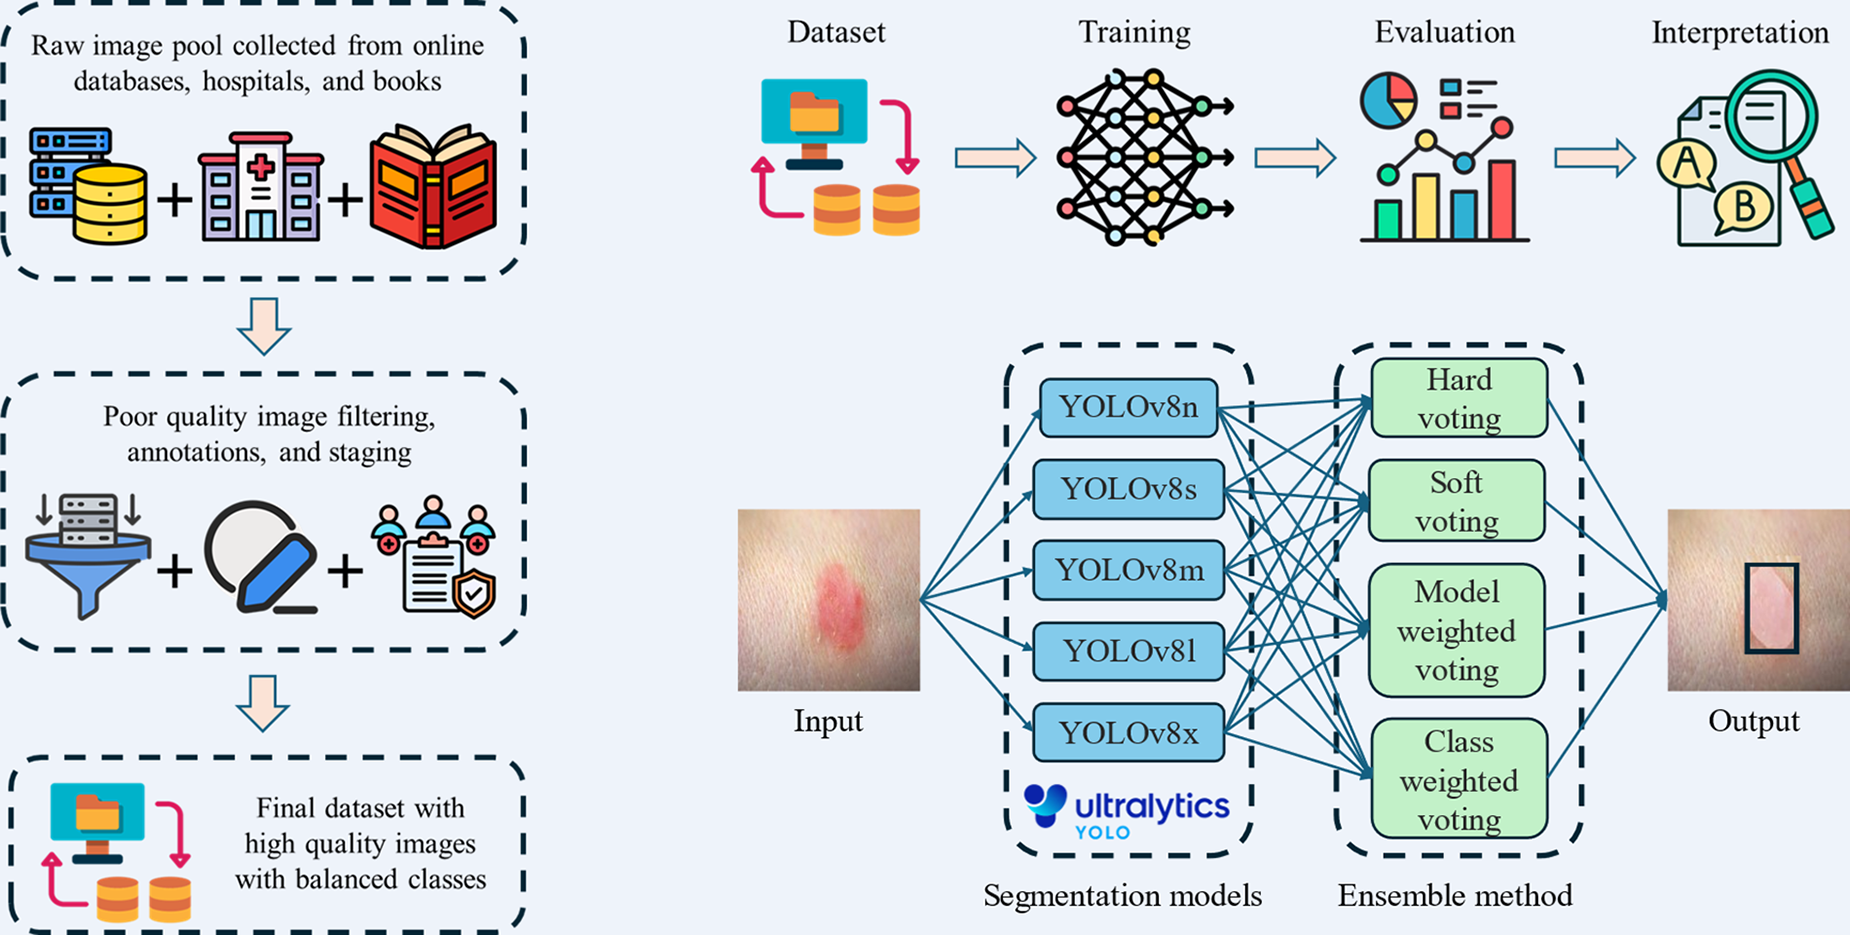
Summary graphic illustration of dataset preparation, workflow, and training of YOLOv8 models. YOLOv8, You Only Look Once version 8.
CLINICAL PROBLEM ADDRESSED
Pressure injuries, a common complication in immobile or critically ill patients, are challenging to stage accurately due to overlapping visual features and variability in skin tone and injury presentation. Current manual assessment methods rely on subjective visual evaluations, leading to inconsistent and inaccurate staging, especially for complex cases. Misclassification delays appropriate treatment, increasing the risk of complications such as infections, extended hospital stays, and higher mortality rates. In addition, confounding factors such as MASD and poor image quality exacerbate the difficulty of accurate diagnosis. Limited access to standardized training and diagnostic tools further amplifies these challenges in clinical settings. This work directly addresses these issues by leveraging AI-powered models to provide consistent, accurate, and efficient staging, improving patient outcomes and reducing the burden on health care professionals.
MATERIALS AND METHODS
We applied a Simulation-Based Research approach, an extension of the Consolidated Standards of Reporting Trials (CONSORT) and Strengthening the Reporting of Observational Studies in Epidemiology (STROBE) guidelines (PMID: 27465839), across all procedures in this study, including dataset preparation, algorithm implementation, training, validation, and evaluation, to ensure methodological rigor, transparency, and reproducibility. 45
Data collection
We prepared a final dataset of 720 images, selected from an initial pool of 1,500 images. These images were sourced from physicians, Google search, books, and databases such as Medetec and Kaggle.
Data selection criteria
In our study, the selection of 720 images from an initial pool of 1,500 images followed a rigorous process to ensure quality, relevance, and diversity. Only high-resolution images with proper focus, adequate lighting, and minimal noise were included, while images with poor resolution, shadows, inappropriate lighting, or complex and irrelevant backgrounds were excluded. The images were carefully selected to represent the six stages of pressure injuries (DTI, Stages 1–4, and Unstageable) as defined by NPIAP guidelines, ensuring clarity and clinical relevance. We excluded skin tears and MASD from the pressure injury staging, as suggested by medical practitioners. 46 In addition, the dataset was curated to include diverse representations across severity stages, enhancing the robustness and generalizability of the dataset. To minimize potential bias, the final image selection was reviewed and validated by experienced wound care clinicians. A well-balanced dataset can be observed for all stages with small, medium, large, and jumbo size pressure injury images, as shown in Fig. 2.
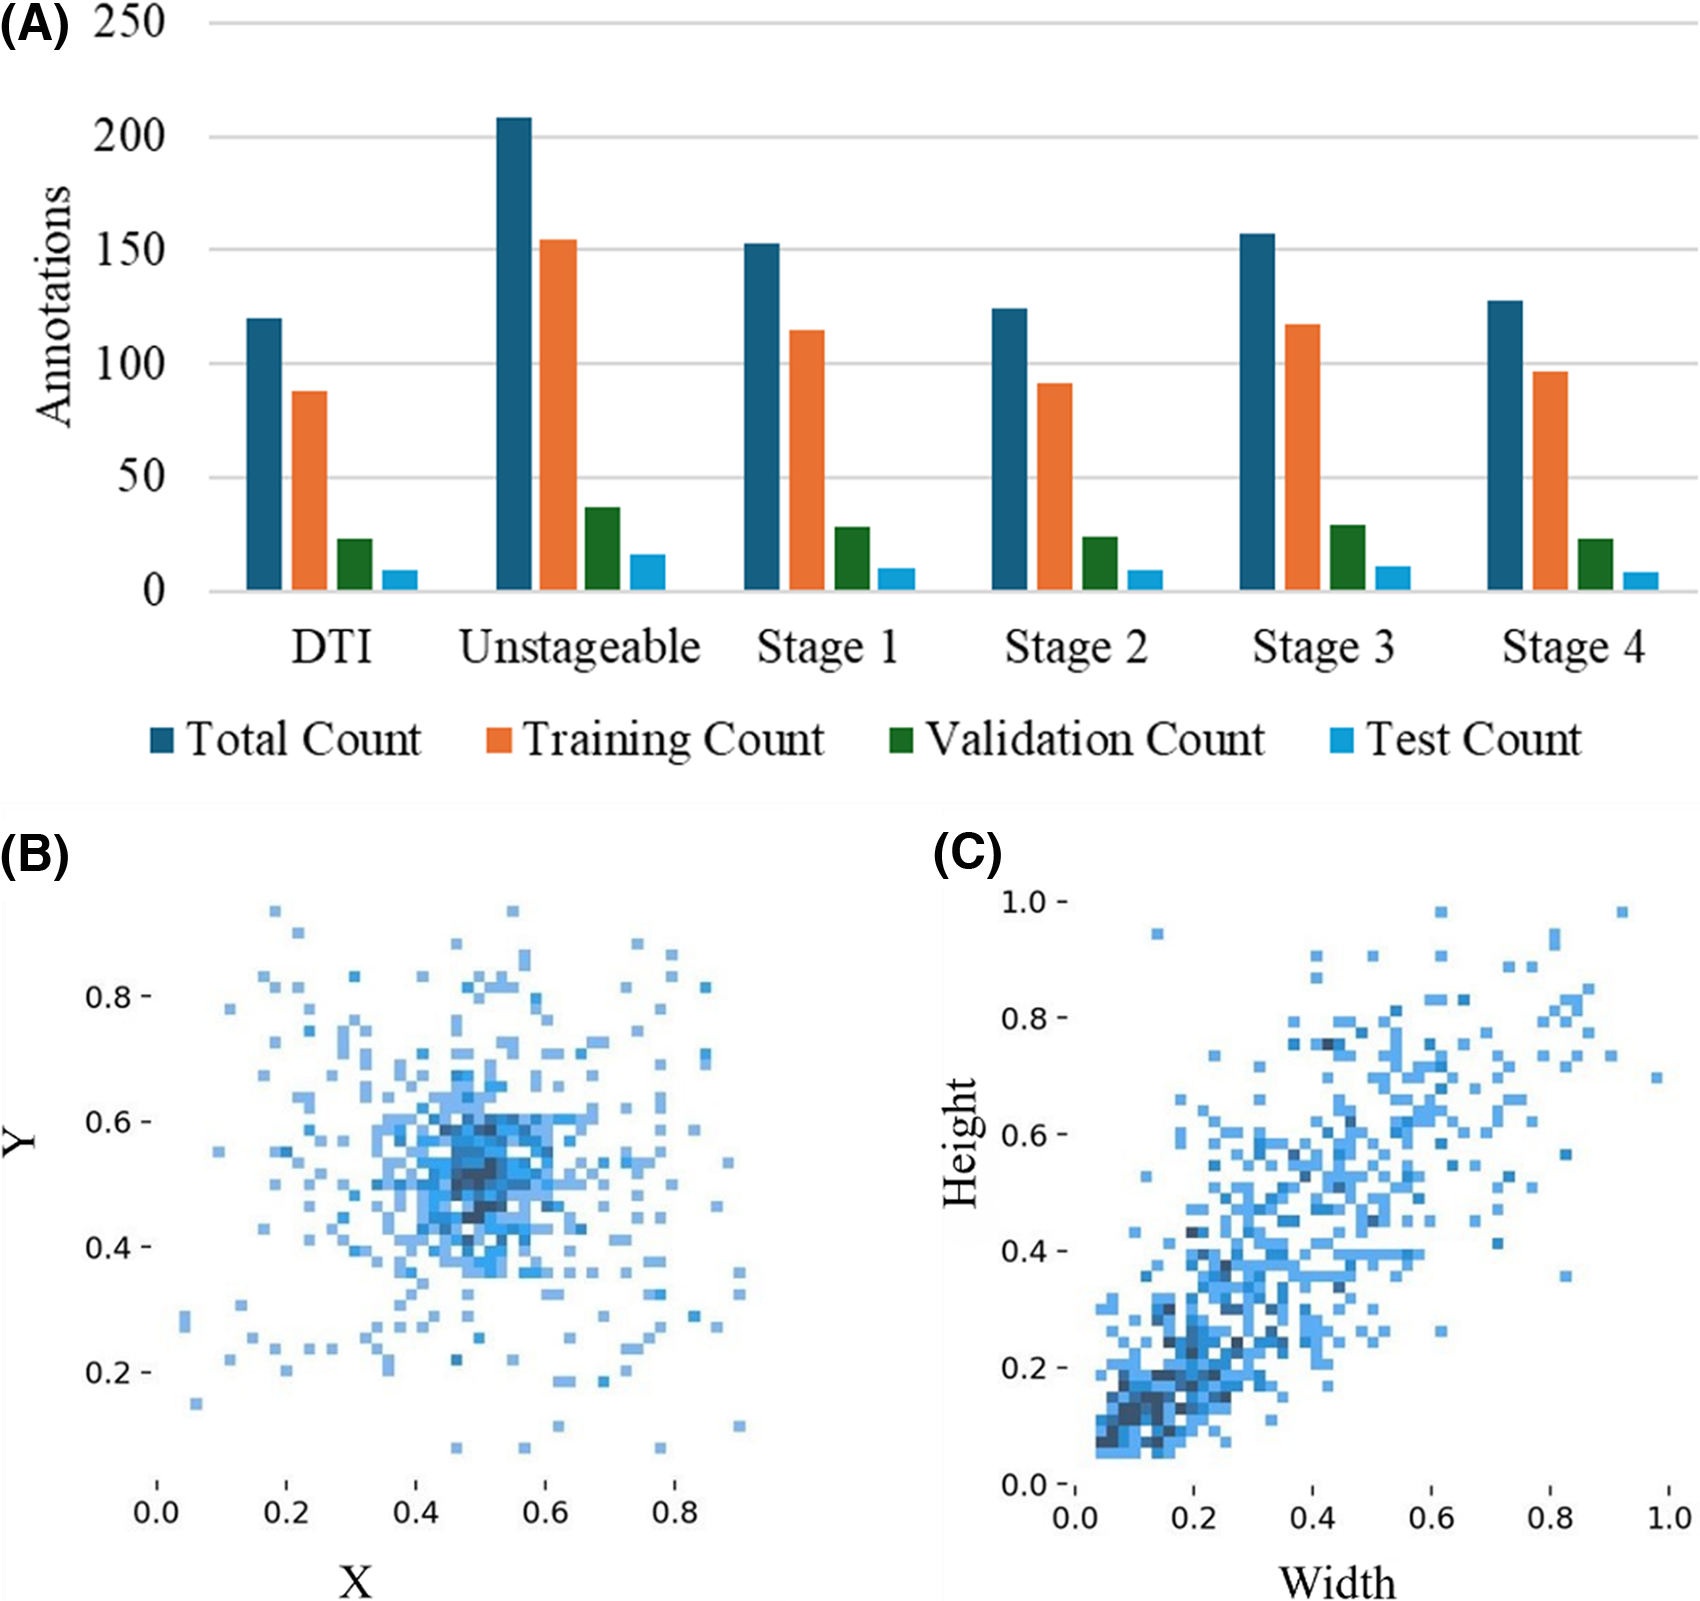
Visualization of annotation distribution and bounding box parameters for pressure injury stages:
Dataset clinical validation
All images in our dataset were uploaded to online assessment forms, which were then distributed to wound care clinicians with expertise in pressure injury in our team. Each image was independently evaluated by at least three clinicians, who provided their diagnosis and staging based on NPIAP guidelines. In most cases, the clinicians’ assessments aligned, allowing us to finalize the injury stage with confidence. However, in a few cases where discrepancies arose, we created follow-up online forms to collect detailed reasoning and clarifications from the clinicians involved. This iterative process was complemented by a series of team meetings and discussions to collectively review the conflicting assessments, analyze the rationale behind the differing opinions, and reach a consensus on the final diagnosis for each ambiguous image.
Digital annotation
We used Roboflow 47 to annotate these images according to their relevant stages. We followed six different classes for pressure injury staging, as recommended by the NPIAP, described in Table 1. The stages included are DTI, Stages 1, 2, 3, 4, and Unstageable.
Annotations were performed according to the guidelines, and the dataset was reviewed by physicians. We also balanced the number of images for each stage to ensure an even distribution. Our dataset includes diversity in terms of age, skin color, sex, and pressure injury location. During preprocessing, the images were converted to 650 × 650-pixel resolution Red, Green, Blue (RGB) color images. No augmentations were performed.
Model architecture
The YOLOv8 architecture leverages its strong predecessors to enhance object detection tasks. At its core, the CSPDarknet backbone acts like the “eyes” of the model, scanning the image and identifying key features and patterns. 48 These features are then refined and combined by the path aggregation network neck, ensuring small and large details are captured accurately. 49 YOLOv8 uses a decoupled head architecture, which separates two key tasks: identifying what the object is (classification) and determining where it is located (bounding box prediction). To improve predictions during training, YOLOv8 also uses enhanced loss functions, and mathematical tools to reduce errors in identifying and locating objects. 50 YOLOv8 is developed by Ultralytics, a company specializing in AI tools for image analysis. 42 The model’s efficiency is often described using floating point operations per second (FLOP), a measure of how many calculations per second are executed to process an image. Larger models with higher FLOPs, such as YOLOv8x, are more accurate but require more computing power. Table 2 lists key performance parameters for the five YOLOv8 segmentation (YOLOv8x-seg) models assessed on the Common Objects in Context (COCO) val2017 dataset.52,53 The models’ performance improves as the model size increases, with YOLOv8x-seg achieving the highest mean average precision at intersection over union (IoU) ≥0.5 (mAP50) of 53.4%, and mAP50–95 of 43.4%, but at the cost of significantly higher computational load. While YOLOv8n-seg offers the fastest inference time, its accuracy is lower compared to the larger models such as YOLOv8x-seg, which offers higher detection performance with higher FLOPs. These trade-offs among speed, accuracy, and computational load provide flexibility depending on the application need.
Performance of different YOLOv8 segmentation models trained on COCO val2017 dataset 51
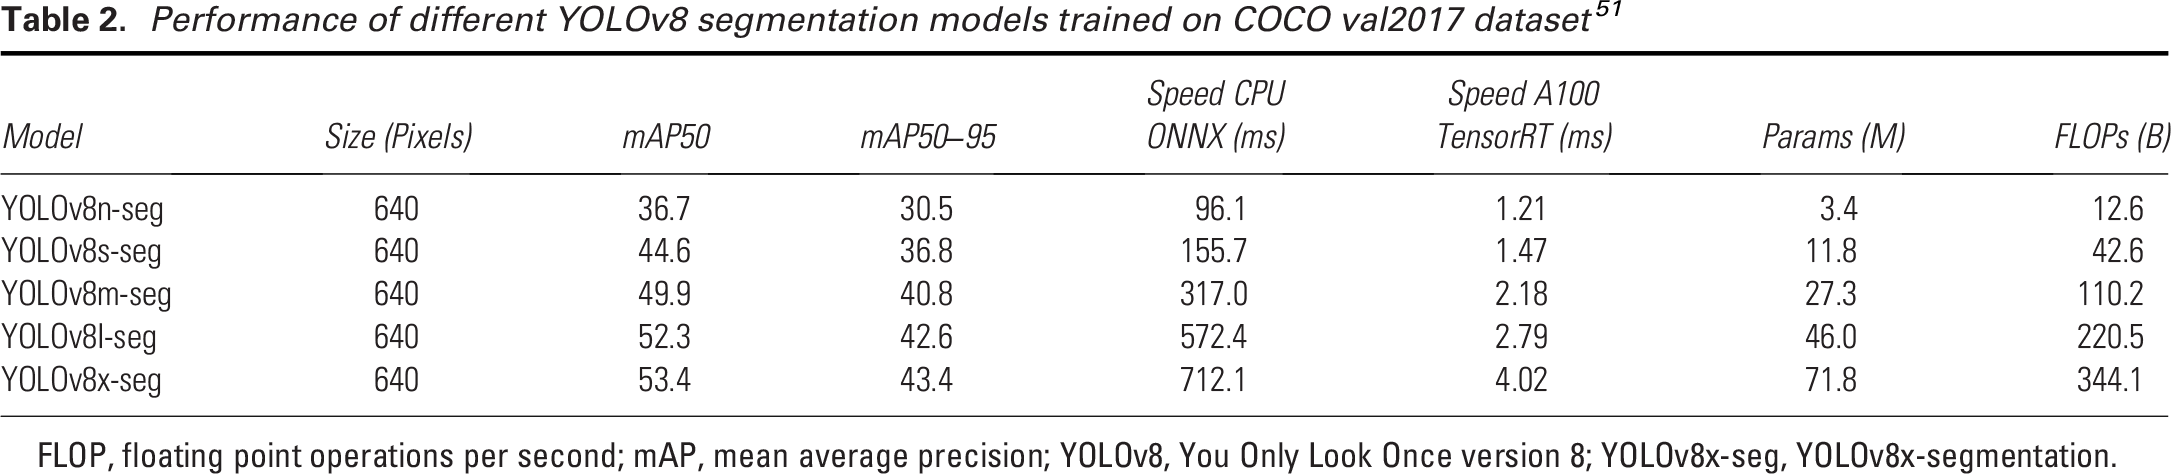
FLOP, floating point operations per second; mAP, mean average precision; YOLOv8, You Only Look Once version 8; YOLOv8x-seg, YOLOv8x-segmentation.
Training process
During the training process, all YOLOv8 models were tested on the dataset, and their performance was evaluated. An optimizer is essential for training deep learning models. It updates the model’s weight (the learned parameter values, essentially the knowledge gained by the model during training that determines the influence of input features on output predictions), ensures convergence towards optimal solutions, and helps improve performance over time. The study evaluates five different optimizers—Adam, AdamW, NAdam, RAdam, and SGD—to select the one that best enhances the model’s performance. Adam and AdamW are popular adaptive optimizers, with AdamW offering improved regularization by decoupling weight decay from the learning rate.51,54 NAdam extends Adam by incorporating Nesterov momentum, which can accelerate convergence, while RAdam stabilizes training with rectified adaptive learning rates, addressing some of the shortcomings of Adam.55,56 Lastly, SGD is a traditional optimizer known for its simplicity and effectiveness, particularly in large-scale data and deep learning tasks, though it may converge more slowly compared to adaptive methods.
57
The batch size (n = 16) and image size (640 × 640) were kept constant throughout the process. Once the best optimizer was identified, specific hyperparameters were tuned using genetic algorithms to further optimize its performance. A hyperparameter is a setting in a machine learning model that is defined before training and controls of the learning process. Unlike model parameters, which are learned from data, hyperparameters (such as learning rate, batch size, and number of epochs) are manually set and they significantly impact the model’s performance. We used the fitness score, defined in Equation 1, to monitor the hyperparameter tuning process throughout the training.

The fitness score allowed us to evaluate the model’s performance comprehensively by combining key metrics and ensuring optimal tuning across different configurations. The learning rate is a key parameter in this process, controlling how much the model’s weights are adjusted in response to the loss gradient. Weight decay was applied to regularize the model, preventing overfitting by penalizing excessively large weights. Momentum was set to accelerate the convergence by guiding gradient vectors more efficiently. In addition, warmup momentum was implemented to gradually increase momentum in the early stages of training, leading to smoother and more stable learning. To focus solely on optimizing the model with raw training data, mosaic augmentation was disabled in this setup, avoiding synthetic variations.
The training was conducted in a robust computing environment, featuring a 12th Gen Intel(R) CoreTM i7-12650H processor with a clock speed of 2300 MHz, 10 cores, and 16 logical processors. The system was equipped with 16 GB of RAM and an NVIDIA GeForce RTX 3060 GPU, providing substantial computational power for handling complex deep learning tasks. The workflow is shown in Fig. 1. No electronic laboratory notebook was used in the workflow.
Evaluation metrics
We used several types of YOLOv8 losses during both the training and validation phases to check convergence. Box loss (box_loss) measures the error between the predicted and ground truth bounding boxes, ensuring accurate localization of objects. Segmentation loss (seg_loss) evaluates the accuracy of pixel-wise segmentation, comparing predicted masks to ground truth masks for each object. Classification loss (cls_loss) quantifies the error in predicting the correct class label for each detected object. Finally, distribution focal loss (dfl_loss) helps improve the precision of bounding box regression by focusing on the most relevant box coordinates during training. Each of these losses plays a crucial role in guiding the model to make more accurate predictions throughout the training and validation processes.
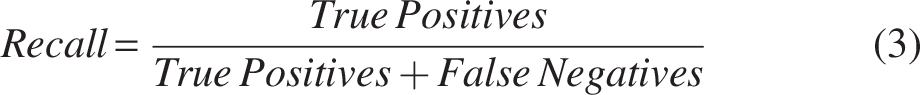
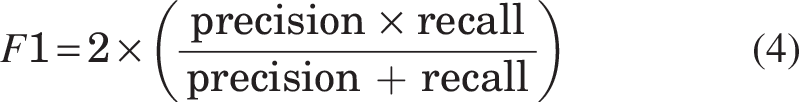
The model’s performance is evaluated using precision, recall, and the F1 score, which are key metrics in classification tasks. Precision measures the accuracy of positive predictions (Equation 2), defined as the ratio of true positives to total predicted positives. Recall (Equation 3) assesses the model’s ability to identify all relevant instances, calculated as the ratio of true positives to actual positives. The F1 score (Equation 4) balances precision and recall, particularly useful in imbalanced datasets, where accuracy alone is insufficient. These metrics are discussed alongside the confidence level, which refers to the probability or likelihood assigned by a model to its predictions. It indicates how certain the model is about its classification or prediction.

Ensemble model
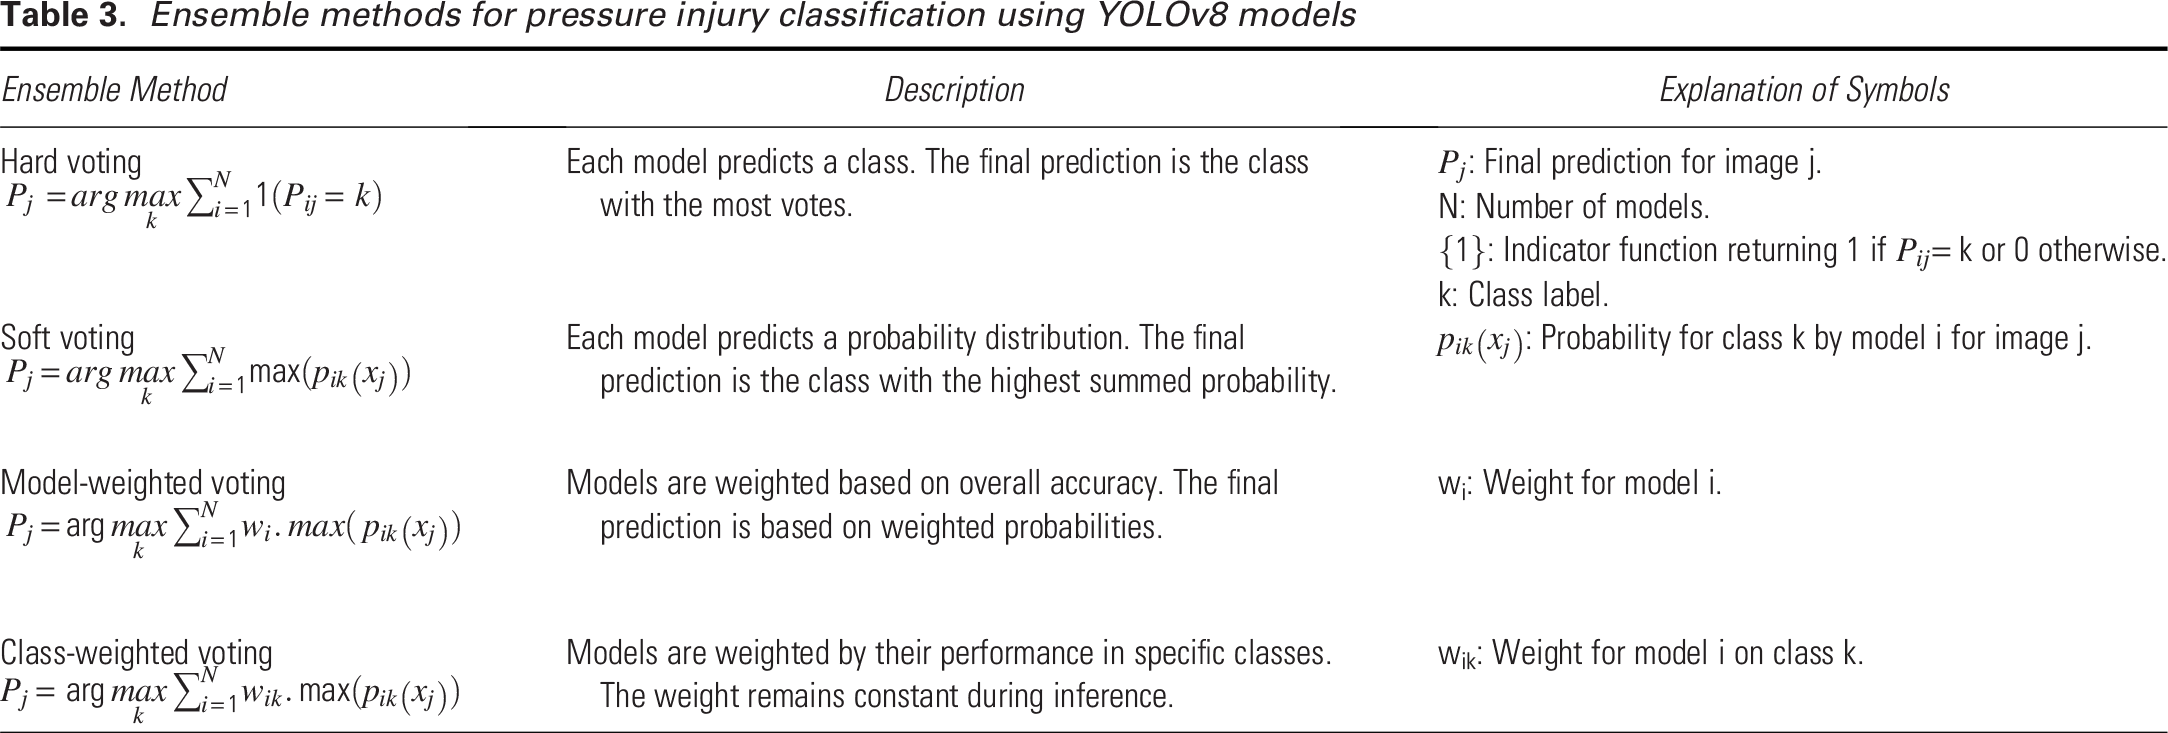
Using a single YOLOv8 model comes with several limitations, as it may perform well for certain stages but poorly for others, leading to inconsistent results. A single model can struggle to generalize across diverse datasets and varying conditions, resulting in reduced performance when handling unfamiliar scenarios. It is also prone to errors due to training biases, increasing the likelihood of missed detections or false positives. Our ensemble approach, as shown in Fig. 3, addresses these weaknesses by combining predictions from multiple YOLOv8 models, each trained independently. When unseen images are input into the ensemble, each YOLOv8 variant processes them separately, and the predictions are then aggregated through various voting strategies—hard voting, soft voting, model-weighted voting, and class-weighted voting described in Table 3. This ensemble approach utilizes the strengths of each YOLOv8 model, enhancing overall detection accuracy and performance across different stages and conditions.
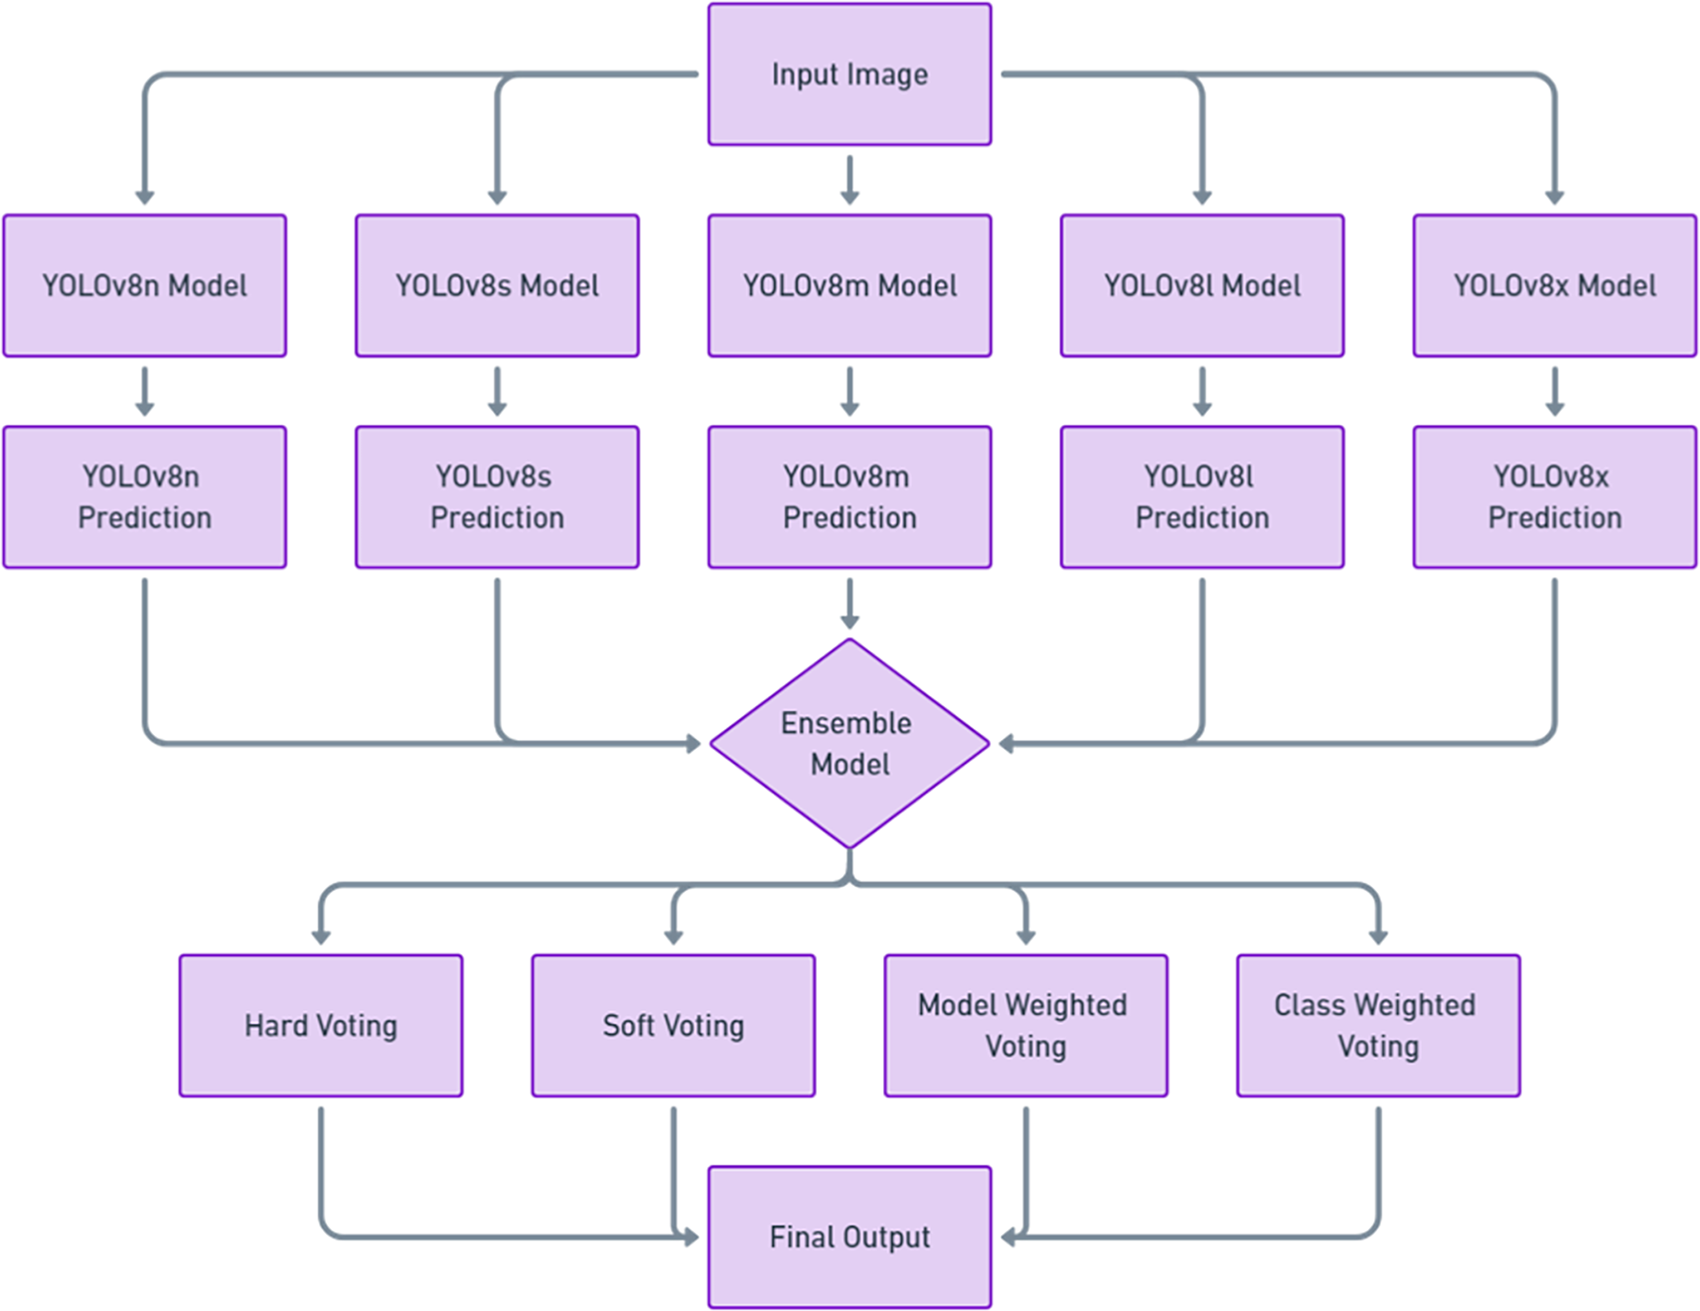
Ensemble model architecture for YOLOv8 variants.
Ensemble methods for pressure injury classification using YOLOv8 models
RESULTS AND DISCUSSION
Performance check of YOLOv8 models
In selecting the best YOLOv8 model, we considered five variants: YOLOv8n, YOLOv8s, YOLOv8m, YOLOv8l, and YOLOv8x. These models differ in computational demand, increasing progressively from YOLOv8n to YOLOv8x, as the number of parameters and architectural complexity grows (Table 2). Larger models typically offer higher accuracy on extensive datasets such as COCO val2017. 53 However, with smaller datasets, larger models are more susceptible to overfitting and reduced generalization. In contrast, smaller models, with fewer parameters and simpler architectures, may exhibit better generalization and performance on limited datasets due to their lower risk of overfitting. 58 We evaluated the performance of these five YOLOv8 models on stage-specific predictions with our dataset, and the normalized accurate predictions are presented in Table 4.
Normalized accurate predictions for different YOLOv8 models across pressure injury stages using a limited dataset (n = 720, batch size =16, epoch =150)
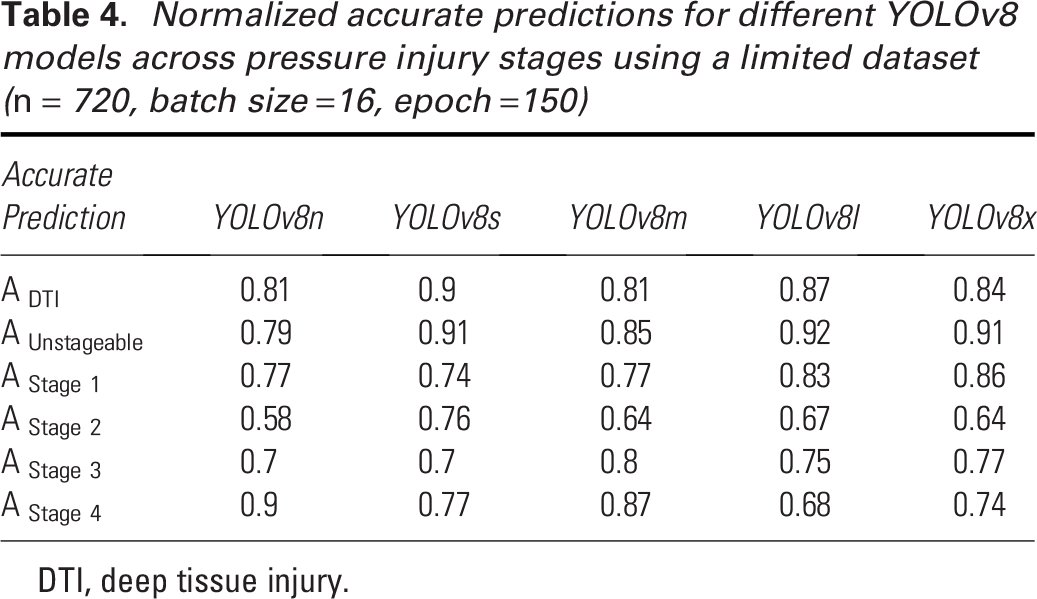
DTI, deep tissue injury.
The YOLOv8 models—YOLOv8n, YOLOv8s, YOLOv8m, YOLOv8l, and YOLOv8x—achieved average accuracies of 0.76, 0.80, 0.79, 0.79, and 0.79, respectively. YOLOv8n, the smallest model in the group, had the lowest overall accuracy, which can be attributed to its smaller architecture. Despite this, it excelled in detecting Stage 4 pressure injuries with an accuracy of 0.90 but struggled with Stage 2 detection, achieving only 0.58. This issue with Stage 2 detection is not unique to YOLOv8n, as earlier versions of YOLO, such as YOLOv5, also exhibited similar performance drops in Stage 2 detection. 44 YOLOv8s, on the contrary, stood out with the best performance, particularly in detecting DTI and Unstageable injuries, with accuracies of 0.90 and 0.91, respectively. Moreover, it maintained consistent performance across all pressure injury stages, with no stage falling below 0.70, making it the most reliable model in this regard. The YOLOv8m model also performed well overall but encountered difficulties with Stage 2 detection, where it scored 0.64. YOLOv8l demonstrated strong results for DTI (0.87), Unstageable injuries (0.92), and Stage 1 detection (0.83), but it underperformed for Stage 2 (0.67) and Stage 4 (0.68). Similarly, YOLOv8x achieved high accuracies for DTI (0.84), Unstageable injuries (0.91), and Stage 1 (0.86) but struggled with Stage 2 (0.64).
These tests highlight a common trend: larger models, such as YOLOv8l and YOLOv8x, require larger datasets to fully leverage their capacity and improve performance. Without a very large dataset, these models do not show significant performance gains over smaller models such as YOLOv8n and YOLOv8s. Therefore, for pressure injury detection with a limited dataset, simpler architectures such as YOLOv8s are recommended, as they offer better consistency and higher accuracy across stages.
Hyperparameter tuning
Proper optimizer selection is important in deep learning as it directly impacts the model’s ability to converge efficiently and accurately. In Table 5, we compare the performance of five different optimizers—Adam, AdamW, NAdam, RAdam, and SGD—on YOLOv8n for pressure injury detection. AdamW emerges as the top-performing optimizer, achieving the highest mAP (0.81) and a strong F1 score (0.79), showing consistent performance across different pressure injury stages. Its standout result is in Stage 4 detection, where it achieves the highest accuracy (0.90), along with solid performance in detecting DTI (0.81) and Stage 1 injuries (0.77). However, it slightly underperforms in detecting Unstageable injuries (0.79), compared with SGD, which achieves the highest accuracy (0.91) in that category. SGD also demonstrates impressive precision (0.83) and the highest overall mAP (0.83), making it highly effective in detecting Unstageable injuries and Stage 1 injuries (0.74). However, its lower recall (0.649) suggests it may miss some true positives, and its performance in Stage 2 detection (0.64) lags behind RAdam (0.70). Adam, while solid across most metrics with a mAP of 0.794 and an F1 score of 0.77, struggles in Stage 4 detection, achieving only 0.58 accuracy, which is notably lower compared to AdamW and RAdam. NAdam delivers the weakest overall performance, with a low mAP (0.74) and recall (0.69), struggling especially with Stage 2 (0.45) and Stage 4 detection (0.55). RAdam, while showing strong performance in Stage 4 (0.81) and DTI detection (0.77), has mixed results, particularly in Stage 2 detection (0.70), indicating some inconsistency across the stages. Overall, AdamW and SGD stand out as the most reliable optimizers, with AdamW offering the best balance across stages and SGD excelling in precision and Unstageable injury detection. We have decided to implement AdamW in our next steps.
Testing different optimizers on YOLOv8n performance for batch size = 16, image size = 640 × 640 pixels, epoch =150
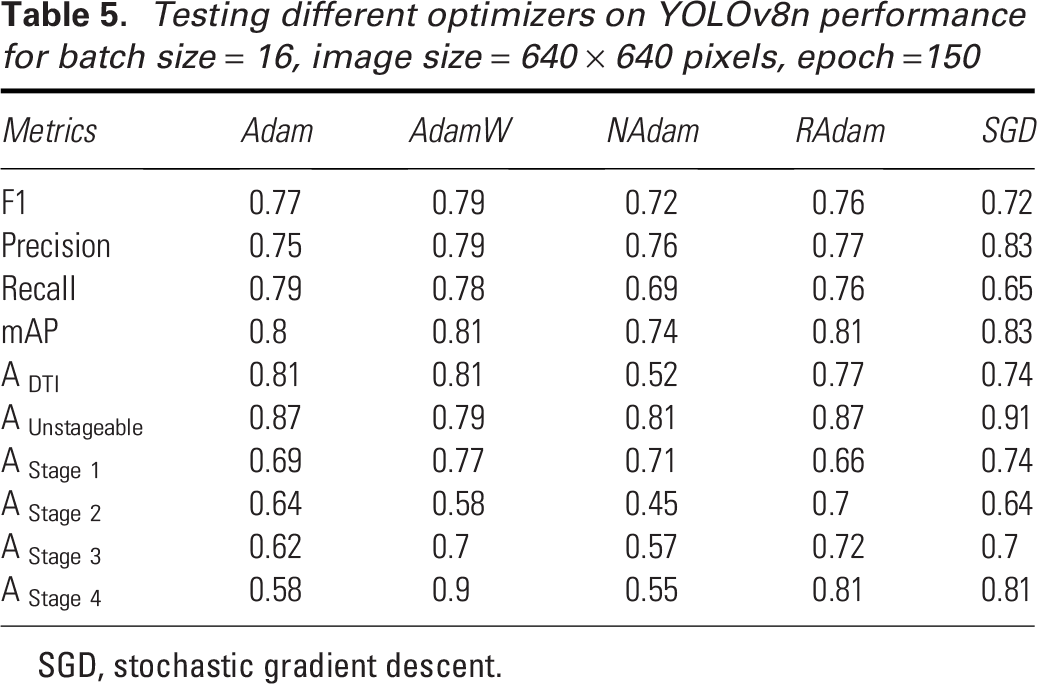
SGD, stochastic gradient descent.
After selecting the optimizer, hyperparameter tuning is crucial for achieving the best performance in YOLO models. For YOLOv8s, the best model in this experiment, we utilized a genetic algorithm with mutation for hyperparameter tuning. This process involves iteratively selecting, mutating, and evolving a population of hyperparameter sets, aiming to improve the model’s fitness score. By allowing the genetic algorithm to explore a wide range of hyperparameters, we ensure that the best-performing configuration is selected. Each iteration represents an evaluation of a specific set of hyperparameters, with the fitness function measuring the model’s performance. As shown in Fig. 4, the fitness score improves rapidly during the initial 50 iterations, indicating the genetic algorithm’s effectiveness in quickly finding better hyperparameter configurations. The fitness moving average continues to rise steadily between iterations 50 and 100, showing consistent improvements in the model’s performance. After iteration 100, the fitness stabilizes, suggesting that the model has converged towards an optimal set of hyperparameters. The final set of hyperparameters is provided in Table 6. This hyperparameter tuning improved the YOLOv8s performance of predicting pressure injury stages with our dataset from 76.96% to 82.32% for recall, 82.31% to 84.16% for mAP50, and 64.18% to 66.46% for mAP50–95.
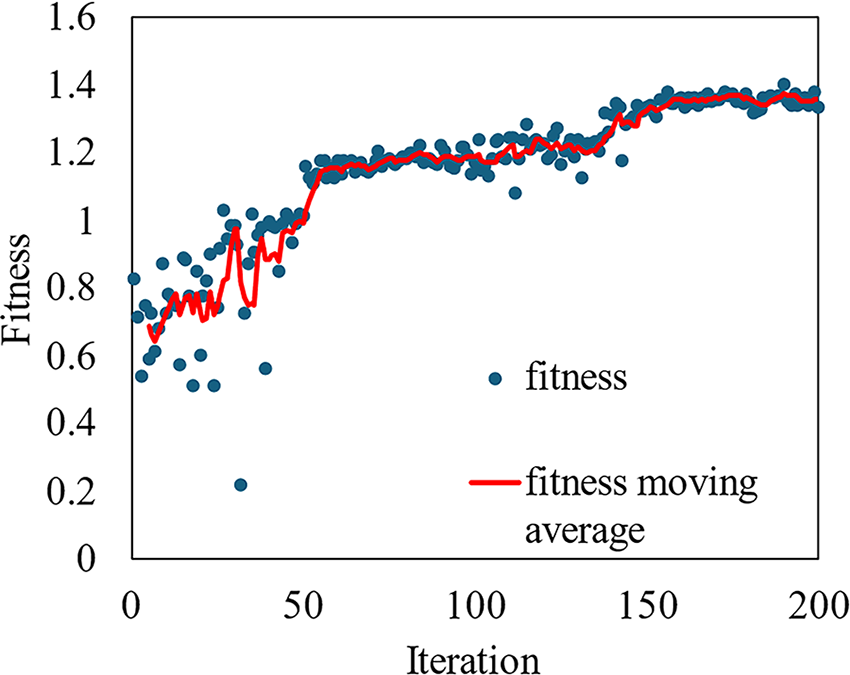
Fitness versus iteration for the hyperparameter tuning of YOLOv8s (optimizer = AdamW, batch size = 16, epoch = 70/iteration, iteration = 200).
Hyperparameter optimization with AdamW optimizer (batch size =16, epoch = 70/iteration, and iterations = 200)
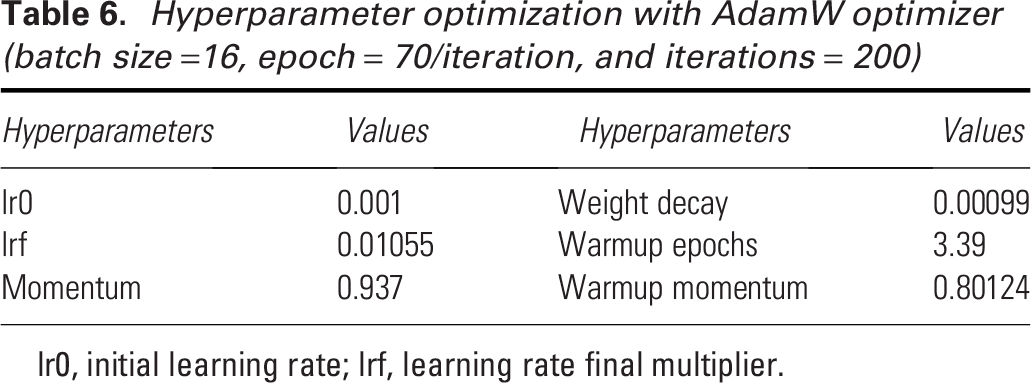
lr0, initial learning rate; lrf, learning rate final multiplier.
Best YOLOv8 model
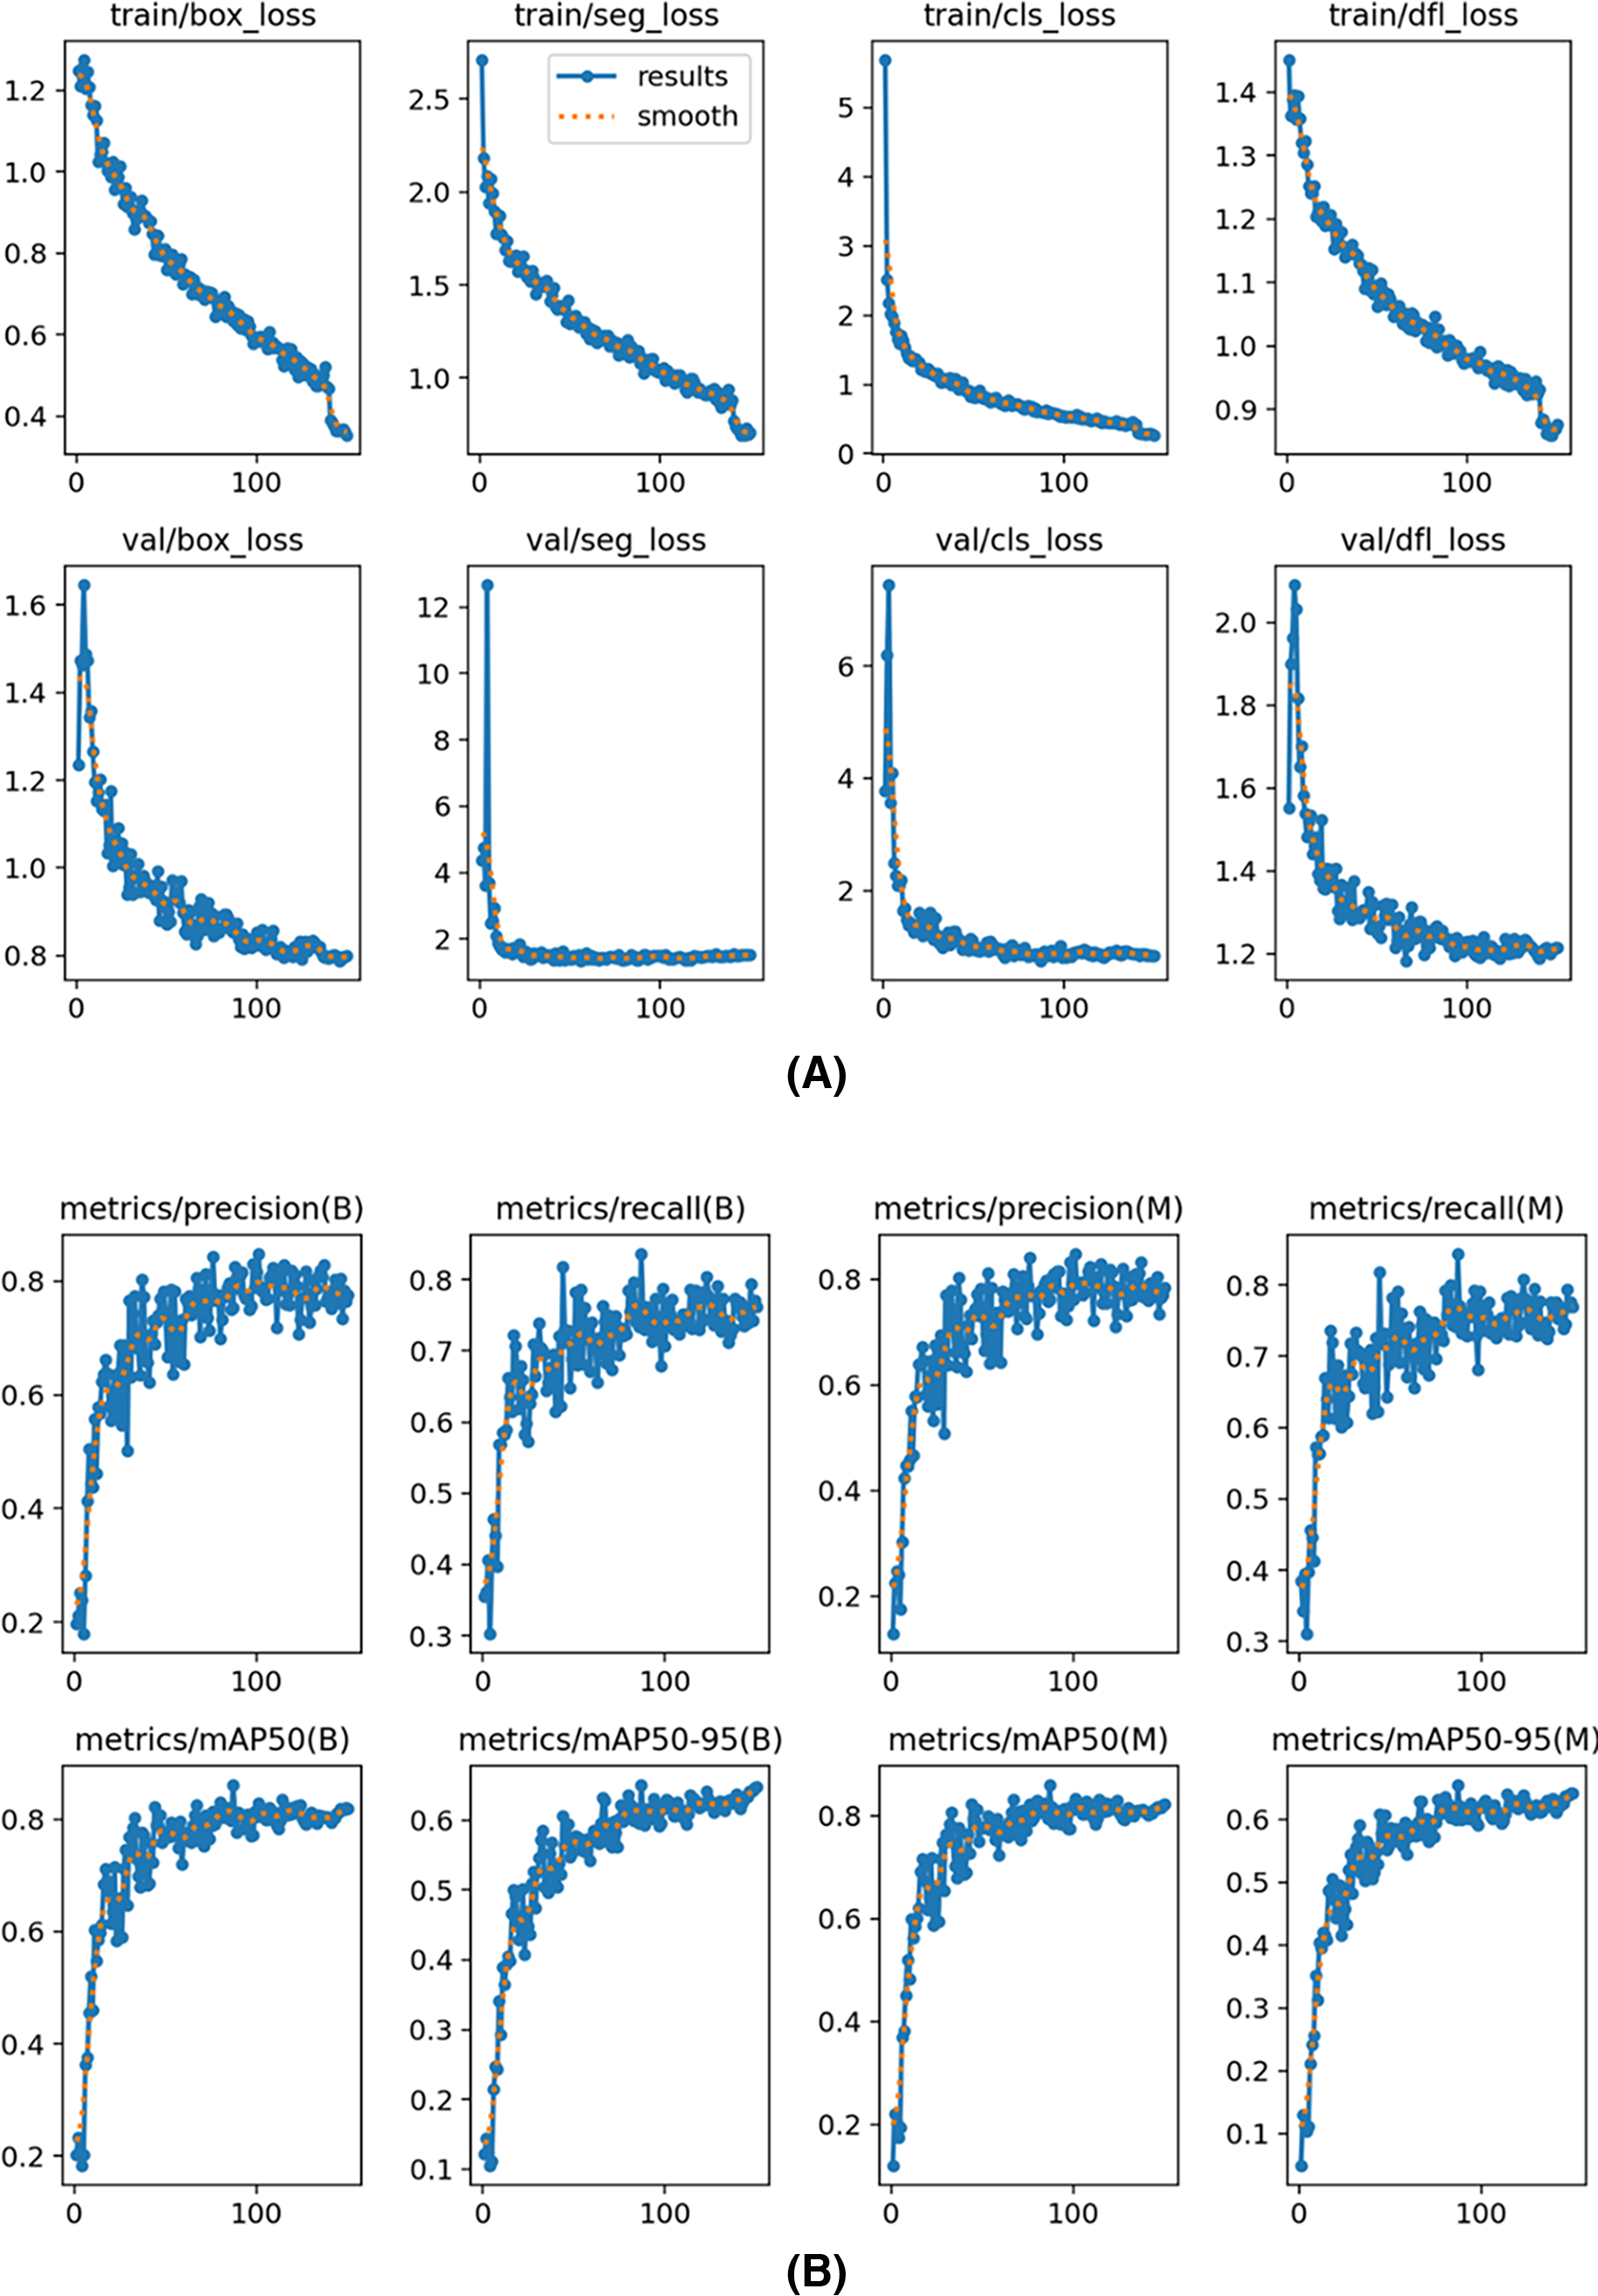
The training and validation loss curves shown in Fig. 5A for the YOLOv8s segmentation model illustrate the reduction in different loss metrics over epochs. The plots show “box_loss,” “seg_loss,” “cls_loss,” and “dfl_loss” for both the training and validation phases. Each graph indicates that the losses decrease consistently as training progresses, suggesting effective learning and convergence of the model. The close alignment between training and validation losses implies good generalization without significant overfitting, which is crucial for robust model performance on unseen data. The graphs of precision, recall, and mAP metrics in Fig. 5B for the YOLOv8s segmentation model display performance over training epochs. The graphs show steady improvements across all metrics, with both precision and recall increasing, indicating the model’s growing accuracy in its detections. The mAP metrics, at thresholds mAP50 and mAP50–95, also consistently improve, reflecting the model’s enhanced ability to accurately identify and localize objects. The “B” and “M” refer to big and medium size annotations, and our results demonstrate consistent performance across different sizes, minimizing size-based variation. Overall, these metrics suggest effective training and strong generalization of the YOLOv8s model.
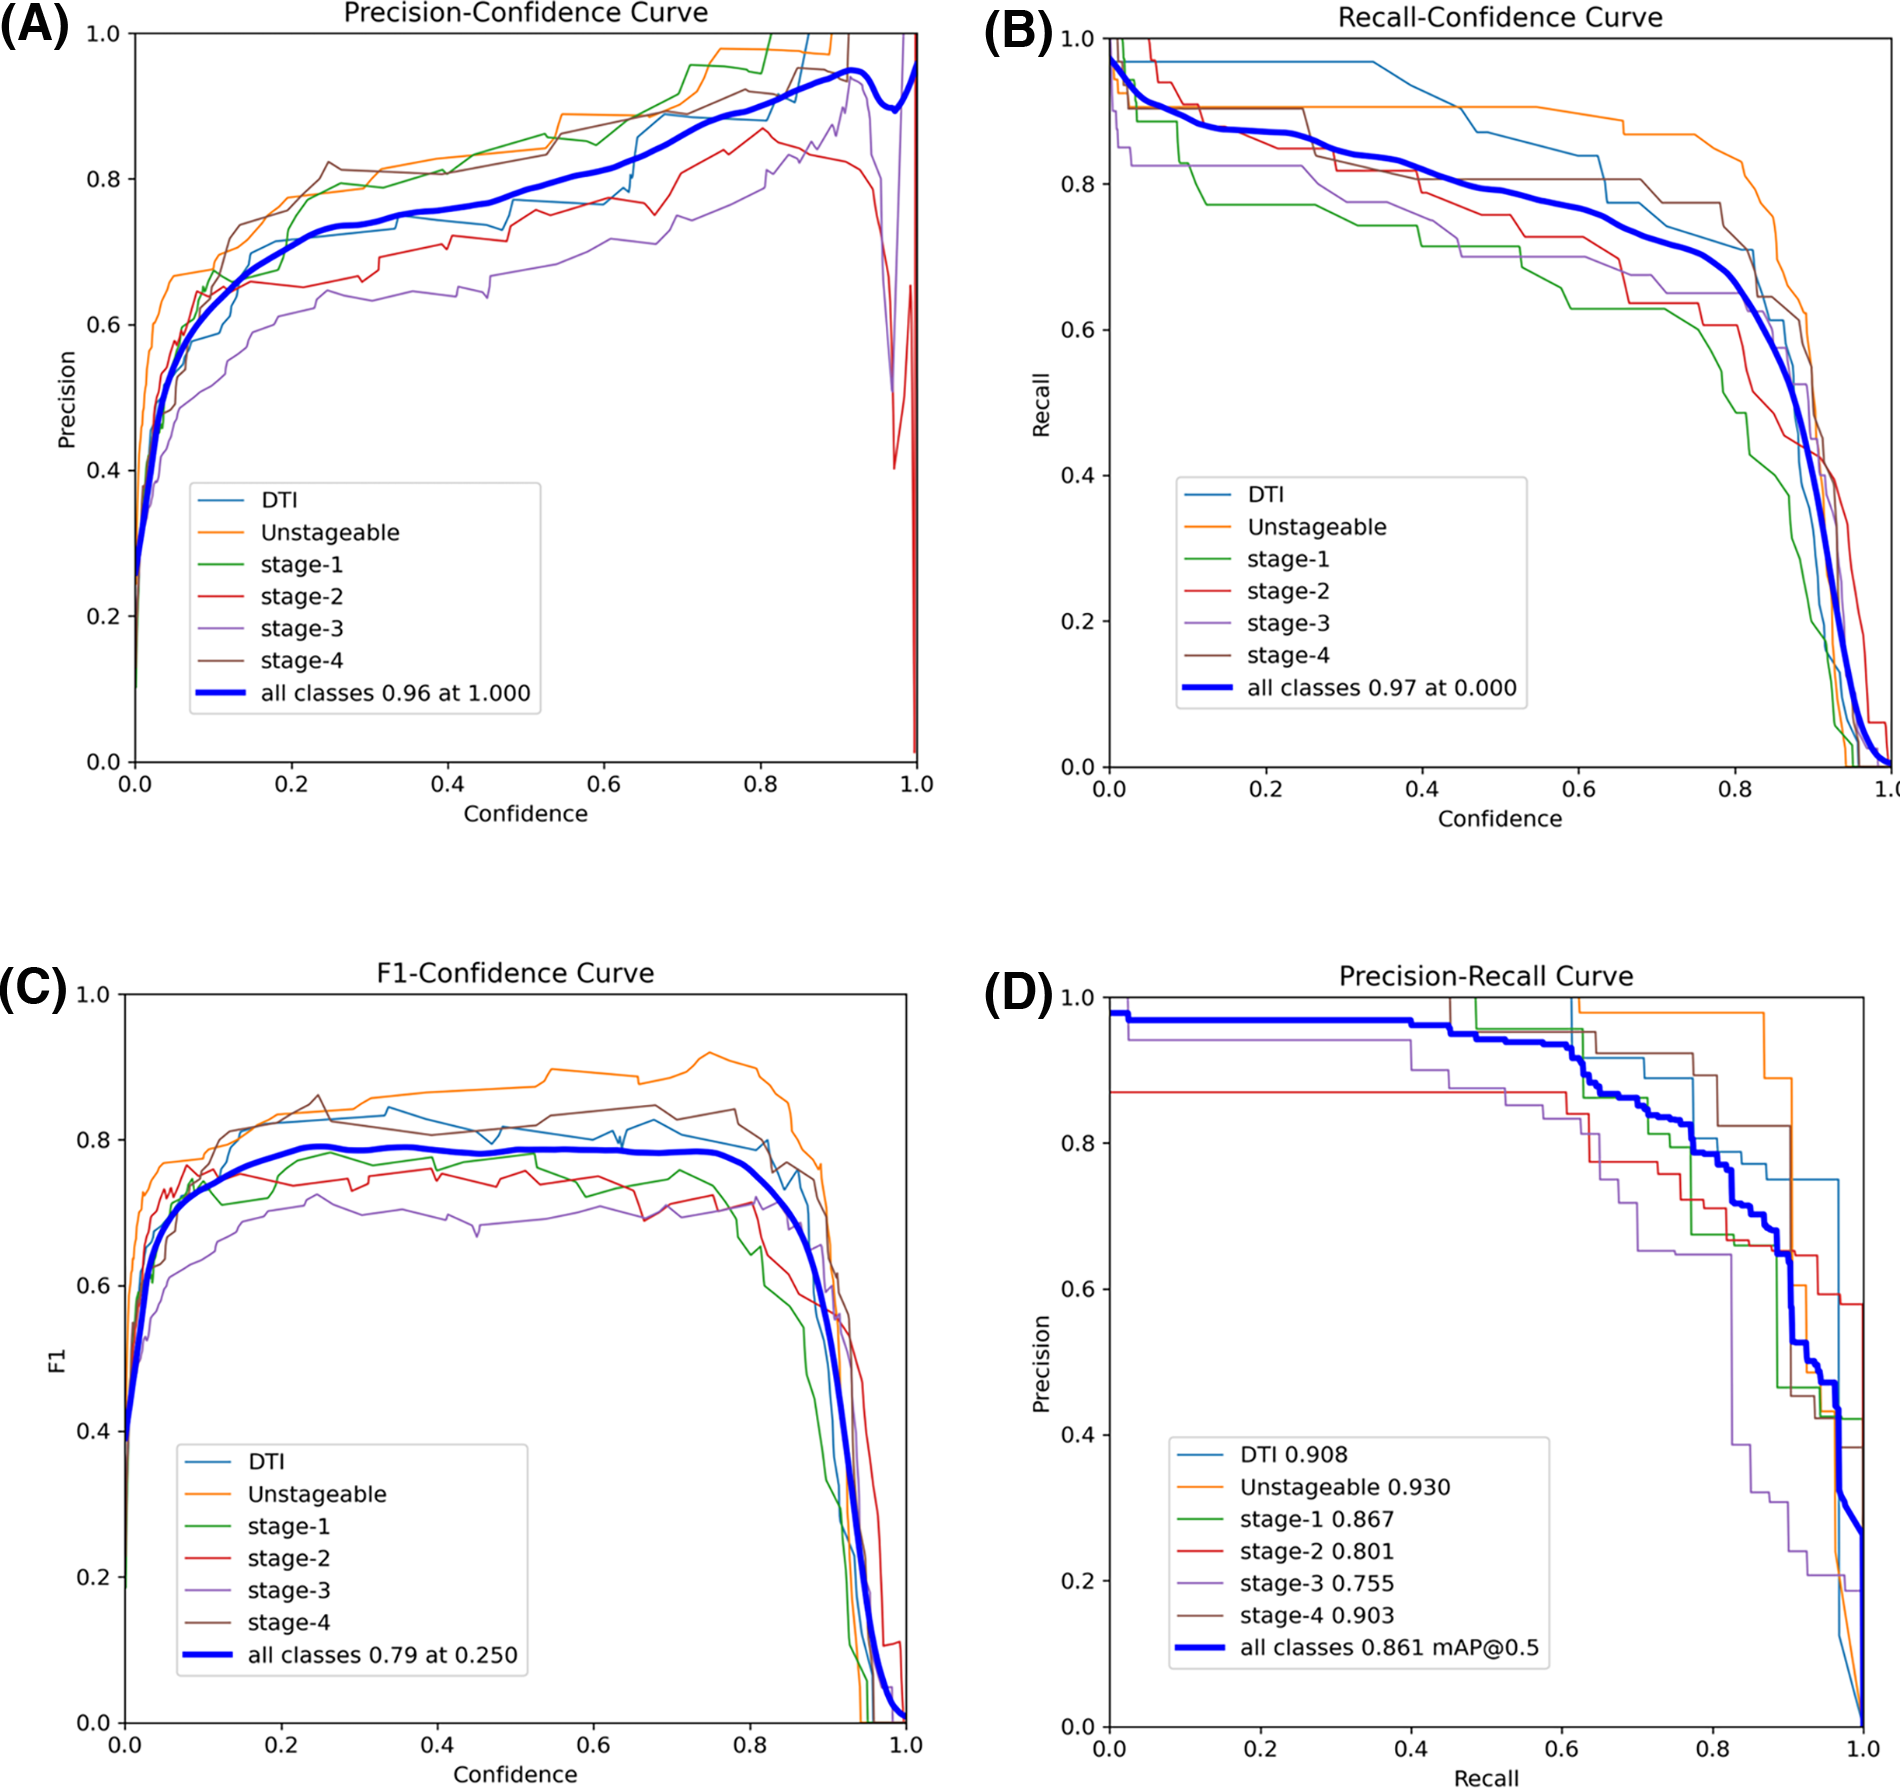
The precision-confidence curve in Fig. 6A illustrates how the precision of the YOLOv8s model varies across different confidence thresholds for detecting various pressure injury stages. As expected, precision increases with higher confidence thresholds, indicating that the model becomes more accurate as it is more certain of its predictions. Notably, Stage 1 and Unstageable injuries achieve high precision even at lower confidence levels, suggesting that these stages are easier for the model to classify. Both classes reach near-perfect precision as confidence approaches 1.0. In contrast, Stages 2 and 3 predictions show greater variability, with lower precision at moderate confidence levels, although their precision improves as the confidence threshold increases. The overall precision for all classes combined peaks at 0.96 when the confidence threshold is 1.0, reflecting the model’s strong performance when fully confident. The recall-confidence curve in Fig. 6B shows an inverse relationship between recall and confidence. As the confidence threshold rises, recall decreases (false negatives increase) for all pressure injury stages. However, Unstageable injuries maintain relatively high recall even at higher confidence levels, indicating that this stage is consistently detected even when the model becomes more selective. At lower confidence thresholds, the overall recall for all classes peaks at 0.97, indicating that the model detects more true positives when it is less strict in its predictions. However, this comes at the cost of precision, as seen in the precision-confidence curve. Notably, Stage 1 shows significant drops in recall as the confidence threshold increases, suggesting that this stage is more challenging for the model to detect accurately at higher confidence levels.
Performance matrix of the YOLOv8s model:
The F1-confidence curve in Fig. 6C depicts the F1 score across varying confidence thresholds for different pressure injury stages detected by the YOLOv8s model. The F1 score, which balances precision and recall, generally peaks at moderate confidence levels of 0.2 to 0.8, before declining as the confidence threshold increases. This curve highlights that as confidence increases, the balance between precision and recall becomes more favorable up to a point, after which higher confidence thresholds lead to a decrease in F1. For example, Unstageable injuries reach higher F1 scores, peaking earlier, indicating that this stage is easier for the model to predict. The overall F1 score for all classes peaks at 0.79 when the confidence threshold is around 0.25, signifying an optimal balance between precision and recall at this level. The precision-recall curve in Fig. 6D reveals the trade-off between precision and recall across different pressure injury stages. High precision is maintained at lower recall levels for several stages, with DTI and Unstageable injuries showing the highest precisions. The overall precision for all classes achieves 0.861 at a mAP@0.5 threshold, indicating the best model performance when evaluated at this intersection of precision and recall.
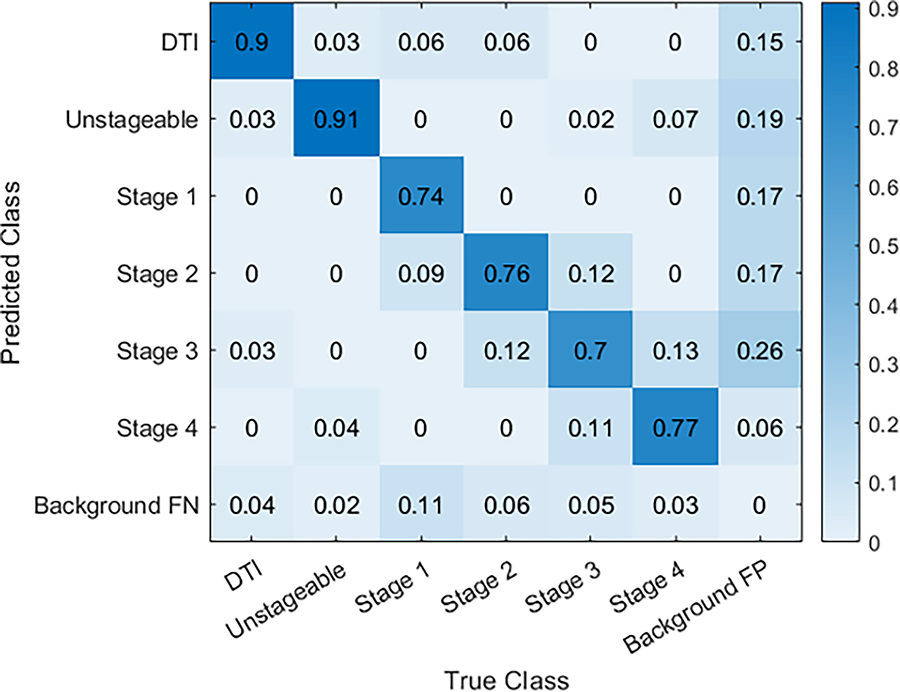
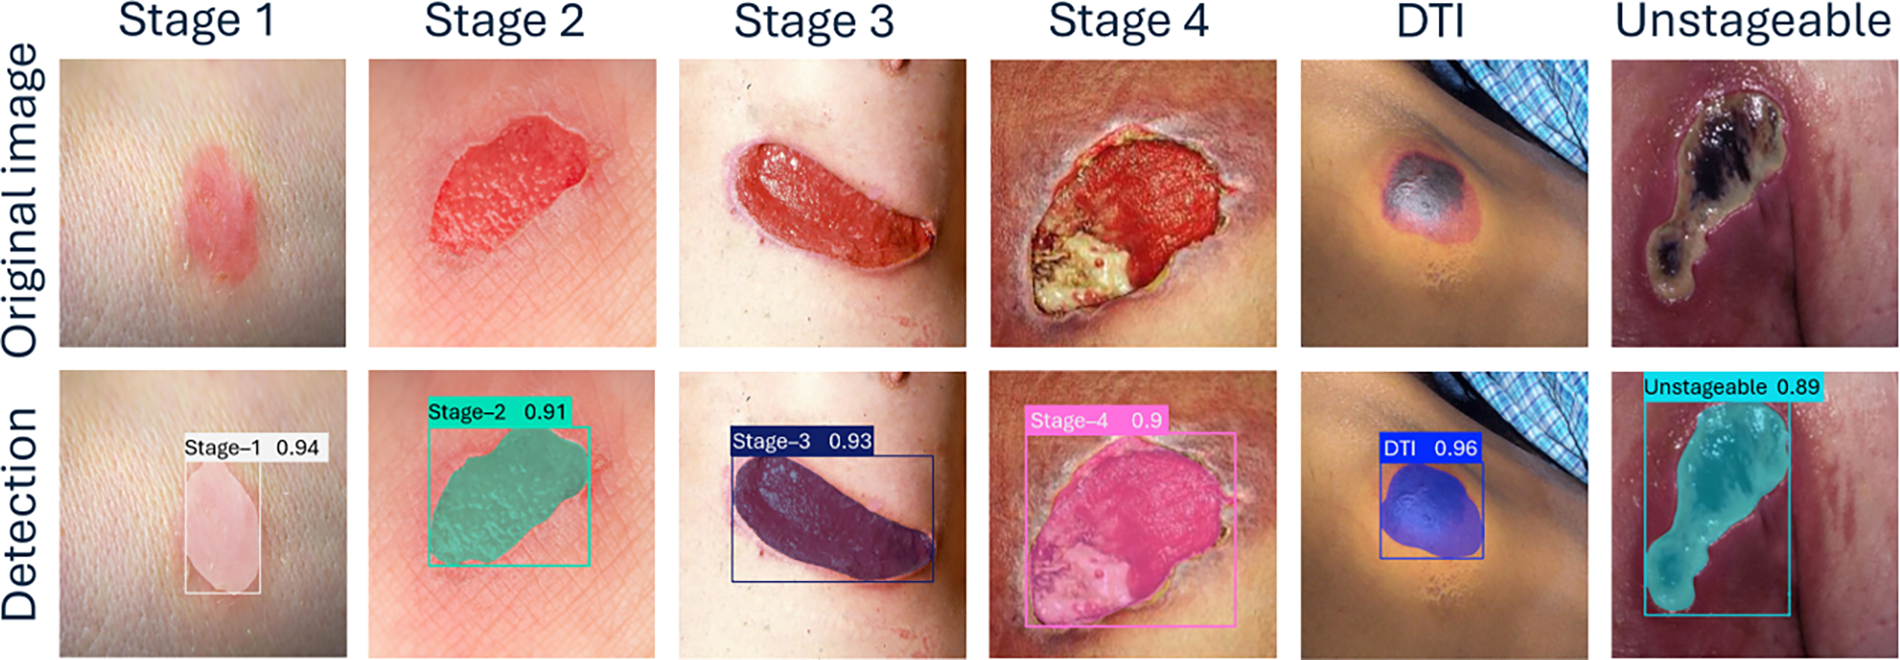
The confusion matrix in Fig. 7 shows the YOLOv8s model’s performance in detecting various pressure injury stages, including DTI, Unstageable, and Stages 1 through 4, as well as background noise (false positives and false negatives). The model demonstrates excellent accurate predictions in identifying DTI and Unstageable injuries, achieving true predictions of 0.90 and 0.91, respectively, which highlights its reliability for these critical stages. Similarly, the model performs well through Stage 1 to Stage 4 with true predictions of 0.74, 0.76, 0.70, and 0.77, respectively, reflecting its overall effectiveness across multiple stages. The overall performance of our current study surpasses the performance of previously published results in the literature.43,44 Some misclassifications into neighboring stages or backgrounds are observed. Specifically, there is some confusion between Stage 2 and Stage 3, where a small portion of cases are misclassified, indicating that the model could benefit from further tuning to improve differentiation between these stages. Despite the minor misclassifications, the overall performance remains strong, with the model successfully identifying a high percentage of pressure injuries. Figure 8 demonstrates sample detection of pressure injury across all stages with accurate boundary detection and higher confidence.
Normalized confusion matrix for pressure injury stage detection.
YOLOv8 model’s test results across various stages of pressure injuries.
Ensemble model
The results in Table 7 demonstrate the performance of various ensemble methods for pressure injury classification using different YOLOv8 models (n, s, m, l, and x). We tested a previously unseen Unstageable image on the trained YOLOv8 models. The hard voting method produced unanimous predictions of “Unstageable” across all models plus a possibility of Stage 4 by YOLOv8m, indicating a strong consensus among the various YOLOv8 models. In soft voting, the predictions were similarly consistent, with confidence scores ranging from 0.95 to 0.99, though the YOLOv8m model showed slight variation by also predicting Stage 4 with a lower confidence (0.32). The final prediction was “Unstageable” with a summed vote of 4.84. For model-weighted voting, the weight of each YOLOv8 model is calculated as the ratio of each model’s average accurate prediction to the sum of all models’ average accurate predictions across pressure injury stages. Each weight is then multiplied by the confidence score of the predicted stage to obtain the weighted voting score for each model. The scores are summed class-wise (each class representing an injury stage) from each model’s prediction, and the class with the highest score becomes the final prediction. The model-weighted voting method classified the ulcer as “Unstageable,” with a minor contribution from Stage 4 predicted by the YOLOv8m model, therefore the final decision was “Unstageable.” In class-weighted voting, the weights are derived from the ratio of each model’s accurate predictions for each class, which represents an injury stage, to the sum of all models’ average accurate predictions for that class. The weights are multiplied by the confidence scores and summed class-wise for all the models. The class with the highest score is the final prediction. Similar to the model-weighted voting, the class-weighted voting method strongly predicted “Unstageable,” with only slight variation for Stage 4, which did not affect the overall prediction result, i.e., the final prediction was “Unstageable.” The accompanying sample image and the predicted results are shown in Table 7, which clearly shows the detection of the Unstageable ulcer. The overall performance of these ensemble approaches highlights their effectiveness in achieving consistent and accurate predictions, reducing variability between individual model outputs.
Outcomes of ensemble methods for pressure injury classification using YOLOv8 models
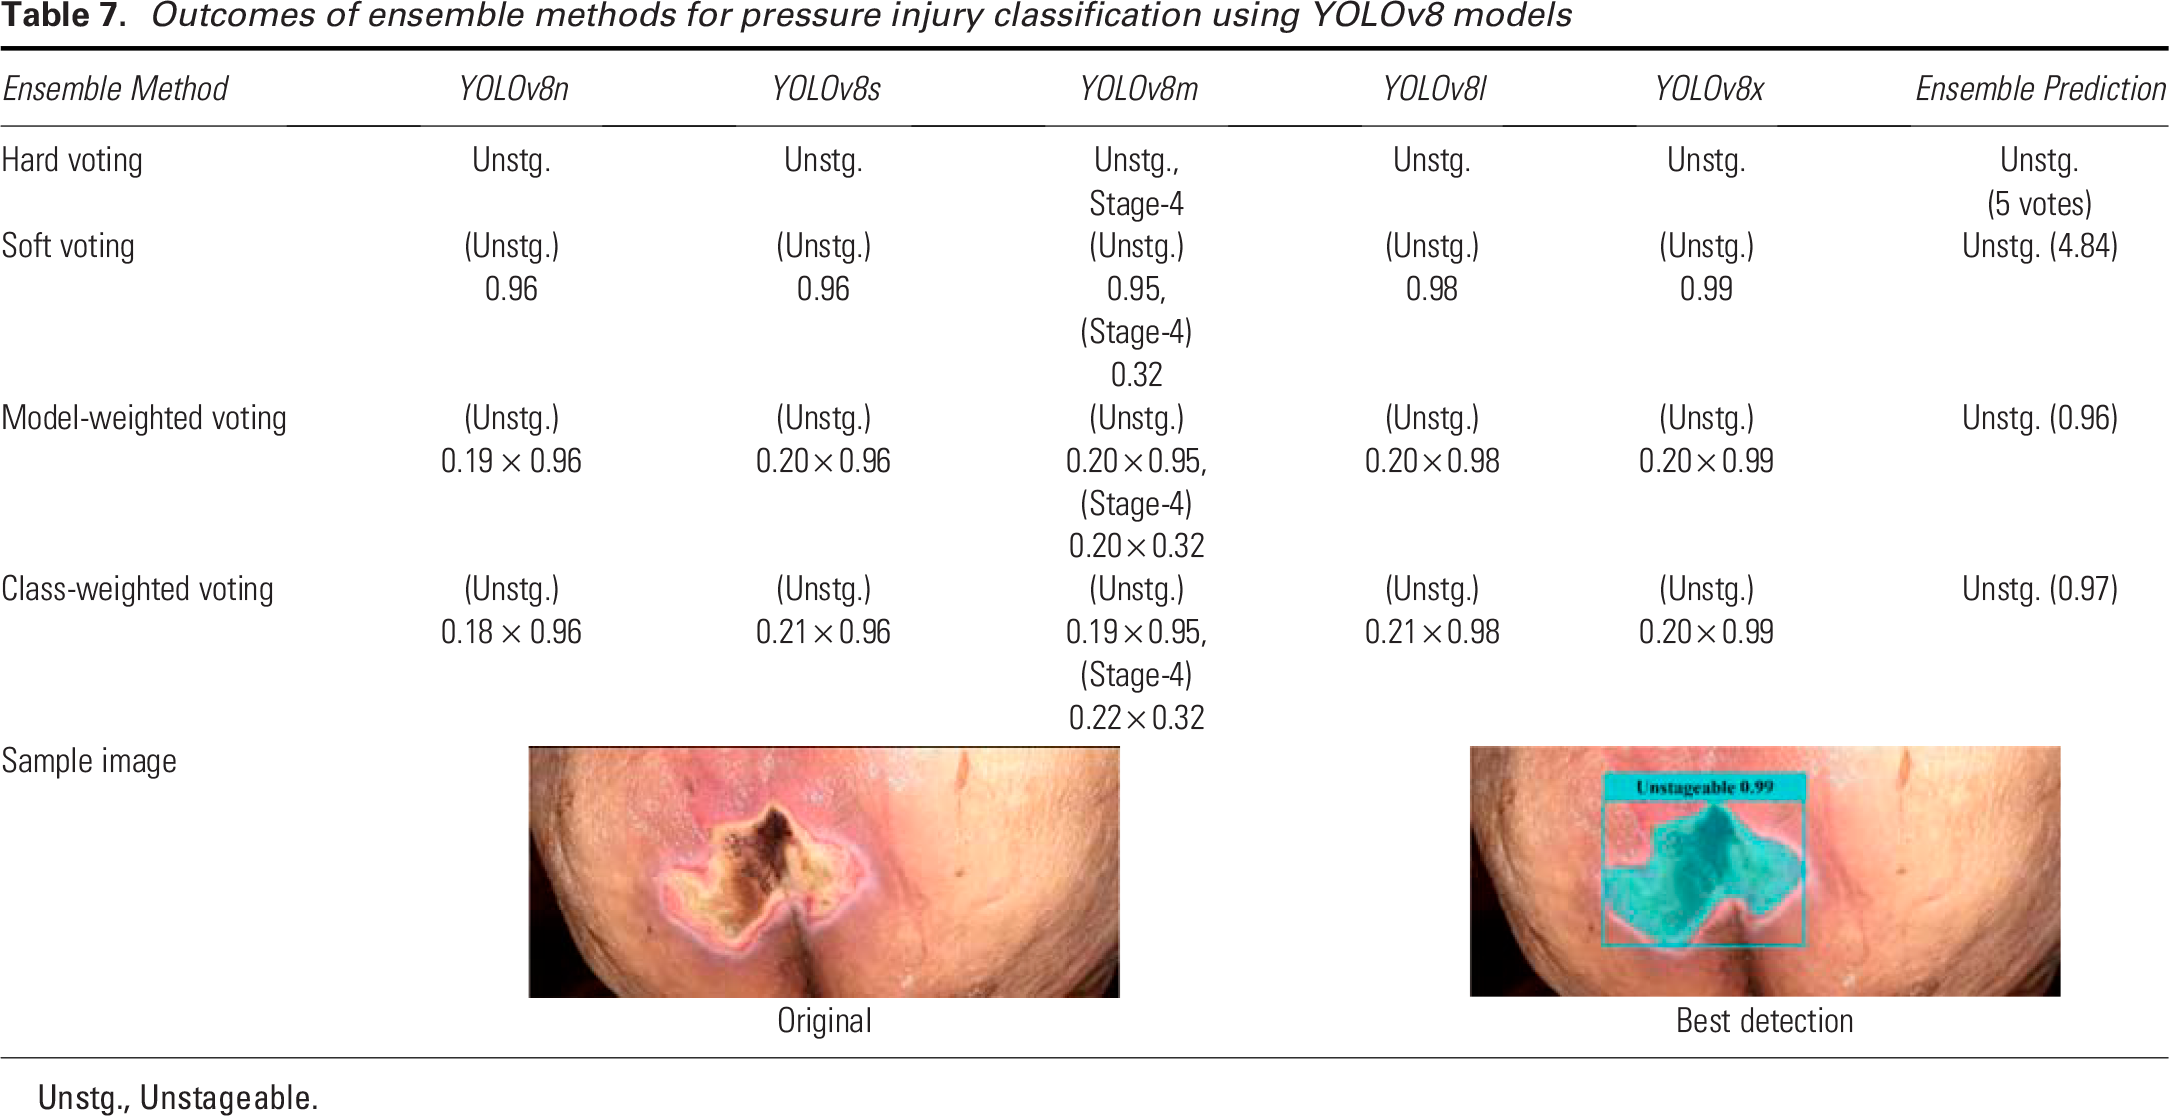
Unstg., Unstageable.
Limitations and future directions
Our current study is limited by the size of the dataset, which we aim to expand in our future work. In the next phase of this research, we will work on enhancing the model’s generalizability and capability to detect and classify key wound characteristics, including the presence of specific tissue types such as granulation tissue and necrotic tissue, depth of the injury, and the presence of infection. According to NPIAP guidelines, MASD and skin tears are excluded from our study, so they are not considered in our analysis. Caution is advised when using this deep learning model, as it may misclassify these conditions by attempting to match features in the test images with those of the stages it was trained to recognize. To improve the robustness and generalizability of our model, we plan to focus on increasing the dataset by collecting more clinical data. The current study focuses specifically on evaluating the feasibility and performance of YOLOv8 in detecting and staging pressure injuries, a broader comparative analysis with alternative CNN architectures remains a key objective for our ongoing and future research. In addition, we will explore synthetic data generation techniques, specifically using generative adversarial networks, to create realistic and diverse data samples that augment our current dataset. We also intend to incorporate explainable AI techniques to improve the interpretability of the model’s predictions, which will be especially valuable in clinical settings. Lastly, we plan to conduct a clinical trial to validate the model’s effectiveness in real-world applications. This trial will be crucial for assessing the practical impact and clinical reliability of our approach. Through these steps, we aim to advance the model’s accuracy, usability, and clinical relevance. While initial investments in infrastructure, training, and deployment are required, YOLOv8’s lightweight architecture and compatibility with subscription-based cloud-based systems offer a cost-effective and scalable solution. These models allow health care systems to pay based on usage rather than ownership, reducing financial burdens on resource-constrained facilities. Furthermore, lightweight YOLOv8 variants (e.g., YOLOv8n and YOLOv8s) are optimized for efficiency, enabling deployment on standard computing hardware and mobile devices without requiring expensive specialized equipment. Over time, these tools can generate significant cost savings by minimizing diagnostic errors, improving resource allocation, and reducing hospital stays.
AUTHORS’ CONTRIBUTIONS
M.H.T.: Writing—original draft, conceptualization, methodology, dataset collection, data curation, software, formal analysis, and visualization. F.F.: Writing—review and editing, conceptualization, dataset collection, data curation visualization, validation, and supervision. N.Z.: Writing—review and editing, software, and methodology. E.M.: Software, methodology, dataset collection, and data curation. I.M. and L.G.: Writing—review and editing, dataset collection, and validation. M.C.L.: Writing—review and editing and project administration.
Footnotes
ACKNOWLEDGMENTS AND FUNDING SOURCES
This work was supported in part by the Kummer Institute at Missouri University of Science and Technology through the Kummer Innovation and Entrepreneurship Doctoral Fellowship bestowed to the first author. The authors also extend their appreciation to the university for granting access to high-performance computation and software. The authors would like to express sincere gratitude to Dr. Mitra Sami Abyaneh (dermatologist, Chitotech Inc, Tehran, Iran), Ms. Candy Sadler (wound, ostomy, and continence nurse, Phelps Health, Rolla, Missouri), and Mr. Ehsan Zarei (wound, ostomy, and continence nurse, Chitotech Inc, Tehran, Iran) for their invaluable guidance throughout the dataset preparation. This research received no external funding.
AUTHOR DISCLOSURE AND GHOSTWRITING
None of the authors have financial or personal relationships that could influence the content or conclusions presented in this article. This research was conducted independently, and the results represent my unbiased findings. All authors listed have contributed significantly to this work and approved its final version. This article was prepared solely by the listed authors without the assistance of ghostwriters or external writing agencies. The authors have no conflict of interest to declare.
DATASET AVAILABILITY
The dataset used in this study has been made publicly available in Roboflow and can be accessed at Project ID: “advances-in-wound-care-pi-dataset”, which can be found at https://universe.roboflow.com/pi-iqy1t/advances-in-wound-care-pi-dataset. All our code, dataset, results, and detailed instructions, including dependencies and configuration guidelines, and instructions on how to run the code can be found at the following GitHub repository: ![]() .
.