
Abstract
Objective
Although mouse osteoarthritis (OA) models are widely used, their histological analysis may be susceptible to arbitrariness and inter-examiner variability in conventional methods. Therefore, a method for the unbiased scoring of OA histology is needed. In this study, as the first step for establishing this system, we developed a computer-vision algorithm that automatically detects the medial and lateral compartments of mouse knee sections in a rigorous and unbiased manner.
Design
A total of 706 images of coronal sections of mouse knee joints stained by hematoxylin and eosin, safranin O, or toluidine blue were randomly divided into training and validation images at a ratio of 80:20. A model to detect both compartments automatically was built by machine learning using a single-shot multibox detector (SSD) algorithm with training images. The model was tested to determine whether it could accurately detect both compartments by analyzing the validation images and 52 images of sections stained with Picrosirius red, a method not used for the training images.
Results
The trained model accurately detected both medial and lateral compartments of all 140 validation images regardless of the staining method employed, severity of articular cartilage defects, and the anatomical positions and conditions of the sections. Our model also correctly detected both compartments of 50 of 52 Picrosirius red–stained images.
Conclusions
By applying deep learning based on the SSD algorithm, we successfully developed a model that detects the locations of the medial and lateral compartments of tissue sections of mouse knee joints with high accuracy.
Keywords
Introduction
The mobility and quality of life of elderly people is often impaired by chondrodegenerative diseases. Among them, osteoarthritis (OA) is the most prevalent joint disease, which places a heavy burden on public health systems worldwide.1,2 OA leads to destruction of native articular cartilage, and in severe cases, finally results in replacement with artificial joints, which are inferior to the original articular cartilage in terms of function, and also have problems such as the possible need for revision and the risk of complications such as infection. To prevent destruction of articular cartilage, changes to the molecular mechanism underlying OA are ideal, and basic research to elucidate the pathophysiology of OA progression has been eagerly performed worldwide. 3 Animal models are often used to analyze the mechanisms of OA in vivo, 4 and mice are often the targets of OA model introduction because of their low experimental cost and ease of performing experiments involving genetic modification. 5 In mouse OA models, cartilage degeneration is introduced by several methods, such as surgery,6,7 drugs,8,9 or aging.10,11 Degeneration induced by these methods is usually assessed by preparing histological sections and staining them with safranin O (SO) or other dyes. Several histological scoring methods have been developed to quantitatively or semi-quantitatively evaluate the severity of degeneration.7,12,13 The most widely used of these is the OARSI scoring system, which classifies cartilage degeneration from 0 (normal cartilage) to 6 (damage to the calcified cartilage extends >75% of the articular surface) by microscopic examination. 14 Although this method is convenient, there is a risk of making arbitrary evaluations. There is also the problem that different examiners may conclude different results for the same sample.
To avoid problems caused by relying on examiners’ subjective perceptions, many attempts have been made in recent years to automatically perform histological evaluation by computer.15-17 In automatic computerized analysis, digital images are processed to extract feature values by which the image is classified, objects in the image are detected, or specific areas in the image are extracted. Until recently, these methods were not easy to perform because they required explicit programming of what features to extract and how to extract them. In machine learning methods, including deep learning, which has been developing rapidly in recent years, the computer automatically learns how to extract features, making programming much easier than before. When adapting deep learning to medical images where only a specific region of the image is needed for evaluation, a 2-step approach, which first detects the region of interest, and then performs the classification on the detected region, is increasingly being used for accurate evaluation.18-20 We thought that cartilage degeneration scoring for the image of a histological section of the knee joint would benefit from this 2-step approach because the evaluation is mostly limited to the medial and lateral compartments, except when there is a special need to detect lesions outside of these compartments. Automating the first detection step ensures that the examiner does not arbitrarily exclude areas with strong or weak degeneration when setting the regions to be used for scoring. Therefore, as a first step in the development of a system for automatic OA scoring, we decided to develop a system for automatically detecting the medial and lateral compartments of coronal sections of mouse knee joints from histological images.
A single-shot multibox detector (SSD) is a state-of-the-art algorithm based on deep learning technology for detecting objects from images. 21 The SSD algorithm was originally developed to detect a range of objects of multiple classes from a single image (object detection). In the system that we attempt to develop, we needed to detect only one medial and one lateral compartment from an image (object localization), which is clearly an easier task than object detection, so the SSD algorithm seemed capable for the task. The SSD network is based on VGG16, a standard convolutional neural network (CNN) architecture used for high-quality image classification, 22 with 6 additional convolution layers added. A total of 8,732 rectangular default boxes with 6 different sizes and 4 or 6 different aspect ratios were set up using the outputs from 6 locations in the latter part of the network. For each of these default boxes, the offset to the ground truth boxes and the confidence of the teaching labels were calculated. As the machine learning process iterates, the offset and label estimates become closer to the ground truth. With this SSD algorithm, in this study, we developed a system to automatically detect the medial and lateral compartments from images of histological sections of the knee and examined the performance of the trained model. We also examined whether the system could be adapted to sections stained using a method that was not used for the training set.
Materials and Methods
Dataset Preparation
We performed the following procedures under the Google Colaboratory pro environment, using Ubuntu version 18.04.5 LTS as the operating system. We wrote the code used in this study in Python version 3.7.10 with PyTorch version 1.9.0 as a library for machine learning. Other major libraries used were CUDA version 10.2, OpenCV version 4.1.2, NumPy version 1.19.5, scikit-learn version 0.22.2.post1, and Matplotlib version 3.2.2.
For training and validation, we collected 706 color digital images of coronal sections of mouse knee joints, which included both the medial and lateral compartments. The age of the mice ranged from 5 weeks to 18 months, and the genotypes included both wild type and genetically modified. Knees were operated for OA induction,6,7 operated on in a sham surgery, or not surgically treated. Detailed demographic characteristics are shown in Table 1 . The knee joints were embedded to prepare coronal sections following instructions as previously reported. 14 The sections were cut with respect to anatomical landmarks such as the flattened tibial plateau for the posterior position, the crossing of the cruciate ligaments as the middle position, and the presence of synovial tissue in the joint space, the flattening of the femur, and loss of cartilage on the tibia as the anterior margin. The sections were mainly mid-coronal, but to increase robustness, some off-center sections were also used. All sections used for this study contain both the femur and tibia around the knee joint, and the soft and hard tissue. Sections were stained with hematoxylin and eosin (HE), SO, or toluidine blue (TB). These images were then randomly split into training and validation images at a ratio of 80:20. LabelImg 23 was then used to set the ground truth boxes and teaching labels corresponding to the regions of the medial and lateral compartments. These boxes for the compartments were set to include the entire width of the articular cartilage of the femur and tibia, except for non-load-bearing surfaces at the outer edges, in addition to the subchondral plates.
Demographic Characteristics of 706 Images Used for Training and Validation.
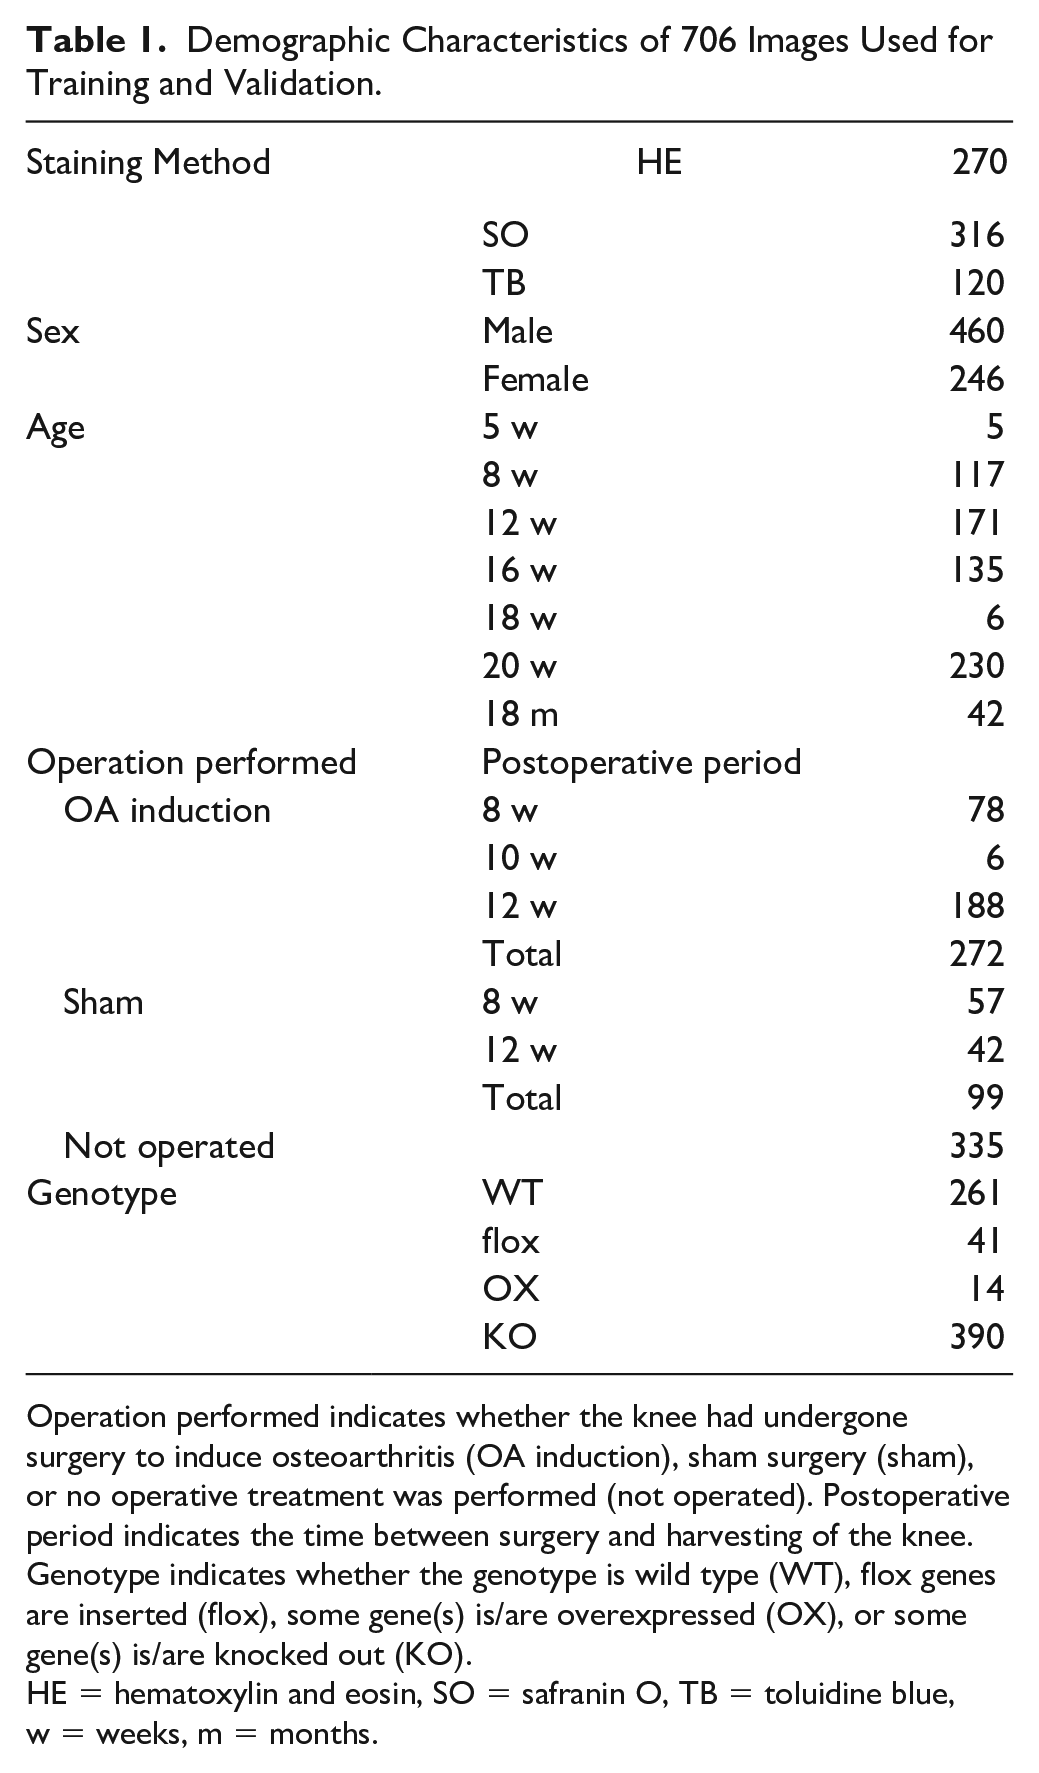
Operation performed indicates whether the knee had undergone surgery to induce osteoarthritis (OA induction), sham surgery (sham), or no operative treatment was performed (not operated). Postoperative period indicates the time between surgery and harvesting of the knee. Genotype indicates whether the genotype is wild type (WT), flox genes are inserted (flox), some gene(s) is/are overexpressed (OX), or some gene(s) is/are knocked out (KO).
HE = hematoxylin and eosin, SO = safranin O, TB = toluidine blue, w = weeks, m = months.
Network Architecture
We implemented the SSD network in the same way as in the original paper. 21 We used the pretrained VGG16 network (https://s3.amazonaws.com/amdegroot-models/vgg16_reducedfc.pth) for the early layers of our own. The training and validation steps described below were repeated in this order for 200 epochs.
Training Step
We resized the training images to 300 × 300 pixels to match the input size of the SSD network. We then standardized the images by calculating the average pixel values for the red, green, and blue channels for all training images and subtracting them from the corresponding values for each image. To increase the amount of training data and to provide resilience to data variations, we randomly scaled, color transformed, cropped, and horizontally flipped the images before inputting them to the model for each epoch (data augmentation). After these pre-processing steps, we set the batch size (the number of images loaded at one time) to 30 and passed each batch into the SSD network, one at a time. By processing the data in the network, we obtained outputs consisting of the predicted location of the bounding box and the predicted value of the label. We then computed the loss functions for the predicted bounding box and ground truth box locations (localization loss, loss_l) and for the confidence of the label (confidence loss, loss_c) in the same way as in the original literature. 21 We then used the stochastic gradient descent (SGD) method with a learning rate of 1e-3, a momentum of 0.9, and a weight decay of 5e-4 to update the model parameters so that the sum of loss_l and loss_c (total_loss) was minimized. We repeated the above process for all batches of training images. We then calculated the average values of loss_l and loss_c for all batches and defined them as such for the training step of the epoch. At the end of each epoch, we saved the model parameters for further analysis.
Validation Step
As in the training step, we resized and standardized each validation image. We did not perform data augmentation on the validation images. Then, we inputted a batch of 30 validation images into the SSD network, which had just been updated in the previous training step. We calculated the loss_l and loss_c from the output without updating the parameters. After all the batches were processed, we calculated the average values of loss_l and loss_c in the same way as in the training step and used these values as the losses for the validation step of the epoch.
Detection of Medial and Lateral Compartments
The obtained output contained 8,732 bounding boxes, which were sorted in descending order of confidence for the medial and lateral compartments. As there is only one medial and one lateral compartment in the knee joint images used in this study, we selected only the bounding box corresponding to each compartment that had the maximum confidence. If the selected bounding boxes of both compartments overlapped, we changed the bounding box of the compartment with the lower confidence value of the two to the one with the next highest confidence value for that compartment which did not overlap.
Evaluation of the Trained Model
The intersection over union (IoU) is a value between 0 and 1 obtained by dividing the intersection of 2 regions by the union of the same 2 regions, with higher values indicating greater overlap between them. We calculated the IoU between the regions of the medial and lateral compartments estimated by the model and the teaching bounding box. We considered a compartment to be correctly detected if both of the following 2 criteria were met:
IoU > 0.5 (the cutoff value used in a previous paper). 19
The predicted bounding box contained both the articular cartilage and subchondral plate of the loading surfaces of both the femur and tibia.
Validation Using Images of Sections Stained with a Different Method
We tested whether we could accurately detect the medial and lateral compartments in images with staining methods other than HE, SO, or TB, which had been performed on the sections used in the training step. For this validation, we used 52 images of mouse knee joint sections stained with Picrosirius red. Similar to the validation step described above, we inputted these images into the trained SSD network and evaluated whether both compartments were correctly detected.
Statistical Analysis
All data are expressed as means ± standard deviations.
Results
Demographics of the Images Used for Training and Validation
Within the 706 images used for training and validation steps, there was one image in which the lateral condyle of the femur had detached from the slide glass so extensively that it was difficult to set up a ground truth box for the lateral compartment, and one image in which the knee joint was only partially included. We excluded these 2 images from both training and validation. As a result, the final number of images used was 564 (218 HE, 253 SO, and 93 TB) for training and 140 (52 HE, 62 SO, and 26 TB) for validation.
Learning Process
Figure 1 . shows the change in loss_l, loss_c, and total_loss for the training and validation steps as the learning progressed. All the losses for both steps tended to decrease gradually as expected, but as the learning process approached epoch 200, the losses for the training step tended to be lower than those of the validation step. This suggested that the model was overfitting to the training images. Since there was no such trend around epoch 100 ( Fig. 1C ), and the total_loss showed a local minimum value at the end of epoch 105 ( Fig. 1D ), we decided to use the model at the end of epoch 105 for further analysis. The parameters of this model are available at https://github.com/mori-y-lab/KneeLocalization/releases/download/v1.0.0/knee-ssd.model.
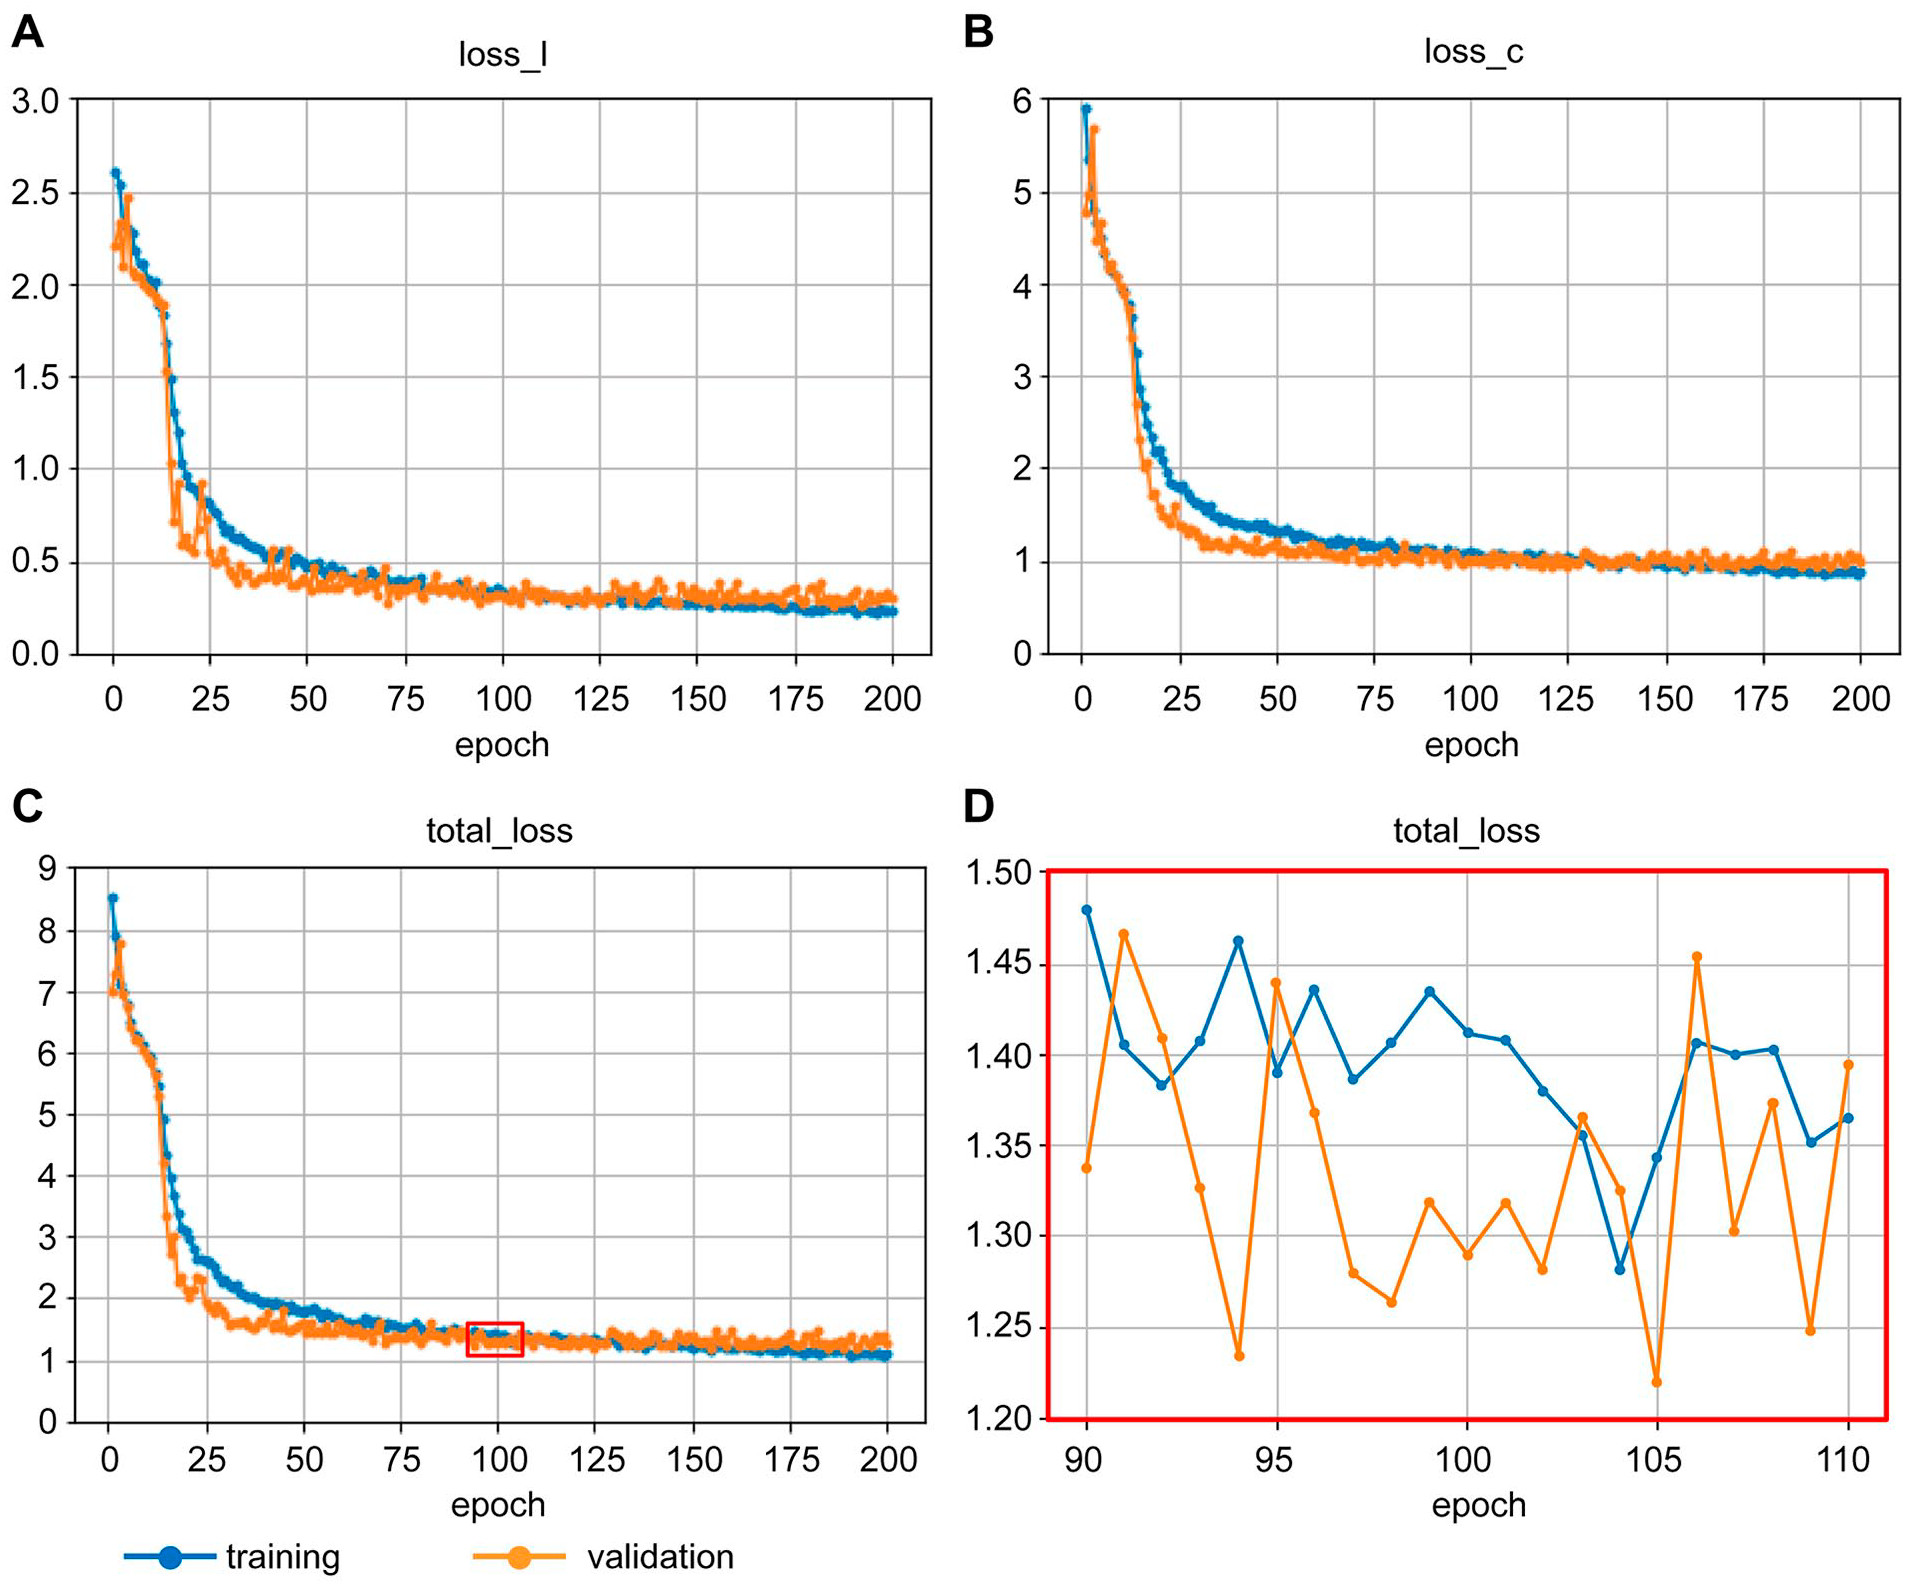
Changes in losses for training and validation over the course of the learning process.
Performance of the Developed Model
By processing 140 validation images with the trained network, we were able to correctly detect the medial and lateral compartments for all images ( Fig. 2A ). We obtained excellent confidence values of 0.993 ± 0.018 for the medial compartment and 0.996 ± 0.006 for the lateral compartment ( Fig. 2B ). IoUs were sufficiently high values of 0.86 ± 0.06 for the medial compartment and 0.87 ± 0.06 for the lateral compartment ( Fig. 2C ). We were able to accurately detect both compartments regardless of whether the sections were stained with HE, SO, or TB ( Fig. 2D-F ). In addition, we were able to detect compartments from sections that were cut at the more anterior part of the knee joint ( Fig. 2G ). The 140 validation images included one with a maximum OARSI score of 6 for the 4 articular cartilage surfaces, 5 with 5, 3 with 4, and 5 with 3. Even for all the images with greatly defected cartilage due to advanced OA, we were able to detect both compartments correctly ( Fig. 2H ). Moreover, even when the sections were in poor condition, such as blurred, bubbled, or partially detached, we were able to detect the compartments correctly ( Fig. 2I-K ).
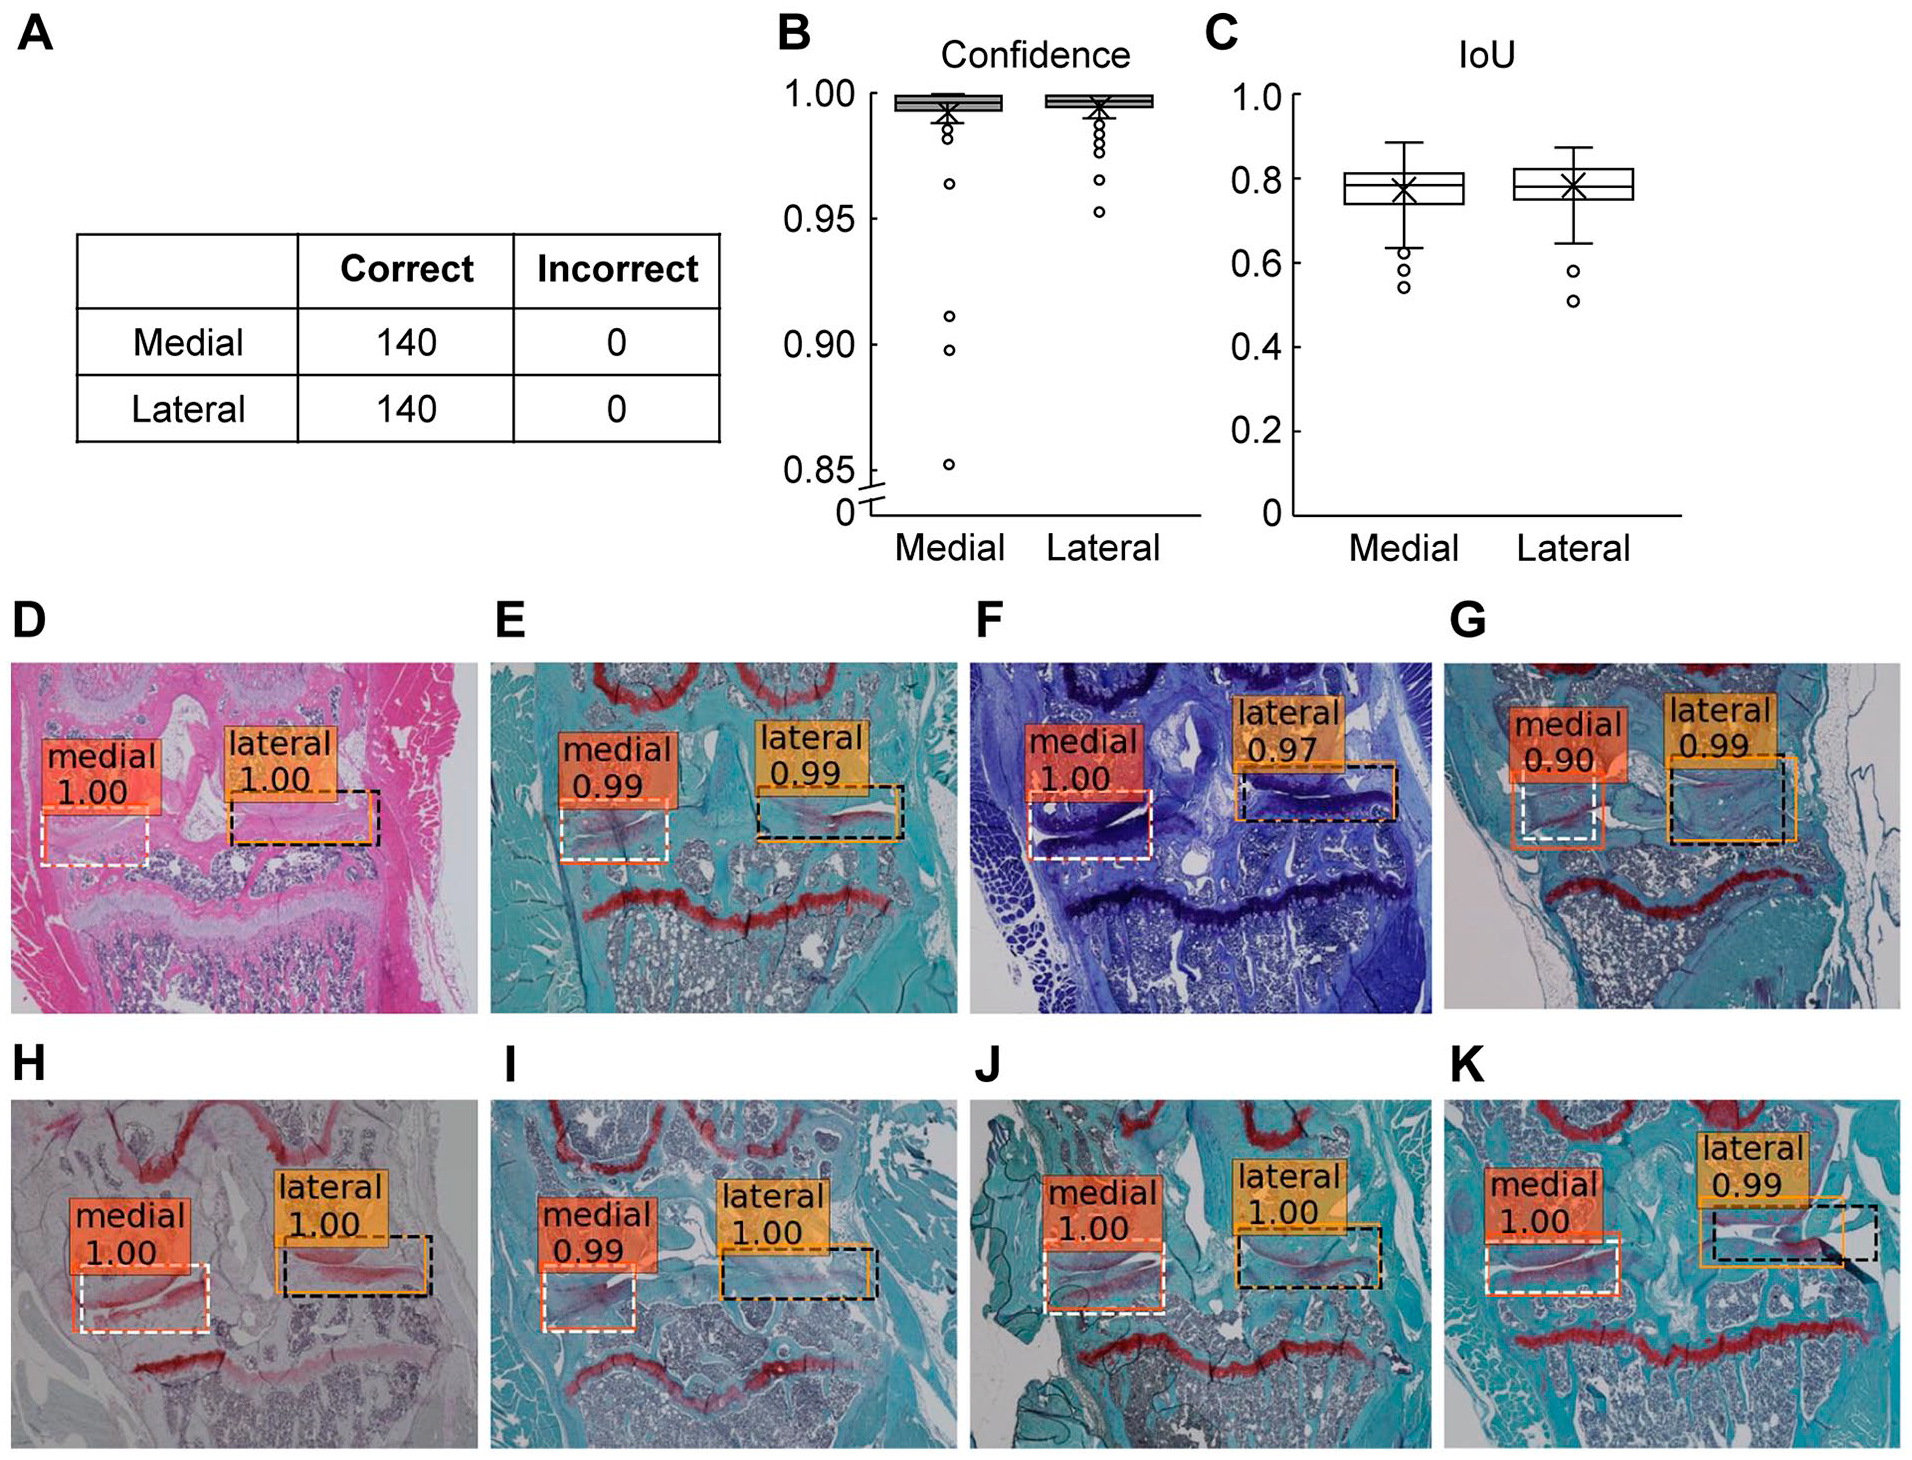
Assessment of performance of the developed model using the 140 validation images.
Validation with Images of Sections Stained with Picrosirius Red
Since training of the model was performed on sections stained by 3 different methods, we thought that the trained model might potentially detect both compartments based not on features specific to any of the 3 staining methods, but rather on universal features that could be recognized regardless of the staining method. We assessed this possibility using images of sections stained with Picrosirius red, which was not used for the training images. We passed 52 images of sections stained with Picrosirius red into the trained model. The demographic characteristics of these images are shown in Supplementary Table S1 . Of the 52 images tested, our model correctly detected the medial, lateral, and both compartments in 52 (100.0%), 50 (96.2%), and 50 (96.2%) images, respectively ( Fig. 3A ). A representative result is shown in Fig. 3B . The confidence values were 0.877 ± 0.198 for the medial compartment and 0.835 ± 0.168 for the lateral compartment ( Fig. 3C ). IoUs were 0.78 ± 0.09 and 0.75 ± 0.11 for the medial compartment and lateral compartment, respectively ( Fig. 3D ). These values are lower than those for the images of sections stained by HE, SO, and TB, but are still high enough to indicate that our model is effective for images of sections stained by Picrosirius red as well. This suggests that the model learnt to exploit features that are universal regardless of the type of staining performed.
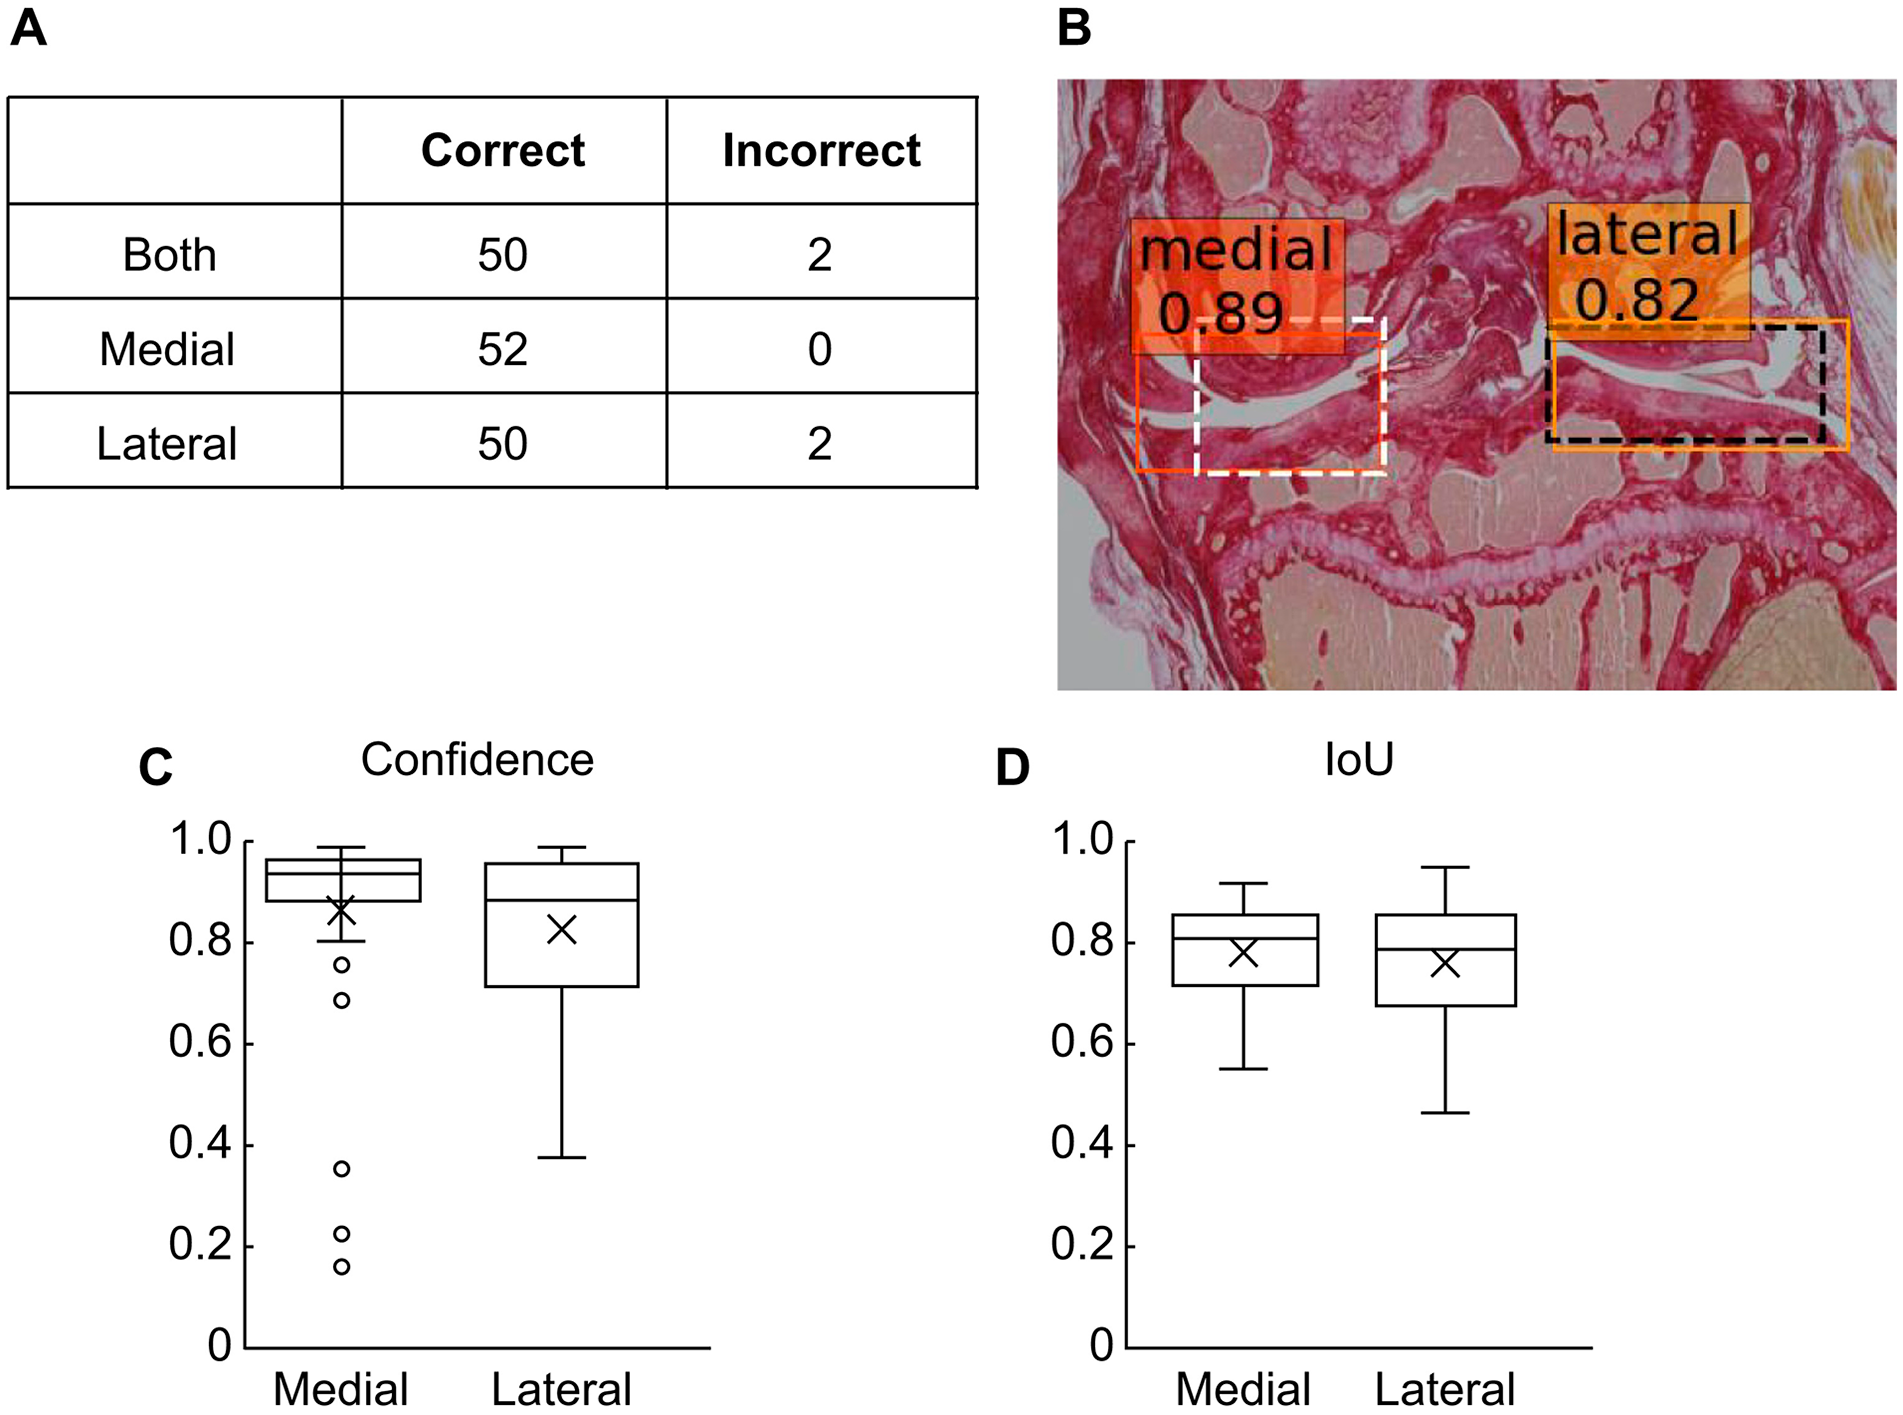
Assessment of performance of the developed model using sections stained with Picrosirius red.
Discussion
In this study, we developed a model for detecting the medial and lateral compartments of the mouse knee joint using machine learning with the SSD algorithm from images of sections stained by HE, SO, and TB. Through validation using images of sections stained by these methods, used for the training data, and one not, we confirmed that the developed model was capable of detecting both compartments with high accuracy and was resilient against variations in staining methods, anatomical position of the sections, presence or absence of articular cartilage defects, and the conditions of the sections. To the best of our knowledge, this is the first report on the development of a deep-learning-based system that automatically detects the compartments from images of tissue sections of mouse knee joints.
In recent years, many attempts have been made to apply deep learning to various medical images, such as plain x-ray films, MRI, and ultrasound images. 24 In the field of musculoskeletal diseases, several successful attempts to automatically detect and classify fractures or OA from plain x-ray films have been reported recently.20,25-27 On the contrary, although there have been many attempts to automatically analyze histological sections using deep learning,28,29 only a few reports have analyzed musculoskeletal tissue sections, including cartilage. 30 The fact that we were able to detect anatomical locations from tissue sections of the knee joint with high accuracy might suggest a use for deep learning in histological analysis of articular cartilage.
Our final goal is to build a 2-step system that first detects the compartments and then scores cartilage degeneration for each compartment. In this study, we developed our model as the first detection step of this system, which was able to correctly detect not only articular cartilage with normal thickness and shape, but also compartments containing greatly defective articular cartilage. Since we were able to detect equivalent regions regardless of the degree of articular cartilage destruction, we think that the regions cropped by this model could be useful for downstream analysis of cartilage degeneration. By performing further deep learning on both detected compartments, it will be possible to not only calculate semi-quantitative OARSI scores, but also to establish a new system that can automatically detect quantitative indicators, such as the extent of articular cartilage destruction, changes in the number of cells, cell hypertrophy, and osteophyte formation. In addition, the involvement of subchondral bone in the pathogenesis of OA has been extensively studied in recent years.31-33 Since both compartments detected by our model contain subchondral plates, they could be used to create a system to analyze the state of the subchondral bone.
A recent report showed that CNNs tend to make decisions based on fine textures rather than morphology. 34 In this study, we trained the model using images of sections that had been processed by multiple staining methods. Based on the aforementioned report, it is presumed that different staining methods would result in alteration of textures and so this training should be a difficult task. Despite that, however, our trained model could accurately detect the anatomical locations. One possible explanation is that the model might be trained to use features from anatomical structures that are independent of the staining method, rather than from texture, which is assumed to not be. Alternatively, the difference in staining methods might not have significantly changed the features that the model emphasized when making decisions. Further studies are needed to elucidate the detailed mechanisms, but in any case, the results of this experiment, which showed that machine learning using sections with different staining methods enabled accurate detection of anatomical structures, will provide useful information for future attempts to apply deep learning to histological analysis. For example, using deep learning on a data set composed of consecutive sections processed by multiple staining methods might be a promising strategy to create a model that makes decisions based on shape rather than texture.
Our model was also able to accurately detect both compartments from images with various forms of damage. This means that even if sections are processed not completely uniformly, the model can robustly detect the equivalent regions in them. Staining of tissue sections is a sequential process that consists of many, generally manual steps, which inevitably causes some heterogeneity among samples. This robustness might be beneficial to reduce errors during analysis.
This study has several limitations. First, although the model was able to detect both compartments with high accuracy for the images used for validation, the number of sections used for this purpose was only 190 (140 HE, SO, TB stained, and 52 Picrosirius red stained), so the accuracy may not have been calculated precisely, and the characteristics of the model as to what types of images are poorly handled are not fully understood. Processing more images in future research will reveal a more precise accuracy and detailed characteristics of this model. Second, we only used the fact that the 2 compartments do not overlap as anatomical information for the model to make decisions. However, for example, the area ratios between the whole image and the bounding box for the compartments, or the area ratio of the bounding boxes of the 2 compartments is generally constant; thus, it might be possible to make a more efficient model by restricting the size of the default boxes and reducing their number. We will incorporate this additional information into the model when the need to improve its performance arises in future research.
Conclusion
By applying deep learning based on the SSD algorithm to images of tissue sections of mouse knee joints, we successfully developed a model that detects the location of the medial and lateral compartments from images of sections stained by various methods and under various conditions with high accuracy. To the best of our knowledge, this study is the first step in creating an automatic evaluation system for OA. In future research, we will further adapt deep learning to the regions cropped by the model that we have developed. Through this research, we demonstrated some of the usefulness of deep learning for analyzing images of histological sections.
Supplemental Material
sj-docx-1-car-10.1177_19476035221074009 – Supplemental material for Automatic Detection of Medial and Lateral Compartments from Histological Sections of Mouse Knee Joints Using the Single-Shot Multibox Detector Algorithm
Supplemental material, sj-docx-1-car-10.1177_19476035221074009 for Automatic Detection of Medial and Lateral Compartments from Histological Sections of Mouse Knee Joints Using the Single-Shot Multibox Detector Algorithm by Yoshifumi Mori, Takeshi Oichi, Motomi Enomoto-Iwamoto and Taku Saito in CARTILAGE
Footnotes
Authors’ Note
Institutions where the work was carried out:
Department of Physical Therapy, School of Health Science and Social Welfare, Kibi International University, Okayama, Japan.
Division of Oral Anatomy, Department of Human Development and Fostering, Meikai University School of Dentistry, Saitama, Japan.
Division of Orthopaedic Surgery, Children’s Hospital of Philadelphia, PA, USA.
Sensory & Motor System Medicine, Faculty of Medicine, University of Tokyo, Tokyo, Japan.
Acknowledgments and Funding
We thank H. Kawahara, J. Sugita, and K. Kaneko for their technical assistance. We would also like to thank Editage (![]() ) for the English language editing and review of this manuscript. The author(s) disclosed receipt of the following financial support for the research, authorship, and/or publication of this article: This study was supported by a JSPS KAKENHI (grant numbers JP24390348, JP15H06169, JP17K16674, and JP19K18540).
) for the English language editing and review of this manuscript. The author(s) disclosed receipt of the following financial support for the research, authorship, and/or publication of this article: This study was supported by a JSPS KAKENHI (grant numbers JP24390348, JP15H06169, JP17K16674, and JP19K18540).
Declaration of Conflicting Interests
The author(s) declared no potential conflicts of interest with respect to the research, authorship, and/or publication of this article.
Ethical Approval
All experimental procedures using mice were performed under protocols approved by the Animal Care and Use Committee of the University of Tokyo (Approval No. M-P12-131), the Animal Experiment Ethics Committee of the Meikai University School of Dentistry (Approval Nos. A1746, A1810, and A1936), the Animal Experiment Committee of Kibi International University (Approval No. A2001), or the Institutional Animal Care and Use Committee of the Children’s Hospital of Philadelphia (Approval No. 1013). All experiments were performed in accordance with the ARRIVE guidelines and the guidelines of each facility.
References
Supplementary Material
Please find the following supplemental material available below.
For Open Access articles published under a Creative Commons License, all supplemental material carries the same license as the article it is associated with.
For non-Open Access articles published, all supplemental material carries a non-exclusive license, and permission requests for re-use of supplemental material or any part of supplemental material shall be sent directly to the copyright owner as specified in the copyright notice associated with the article.