
Abstract
In the health care and medical domain, it has been proven challenging to diagnose correctly many diseases with complicated and interferential symptoms, including arrhythmia. However, with the evolution of artificial intelligence (AI) techniques, the diagnosis and prognosis of arrhythmia became easier for the physicians and practitioners using only an electrocardiogram (ECG) examination. This review presents a synthesis of the studies conducted in the last 12 years to predict arrhythmia’s occurrence by classifying automatically different heartbeat rhythms. From a variety of research academic databases, 40 studies were selected to analyze, among which 29 of them applied deep learning methods (72.5%), 9 of them addressed the problem with machine learning methods (22.5%), and 2 of them combined both deep learning and machine learning to predict arrhythmia (5%). Indeed, the use of AI for arrhythmia diagnosis is emerging in literature, although there are some challenging issues, such as the explicability of the Deep Learning methods and the computational resources needed to achieve high performance. However, with the continuous development of cloud platforms and quantum calculation for AI, we can achieve a breakthrough in arrhythmia diagnosis.
Introduction
Neuro-cardiovascular diseases are the leading cause of death in the world. Arrhythmias represent a category of these diseases associated with medical issues that can range from a minor inconvenience or discomfort to a fatal problem. An arrhythmia is an abnormality of the heart’s rhythm which is controlled by electrical signals. It may beat too slow, too quick, or irregular. 1 The electrocardiogram (ECG) is an effective tool for arrhythmia diagnosis, it measures the heart’s electrical activity. Other ambulatory devices can be used for the same aim, such as Holter Monitor. 2 However, the diagnosis of arrhythmias is not always obvious, especially for atrial fibrillation (AF) that can be related to asymptomatic and transient forms. Moreover, there are some limitations in the extraction methods and time series analysis from ECG singularities and their dynamics. To address these limitations, artificial intelligence (AI) is applied to the diagnosis and prognosis of diseases, such as arrhythmia. For this end, we focused in our previous works on the diagnosis of AF with machine learning (ML) methods. For instance, we conducted a multi-dynamics analysis of QRS complex with support vector machine (SVM) and multiple kernel learning (MKL) in Trardi et al, 3 which reached respective sensitivity values of 96.54% and 95.47%. Other works were mainly based on the extraction of different features from R-wave derivatives for automatic medical decision-making, especially for AF detection as in literature.4-6 In addition, the use of univariate and multivariate methods plays a major role in the analysis of the ECG time series.
On future work, the objective is to process ECG signals and classify different categories of heartbeat to detect different types of arrhythmia and thus help health care professionals. For this aim, we realized a literature review on ECG-based models for arrhythmia detection using AI techniques in the last 12 years.
This article is organized as follows: Section “Methods of Search and Selection” presents an overview on search strategy and the criteria of studies’ selection. Section “Results of Studies’ Exploration” emphasizes the exploration of the studies selected and the collected information from these studies. Section “Discussion and Interpretation” is dedicated to the interpretation and discussion of the obtained results, the contribution of this review, and comparison to other literature reviews. To sum up, the final section “Conclusions” contains a summary of the strengths and limitations of the used deep learning (DL) techniques.
Methods of Search and Selection
This section presents the search strategy, the criteria of selection, and the extraction of study characteristics.
Search strategy
To conduct this review, multiple academic research databases were selected to gather relevant articles that were published from January 2010 to September 2022. These open source databases are PubMed, IEEE Xplore, Springer, ScienceDirect, and ResearchGate. PubMed and IEEE Xplore are considered as 2 of the leading databases in biological sciences and engineering, respectively. 7 Springer is one of the leading research publishers that provides a large number of resources for literature in different fields. ScienceDirect was used for its several and various peer-reviewed journals and articles. For ResearchGate, it allows access to a large number of free papers because it is the largest academic social network in terms of active users. 8
To realize a targeted search, we identify articles from their titles and abstracts using the following keywords: “artificial intelligence for arrhythmia,” “arrhythmia diagnosis,” “arrhythmia classification,” “heartbeat classification,” “ECG classification.”
Collection of data sources was based on the process below:
Targeted web-based search.
Classification of sources by level of relevance.
Studies’ selection based on the inclusion criteria listed in Table 1.
Inclusion criteria.

Abbreviation: AUC, area under curve.
The selected databases provide peer-reviewed articles except ResearchGate that does not require a peer-review for the published articles.
Study selection
The scope of the studies selected comprises the following conditions:
➢ Studies conducted on the diagnosis of arrhythmia in the last 12 years;
➢ Studies addressing the classification of any type of arrhythmia to,
 Present a variety of databases,
Identify a large number of arrhythmia in both subclasses and super-classes;
➢ Studies handling the diagnosis of arrhythmia with no other cardiovascular disease interference to encircle tightly the scope and circumstances of occurrence of this abnormality and thus realize a precise and accurate diagnosis and prognosis.
Moreover, the studies can handle either beat classification or category classification. The former contains many subclasses of heart rhythm as shown in Table A3 (Appendix 1) and the latter addresses the classification topic based on the main arrhythmia categories defined by the American National Standards Institute/Association for the Advancement of Medical Instrumentation (ANSI/AAMI). Different heartbeat categories will be found in Table A2 (Appendix 1).
Many criteria were considered in the first articles’ selection, but only articles with the inclusion criteria sorted in Table 1 were retained.
Study mining: extraction of study characteristics
With a view to exploring the selected publications, retrieving information, and identifying patterns, we extracted the following characteristics:
Study perimeter: defines year of publication and authors;
Input information: includes datasets used in the study, number of participants, and number of arrhythmia classes to predict;
ECG signal information: contains ECG recording format and signal duration;
Feature set: defines the extraction approach and the extracted features from each study. The extraction methodology depends on the learning structure, hand-crafted methods, or end-to-end learning (where the selection, extraction, and classification are embedded in one stage);
Methods: define the pre-processing and prediction methods used in each study to implement the AI algorithms;
Evaluation: presents the metrics and key performance to evaluate the prediction.
The objective is to extract a large number of characteristics to analyze deeply each study.
Results of Studies’ Exploration
Selection
To search for the adequate papers, we rely on the process shown in Figure 1.

The process of study selection.
First, we realized a quick search for the topic by keywords which results in 730 records. Second, we removed duplicates given that we used 5 research databases, then a paper inventory was held by sorting publications by abstract.
When applying the inclusion criteria in Table 1, we focused on selecting papers that do not deal with other cardiovascular diseases. Although the study 9 includes the treatment of myocardial ischemia, it was selected because there was no interference with arrhythmia diagnosis; the 2 diseases were independently addressed. Irfan et al 10 used a dataset with 13 types of heartbeats, including arrhythmias and myocardial infarctions, which added more variety to the dataset without affecting the performance of the model for arrhythmia diagnosis.
We included the study 11 although they conducted the classification of congestive heart failure rhythm with the normal and arrhythmia rhythms because this allowed the classifier to have a higher recognition ability in classification.
In this stage, 100 records were selected. We adopted a diagonal-text reading and found that some papers focused on the analysis of the ECG signals without addressing the arrhythmia prediction, so we excluded 18 studies.
After a full-text review, we selected 40 studies that handle the arrhythmia classification with various methods of pre-processing and several approaches of diagnosis.
Study design
Various datasets were used for the selected studies. In total, 95% of the studies used open access datasets from PhysioNet repository 12 mainly the Massachusetts Institute of Technology-Boston’s Beth Israel Hospital (MIT-BIH) arrhythmia database. Besides, Li et al 13 used data collected from Fluke ProSim2 vital sign simulator which is a paying portable solution that transforms physiological simulation by adding multi-parameter functionalities, including ECG simulation and arrhythmia waveform selections. 14 Ribeiro et al 15 used the Telehealth Network of Minas Gerais (TNMG) dataset which was obtained from one of the largest telehealth services in Brazil. Hannun et al 16 used an own collected data recorded by Zio monitor which is a portable device described by physicians to diagnose irregular heart rhythms for up to 14 days 17 unlike Holter monitor, used in Park and Kang, 18 which can be worn only from 24 to 28 hours.
For the studies relying on the PhysioNet repository databases, some of them used small samples of individuals (between 14 and 78 participants). Hannun et al 16 included 53 877 participants aged 69 ± 16 years and Ribeiro et al 15 collected data from 1 676 384 individuals older than 16 years. The remainder of the studies did not report the exact number of participants (Table 2).
Input information.
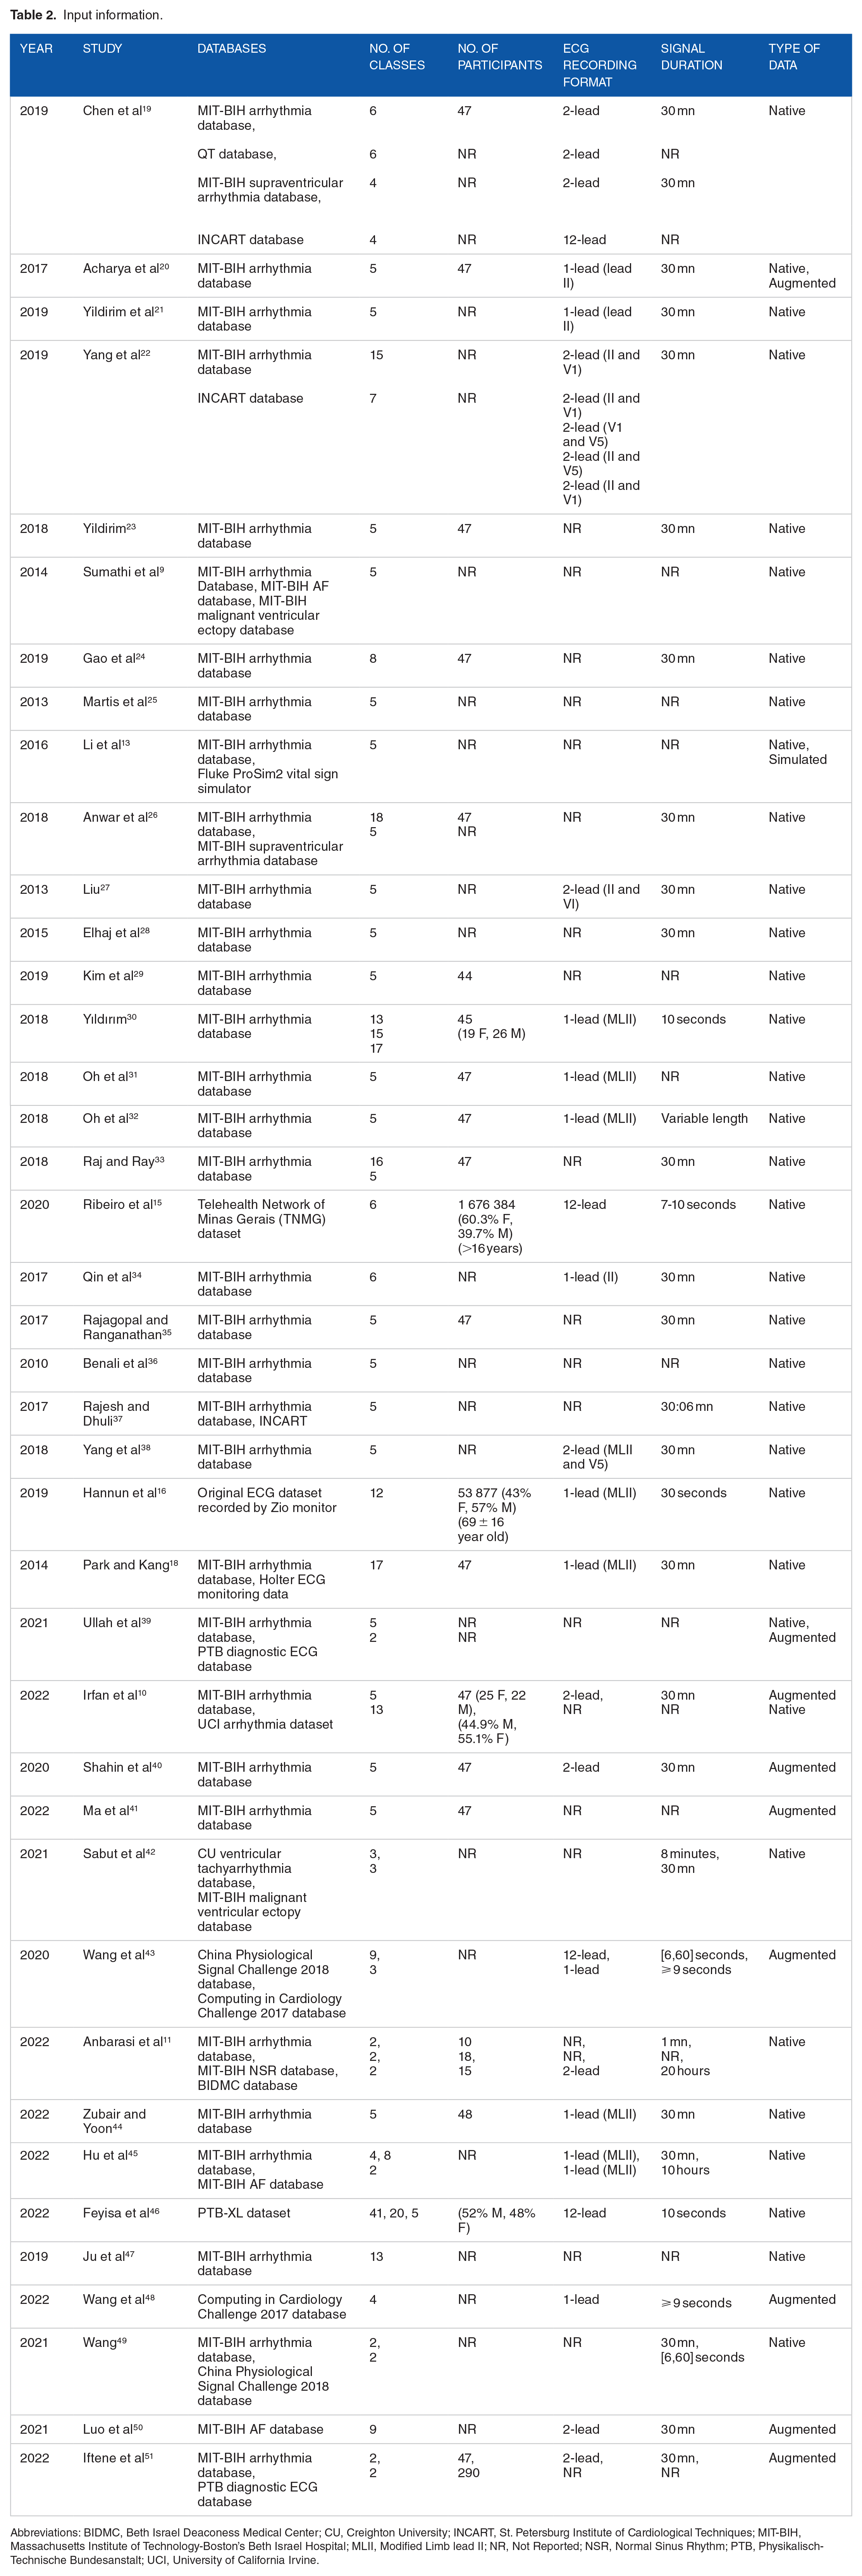
Abbreviations: BIDMC, Beth Israel Deaconess Medical Center; CU, Creighton University; INCART, St. Petersburg Institute of Cardiological Techniques; MIT-BIH, Massachusetts Institute of Technology-Boston’s Beth Israel Hospital; MLII, Modified Limb lead II; NR, Not Reported; NSR, Normal Sinus Rhythm; PTB, Physikalisch-Technische Bundesanstalt; UCI, University of California Irvine.
Figure 2 shows that 9 studies used augmented data to balance the datasets and enhance the AI models. It should be observed that most of the selected studies are published in the last 5 years, and this can be explained by the recent emergence of AI and the growth of literature sources lately.

Selected publications from 2010 to 2022.
Ullah et al 39 used 2 types of datasets from PhysioNet: MIT-BIH arrhythmia database and PTB Diagnostic ECG Database. In addition, they used generative adversarial network (GAN) model to generate new artificial signal for classes with small amount of data. The same technique was used to augment data in Ma et al. 41
Irfan et al 10 used the publicly available MIT-BIH arrhythmia database and UCI arrhythmia dataset available in the University of California Irvine ML Repository.
Synthetic minority oversampling technique (SMOTE) is used in literature10,50 to handle the problem of the imbalanced data in the MIT-BIH arrhythmia database and MIT-BIH AF database. SMOTE relies on a k-nearest neighbor algorithm to create new synthetic data. Whereas, Shahin et al 40 upsampled the training data by randomly duplicating the samples resulting in relatively equal classes but not as varied as it should be.
Two public databases from China Physiological Signal Challenge 2018 (CPSC-2018) and Computing in Cardiology Challenge 2017 (CinC-2017) were used in Wang et al; 43 the data were augmented by applying, respectively, flipping and random erasure techniques.
Hu et al 45 used MIT-BIH arrhythmia database for classifying 4 classes following the AAMI annotation and 8 classes following the widely used classification in literature. Different label classifications comprising 41, 20, and 5 classes are also reported in Feyisa et al 46 with the use of PTB-XL dataset which is a 12-lead database with various types of arrhythmia. Wang et al 48 used the CinC-2017 database and applied a data augmentation with the Mix-Up operation in the training stage to reduce the data imbalance and thus the overfitting; the method generates more training data without extra computational resources.
Table 2 shows in details the input information for each study.
The databases in the table above can contain a higher number of classes than what was reported in this review, but since there are some studies that focus on specific rhythms, we mentioned only the classes that were actually used for classification.
Feature set
Given that some studies used DL techniques, the end-to-end structure was implemented, in which selection, extraction, and classification are embedded in one stage. However, the hand-crafted methods process the extraction of features independently from other learning stages.
Raw ECG signal is fed as input to models where no feature extraction phase is required; Table 3 reports the hand-crafted studies where feature extraction was realized. In addition, the most employed technique for data extraction is discrete wavelet transform (DWT); 17% of the studies used this technique either separately as in literature9,19 or with other extraction methods, as in literature,13,25,26,28,34,35 such as principal component analysis (PCA) that was used in 15% of the studies. Other methods were used, such as Fast Fourier Transform (FFT) in Chen et al 19 and Higher-Order Spectra (HOS) in literature.25,28 Other studies used personalized DL techniques for feature extraction. For instance, Yildirim et al 21 used a convolutional auto-encoder (CAE) while Yang et al 22 used a canonical correlation analysis network (CCANet) which combines canonical correlation analysis and cascaded convolution network, and Yang et al 38 used a principal component analysis network (PCANet) which is a convolutional neural network (CNN) with PCA filters. Wang et al 43 realized a multi-scale feature learning with CNN kernels to extract features from segments with different size.
Feature set.

Abbreviations: CAE, Convolutional Auto-encoder; CNN, Convolutional Neural Network; DCT, Discrete Cosine Transform; DL-CCANet, Dual-Lead Canonical Correlation Analysis Network; DOST, Discrete Orthogonal Stockwell Transform; DST, Discrete Sine Transform; DWT, Discrete Wavelet Transform; HOS, Higher-Order Spectra; ICA, Independent Component Analysis; KICA, Kernel-Independent Component Analysis; LDA, Linear Discriminant Analysis; NR, Not Reported; PCA, Principal Component Analysis; PCANet, Principal Component Analysis Network.
Another type of signal decomposition is the intrinsic mode functions (IMFs) decomposition that can be characterized by empirical model decomposition (EMD) and ensemble empirical model decomposition (EEMD) as in Rajesh and Dhuli 37 or by variable model decomposition (VMD) as in Sabut et al. 42
Depending on the used approach, the features may be related to time-, frequency-, or space-domain and can be linear or nonlinear features (Table 3). In addition, 4 studies reported the use of MATLAB software to realize the feature extraction phase where the other studies did not fill in this information.
Pre-processing and prediction methods
All selected studies used pre-processing methods to handle the data except Hannun et al 16 that proceeded directly to the classification. In the selected studies, we found out that some methods were used once for feature extraction and other times for data pre-processing. The pre-processing methods include noise removal, data segmentation, data normalization, data reduction, signal compression, and signal detection. Wavelet transform (WT) method, including different types of wavelets, was used for noise removal in literature20,24,28,35,38 and with improved versions in literature.13,23 Sumathi et al 9 used Symlet WT for QRS detection as shown in Table 4. The Pan–Tompkins algorithm proposed by Pan and Tompkins 52 was used for segmentation and QRS detection in literature18,25,28 and for R-peak detection in literature.20,33,35,38 More than half of the studies used data normalization. Some studies used ML methods for data processing as in Yildirim et al 21 and Liu 27 where they used, respectively, CAE for signal compression and SVM for QRS marking. Ullah et al 39 mentioned segmentation and pre-processing of data with no more details on the used techniques. Irfan et al 10 applied standardization of data (standard scalar unit) and feature reduction with PCA on the UCI dataset, and noise removal with DWT and normalization on the MIT-BIH arrhythmia dataset.
Pre-processing and prediction methods in the selected studies.

Abbreviations: BGRU, Bidirectional Gated Recurrent Unit; CPSC, China Physiological Signal Challenge; CNN, Convolutional Neural Network; CWT, Continuous Wavelet Transform; DL-CCANet, Dual-Lead Canonical Correlation Analysis Network; DWT, Discrete Wavelet Transform; EEMD, Ensemble Empirical Mode Decomposition; EMD, Empirical Mode Decomposition; GBM, Génie Bio-médical; GRU, Gated Recurrent Unit; HOS, Higher-Order Spectra; INCART, St. Petersburg Institute of Cardiological Techniques; LSTM, Long Short-Term Memory; LSTM-WS, Long Short-Term Memory Wavelet Sequence; MIT-BIH, Massachusetts Institute of Technology-Boston’s Beth Israel Hospital; NN, Neural Network; NR, Not Reported; RBF, Radial Basis Function; SVM, Support Vector Machine; UCI, University of California Irvine.
In addition, data padding was reported in Wang et al 43 as a processing operation to fix the input length.
Using continuous WT, Anbarasi et al 11 transformed 1-D signal to 2-D colored images to feed the CNN network. The transfer learning was introduced in Hu et al 45 to overcome the imbalance data problem.
Ju et al 47 proposed a bidirectional gated recurrent unit (GRU) network where the output is linked to the forward and backward states resulting in a better fit than unidirectional GRU and simpler structure than LSTM. To alleviate the issue of redundancy in bidirectional GRU, Wang 49 used an improved version of the aforementioned technique by adding a scale parameter to the model and combining it with CNN for feature extraction.
As shown in Table 4, the selected studies used several AI methods:
ML methods: SVM, random forest, decision tree, feedforward NN, residual NN, K-nearest neighbors.
DL methods: CNN, long short-term memory (LSTM), GAN, GRU.
Statistical AI methods: CCA, linear discriminant analysis.
Artificial evolutionary algorithms: Genetic algorithm.
Mathematics algorithms: Fuzzy logic, directed acyclic graph.
Some studies used the methods above either separately, combined, or in personalized view adapted to the application context to enhance the model performance. For instance, Sumathi et al 9 combined fuzzy logic with NN, and Ullah et al 39 combined CNN with LSTM, and Attention method which uses a weighted sum of all the encoder hidden states to flexibly focus the attention of the decoder to the most relevant parts of the input sequence. Feyisa et al 46 relied on a multi-receptive CNN where the receptive field can be obtained by either using multiple kernels of different sizes or using a fixed-size kernel with a varying dilation rate.
Most of the studies reported the use of k-fold cross-validation method for evaluation.
When there are various classes/categories in the dataset, the mentioned metrics refer to the overall performance on the ensemble of classes or databases. For more details, Table A1 (Appendix 1) shows different metrics for evaluation.
In the case of multi-class classification, we adopt averaging methods for some metrics calculation, resulting in a set of different average scores (macro, weighted, micro) in the classification report.
Discussion and Interpretation
In this review, we synthetize some literature studies addressing the ECG diagnostic approaches and the arrhythmia classification methods. We establish a comparison between the selected studies by discussing the following topics.
Used datasets and ECG signal information
The set of databases used in the selected studies is listed below. There are some studies that tested some of these databases separately or combined to provide high amount of data. The BIDMC database used in Anbarasi et al 11 for congestive heart failure was excluded from this analysis because we want to focus only on databases with arrhythmias.
Open access databases: MIT-BIH databases, QT database, INCART database, PTB diagnostic ECG database, CU ventricular tachyarrhythmia database, Computing in Cardiology Challenge 2017, China Physiological Signal Challenge 2018, PTB-XL dataset. More details about these databases are found on PhysioNet Bank.
12
UCI arrhythmia dataset: An open access database available on the ML repository of the UCI university.
53
Telehealth Network of Minas Gerais (TNMG) dataset: Data collected under the scope of the CODE (Clinical Outcomes in Digital Electrocardiology) study in the Telehealth Network of Minas Gerais which is a public telehealth system in Minas Gerais, Brazil. Publicly available on TNMG dataset.
54
ProSim simulator dataset: An industry-leading patient simulator for monitoring and preventive testing, developed by Fluke Biomedical. It is a commercial paid solution.
14
Zio monitor dataset: Non-free ambulatory monitoring solution developed by iRhythm Technologies Inc, San Francisco, CA. The solution provides FDA-cleared, single-lead, patch-based ECG monitor that continuously records data from a single vector, the recording can be up to 14 days.
17
Holter monitor dataset: Private data collected from wearable device which records heartbeats for diagnosis. It is a noninvasive solution that can be worn up to 2 days.
As shown in Table 2, 33 out of 40 studies used the MIT-BIH arrhythmia database.
To diagnose arrhythmia, the studies relied on the multi-class prediction. Most of the studies predicted the occurrence of more than 2 types of the arrhythmic heartbeat, yet not all of the studies using 12-class prediction and more recorded the highest performances as in literature.16,18,22,26,30,33 This can be explained by the imbalance of datasets; some heartbeat types have a small number of records which affect negatively the classification rate.
However, 33 out of the 40 selected studies performed the classification with input signal equal to 30 minutes’ length (Table 2). Only 1 study used variable length duration, 31 and a special U-net architecture was developed for this purpose to handle the variable-size data.
As of the ECG recording format, only literature15,19,43,46 used 12-lead ECG signal which is the standard technique in the real clinical settings. Although literature15,16 provided the largest datasets among all the selected studies which can improve the model ability of generalization, they did not reach the highest performances due to the imbalance of data. Also, Hannun et al 16 did not apply any pre-processing methods on the data which can increase the error rate.
Data augmentation is used to tackle the issue of data imbalance. While some techniques help to mitigate the overfitting in the training stage, such as SMOTE technique and GAN network, other methods allow only to increase the volume of data without having a measurable effect on the performance and the variance of the dataset since they rely on a simple resampling or the addition of Gaussian noise and interpolation as in Iftene et al. 51
It is logical to analyze the use of different datasets in the same study since it used the same pre-processing and prediction methods. The comparison of the same database used in different studies will not be relevant.
Figure 3 shows that INCART database in Chen et al 19 reached the highest accuracy among the other databases, given that all of them were imbalanced. This good performance can be explained by the fact that INCART is 12-lead and the study combined features from all these leads to ensure classification. However, Yang et al 22 showed better accuracy for MIT-BIH database than INCART, from which were extracted only 2 leads (II and V1). Irfan et al 10 and Wang 49 recorded better results on MIT-BIH database because the other databases were highly imbalanced.
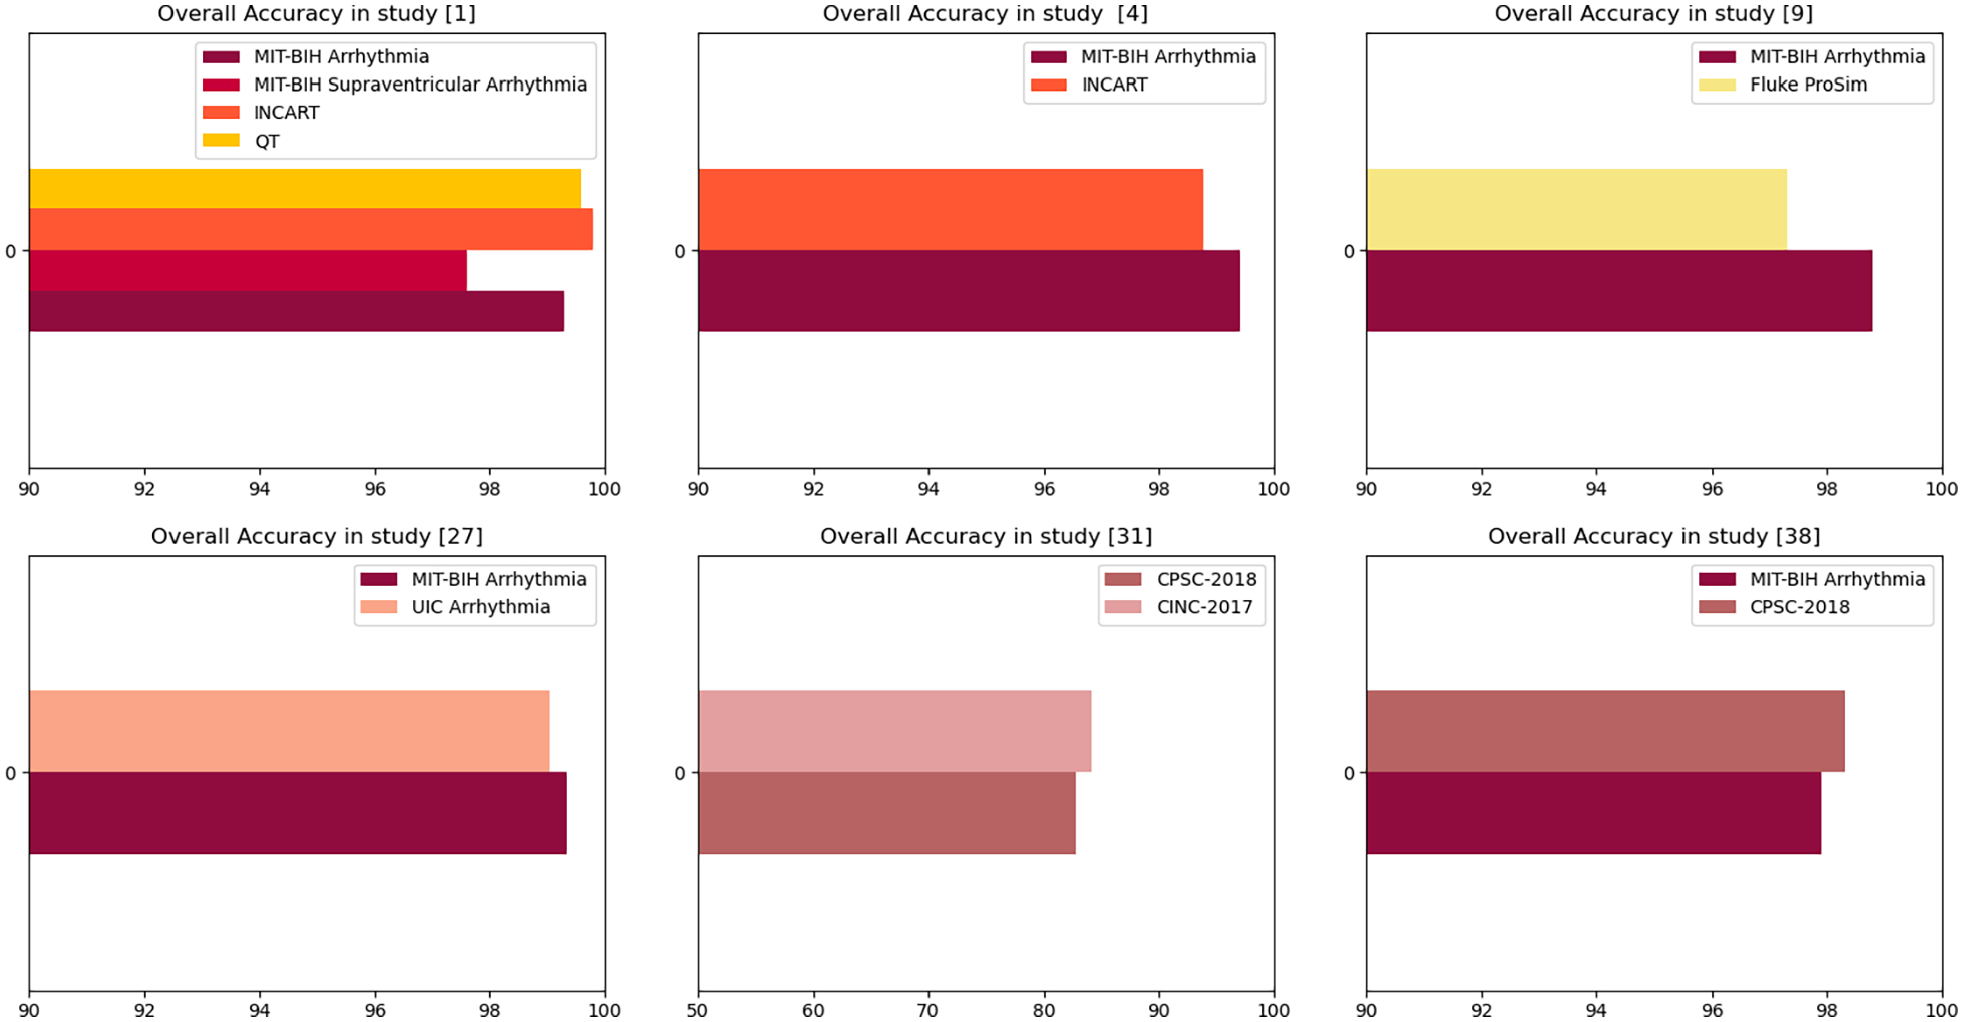
Overall accuracy recorded in some datasets.
Taking everything discussed above into account, we assume that:
 MIT-BIH still is one of the best and most complete databases used in arrhythmia classification as it provides annotations, signal characteristics, and different lead recordings.
The combination of 12-leads can help increasing the accuracy because the model will be fed with various information.
It is essential to tackle the imbalance data issue because it can hinder good pre-processing and prediction techniques from achieving higher performances. SMOTE technique is recommended for this end.
Feature selection and extraction
Table 5 indicates the types of some extracted features from the selected studies. The most used features are RR intervals, which represent the time-domain, and the amplitude of R wave, which represents the space-domain. Moreover, the WT and the PCA methods are the most used in the feature extraction stage, given that PCA provides low-dimension features while preserving as much of the data variation as possible and WT allows to capture both frequency and time information.
Types of extracted data.
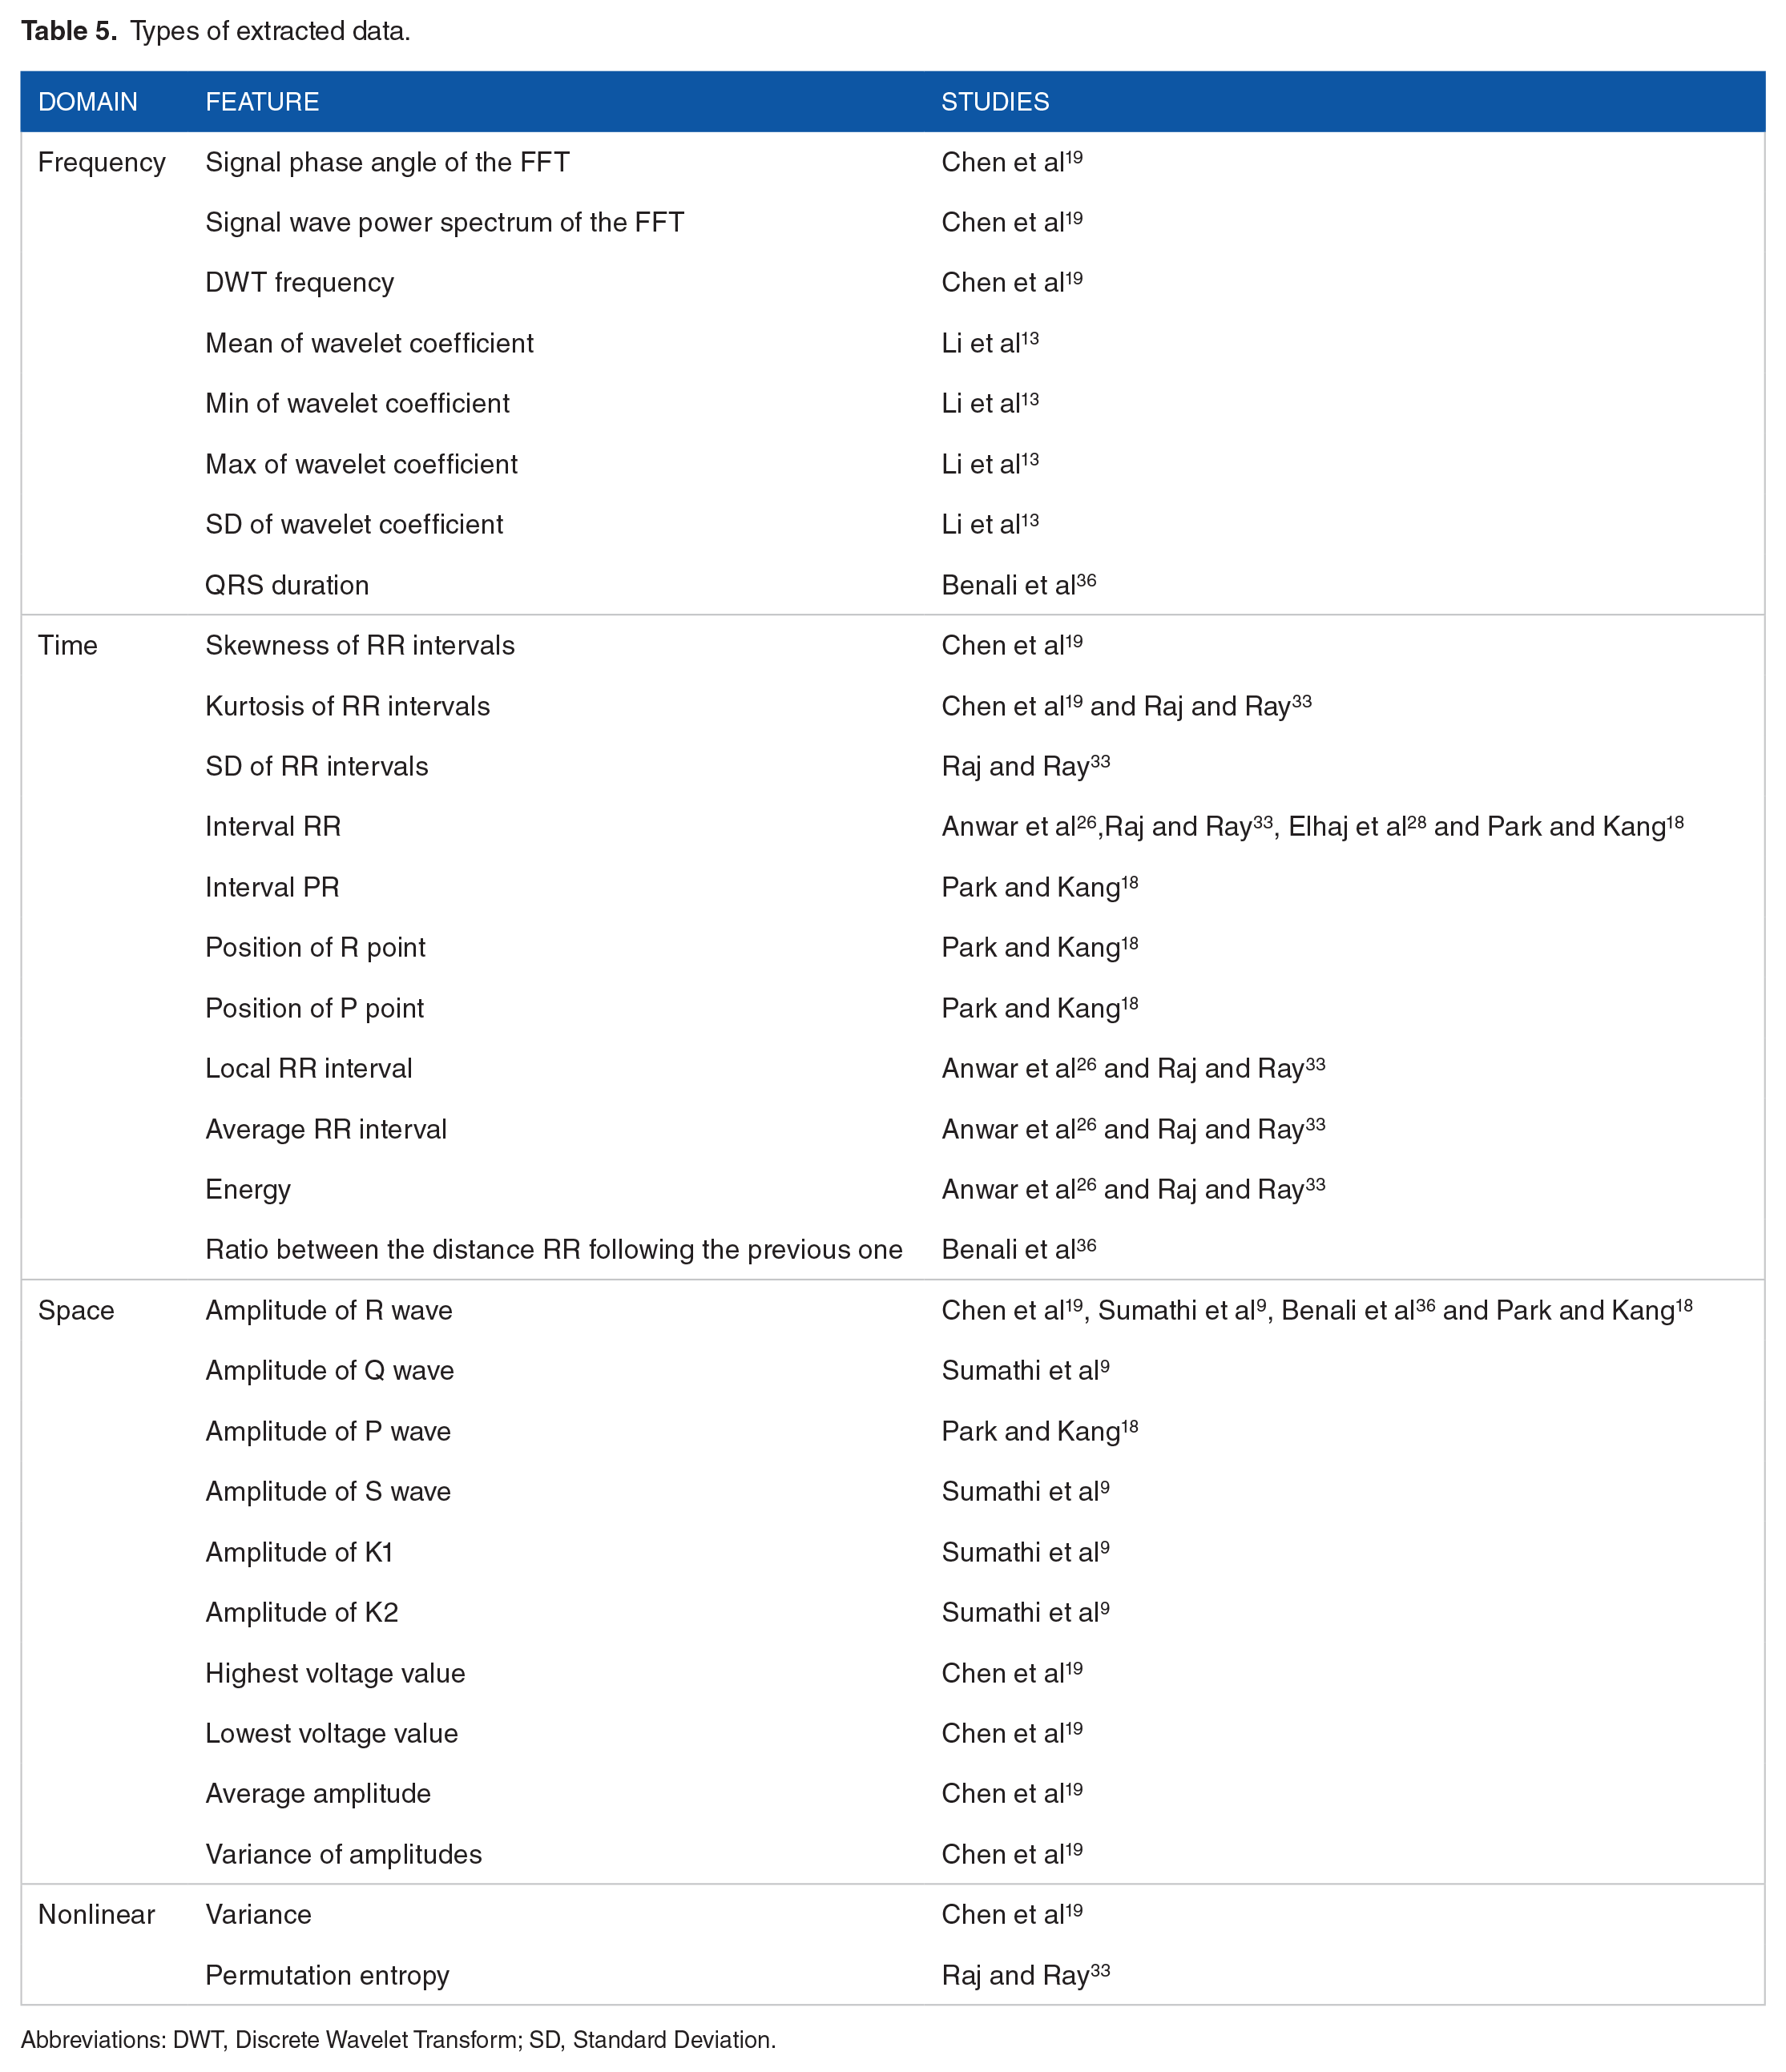
Abbreviations: DWT, Discrete Wavelet Transform; SD, Standard Deviation.
Sabut et al 42 extracted various features having temporal, statistical, and spectral information, such as filter leakage measure, covariance, kurtosis, skewness, threshold crossing interval, Shannon Entropy, etc to improve the accuracy of classification.
For the studies based on DL models, such as CNN as in literature,39,40,41,45 the extraction is held by the DL model itself, by sliding multiple convolutional windows over the ECG and performing multiple convolutional operations on the local features.
There is no doubt that feature extraction allows a better understanding of the model as it helps setting an explicit feature design of the ML model but when it is embedded in the DL model, it decreases the consumption of resources and time. For instance, we can rely on the strength of CNN for dealing with the extraction stage even if CNN can be time-consuming when a high number of layers are used.
Pre-processing methods
According to Table 4, only 1 study was not subject to data pre-processing. The most used techniques are ECG heartbeat segmentation (17 studies), noise removal (13 studies), data normalization (8 studies), and QRS detection (6 studies). However, 4 studies relied on R-peak detection and this detection reached an accuracy of 99.3% in Oh et al. 31 Furthermore, the most used algorithms in the pre-processing phase are the Pan–Tompkins algorithm to detect accurately R peaks and QRS complexes, and the WT to reduce the cost of continuous wavelet computation.
Table 6 below summarizes the pre-processing methods, their application, and the objective from their usage.
Pre-processing methods and their applications.
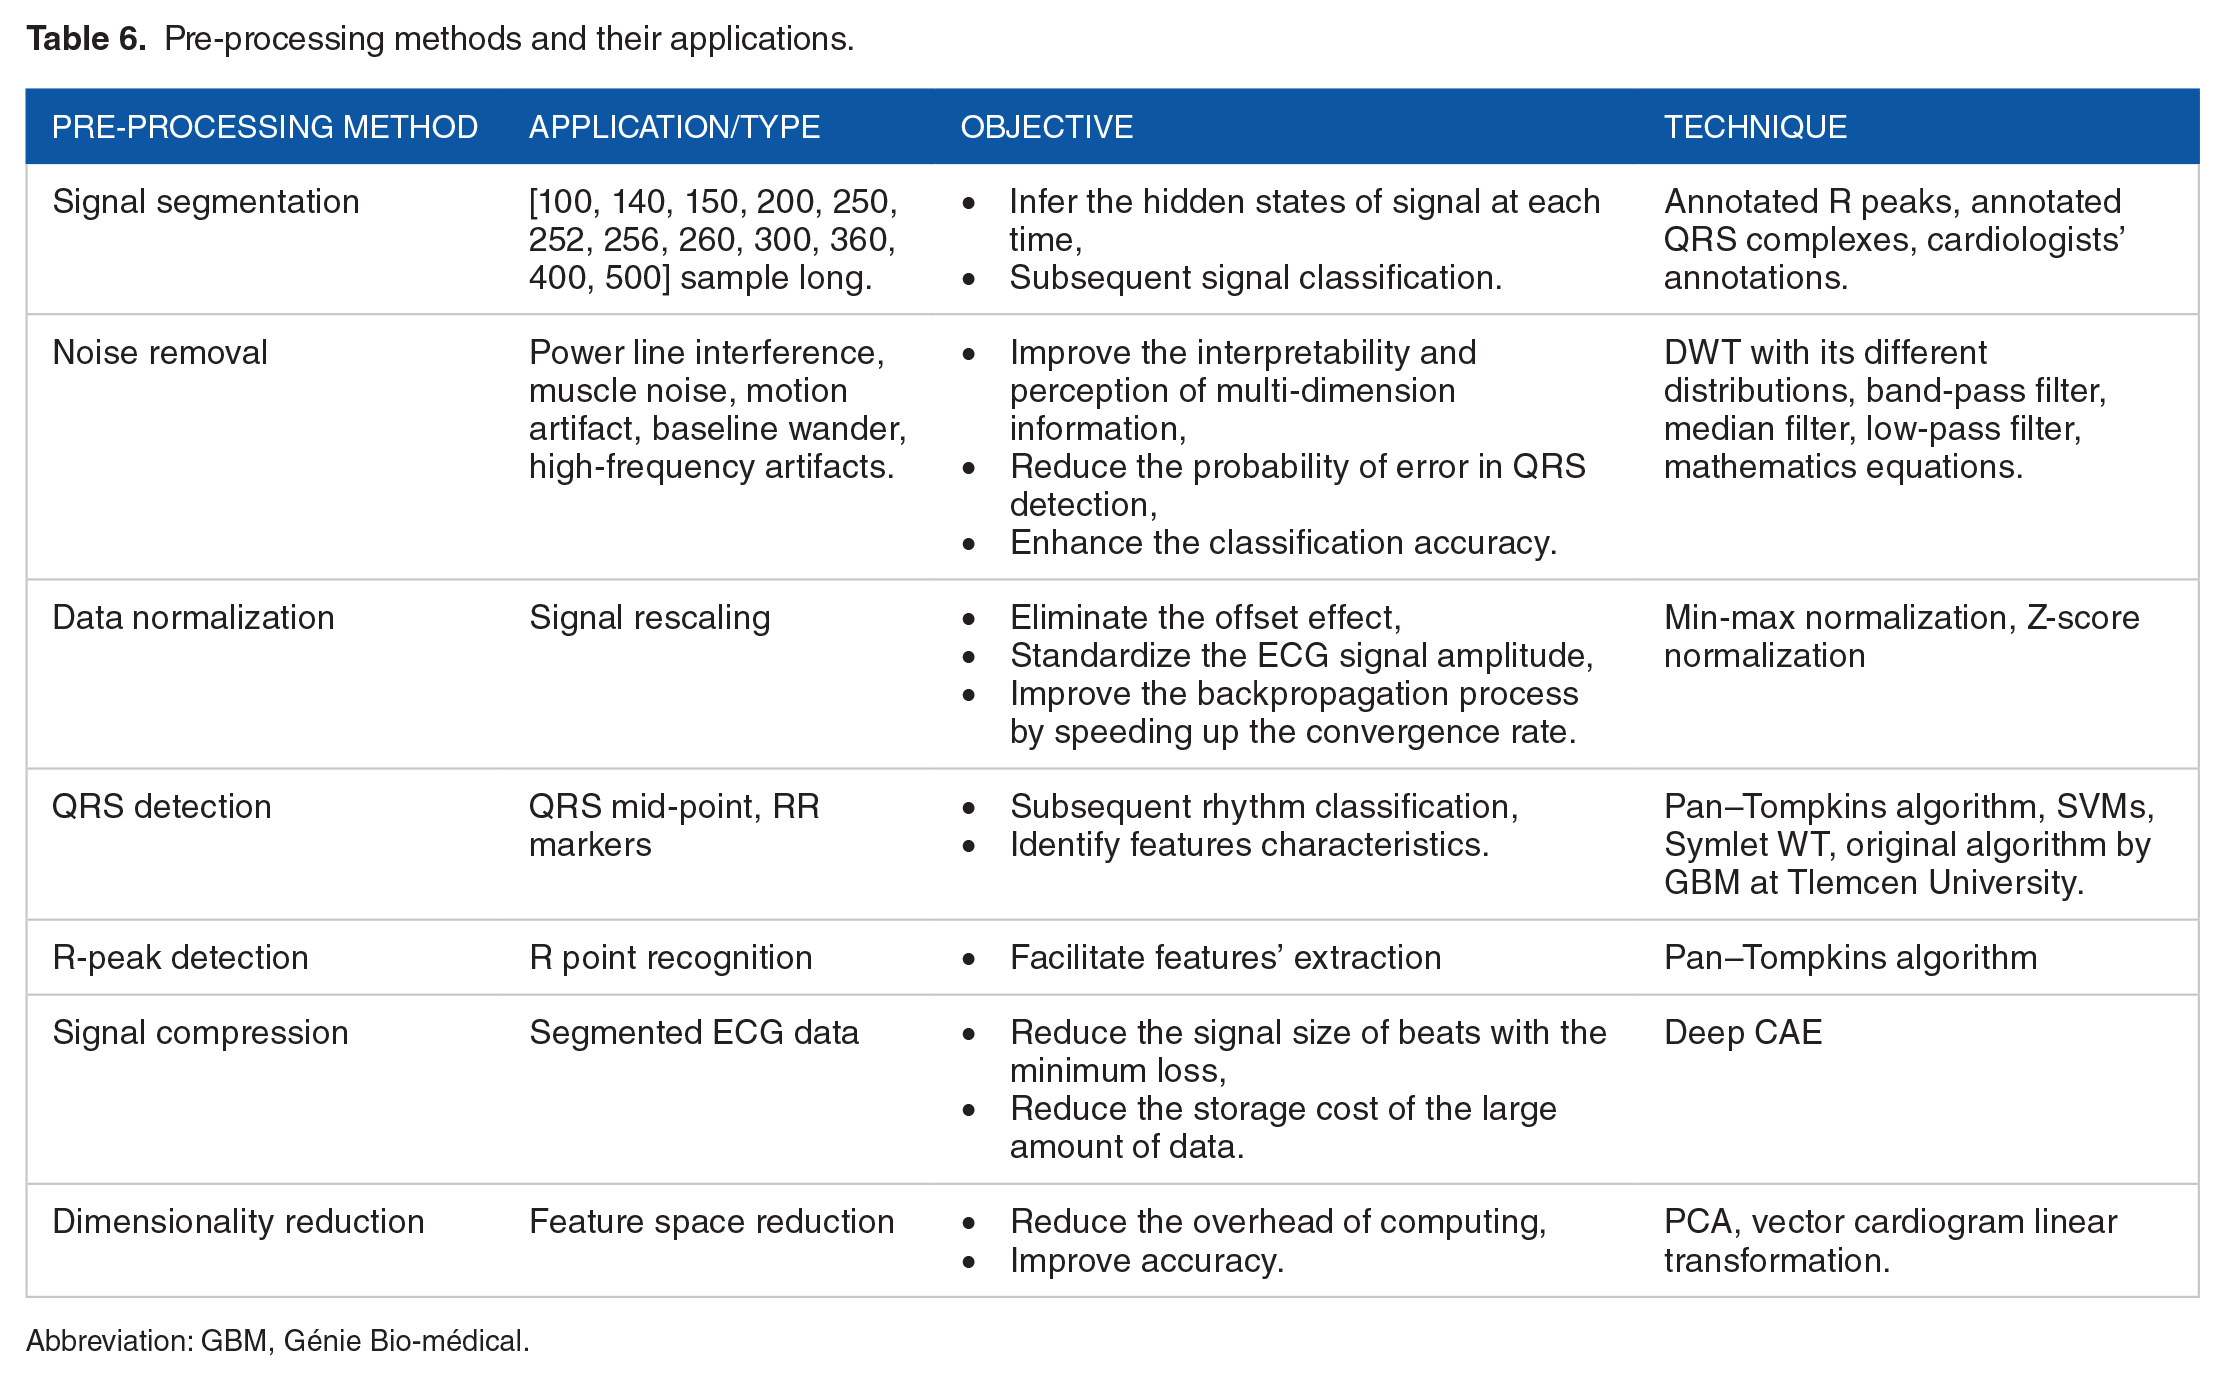
Abbreviation: GBM, Génie Bio-médical.
The ECG signal segmentation is applied with different sample-long segments that vary between 100- and 500-sample long. The samples are centered either around the detected R peaks or the detected QRS complexes. The segmentation can also rely on the extraction of T-to-T segments as in Zubair and Yoon, 44 or can simply rely on the database annotation files.
Noise removal method is applied to remove different types of noise that can result from patient motion or respiration, power line interference, muscle artifacts, baseline drift, electrode motion artifact or data-collecting device noise. To the fact that each noise source resides in a characteristic frequency band, different filters and techniques are used depending on the type of noise.
Data normalization can be considered one of the most interesting methods due to its important influence on the classification process. Namely, signal rescaling improves significantly the backpropagation process by speeding up the convergence rate.
Most of the studies where pre-processing was applied to data showed a better performance on the classification as in Iftene et al 51 where CNN model reached an accuracy of 95% without pre-processing vs 98% when applying data augmentation and normalization.
The other pre-processing methods used in the selected studies are shown in Table 6.
To show the correlation between the use of pre-processing methods and the obtaining of better accuracies, we plot the performance corresponding to different pre-processing methods.
We compare between noisy data and noise-free data. Figure 4 shows that when cleaning data from noise, better accuracy can be obtained. Yet, Yang et al 38 demonstrated its ability to detect successfully noisy heartbeats with different ML methods. This is due to the use of PCA filters when extracting features, which can remove implicitly unwanted noise.

Accuracy of noisy data vs noise-free data.
We notice that all the studies which recorded accuracies lower than 90% did not undergo noise removal.
As result, we affirm that the use of one or many combined pre-processing methods can decrease the error rate. It is highly recommended to realize data augmentation and noise removal to avoid misclassifications and improve the detection ability of arrhythmia.
Prediction methods
As shown in Table 4, CNN and LSTM network are the most used techniques, followed by the SVM in 22% of the studies. Indeed, more than half of the studies used DL techniques to improve the accuracy. CNNs are used with different variants in the convolutional blocks as in literature.44-46
Some studies reported the computation time in the learning phase; Yang et al 22 recorded the lowest training time with a value equal to 68.8 seconds using leads II and V1. The use of CCANet in the feature extraction phase has definitely reduced the computation cost and improved the accuracy and specificity which reached, respectively, 99.4% and 99.6%.
Shahin et al 40 reported a very interesting DL technique; the architecture of the adversarial multi-task model consists of 3 networks: the generator network, the heartbeat-type discriminator which discriminates between 5 types of heartbeats, and the subject discriminator which discriminates between 39 different subjects. This design has increased the performance allowing double discrimination and forcing the system to take into account only the heartbeat variations. Yet, it can be improved by changing the method of synthetic data generation; generating new data with GAN network or SMOTE technique instead of upsampling which generates duplicated data.
Sabut et al 42 used a fusion of 2 CNN branches with different scales and an Attention module to mine the discriminative features. In fact, the attention mechanism boosts the classification performance as shown in Hu et al 45 where the attention helped to capture the inter-beat dependencies.
The combination of residual convolutional blocks and bidirectional LSTM model with Attention method in Ma et al 41 seems to be effective since it allows a local and global feature extraction, and high accuracy that reached 99.4%. Zubair and Yoon 44 mitigated the problem of imbalanced data in CNNs by designing a novel cost-sensitive loss function in the network. This learning strategy is based on training efficiently the model without changing the distribution of the data. Besides, the aforementioned study highlighted the use of 2 different paradigms: the intra-patient and inter-patient classifications to show how the latter achieves better generalization capability.
Luo et al 50 used a hybrid model combining CNN layers, LSTM, and GRU networks. Indeed, the authors took advantage of every network’s strength: the high ability of temporal and spatial information extraction of CNN, acquiring sequential information by LSTM, retaining only relevant information by the GRU, and avoiding the gradient disappearance issue.
As for the development tools, Python was used with its different ML libraries, such as TensorFlow, PyTorch, Scikit-learn, and Keras. MATLAB is also employed in some studies. Iftene et al 51 developed the prediction technique in the Amazon Web Services platform using an integrated DL model.
We gather the prediction methods used in this review in the scheme below (Figure 5).
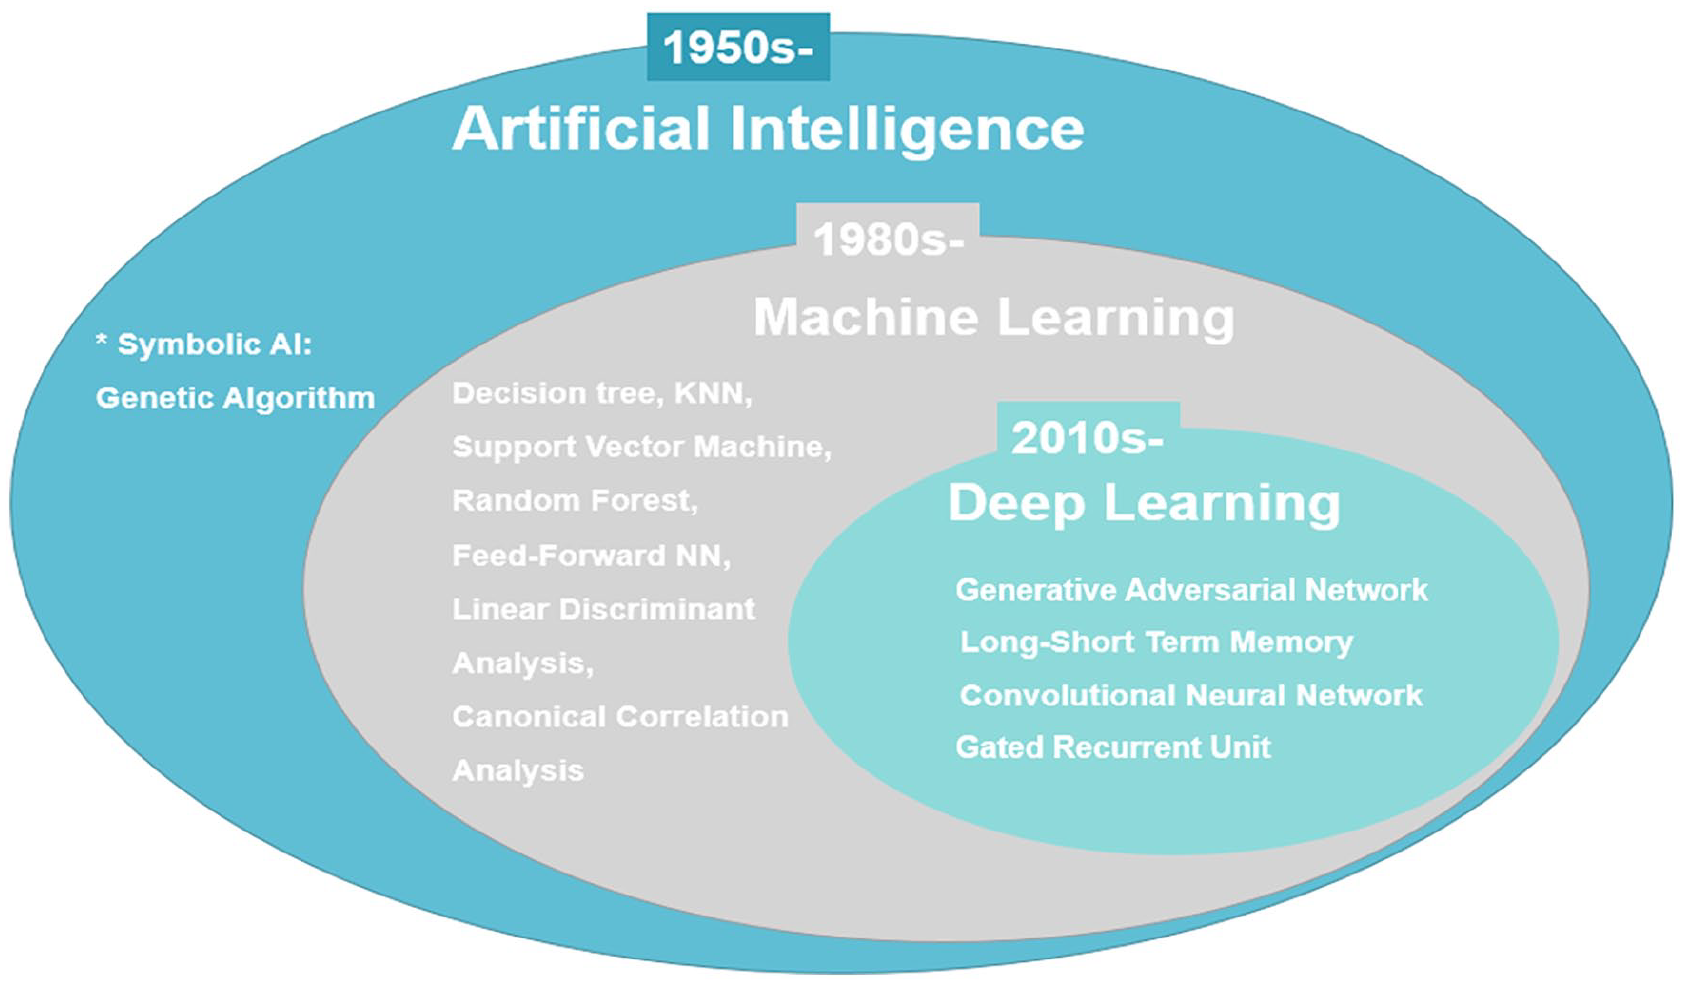
Used AI methods.
General AI can be divided into 2 categories:
We visualize the accuracy of CNN and SVM networks in Figure 6.

Accuracy of CNN and SVM models.
As it can be shown, the average accuracy over all the studies that used CNN is 97.82% vs 98.41% for SVM. When running through literature, we find that SVMs when preceded with feature extraction stage can achieve promising results. The selected studies in this review used PCA filters, DWT, and convolutional layers for the extraction which definitely have boosted the SVM performance.
Taking everything into consideration:
○ The CNN and LSTM are the most used techniques in the last years; they allow the extraction of temporal, spatial, and sequential information from the ECG signal and they analyze deeply the extracted features which result in high accuracy.
○ The attention method can boost the classification performance and the generalization ability.
○ Pre-processing combined with DL techniques can help achieving promising results.
○ To achieve high performance, DL methods need high-performance computing.
○ When high computational resources are not provided, the use of SVM can be a good alternative for arrhythmia detection but should be preceded with relevant feature extraction methods which can be time-consuming.
Evaluation and performances
First, we compare the studies that used the same datasets. We sort 7 different datasets available on the PhysioNet repository: 23 MIT-BIH arrhythmia database, QT database, MIT-BIH supraventricular arrhythmia database (SV), INCART, MIT-BIH atrial arrhythmia database, Malignant ventricular arrhythmia database, and PTB diagnostic ECG database, besides 4 non-open datasets collected during studies13,15,16,18 either from simulation devices or Holter monitor or ECG recorder as indicated in Table 2. However, 2 studies19,26 used SV database, Anwar et al 26 combined the data from both MIT-BIH arrhythmia database (MIT-BIH) and SV database to apply class-oriented prediction (based on different sub-categories of beats depending on the used datasets) with 18 classes and subject-oriented prediction (main category classification with beat’s annotation according to ANSI/AAMI standard) with 5 classes while Chen et al 19 applied class-oriented scheme with 4 classes. As shown in Figure 4, the model combining MIT-BIH and SV databases achieved a high accuracy of 99.8%, whereas the model relying only on SV database achieved an accuracy of 97.6% (Figure 7). Nevertheless, both the results were promising.

Average classification accuracy on SV database.
Studies19,22,37 enrolled the learning phase using INCART database for 4-class, 7-class, and 5-class prediction, respectively. The highest accuracy of 99.8% was achieved by the first study where they used 12-lead ECG recording format vs an accuracy of 98.76% with 2-lead format and 97.57% for the 2 other studies. For the rest of the studies where they used MIT-BIH arrhythmia database, all of them reached an accuracy above 90%.
Second, we carry on a comparison between studies using the same prediction methods. Regarding the studies applying SVM, they used different kernel functions and some of them were combined with other ML algorithms, but most of them yielded an accuracy greater than 94%. This can be explained by the powerful methods used for feature extraction and data pre-processing, including the use of DL techniques,20,22,38 in these studies. When comparing the studies that applied CNN, all of them attained high accuracy rates above 94%. The lowest metrics (accuracy, specificity, and sensitivity) were obtained by Qin et al 34 that performed SVM on record-based training scheme where the classifier was trained and tested on separate records from different individuals.
Regarding the studies with smaller signal durations (between 7 and 30 seconds), they achieved good F1-score values but the highest scores were obtained by 30-minute duration studies. And yet, the increase in ECG signal length does not guarantee the highest accuracy rates. Indeed, in this review, the studies with the lowest signal duration15,16,30 could perform better, especially when they applied deep CNNs; however, they either did not proceed data pre-processing 16 or they used imbalanced data 30 for the classification.
In Irfan et al, 10 the DL model achieved better results on the second dataset, this is due to the highly imbalanced data in the first dataset. Only the accuracy of the best model was reported in Table 4 (an overall accuracy of 99.35% for balanced data vs 93.33% for imbalanced data).
For Shahin et al, 40 the adversarial multi-task model achieved an overall accuracy of 86% on the validation set and 87% on the test set, which are lower comparing to other techniques, due to the imbalanced data.
Zubair and Yoon 44 achieved a high accuracy of 99.81% in the intra-patient paradigm with CNN with different size kernels and cost-sensitive function. Hu et al 45 reached an accuracy of 99.49% for 4 class-categorization with transformer encoder–decoder network with CNN layers and attention mechanism. The use of CNN with different kernel sizes (to capture different segment and interval lengths) allowed to obtain an accuracy of 98% for 41 arrhythmias classification.
Wang 49 used a novel method of premature ventricular contraction (PVC) detection where they modified a GRU network to avoid the redundancy of information in the forward and backward connections. This improved version of GRU yielded an accuracy of 97.9% on MIT-BIH data and 98.3% on CPDB.
Most of methods relying on DL, ML, statistical AI techniques, or a combination of them had performed high accuracies because all of the selected studies in this review realized rigorously the feature extraction phase and the pre-processing phase.
Among the studies selected, there are many that have used variety of approaches/databases/methods. Depending on each criterion, we linked the use of pre-processing and prediction methods to the accuracies which they are shown in Table 4.
Contributions and comparison to other literature reviews results
We compare our review to other review papers in literature that focus on reviewing studies with ML methods for arrhythmia classification.
Some papers focused only on describing the DL techniques and neglected the effect of the pre-processing stage and the type of datasets on the performance as in review 55 which conducted a shallow description of the papers. Unlike Ebrahimi et al, 56 where they realized a well-organized overview to the existing papers in literature starting from 2017. Yet, they basically selected papers using the public PhysioNet databases which can be useful when producing and comparing works between researchers, but it neglects the DL performance that can be recorded on wearable monitoring devices. In the same review, they presented papers that used variants of GRU, RNN, and CNN: models with very promising results in the literature.
One of the strong points of Annam et al 57 is the presentation of the inter-patient vs the intra-patient paradigms in heartbeat classification with both DL and ML techniques. However, they did not discuss the pre-processing methods used in the selected papers. Jensen et al 58 and Tamariz et al 59 focused on the study of papers handling the validation of, respectively, AF occurrence and ventricular arrhythmias while focusing on the validation metrics and the used datasets without dedicating special attention to the classification methods which were reported as administrative codes. Jensen et al 58 reported only 16 studies which can question the relevance of this review. Sanamdikar 60 reported feature extraction, pre-processing, and prediction techniques for arrhythmia classification with description of the used databases. However, the review was limited in terms of the reported techniques, especially for the pre-processing where they mentioned only noise removal.
One of the most interesting reviews in literature is Luz et al. 61 They relied on a good search strategy and succeeded to report information about used databases, feature extraction, pre-processing, and prediction methods.
Parvaneh et al 62 presented an overview on arrhythmia detection with respect to the following aspects: used datasets, type of input data, model architecture, and evaluation metrics. Due to the shallow analysis of the selected papers, this review is considered to be conceptual. The DL architecture and feature extraction were briefly stated. Another gap is the absence of pre-processing methods which should be discussed because they affect the performance of the DL model. However, Houssein et al 63 focused on the studies related to arrhythmia classification by artificial neural network (ANN) and SVMs. The review presented the 3 main stages prior to classification: pre-processing, feature extraction, and feature selection. Detailed information about every phase was given while relating to the used methods in every study. Thus, this can be an interesting review for reference but since they focused only on 2 models, ANN and SVM, more papers should have been included to the analysis.
The strengths of our review can be mentioned as follows:
We presented the search method and the inclusion criteria that we rely on, to select the studies analyzed in our review.
We reported and analyzed papers using either DL or ML or both, to emphasize the good performance that can be reached when combining different techniques. Moreover, we want to provide the reader with other alternatives when high computing resources are not provided.
We established a deep description of the papers; exploration of used datasets, feature extraction, pre-processing, prediction methods, and performance evaluation.
We pointed out the advantages and limitations of the used methods.
We analyzed the relationship between the high performance and the use of pre-processing methods, especially noise removal and data augmentation which help avoiding misclassifications.
We believe that this review can help in defining the scope of future research work when planning to apply ML or DL techniques for arrhythmia classification to given datasets.
In the future, we plan to follow up this literature by the developing an AI model to classify ECG heartbeats and predict the occurrence of arrhythmia.
Conclusions
This review synthetizes and interprets some of the papers in the literature that deal with arrhythmia detection using ECG-based models.
Taking everything into account, we summarize the findings of this review as follows:
➢ The selected studies relied on a multi-class prediction of arrhythmia with no other cardiovascular disease diagnosis, to keep the focus on the irregularity of heartbeat types related to the arrhythmic aspect. Most of the studies used a 30-minute signal length and a single- or dual-lead ECG recording format.
➢ ECG heartbeat segmentation relies on the signal sliding based on the position of R peaks with equal-size segment. Therefore, variable-size segments should be used more frequently, especially when detecting arrhythmias to capture the intra-beat and inter-beat irregularities.
➢ Most of databases contain imbalanced data which result in heartbeat misclassification for the minority classes. Therefore, strong methods for data augmentation should be used as SMOTE or GAN network.
➢ It is found that the use of data augmentation technique is proportional to the use of DL techniques which need balanced data to emphasize their performance.
➢The most performing models used arrhythmia databases from the PhysioNet repository mainly the MIT-BIH databases because they are properly annotated and organized. Moreover, the most used features were RR intervals and the amplitude of R waves which indicate the importance of these time-domain and space-domain features, respectively, in the prediction of arrhythmia.
➢Overall, 96% of the selected studies applied pre-processing methods among which there are noise removal, normalization, and QRS detection. These methods demonstrated their efficiency in decreasing the computing cost and increasing the accuracy rate.
➢ All selected studies used either ML techniques or DL techniques, indicating that AI is becoming an important twist in the health care and telemedicine field. The most used technique is CNNs followed by SVM and the combination of CNN and LSTM. The use of SVM, with the combination of DL techniques in the feature extraction and the pre-processing phases, recorded very important results.
In Table 7, shown all techniques that are used in arrhythmia classification in this review. We present the advantages and limitations of each classification method as they are identified by the authors of each study.
Advantages and limitations of arrhythmia classification methods.

Abbreviations: AED, Automatic External Defibrillator; BNN, Bayesian Neural Network; GA, Genetic Algorithm; GPU, Graphics Processing Unit; INCART, St. Petersburg Institute of Cardiological Techniques; KNN, k-nearest neighbors; LSTM, Long Short-Term Memory; MIT-BIH, Massachusetts Institute of Technology-Boston’s Beth Israel Hospital; NR, Not Reported; SVM, Support Vector Machine.
We notice that the most common limitations for the use of DL methods are that they are time-consuming and computationally expensive and require very efficient hardware resources. Otherwise, they can perform accurately the classification of heartbeats with the end-to-end learning besides they can be robust to noise. For the traditional ML methods, they can be simply implemented and are computationally efficient and provide faster training time.
To sum up, we cannot give a decisive recommendation of the best model, based on the analysis made in the “Discussion” section because none of the 40 selected studies applied the exact same feature extraction, pre-processing, or prediction techniques in all the stages. Besides, the input information, the ECG signal information, the development tools, and the computing capacities vary from one study to another. However, when taking into consideration all these variants and the results of the studies’ analysis, we can presume that the usage of DL solely or the usage of ML combined with DL techniques can achieve very promising results.
Footnotes
Appendix 1
Beat annotations by PhysioBank.

| Code | Description |
|---|---|
| N | Normal beat (displayed as “·” by the PhysioBank ATM, LightWAVE, pschart, and psfd) |
| L | Left bundle branch block beat |
| R | Right bundle branch block beat |
| B | Bundle branch block beat (unspecified) |
| A | Atrial premature beat |
| a | Aberrated atrial premature beat |
| J | Nodal (junctional) premature beat |
| S | Supraventricular premature or ectopic beat (atrial or nodal) |
| V | Premature ventricular contraction |
| r | R-on-T premature ventricular contraction |
| F | Fusion of ventricular and normal beat |
| e | Atrial escape beat |
| j | Nodal (junctional) escape beat |
| n | Supraventricular escape beat (atrial or nodal) |
| E | Ventricular escape beat |
| / | Paced beat |
| f | Fusion of paced and normal beat |
| Q | Unclassifiable beat |
| ? | Beat not classified during learning |
Appendix 2
Table of acronyms.

| Acronym | Signification |
|---|---|
| ABC | Artificial bee colony |
| AI | Artificial intelligence |
| AUC | Area under curve |
| CAE | Convolutional auto-encoder |
| CNN | Convolutional neural network |
| DAG | Directed acyclic graph |
| Db | Daubechies |
| DL-CCANet | Dual-lead canonical correlation analysis network |
| DCT | Discrete cosine transform |
| DOST | Discrete orthogonal stockwell transform |
| DST | Discrete sine transform |
| DWT | Discrete wavelet transform |
| FFT | Fast Fourier transform |
| GBM | Génie Bio-médical |
| HOS | Higher-order spectrum |
| ICA | Independent component analysis |
| INCART | St. Petersburg Institute of Cardiological Techniques |
| KICA | Kernel-independent component analysis |
| LDA | Linear discriminant analysis |
| LSTM | Long short-term memory |
| LSTM-WS | Long short-term memory wavelet sequence |
| LS-TSVM | Least-square twin support vector machine |
| MIT-BIH | Massachusetts Institute of Technology-Boston’s Beth Israel Hospital |
| MLP | Multilayer perceptron |
| NN | Neural network |
| PCA | Principal component analysis |
| PCANet | Principal component analysis network |
| RBF | Radial basis function |
| RF | Random forest |
| SD | Standard deviation |
| SV | Supraventricular |
| SVM | Support vector machine |
| TL-CCANet | Triple-lead canonical correlation analysis network |
Funding:
The author(s) received no financial support for the research, authorship, and/or publication of this article.
Declaration Of Conflicting Interests:
The author(s) declared no potential conflicts of interest with respect to the research, authorship, and/or publication of this article.
Author Contributions
BA, MO, and SD contributed to conceptualization, resources, and supervision.